Introduction
Ischemic stroke is a common type of cerebrovascular
disorder, and one of the leading global causes of death and serious
disability (1). The 2022 American
Heart Association report on Heart Disease and Stroke Statistics
reported that the incidence rates of ischemic stroke were as high
as 211/100,000 men and 174/100,000 women (2), resulting in a global annual economic
burden (3). Early recognition and
timely hospital treatments can significantly reduce stroke-related
morbidity and mortality (3).
A number of researchers have reported that
hyperglycemia during acute ischemic stroke is frequently observed
as a result of chronic diabetes or an acute stress response
(4). Acutely elevated levels of
blood glucose in patients are associated with a worse prognosis and
higher mortality (5). It has been
reported that acute hyperglycemia can augment neuroinflammation,
cause greater infarction area and increase the risk of hemorrhagic
transformation (6,7). In light of these findings, the
mechanism underlying how hyperglycemia deteriorates acute ischemic
stroke remains to be investigated.
Microglia act as the immune cells in the central
nervous system and play an essential role in the pathogenesis of
ischemic stroke (8). Recent
research has found that intracellular NOD-like receptors, such as
NOD-like receptor protein 3 (NLRP3), are widely expressed in
microglia (9). The NLRP3
inflammasome, which consists of NLRP3, apoptosis-associated
speck-like protein and pro-caspase-1, has been proven to be
associated with the deterioration of the disease condition
(10). Activation of the NLRP3
inflammasome upregulates the expression of caspase-1 to process
full-length gasdermin D (GSDMD-FL) to GSDMD-N domain (GSDMD-N),
thus causing the release of IL-1β and IL-18 (11). As a result of this inflammatory
response, pyroptosis can occur (12). It has been reported that pyroptosis
in vascular cells plays an important role in vascular
inflammation-induced blood-brain barrier breakdown in
diabetes-associated cognitive decline (13). Tissue plasminogen activator can
promote NLRP3 inflammasome activation after hyperglycemic stroke in
mice (14). However, whether the
elevation of blood glucose deteriorates cerebral injury via
microglial pyroptosis in acute ischemic stroke needs further
exploration.
The present study aimed to explore whether
hyperglycemia promotes microglial pyroptosis via increasing oxygen
extraction rate in an acute ischemic stroke model.
Materials and methods
Animals
The NLRP3 knockout (KO) C57BL/6 mice
(NLRP3−/−; male; age, 6 weeks) were purchased from
GemPharmatech Co., Ltd. The age-matched male wild-type (WT)
littermates were used as controls. The mice were fed standard chow
and water, and were housed under standard experimental conditions
(temperature, 20–25°C; humidity, 50–70%) under a 12-h light/dark
cycle. The weight range of the mice was 18.22–21.56 g, with a
median of 19.34 g. The mice were randomly divided into the
following groups: i) Sham-operated group (Sham); ii)
ischemia-reperfusion (IR) group; iii) IR + normal glucose group (IR
+ NG); iv) IR + high glucose group (IR + HG); v)
NLRP3−/− + IR + HG group; and vi) IR + HG + Z-YVAD-FMK
(a caspase-1 inhibitor) group. The mice in the NLRP3−/−
+ IR + HG group underwent IR and were treated once with a high
level of glucose at a rate of 2.5 g/(kg × h) for 2 h (total dose, 5
g/kg). Mice in the IR + HG + Z-YVAD-FMK group were
intraperitoneally injected with Z-YVAD-FMK at a dose of 12.5 mg/kg
prior to IR. The number of mice in each group was 36. The mice were
allowed free access to standard chow and water, and were housed
under standard experimental conditions in a specific pathogen-free
environment (temperature, 20–25°C; humidity, 50–70%) with a 12-h
light/dark cycle.
The entire experimental course consisted of 2 h of
ischemia and 24 h of reperfusion. Animals were anesthetized with
sodium pentobarbital (30 mg/kg; i.p.) before surgery. The health
and behavior of the mice were examined every half hour. If the mice
showed signs of awakening during the experiment, sodium
pentobarbital (10 mg/kg; i.p.) was supplemented. A total of 22 mice
died during the experiment and the rest were euthanized.
Respiratory and circulatory failure caused by cerebral edema after
cerebral infarction were considered the main cause of death. It has
been reported that the mortality rate of mice with middle cerebral
artery occlusion (MCAO) was 15% (15), which is consistent with the results
(11.96%, 22/184) in the present study.
Euthanasia was performed if mice had difficulty
breathing, or became emaciated or dehydrated due to not eating or
drinking for 24–48 h. Mice were euthanized by injection with
pentobarbital (30 mg/kg; i.p.), followed by cervical dislocation.
Heartbeat and breathing were checked to ensure successful
euthanasia. All animal experimental procedures including accidental
death and euthanasia were approved by The Research Ethics Committee
of Guangdong Provincial People's Hospital (Guangzhou, China;
approval no. GDRECKY2020-046-01) and were performed following the
ARRIVE 2.0 guidelines (16).
MCAO and glucose treatment
Animals were anesthetized with sodium pentobarbital
(30 mg/kg intraperitoneal injection) before surgery. As previously
described, MCAO was used to establish transient focal cerebral
ischemia (15). Briefly, the right
middle cerebral artery was blocked with a nylon suture, which was
inserted into the internal carotid artery and advanced until the
origin of the right middle cerebral artery was closed. After a 2-h
occlusion, the suture was removed for reperfusion. The sham mice
were subjected to a similar operation, except for the occlusion.
During the period of MCAO, high glucose (50% glucose) or normal
glucose (5% glucose) was injected through the caudal vein at a rate
of 5 ml/(kg × h). The blood glucose levels before, and 2 and 24 h
after ischemia were measured using the StatStrip Xpress Glucose
Meter (Nova Biomedical Corporation). In addition, 2,3,5,-triphenyl
tetrazolium chloride monohydrate (TTC) assessment was used to
verify the establishment of the MCAO model. Briefly, brains were
removed and cut into 2-mm-thick slices after sacrifice. The slices
were immersed in 1% TTC for 30 min at 37°C and fixed with 10%
formalin for 6 h at 4°C. Infarcted brain tissue was pale, while
normal brain tissue was red. All mice in the IR group developed
cerebral infarction (100%), while no mice in the Sham group
developed cerebral infarction (0%).
Measurement of partial pressure of
brain tissue oxygen (PbtO2)
The levels of PbtO2 were measured
according to a previously reported procedure (17). Briefly, a midline incision was
performed, a hole was drilled and the dura was punctured. A
microsensor was then inserted into the brain tissue. The
PbtO2 was measured at 1, 3, 6, 12 and 24 h after
reperfusion using a monitor (Integra CAMO2; Integra LifeSciences
Corporation).
Measurement of cerebral oxygen
extraction ratio (CERO2)
The levels of CERO2 were measured as
described previously (17). The
right jugular vein was cannulated upstream to collect venous blood
from the right side of the brain at 1, 3, 6, 12 and 24 h after
reperfusion. Arterial blood samples were also collected from the
femoral artery. The blood gas analysis was performed using a blood
gas/electrolyte analyzer (Model 5700; Werfen, S.A.). Tests included
hemoglobin concentration (Hb), saturation of arterial blood oxygen
(SaO2), saturation of jugular venous blood oxygen,
partial pressure of oxygen (PaO2) and pressure of
jugular venous blood oxygen (PjVO2). The content of
jugular venous blood oxygen (CjVO2), content of arterial
blood oxygen (CaO2) and CERO2 were calculated
using the following formulas:
CaO2=1.36 × Hb × SaO2 + 0.0031
× PaO2
CjVO2=1.36 × Hb × PjVO2 +
0.0031 × PjVO2
CERO2=(CaO2-CjVO2)/CaO2
Neurological tests
The neurological damage to the motor center of the
cerebral cortex after IR was examined by rotarod and foot fault
tests. The rotarod test was used to assess the coordination and
body strength of the mice. The mice were placed on a six-lane
acceleration rotary paddle at a rotation rate of 120 rpm and the
residence time was recorded. The foot fault test was performed to
evaluate limb motor function. Mice were placed on a metal mesh
(area, 3 cm2) for 2 min and the number of missing steps
on the left foreleg was subsequently recorded. Percentage of foot
fault (%)=the number of missing steps/total steps.
Primary microglia isolation and
culture
Primary microglia were obtained from the brain
cortexes of newborn WT or NLRP3−/− mice (male; age, 1–3
days; weight, 2–3 g), as previously described (17). A total of 40 newborn mice were
purchased from GemPharmatech Co., Ltd., and were sacrificed
immediately after purchase. Briefly, the mice were anesthetized
with sodium pentobarbital (30 mg/kg intraperitoneal injection) and
sacrificed by cervical dislocation. Heartbeat and breathing were
checked to ensure successful euthanasia. The cortexes were isolated
from the entire brain under sterile conditions and the meninges
were removed under a dissecting microscope. After which, the
cortexes were cut into pieces as large as 1×1 mm and were digested
with trypsin for 10 min. The cell suspension was placed in a 15-ml
poly-L-lysine-coated flask and cultured in Dulbecco's modified
Eagle's medium (DMEM) supplemented with 10% fetal bovine serum
(FBS) at 37°C and 5% CO2 for 2 weeks. Afterwards, the
mixed glial cells were shaken at 1.33 × g at 37°C for 2 h to obtain
microglia. The collected cells were seeded in 2-ml
poly-L-lysine-coated plates and cultured in DMEM/F12 supplemented
with 10% FBS at 37°C. Primary microglia from WT mice were randomly
divided into groups: i) Control group (CON); ii) oxygen and glucose
deprivation (OGD) group; iii) OGD + NG group (OGD + NG); iv) OGD +
HG group (OGD + HG); and v) OGD + HG + Z-YVAD-FMK (an inhibitor of
caspase-1) group (OGD + HG + Z-YVAD-FMK). The microglia from the
NLRP3−/− + OGD + HG group originated from
NLRP3−/− mice, and were exposed to OGD and high
glucose.
OGD treatment
Microglia in the OGD group were cultured in
glucose-free DMEM and transferred to a hypoxic chamber with 95%
N2/5% CO2/0.1% O2 at 37°C for 6 h.
After 6 h of OGD, the cells were returned to high-glucose DMEM with
10% FBS at 37°C in an incubator with 5% CO2/95% air for
24 h, which was used to reflect IR injury of the ischemic penumbra
in cortical areas in vivo. Cells in the OGD + HG group were
treated with 25 mM glucose at 37°C for 24 h following 6-h OGD.
Meanwhile, the cells in the OGD + HG + Z-YVAD-FMK group were also
treated with 10 µM Z-YVAD-FMK at 37°C for 24 h.
Oxygen consumption rate (OCR)
evaluation of microglial cells
The OCR was evaluated using a cellulate OCR Assay
Kit (cat. no. BB-48211; Bebo Biotechnology), as previously
described (17). Briefly,
microglial cells were seeded in 96-well plates. After 6 h of OGD,
the cells were restored to the supply of glucose and oxygen at 37°C
for 24 h. After which, oxygen fluorescent probes
(BBoxiProbe® R01) and oxygen-mounting media were added
to 96-well plates sequentially. The OCR levels were measured every
3 min using a fluorescence microplate reader (Model 9260; LI-COR
Biosciences).
Western blotting
The brain tissue from the ischemic penumbra in the
cortical area 24 h after ischemia, and primary microglial cells,
were lysed on ice with RIPA lysis buffer (cat. no. BB-3101-100T;
Bebo Biotechnology) containing protease inhibitors. Notably, there
was a region of encephalomalacia following MCAO. The area around
the encephalomalacia region was considered the ischemic penumbra.
The brain tissue close to the surface of the cerebral hemisphere
was extracted from the ischemic penumbra. The BCA protein assay kit
(cat. no. 23227; Pierce; Thermo Fisher Scientific, Inc.) was used
to measure the total protein concentration. After mixing with 4X
loading buffer, the proteins (40 µg per lane) were separated by 10%
SDS-PAGE and transferred onto PVDF membranes. Then, the membranes
were blocked with 5% BSA (cat. no. V900933; Sigma-Aldrich; Merck
KGaA) for 1 h at room temperature, and were incubated overnight at
4°C with primary antibodies against caspase-1 (1:1,000; cat. no.
ab138483; Abcam), GSDMD-FL (1:1,000; cat. no. ab219800; Abcam),
GSDMD-N (1:1,000; cat. no. 10137; Cell Signaling Technology), IL-1β
(1:1,000; cat. no. ab254360; Abcam), IL-18 (1:1,000; cat. no.
ab191860; Abcam) and β-actin (1:1,000; cat. no. ab8226; Abcam). On
the following day, the membranes were incubated with horseradish
peroxidase-conjugated secondary antibodies (1:1,000; cat. no.
7074S; Cell Signaling Technology, Inc.) for 2 h at 4°C. Finally,
the blots were detected by enhanced chemiluminescence
(MilliporeSigma) using an imaging densitometer (ImageQuant LAS 500;
GE Healthcare Bio-Sciences).
Immunofluorescence
A total of 24 h after reperfusion, normal saline and
4% paraformaldehyde were injected transcardially under anesthesia,
and the brain was immediately collected. The collected brain tissue
was fixed with 4% paraformaldehyde for 24 h at 4°C, dehydrated with
gradient sucrose, and cut into 4-µm slices. The sections were
permeabilized with 0.5% Triton X-100 for 30 min at room temperature
and then blocked with and 1% BSA (cat. no. V900933; Sigma-Aldrich;
Merck KGaA) for 30 min at room temperature. Thereafter, the
following appropriate primary antibodies were applied at 4°C
overnight: Iba1 (1:200; cat. no. ab283346; Abcam), caspase-1
(1:200; cat. no. 24232; Cell Signaling Technology), GSDMD-N (1:200;
cat. no. DF13758; Affinity), IL-1β (1:200; cat. no. ab254360;
Abcam) and IL-18 (1:200; cat. no. ab191860; Abcam), followed by
secondary antibody incubation for 1 h at room temperature,
including Alexa Fluor® 488-conjugated goat anti-mouse
IgG (1:200; cat. no. ab150113; Abcam) and Alexa Fluor®
594-conjugated donkey anti-rabbit IgG (1:200; cat. no. ab150080;
Abcam). Finally, the slices were sealed with mounting medium (cat.
no. F6057; MilliporeSigma). The number of cells was decreased in
the area of necrosis under a fluorescence microscope (Olympus DP73
Microscope; Olympus). The peripheries of this area were considered
the ischemic penumbra. The ischemic penumbra close to the surface
of the cerebral hemisphere was observed and imaged. The cells on
coverslips were fixed with 4% paraformaldehyde, and the cells
underwent permeabilization, blocking and antibody incubation as
aforementioned. The average fluorescence (red) density of one
single microglia was analyzed using an image analysis system
(Image-Pro Plus software; version 7.0; Media Cybernetics,
Inc.).
Statistical analyses
Statistical analysis was performed using SPSS
version 22.0 (IBM Corp.). All data are expressed as the mean ±
standard deviation. The experiments were repeated six times in
vivo and four times in vitro. The Shapiro-Wilk test was
performed to determine data distribution, and all data conformed to
a normal distribution. An unpaired Student's t-test was used to
analyze two-group measurement data. A one-way analysis of variance
(ANOVA) was used to analyze the data of four, five or six-group
univariate-factor measurements. Multiple comparisons were analyzed
by Tukey's test following ANOVA. P<0.05 was considered to
indicate a statistically significant difference.
Results
High glucose treatment aggravates
neurological damage after IR
To investigate the effect of blood glucose levels on
neurological function after IR, the blood glucose levels, latency
time to fall and percentage of foot fault were assessed. The
results demonstrated that there was no difference in blood glucose
levels among the Sham, IR, IR + NG, IR + HG and IR + HG +
NLRP3−/− groups at 0 h after ischemia (P>0.05;
Fig. 1A). However, the blood
glucose levels in the IR + HG and IR + HG + NLRP3−/−
groups were significantly increased compared with the Sham, IR and
IR + NG groups (P<0.01), and there was no difference among the
Sham, IR and IR + NG groups, as well as between the IR + HG and IR
+ HG + NLRP3−/− groups at 2 and 24 h after ischemia
(P>0.05; Fig. 1B and C). TTC
staining images showed the cerebral infarction in the IR group. The
incidence of cerebral infarction was 100% in the IR group, while
that of the Sham group was 0% (P<0.01; Fig. 1D); this suggested that the
establishment of the MCAO model was successful. The latency to fall
in the IR and IR + NG groups were decreased compared with in the
Sham group (P<0.01), and it was further decreased in response to
high glucose (P<0.01). However, the latency to fall was
significantly prolonged in the IR + HG + NLRP3−/− group
compared with the IR + HG group (P<0.01; Fig. 1E). The percentage of foot fault in
the IR groups was notably increased compared with in the Sham group
(P<0.01) and it was further increased in response to high
glucose (P<0.05). However, the percentage was significantly
reduced in the IR + HG + NLRP3−/− group compared with
the IR + HG group (P<0.01; Fig.
1F). These results suggested that high glucose can exert an
aggravating effect on neurological damage after IR via activating
the NLRP3 inflammasome.
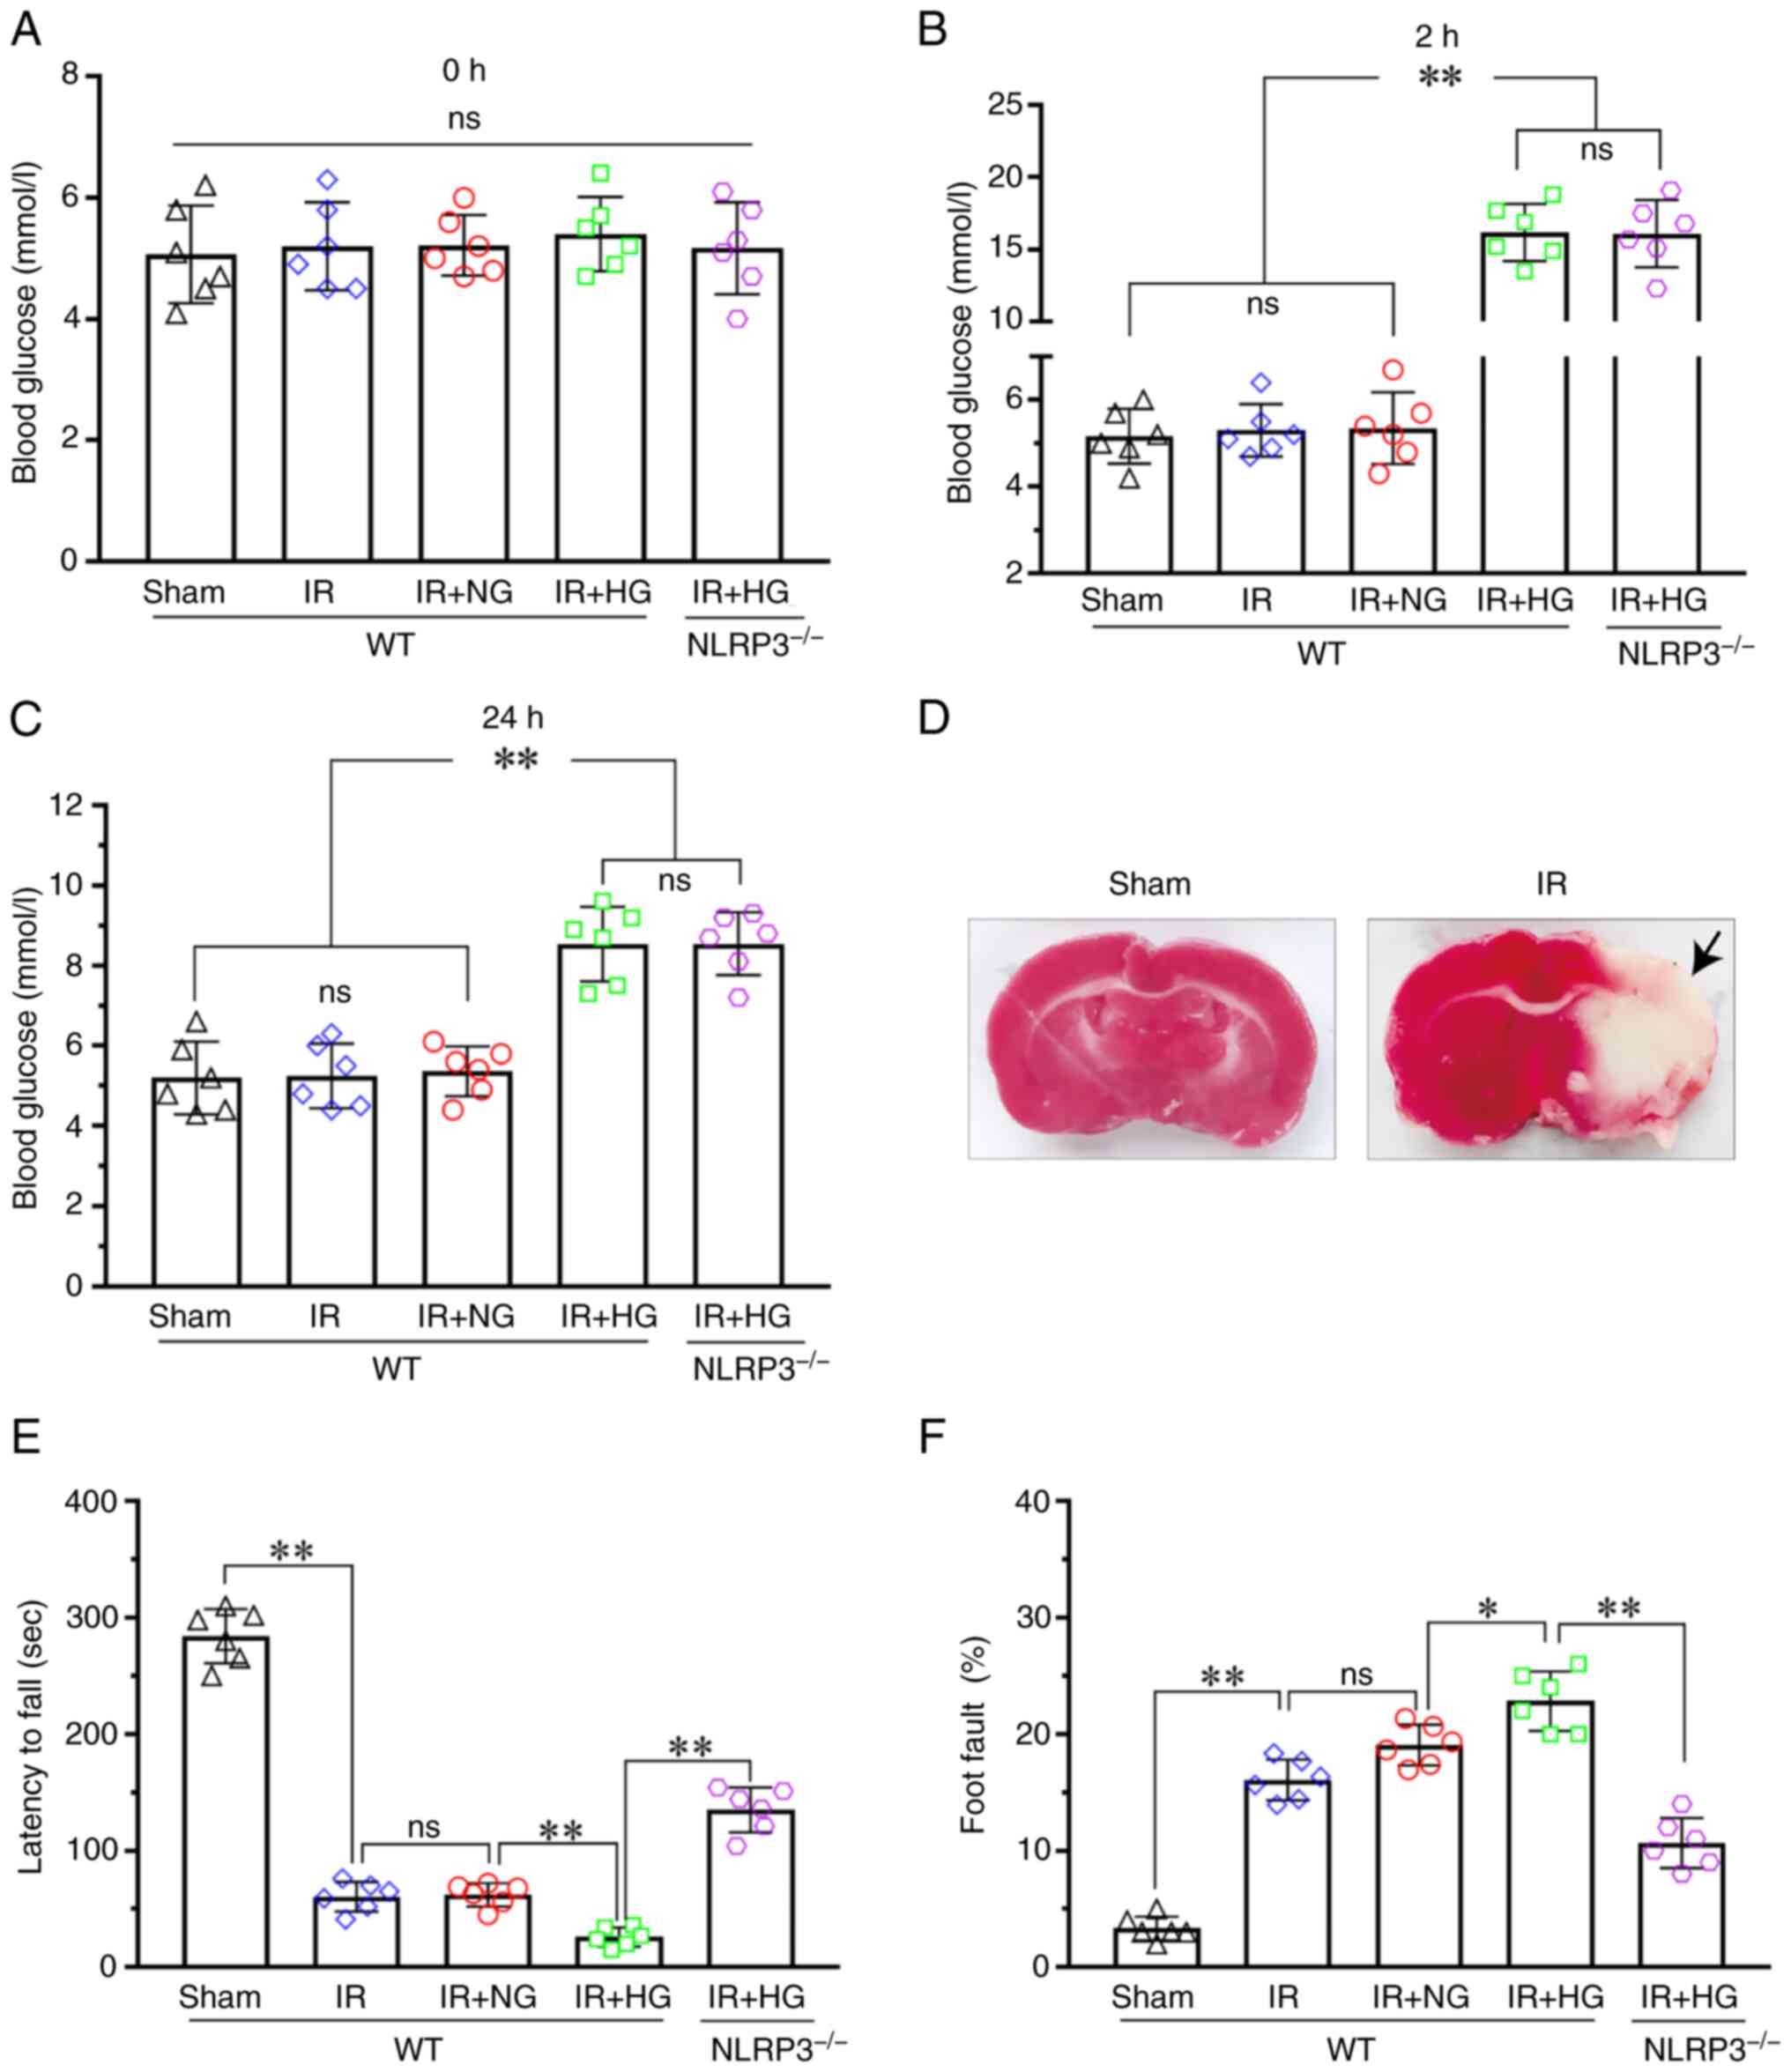 | Figure 1.HG treatment aggravated neurological
damage after IR. (A) Blood glucose levels of the mice at 0 h after
ischemia. (B) Blood glucose levels of the mice at 2 h after
ischemia. (C) Blood glucose levels of the mice at 24 h after
ischemia. (D) TTC staining images showed cerebral infarction (black
arrow) in the IR group. The incidence of cerebral infarction was
100% in the IR group, while in the Sham group it was 0%
(P<0.01). (E) Latency to fall of the Sham, IR, IR + HG, IR + NG
and IR + HG + NLRP3-/- groups. (F) Foot fault of the Sham, IR, IR +
HG, IR + NG and IR + HG + NLRP3-/- groups. Data are presented as
the mean ± standard deviation. *P<0.05; **P<0.01; ns, not
significant. n=6 mice per group. IR, ischemia-reperfusion; NG,
normal glucose; HG, high glucose; NLRP3, NOD-like receptor protein
3. |
High glucose treatment aggravates
hypoxia via increasing oxygen extraction rate
The level of CERO2 in the IR group was
notably increased compared with that in the Sham group (1, 3, 6, 12
and 24 h; P<0.01) and it was further increased in response to
high glucose (1, 3, 6 and 24 h: P<0.01; 12 h: P<0.05;
Fig. 2A). The level of
PbtO2 in the IR group was significantly decreased
compared with that in the Sham group (1, 3, 6, 12 and 24 h;
P<0.01), and the IR + HG group had the lowest PbtO2
level as compared with the IR group and Sham group (1 and 24 h,
P<0.05; 3, 6 and 12 h, P<0.01; Fig. 2B). The level of OCR in the OGD
group was notably increased compared with that in the CON group (5,
15 and 25 min, P<0.05; 10, 20 and 30 min, P<0.01) and it was
further increased in response to high glucose (5, 15, 20 and 25
min, P<0.01; 10 and 30 min, P<0.05; Fig. 2C). These results suggested that
high glucose treatment aggravated hypoxia by increasing the oxygen
extraction rate.
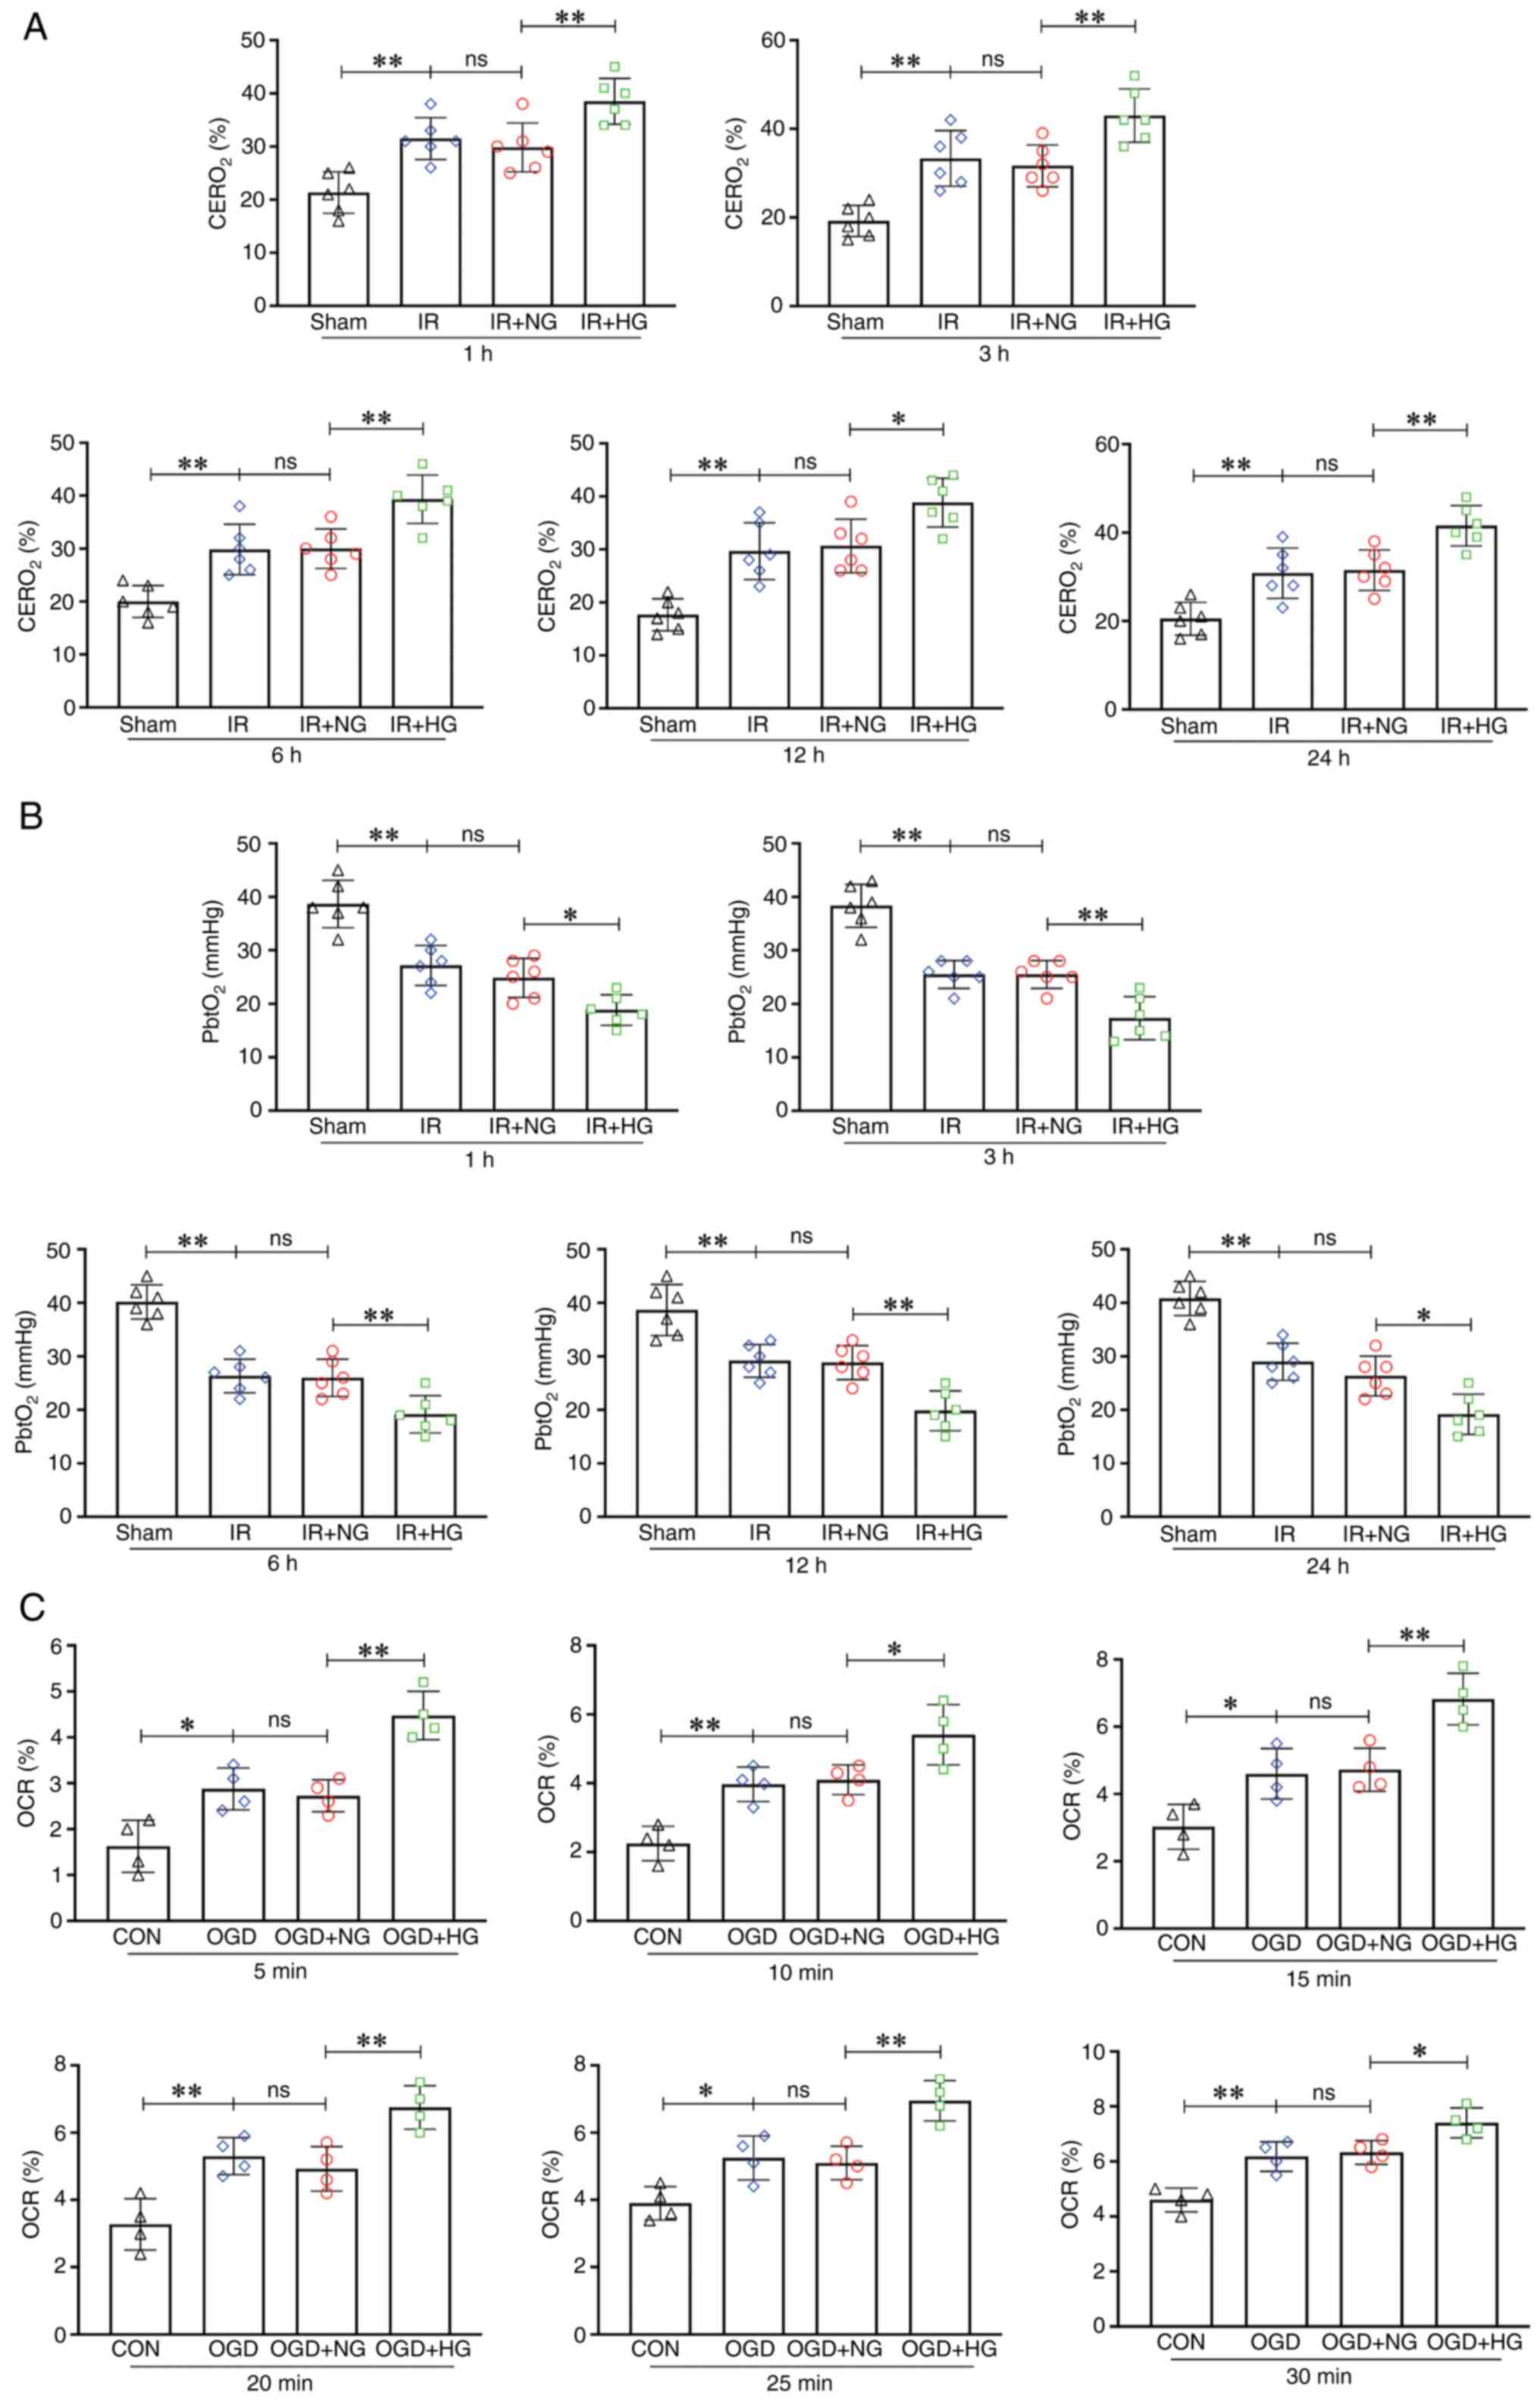 | Figure 2.HG treatment aggravated hypoxia by
increasing the oxygen extraction rate. (A) Levels of
CERO2 in the Sham, IR, IR + HG and IR + NG groups. (B)
Levels of PbtO2 in the Sham, IR, IR + HG and IR + NG
groups. (C) Levels of OCR in the CON, OGD, OGD + HG and OGD + NG
groups. Data are presented as the mean ± standard deviation.
*P<0.05; **P<0.01; ns, not significant. n=4 per group in
vitro, n=6 per group in vivo. IR, ischemia-reperfusion;
OGD, oxygen and glucose deprivation; NG, normal glucose; HG, high
glucose; CERO2, cerebral oxygen extraction ratio;
PbtO2, partial pressure of brain tissue oxygen; OCR,
oxygen consumption rate; CON, control. |
NLRP3 KO inhibits microglial
pyroptosis activation after IR
The level of NLRP3 in the KO group was notably
decreased compared with that in the WT group (P<0.01),
indicating that the NLRP3 KO model was successfully established
(Fig. 3A and B). There was an
increase in the expression of caspase-1 in the WT + IR group
compared with in the WT + Sham group (P<0.01). By contrast, the
expression of caspase-1 in the NLRP3−/− + IR group was
notably decreased compared with in the WT + IR group (P<0.01;
Fig. 3A and C). There was a
decrease in the expression of GSDMD-FL in the WT + IR group
compared with in the WT + Sham group (P<0.01). The expression of
GSDMD-FL in the NLRP3−/− + IR group was notably
increased compared with in the WT + IR group (P<0.05; Fig. 3A and D). There was an increase in
the expression of GSDMD-N in the WT + IR group compared with in the
WT + Sham group (P<0.01). The expression of GSDMD-N in the
NLRP3−/− + IR group was notably decreased compared with
in the WT + IR group (P<0.01; Fig.
3A and E). There was an increase in the expression of IL-1β in
the WT + IR group compared with in the WT + Sham group (P<0.01).
The expression of IL-1β in the NLRP3−/− + IR group was
notably decreased compared with in the WT + IR group (P<0.01;
Fig. 3A and F). There was an
increase in the expression of IL-18 in the WT + IR group compared
with in the WT + Sham group (P<0.01). By contrast, the
expression of IL-18 in the NLRP3−/− + IR group was
notably decreased compared with in the WT + IR group (P<0.01;
Fig. 3A and G). These results
suggested that IR can activate the NLRP3 inflammasome, and NLRP3 KO
may inhibit activation of the NLRP3 inflammasome and the occurrence
of pyroptosis.
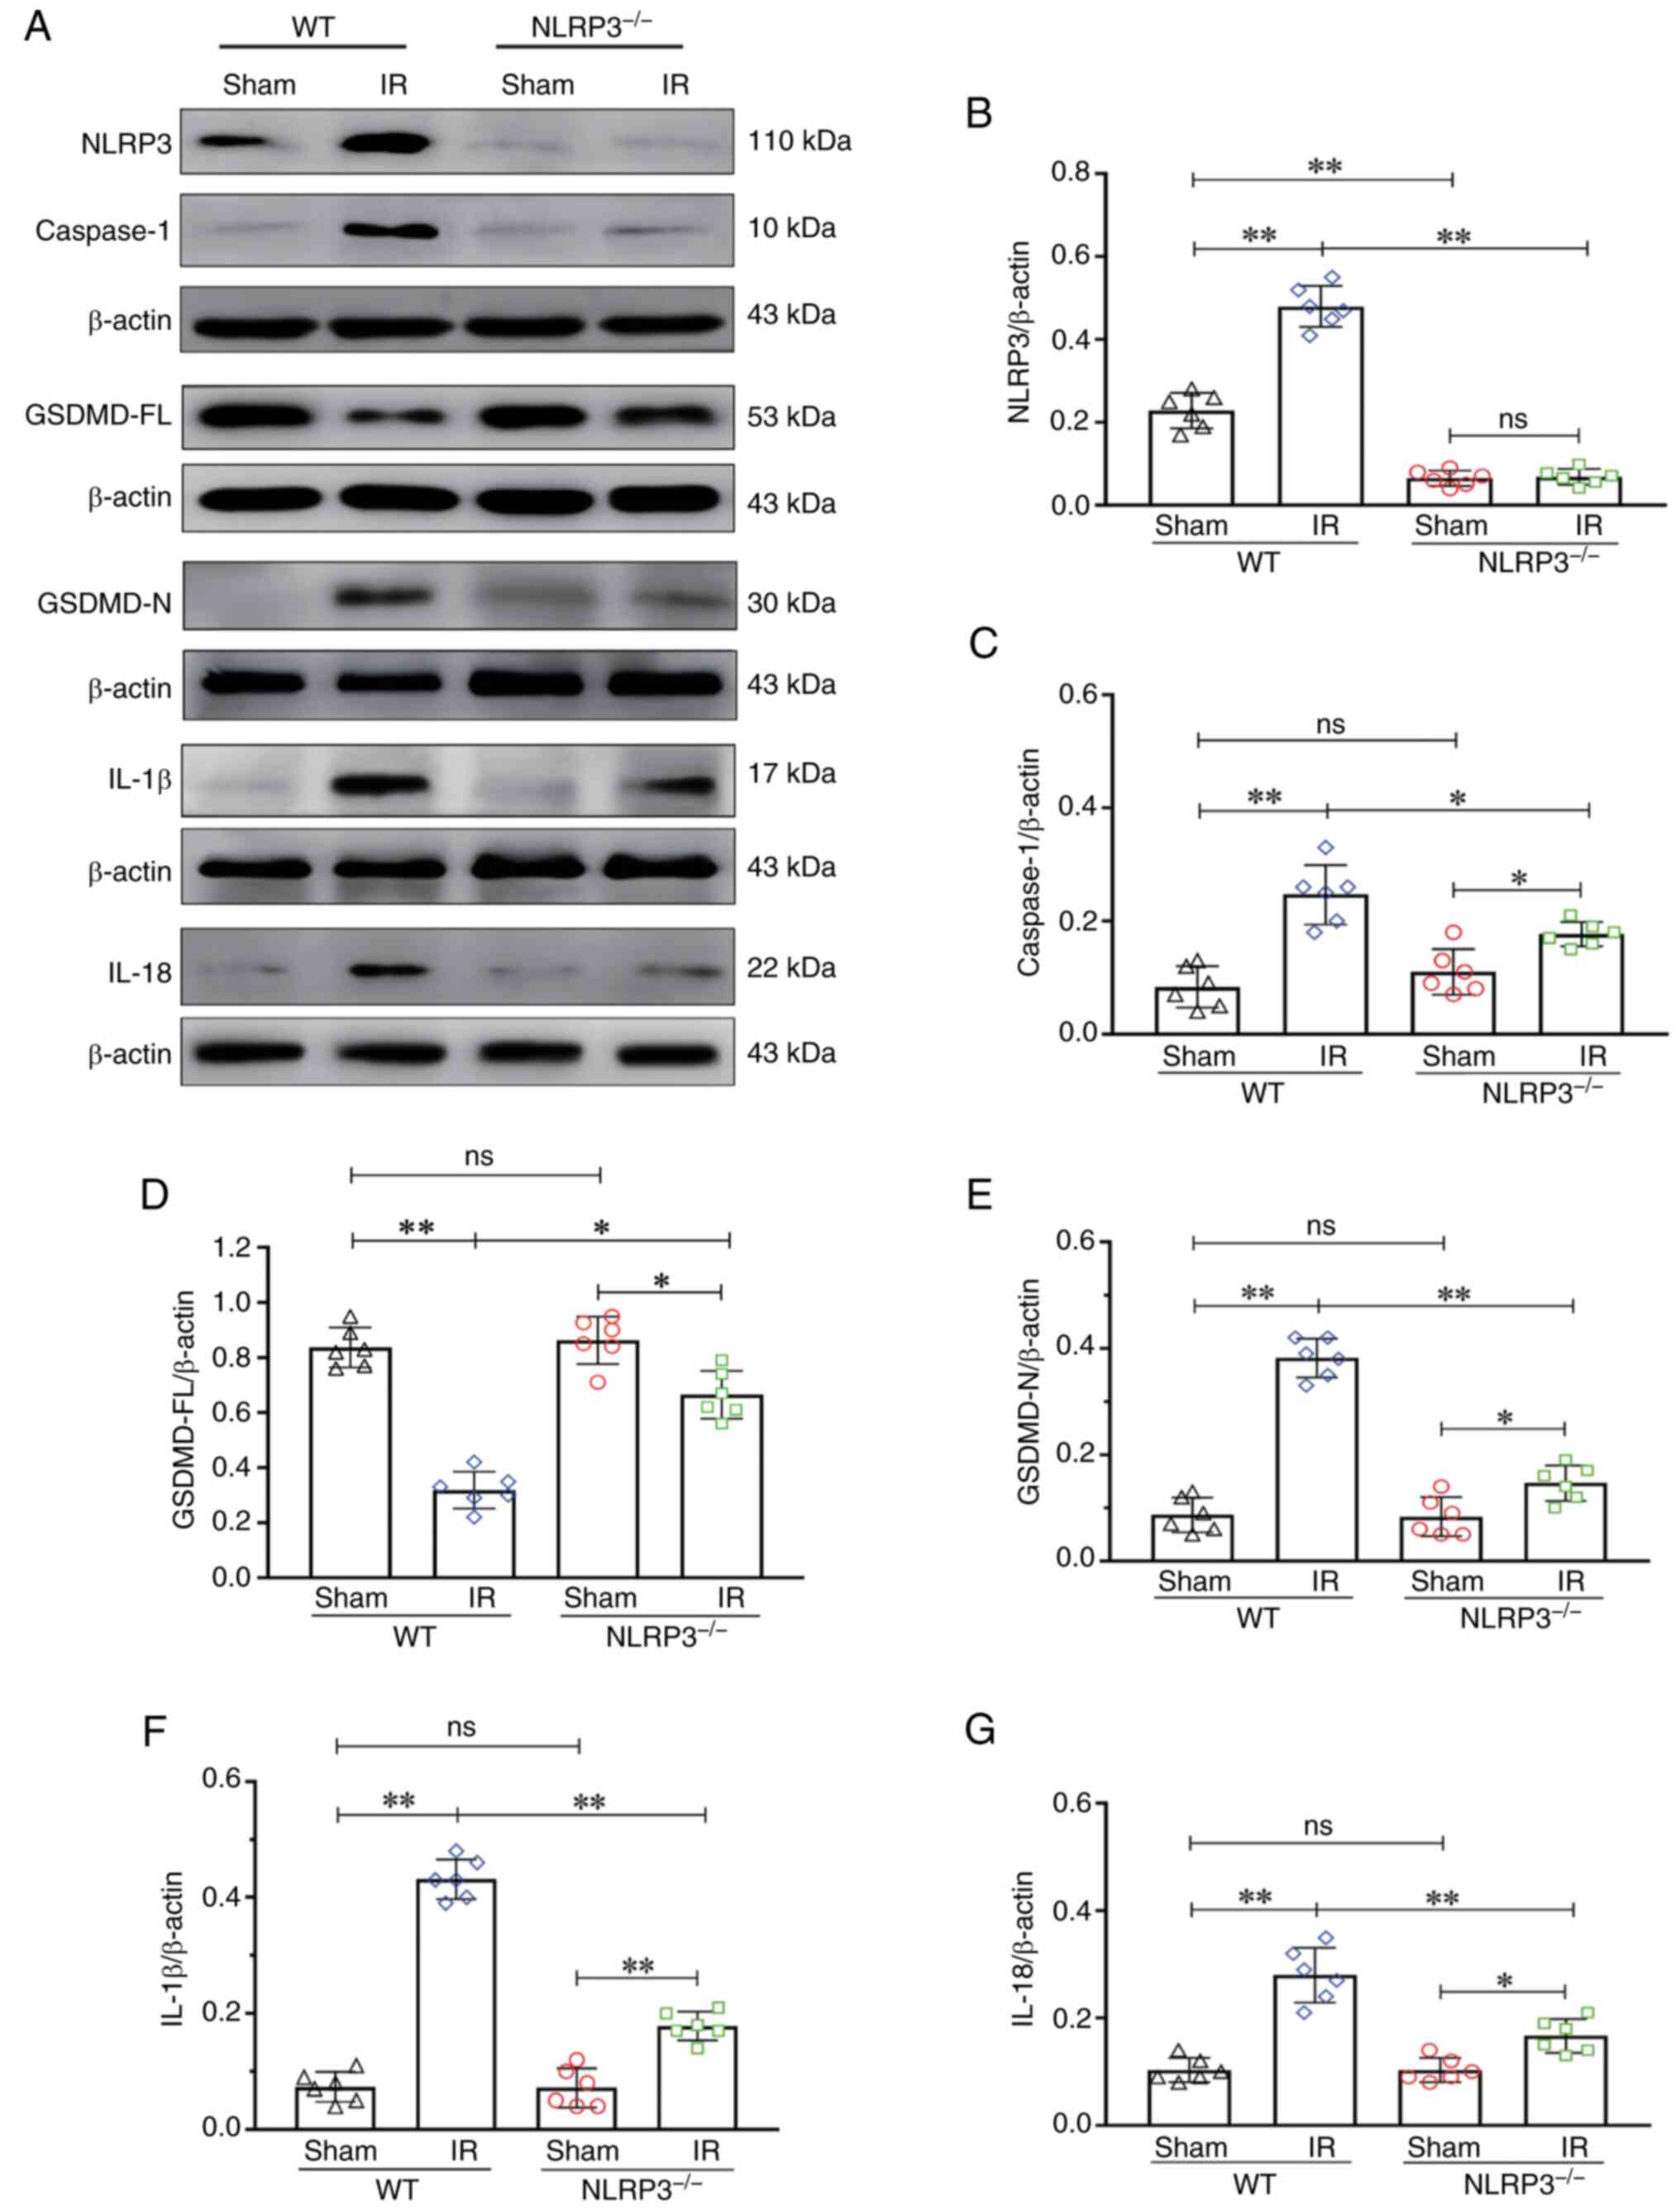 | Figure 3.NLRP3−/− inhibited
microglial pyroptosis activation after IR. (A) Western blot
analysis of NLRP3 (110 kDa), caspase-1 (10 kDa), GSDMD-FL (53 kDa),
GSDMD-N (30 kDa), IL-1β (17 kDa) and IL-18 (22 kDa). (B) NLRP3
expression. (C) Caspase-1 expression. (D) GSDMD-FL expression. (E)
GSDMD-N expression. (F) IL-1β expression. (G) IL-18 expression.
Data are presented as the mean ± standard deviation. *P<0.05;
**P<0.01; ns, not significant. n=6 mice per group. IR,
ischemia-reperfusion; NLRP3, NOD-like receptor protein 3; GSDMD-FL,
full-length gasdermin D; GSDMD-N, gasdermin D-N domain;
NLRP3−/−; NLRP3 knockout; WT, wild-type. |
NLRP3 KO inhibits high glucose-induced
exacerbation of pyroptosis after IR
The expression levels of caspase-1, GSDMD-FL,
GSDMD-N, IL-1β and IL-18 after high glucose treatment were
analyzed. The results of western blotting revealed an increase in
the expression of caspase-1 in the IR and IR + NG groups compared
with in the Sham group (P<0.05); it was further increased in
response to high glucose, whereas a decrease in the expression of
caspase-1 was detected in the IR + HG + NLRP3−/− group
compared with in the IR + HG group (P<0.01; Fig. 4A and B). The expression of GSDMD-FL
in the IR and IR + NG groups was notably decreased compared with in
the Sham group (P<0.05), which was further decreased in response
to high glucose (P<0.01), but was increased in the IR + HG +
NLRP3−/− group compared with the IR + HG group
(P<0.01; Fig. 4A and C). The
results revealed an increase in the expression of GSDMD-N in the IR
and IR + NG groups compared with in the Sham group (P<0.05),
which was further increased in response to high glucose
(P<0.01), but decreased in the IR + HG + NLRP3−/−
group compared with the IR + HG group (P<0.01; Fig. 4A and D). Furthermore, the results
revealed an increase in the expression of IL-1β in the IR and IR +
NG groups compared with in the Sham group (P<0.05); it was
further increased in response to high glucose (P<0.01), but a
decrease in the expression of IL-1β was detected in the IR + HG +
NLRP3−/− group compared with in the IR + HG group
(P<0.01; Fig. 4A and E). The
results revealed an increase in the expression of IL-18 in the IR
and IR + NG groups compared with in the Sham group (P<0.05),
which was further increased in response to high glucose
(P<0.01), and a decrease in the expression of IL-18 was observed
in the IR + HG + NLRP3−/− group compared with in the IR
+ HG group (P<0.01; Fig. 4A and
F).
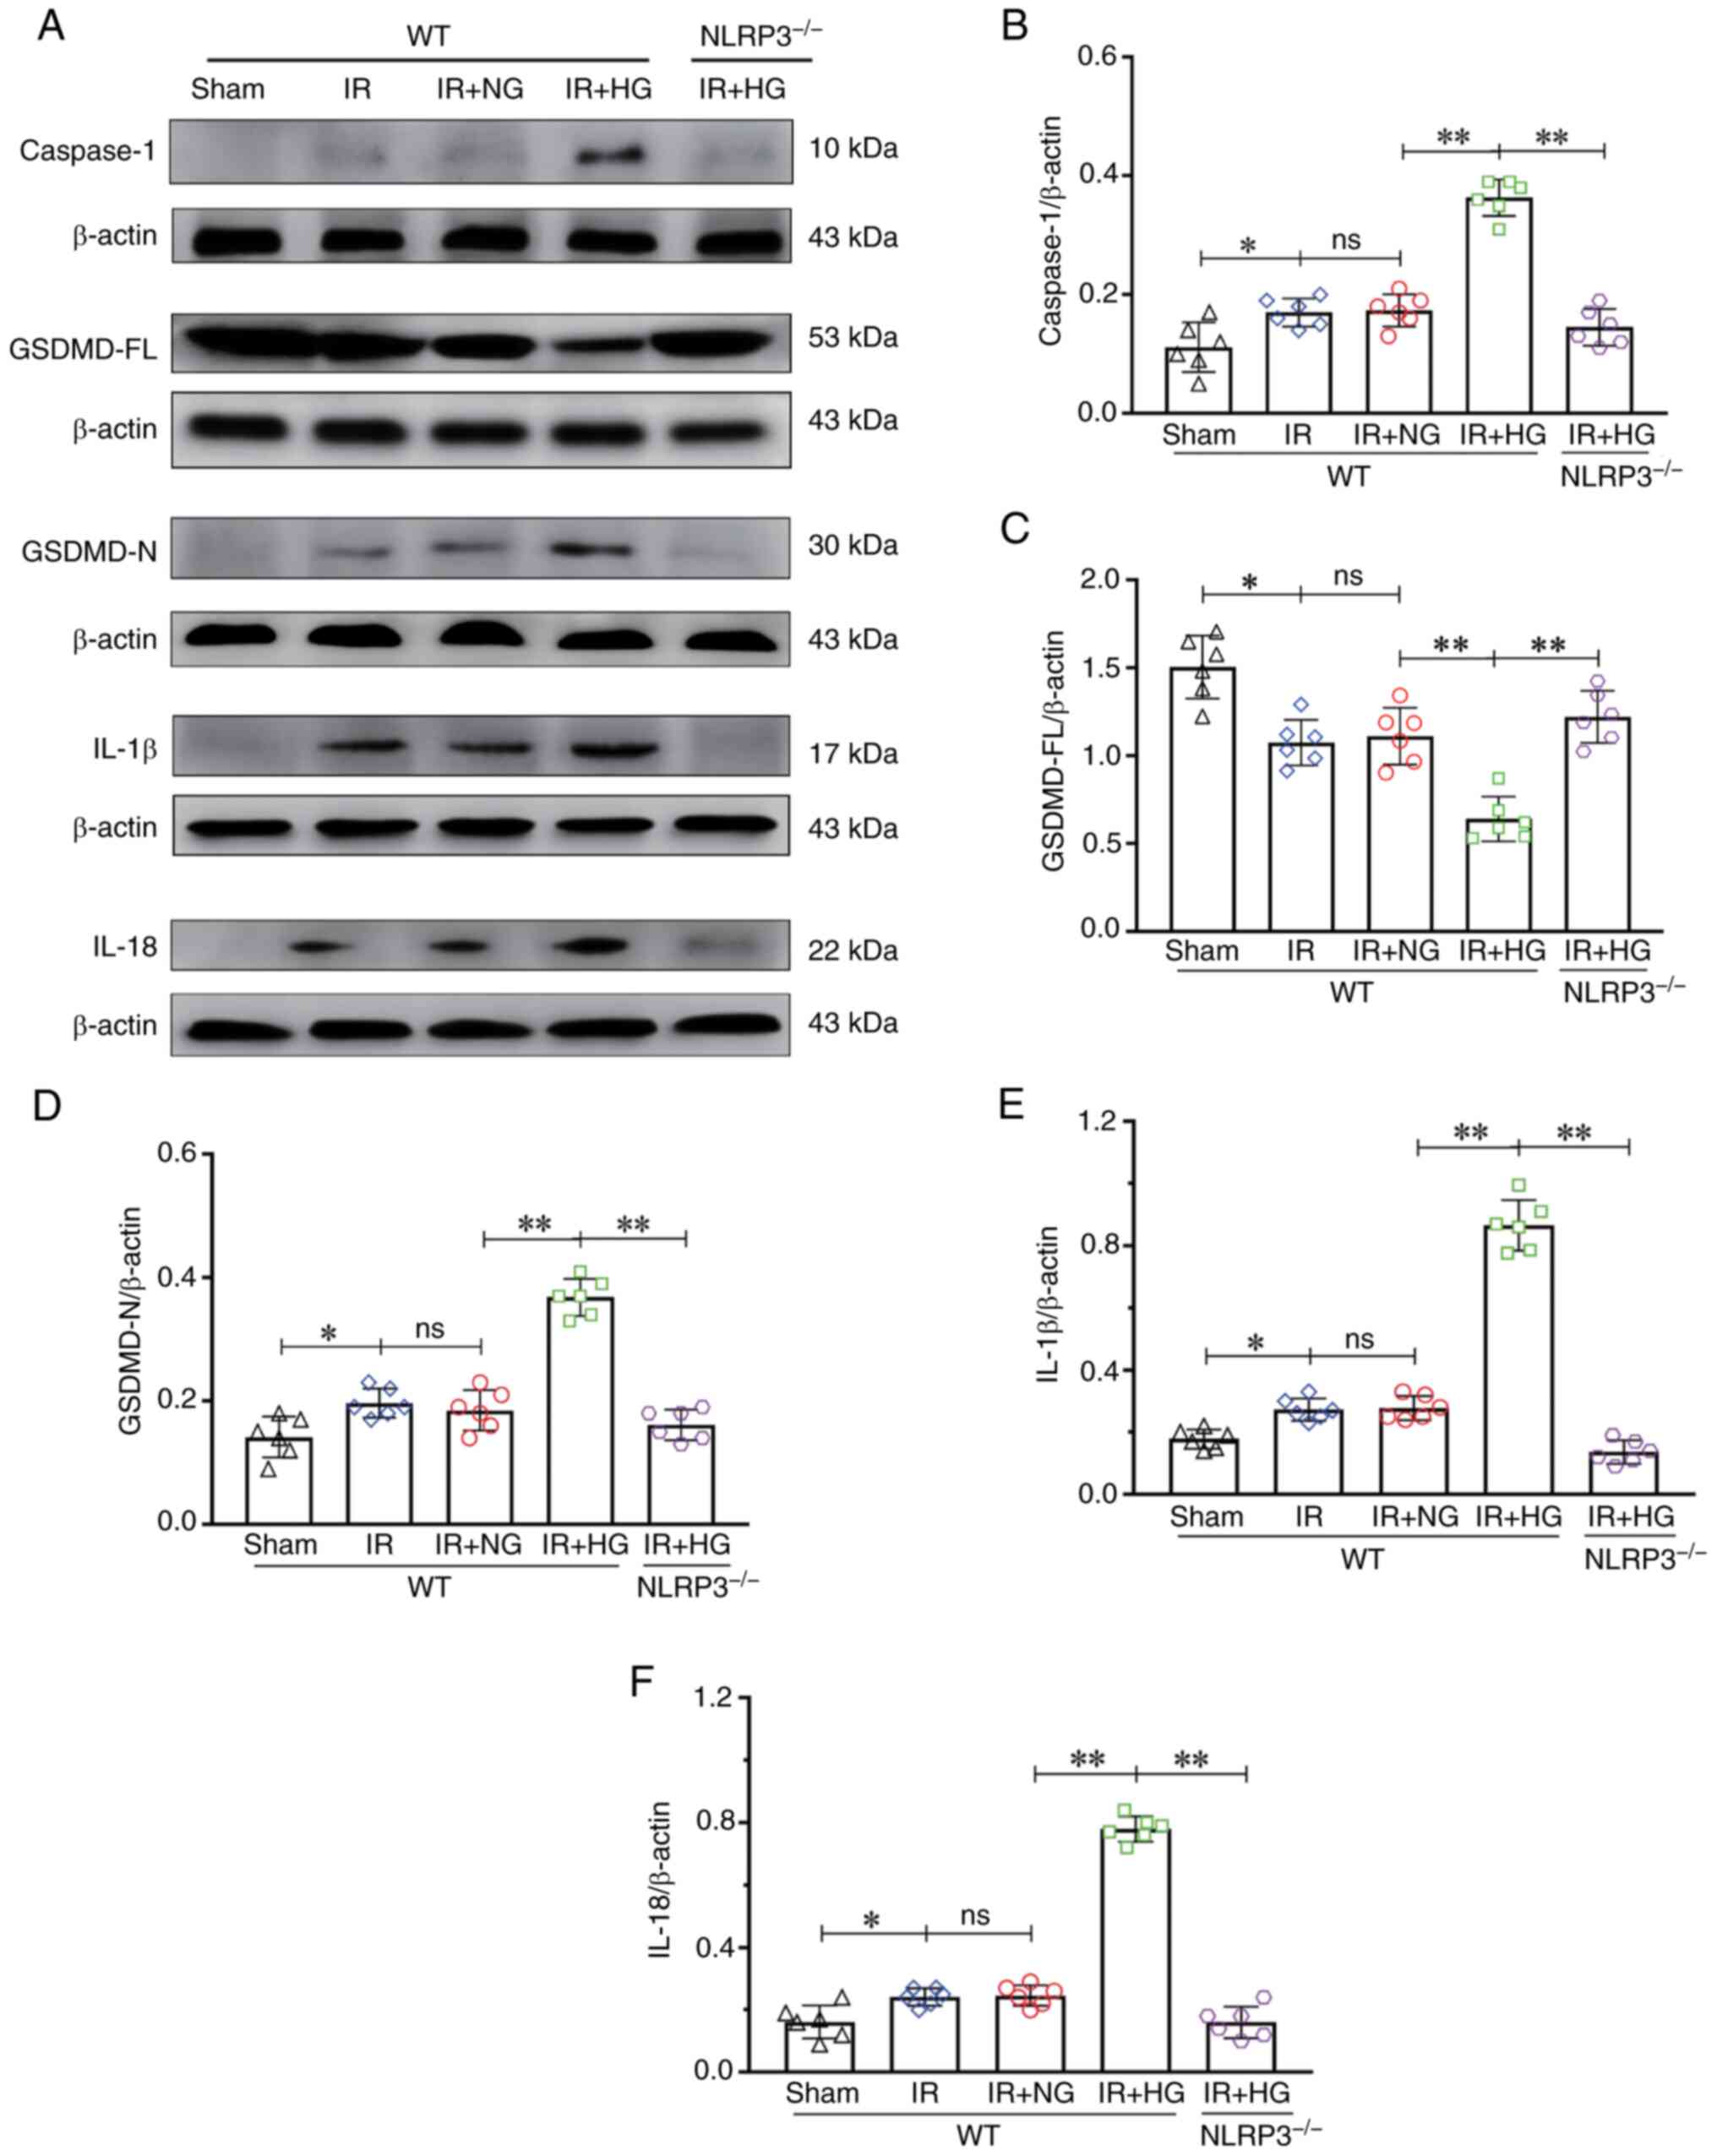 | Figure 4.NLRP3−/− inhibited
HG-induced exacerbation of pyroptosis after IR in vivo. (A)
Western blot analysis of Caspase-1 (10 kDa), GSDMD-FL (53 kDa),
GSDMD-N (30 kDa), IL-1β (17 kDa) and IL-18 (22 kDa). (B) Caspase-1
expression. (C) GSDMD-FL expression. (D) GSDMD-N expression. (E)
IL-1β expression. (F) IL-18 expression. Data are presented as the
mean ± standard deviation. *P<0.05; **P<0.01; ns, not
significant. n=6 mice per group. IR, ischemia-reperfusion; NG,
normal glucose; HG, high glucose; NLRP3, NOD-like receptor protein
3; GSDMD-FL, full-length gasdermin D; GSDMD-N, gasdermin D-N
domain; NLRP3−/−; NLRP3 knockout; WT, wild-type. |
To verify the effect of high glucose on microglial
pyroptosis after IR in vivo, the expression levels of
caspase-1, GSDMD-N, IL-1β and IL-18 in microglia was detected by
double immunofluorescence. It was revealed that IR enhanced the
expression of caspase-1 in cerebral microglial cells compared with
in the Sham group, and this increase was substantially enhanced in
the IR group treated with high glucose; however, the expression of
caspase-1 was notably reduced after NLRP3 KO (P<0.01; Fig. 5A and E). IR also enhanced the
expression of GSDMD-N in cerebral microglial cells compared with in
the Sham group, and this increase was substantially enhanced in the
IR group treated with high glucose; however, the expression of
GSDMD-N was notably reduced after NLRP3 KO (P<0.01; Fig. 5B and F). IR enhanced the expression
of IL-1β in cerebral microglial cells compared with in the Sham
group, and this increase was substantially enhanced in the IR group
treated with high glucose; however, the expression of IL-1β was
notably reduced after NLRP3 KO (P<0.01; Fig. 5C and G). In addition, IR enhanced
the expression of IL-18 in cerebral microglial cells compared with
in the Sham group, and this increase was substantially enhanced in
the IR group treated with high glucose; however, the expression of
IL-18 was notably reduced after NLRP3 KO (P<0.01; Fig. 5D and H). These results suggested
that NLRP3 KO inhibited high glucose-induced exacerbation of
pyroptosis after IR.
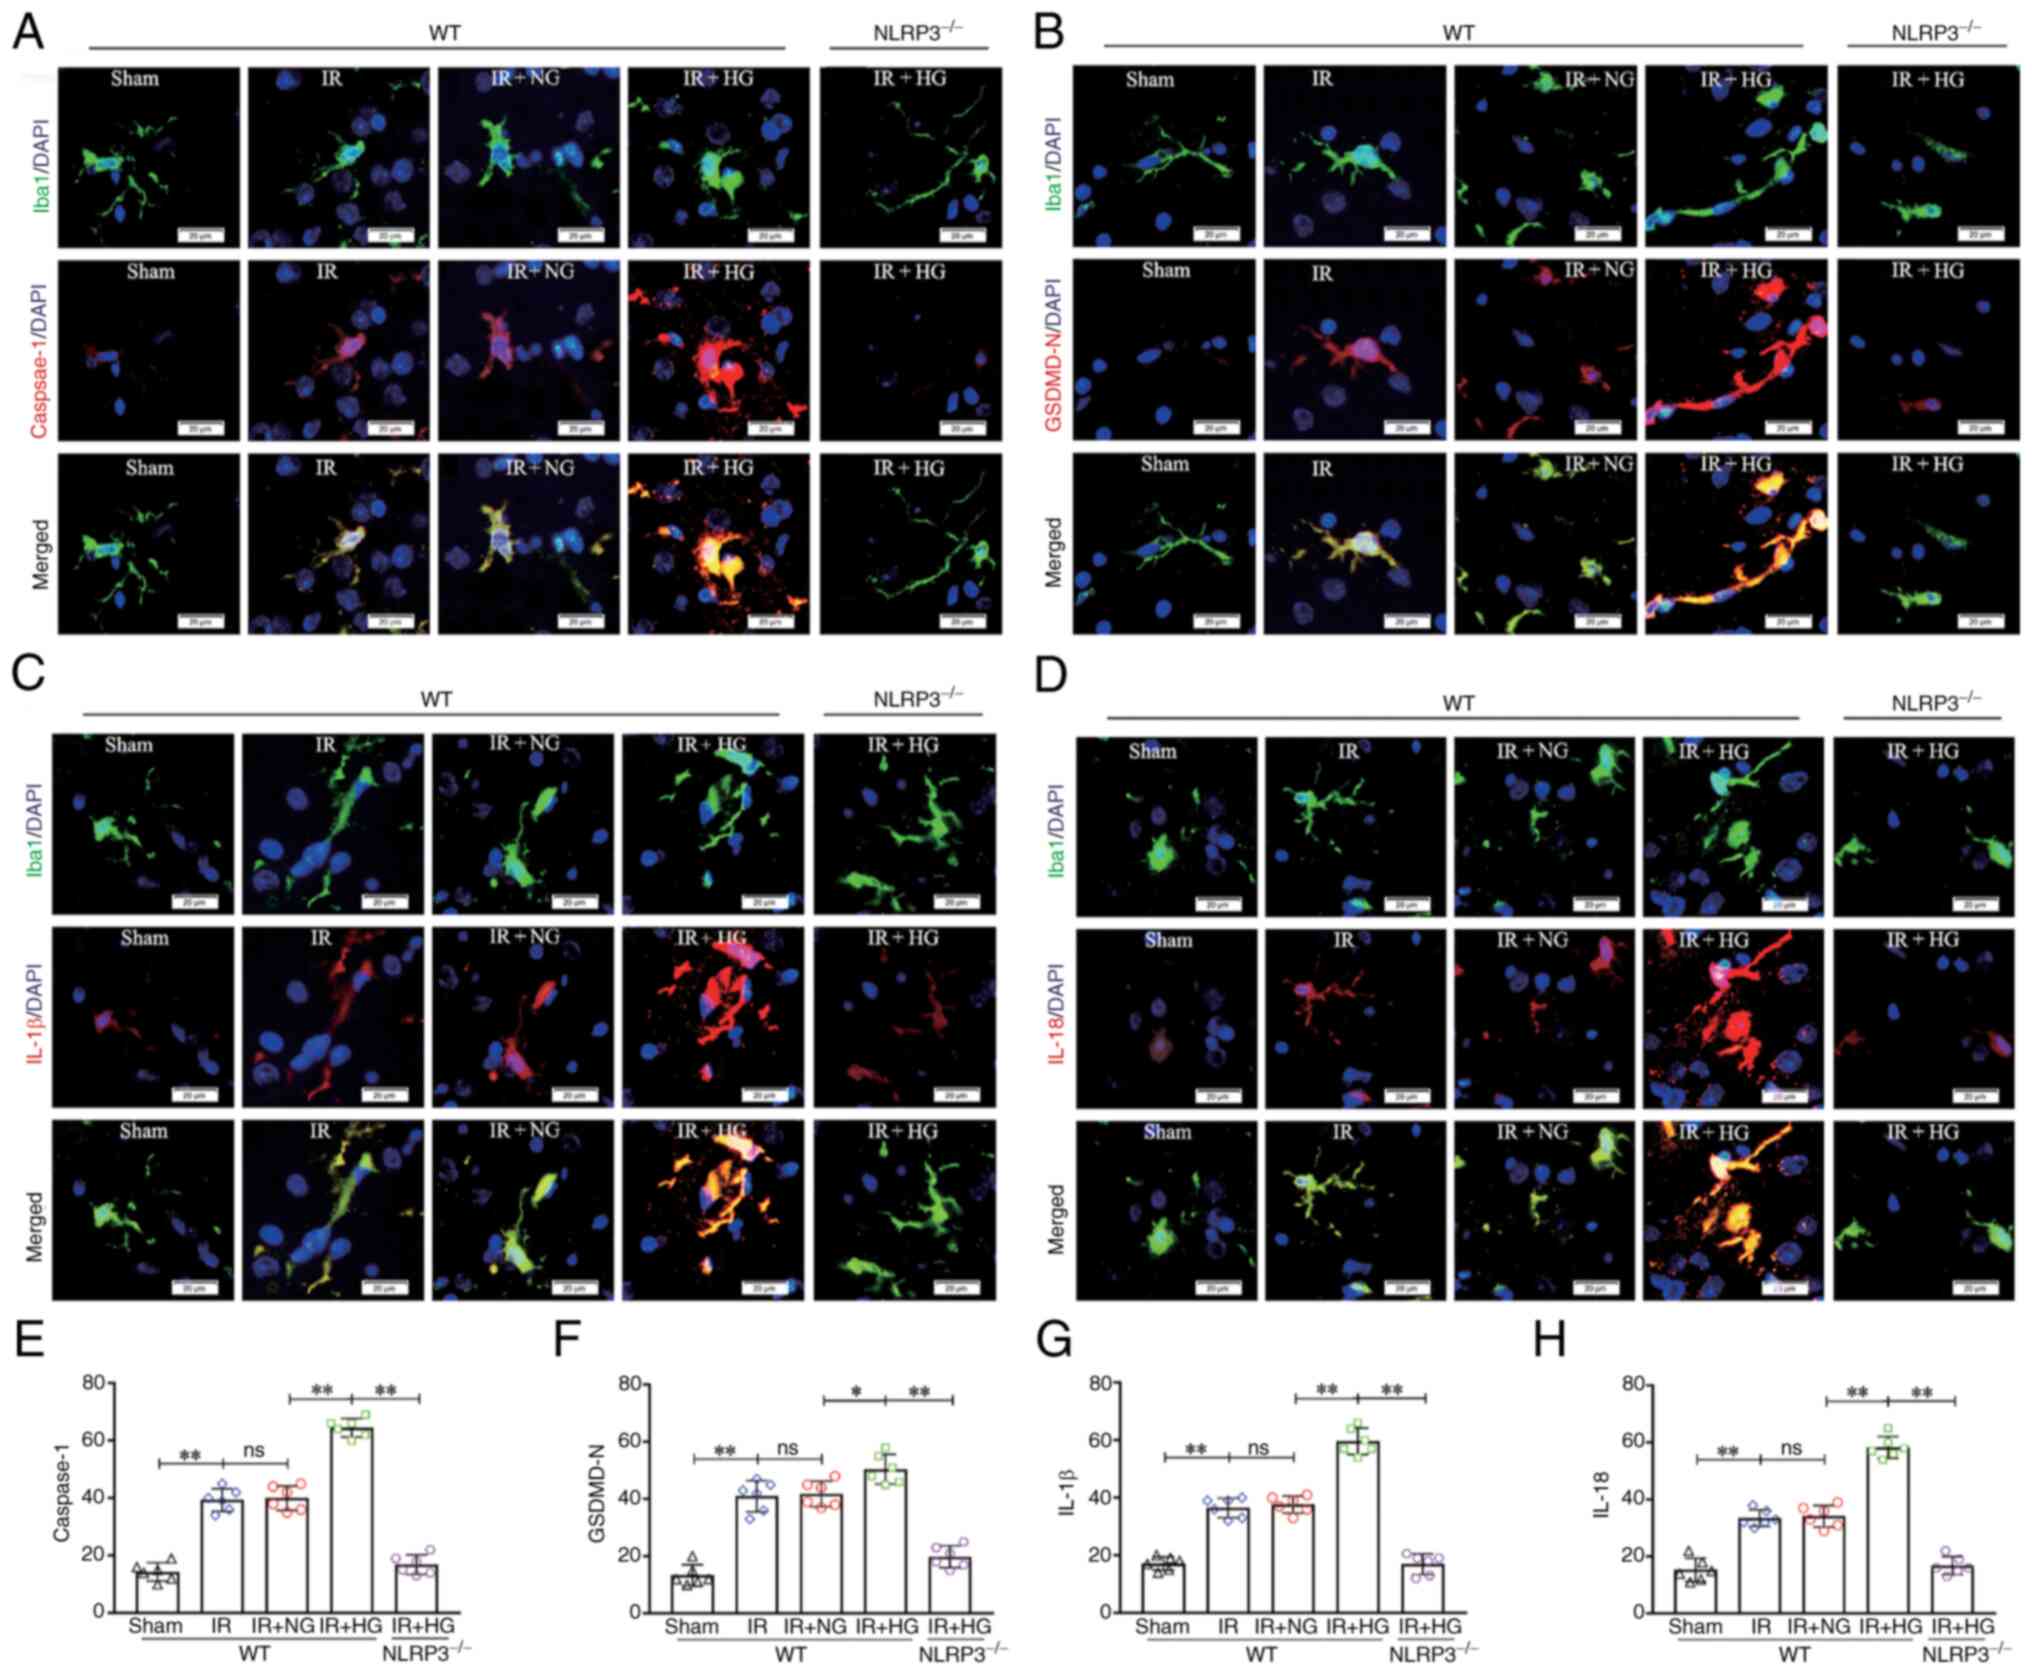 | Figure 5.NLRP3−/− inhibited
HG-induced exacerbation of microglial pyroptosis after IR in
vivo. (A) Immunofluorescence images showing the expression of
Iba1+ microglial cells (green), Caspase-1 (red), and the
co-localization of Caspase-1 and microglial cells. (B)
Immunofluorescence images showing the expression of Iba1+
microglial cells (green), GSDMD-N (red), and the co-localization of
GSDMD-N and microglial cells. (C) Immunofluorescence images showing
the expression of Iba1+ microglial cells (green), IL-1β (red), and
the co-localization of IL-1β and microglial cells. (D)
Immunofluorescence images showing the expression of Iba1+
microglial cells (green), IL-18 (red), and the co-localization of
IL-18 and microglial cells. Scale bars (a-i): 20 µm. (E) The
fluorescence density of Caspase-1. (F) The fluorescence density of
GSDMD-N. (G) The fluorescence density of IL-1β. (H) The
fluorescence density of IL-18. Data are presented as the mean ±
standard deviation. *P<0.05; **P<0.01; ns, not significant.
n=6 mice per group. IR, ischemia-reperfusion; NG, normal glucose;
HG, high glucose; NLRP3, NOD-like receptor protein 3; GSDMD-N,
gasdermin D-N domain; NLRP3−/−; NLRP3 knockout; WT,
wild-type. |
NLRP3 KO or inhibition of caspase-1
reverses high glucose-induced exacerbation of pyroptosis after
OGD/IR
To evaluate the effect of Z-YVAD-FMK (a caspase-1
inhibitor) on high glucose-induced pyroptosis in vivo, the
expression levels of caspase-1 were analyzed. The results of
western blotting revealed that the expression of caspase-1 was
markedly reduced after treatment with Z-YVAD-FMK (P<0.01;
Fig. 6A and B). To verify the
effect of NLRP3 KO and inhibition of caspase-1 on pyroptosis after
OGD in vitro, the expression levels of caspase-1, GSDMD-FL,
GSDMD-N, IL-1β and IL-18 were analyzed after treatment with high
glucose. The results of western blotting revealed an increase in
the expression of caspase-1 in the OGD and OGD + NG groups compared
with in the CON group (P<0.01), which was further increased in
response to high glucose (P<0.01), and a decrease in the
expression of caspase-1 was detected in the OGD + HG +
NLRP3−/− group and the OGD + HG + Z-YVAD-FMK group
compared with in the OGD + HG group (P<0.01; Fig. 6C and D). The expression of GSDMD-FL
in the OGD and OGD + NG groups was notably decreased compared with
in the CON group (P<0.01), which was further decreased in
response to high glucose (P<0.05), and an increase in the
expression of GSDMD-FL was detected in the OGD + HG + Z-YVAD-FMK
group compared with the OGD + HG group (P<0.01; Fig. 6E and G). The results also revealed
an increase in the expression of GSDMD-N in the OGD and OGD + NG
groups compared with in the CON group (P<0.05); it was further
increased in response to high glucose (P<0.01), and a decrease
in the expression of GSDMD-N was observed in the OGD + HG +
Z-YVAD-FMK group compared with in the OGD + HG group (P<0.01;
Fig. 6F and G). The results
revealed an increase in the expression of IL-1β in the OGD and OGD
+ NG groups compared with in the CON group (P<0.01), which was
further increased in response to high glucose (P<0.01), and a
decrease in the expression of IL-1β was detected in the OGD + HG +
Z-YVAD-FMK group compared with in the OGD + HG group (P<0.01;
Fig. 6G and H). Furthermore, the
results revealed an increase in the expression of IL-18 in the OGD
and OGD + NG groups compared with in the CON group (P<0.01),
which was further increased in response to high glucose
(P<0.01), and a decrease in the expression of IL-18 was detected
in the OGD + HG + Z-YVAD-FMK group compared with in the OGD + HG
group (P<0.01; Fig. 6G and I).
These results suggested that NLRP3 KO or inhibition of caspase-1
reversed high glucose-induced exacerbation of pyroptosis after
OGD/IR.
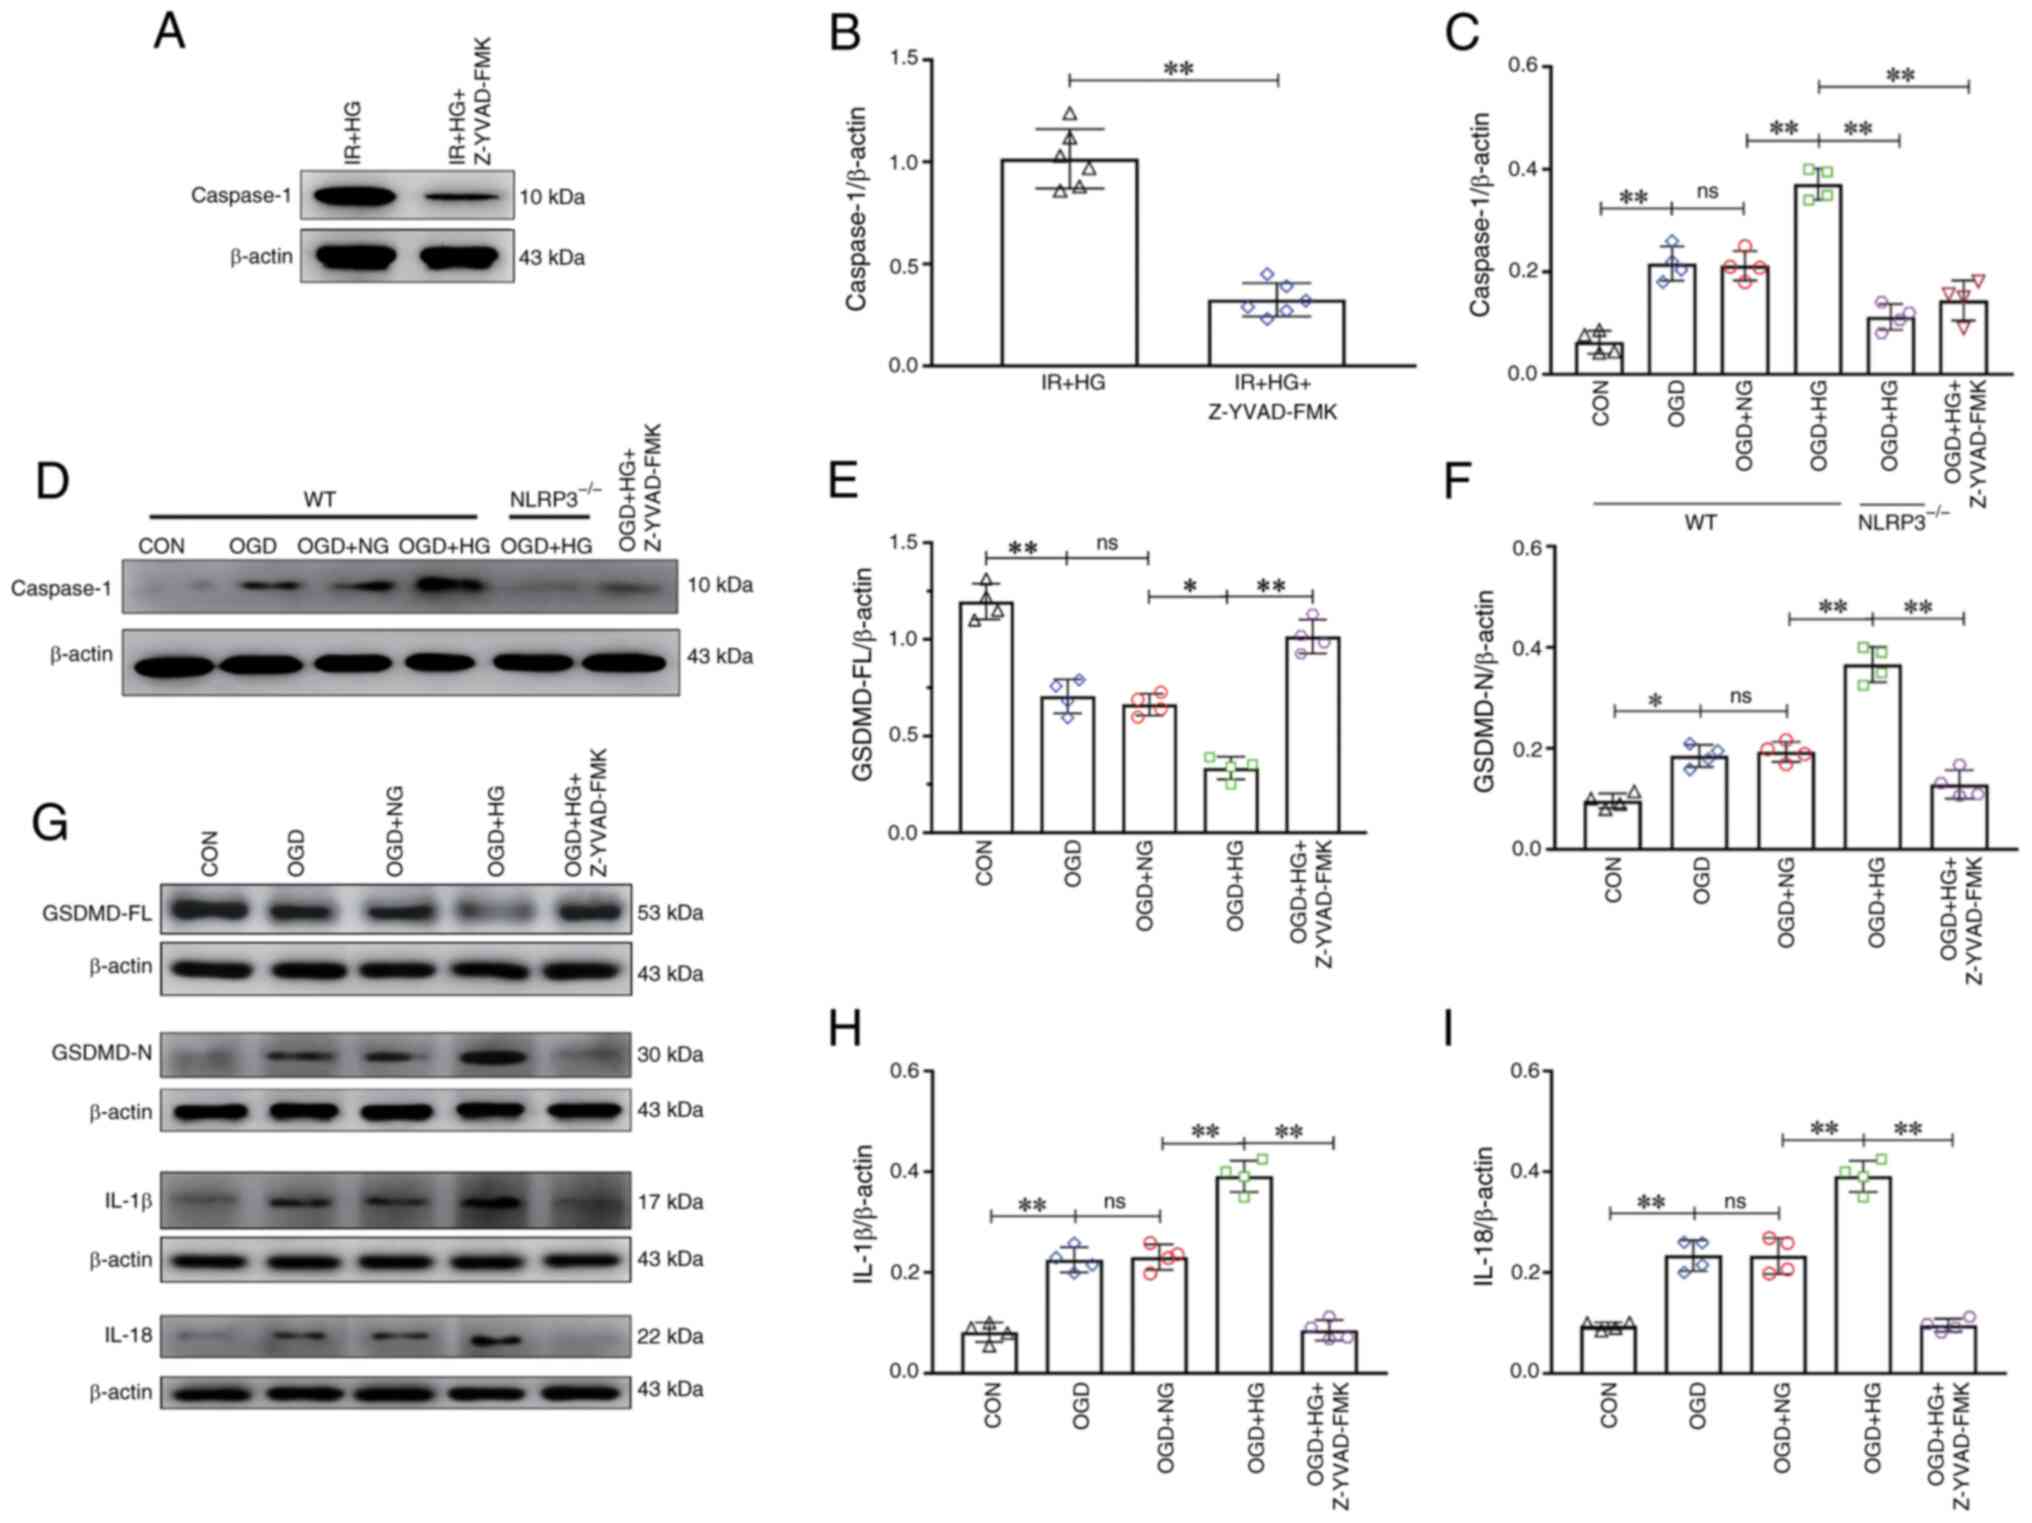 | Figure 6.NLRP3−/− and inhibition of
Caspase-1 reversed HG-induced exacerbation of pyroptosis after
OGD/IR. (A) Western blot analysis of Caspase-1 (10 kDa) in
vivo. (B) Caspase-1 expression levels in vivo. (C)
Caspase-1 expression levels in vitro. (D) Western blot
analysis of Caspase-1 (10 kDa) in vitro. (E) GSDMD-FL
expression. (F) GSDMD-N expression. (G) Western blot analysis of
GSDMD-FL (53 kDa), GSDMD-N (30 kDa), IL-1β (17 kDa) and IL-18 (22
kDa). (H) IL-1β expression. (I) IL-18 expression. Data are
presented as the mean ± standard deviation. *P<0.05;
**P<0.01; ns, not significant. n=4 per group in vitro,
n=6 per group in vivo. IR, ischemia-reperfusion; OGD, oxygen
and glucose deprivation; NG, normal glucose; HG, high glucose;
NLRP3, NOD-like receptor protein 3; GSDMD-FL, full-length gasdermin
D; GSDMD-N, gasdermin D-N domain; NLRP3−/−; NLRP3
knockout; WT, wild-type; CON, control. |
NLRP3 KO or inhibition of caspase-1
reverses high glucose-induced microglial pyroptosis after OGD
To evaluate the effect of NLRP3 KO and inhibition of
caspase-1 on high glucose-induced microglial pyroptosis after OGD
in vitro, double immunofluorescence was used to examine
caspase-1 expression in microglial cells. Enhanced caspase-1
immunofluorescence was observed in the OGD group compared with that
in the CON group, and this increase was notably enhanced in the OGD
group treated with high glucose; however, the expression of
caspase-1 was substantially reduced in the OGD + HG + Z-YVAD-FMK
group and the OGD + HG + NLRP3−/− group (P<0.01;
Fig. 7A and E). To verify the
effect of inhibition of caspase-1 on microglial pyroptosis after
OGD in vitro, double immunofluorescence was used to examine
GSDMD-N, IL-1β and IL-18 expression in microglial cells. Enhanced
GSDMD-N immunofluorescence was observed in the OGD group compared
with that in the CON group, and this increase was notably enhanced
in the OGD group treated with high glucose; however, the expression
of GSDMD-N was notably reduced in the OGD + HG + Z-YVAD-FMK group
(P<0.01; Fig. 7B and F).
Enhanced IL-1β immunofluorescence was observed in the OGD group
compared with that in the CON group, and this increase was notably
enhanced in the OGD group treated with high glucose; however, the
expression of IL-1β was notably reduced in the OGD + HG +
Z-YVAD-FMK group (P<0.01; Fig. 7C
and G). Furthermore, enhanced IL-18 immunofluorescence was
observed in the OGD group compared with that in the CON group, and
this increase was notably enhanced in the OGD group treated with
high glucose; however, the expression of IL-18 was notably reduced
in the OGD + HG + Z-YVAD-FMK group (P<0.01; Fig. 7D and H). These results suggested
that NLRP3 KO or inhibition of caspase-1 reversed high
glucose-induced microglial pyroptosis after OGD.
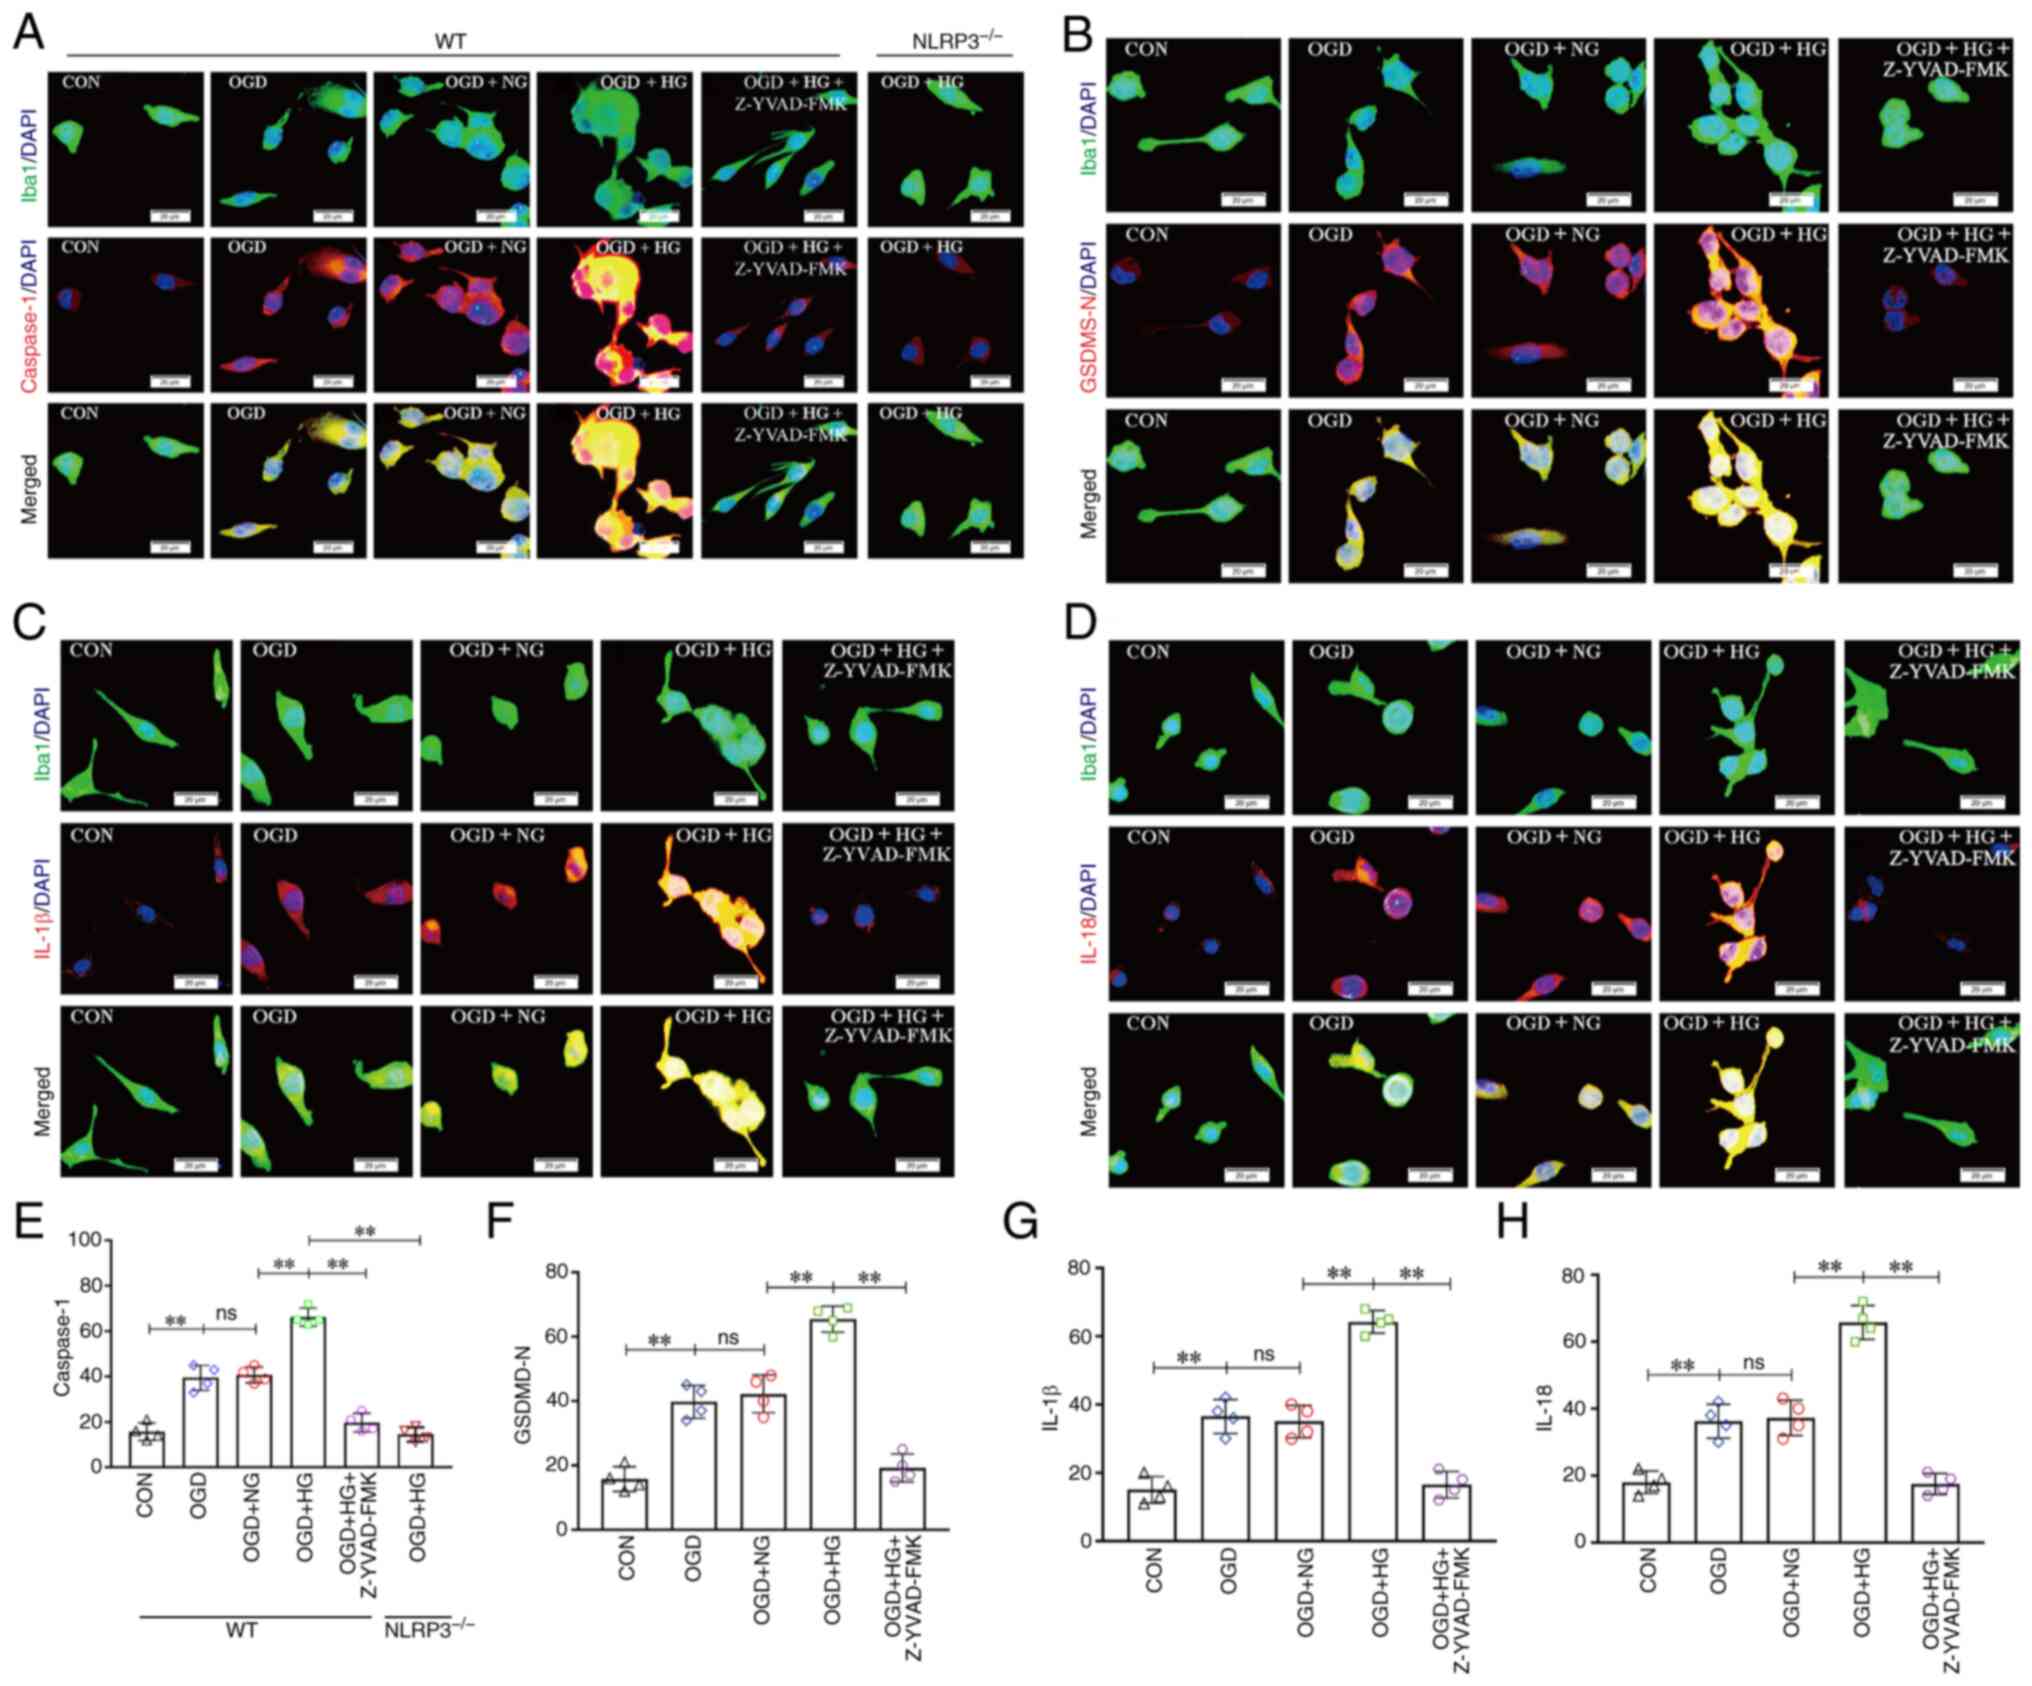 | Figure 7.NLRP3−/− and inhibition of
Caspase-1 reversed HG-induced exacerbation of pyroptosis after
OGD/IR. (A) Immunofluorescence images showing the expression of
Iba1+ microglial cells (green), Caspase-1 (red), and the
co-localization of caspase-1 and microglial cells. (B)
Immunofluorescence images showing the expression of
Iba1+ microglial cells (green), GSDMD-N (red), and the
co-localization of GSDMD-N and microglial cells. (C)
Immunofluorescence images showing the expression of Iba1+
microglial cells (green), IL-1β (red), and the co-localization of
IL-1β and microglial cells. (D) Immunofluorescence images showing
the expression of Iba1+ microglial cells (green), IL-18 (red), and
the co-localization of IL-18 and microglial cells. Scale bars
(a-i): 20 µm. (E) The fluorescence density of Caspase-1. (F) The
fluorescence density of GSDMD-N. (G) The fluorescence density of
IL-1β. (H) The fluorescence density of IL-18. Data are presented as
the mean ± standard deviation. **P<0.01; ns, not significant.
n=4 per group. OGD, oxygen and glucose deprivation; NG, normal
glucose; HG, high glucose; NLRP3, NOD-like receptor protein 3;
GSDMD-N, gasdermin D-N domain; NLRP3−/−; NLRP3 knockout;
WT, wild-type; CON, control. |
Discussion
Hyperglycemia is a common complication during
ischemic stroke, which is associated with a poorer prognosis with
unclear mechanisms (4–7). The present results have shown that
hyperglycemia may aggravate hypoxia via increased oxygen extraction
rate, as evidenced by the increased CERO2 and OCR, and
decreased PbtO2 detected in response to high glucose.
The present study, also demonstrated that hyperglycemia exacerbated
neurological impairments during the period of cerebral IR, which
was related to more severe pyroptosis in microglia, as evidenced by
the increased expression levels of NLRP3, caspase-1, GSDMD-N, IL-1β
and IL-18 and a decreased expression level of GSDMD-FL. However,
NLRP3 KO suppressed IR-induced pyroptosis aggravation caused by
hyperglycemia, and a similar effect was observed in response to a
caspase-1 inhibitor.
In patients, ischemic stroke is commonly accompanied
by hyperglycemia, which can bring about worse clinical outcomes,
including higher morbidity, neurological function destruction,
infarct size enlargement and hemorrhagic conversion (18). This has been demonstrated in both
non-diabetic and diabetic patients who developed hyperglycemia
after stroke and thrombolytic therapy (19). In the present study, the basal
blood glucose of mice was within the normal range. Notably, the
mice treated with high glucose presented with a more severe
neurological impairment after IR, which is consistent with
previously reported results (20).
Hyperglycemia may lead to worsening of cerebral IR injury via a
number of known mechanistic pathways, including damage to the
vascular endothelium, increased levels of oxidative stress and
overactivation of glial cells (5).
However, it remains unclear whether microglial pyroptosis is
involved in hyperglycemia-related severe neurological impairment
after IR.
In the present study, it was shown that
hyperglycemia significantly decreased the levels of
PbtO2 in the mice following cerebral IR, and increased
the levels of CERO2 and OCR. These results suggested
that hyperglycemia aggravated hypoxia by increasing the oxygen
extraction rate. This is consistent with the occurrence of
pyroptosis in microglia. Pyroptosis is a form of pro-inflammatory
programmed necrosis, characterized by caspase-1 activation, rapid
plasma membrane rupture, and release of mature IL-1β and IL-18
(21). In the present study, it
was revealed that pyroptosis in microglia was triggered after IR,
manifested by the upregulated expression levels of NLRP3,
caspase-1, GSDMD-N, IL-1β and IL-18 and the downregulated
expression level of GSDMD-FL, while it was restrained by NLRP3 KO,
which demonstrated that IR induced NLRP3 inflammasome-mediated
pyroptosis. There is existing evidence suggesting that
hyperglycemia-induced pyroptosis in podocytes, myocardium and
macrophages may lead to organ damage in diabetes (22–24).
Nevertheless, whether hyperglycemia plays a role in microglial
pyroptosis following cerebral IR remains to be elucidated.
Furthermore, the present study revealed that high glucose treatment
stimulated the aggravation of pyroptosis in microglia after
cerebral IR, while this response was significantly suppressed in
NLRP3 KO mice and they presented improvements in neurological
functions. In addition, the caspase-1 inhibitor Z-YVAD-FMK
exhibited a similar inhibitory effect on microglial pyroptosis in
microglia treated with OGD and high glucose. These results
suggested that hyperglycemia can activate pyroptosis in microglia
after cerebral IR through the NLRP3/caspase-1 pathway, and
downregulation of NLRP3 and caspase-1 is a potential approach to
reduce neural functional injury.
There are two limitations to this study. In the
present study, it was exposed that hyperglycemia during ischemic
stroke can increase pyroptosis and result in poor neurological
outcomes in mice. However, hypoglycemic therapy was not applied to
verify whether the timely regulation of blood sugar results in
neurological improvement. Additionally, reactive oxygen species
(ROS) are known to be critical for pyroptosis (25,26).
In the present study, it was shown that hyperglycemia aggravated
hypoxia via increasing the oxygen extraction rate. These results
suggested that hyperglycemia may induce ROS overproduction be
intensifying hypoxia, which could be a possible upstream pathway of
pyroptosis, which should be assessed in a future study.
In conclusion, hyperglycemia stimulated NLRP3
inflammasome activation via increasing the oxygen extraction rate,
thus leading to the aggravation of pyroptosis following ischemic
stroke.
Acknowledgements
Not applicable.
Funding
This work was supported by the National Natural Science
Foundation for Young Scientists of China (grant no. 82002074),
Natural Science Foundation of Guangdong Province (grant nos.
2023A1515010267 and 2023A1515012665), Ruiyi Emergency Medical
Research Fund (grant no. R2021020), Science and Technology Program
of Guangzhou (grant no. 202102080003), Medical Scientific Research
Foundation of Guangdong Province (grant nos. B2021400, B2022248 and
A2021067) and China International Medical Foundation
Cerebrovascular Disease Youth Innovation Fund (grant no.
Z-2016-20-2201).
Availability of data and materials
The data generated in the present study may be
requested from the corresponding author.
Authors' contributions
HZ and HD conceived the study. EL, ZL, SZ, YW and ZY
performed the experiments and analyzed the data. All authors read
and approved the final version of the manuscript. EL, ZL, SZ, YW,
ZY, HZ and HD confirm the authenticity of all the raw data.
Ethics approval and consent to
participate
All animal experiments were approved by The Research
Ethics Committee of Guangdong Provincial People's Hospital
(Guangzhou, China; approval no. GDRECKY2020-046-01).
Patient consent for publication
Not applicable.
Competing interests
The authors declare that they have no competing
interests.
References
|
1
|
Feske SK: Ischemic stroke. Am J Med.
134:1457–1464. 2021. View Article : Google Scholar : PubMed/NCBI
|
|
2
|
Tsao CW, Aday AW, Almarzooq ZI, Alonso A,
Beaton AZ, Bittencourt MS, Boehme AK, Buxton AE, Carson AP,
Commodore-Mensah Y, et al: Heart disease and stroke statistics-2022
update: A report from the american heart association. Circulation.
145:e153–e639. 2022. View Article : Google Scholar : PubMed/NCBI
|
|
3
|
Herpich F and Rincon F: Management of
acute ischemic stroke. Crit Care Med. 48:1654–1663. 2020.
View Article : Google Scholar : PubMed/NCBI
|
|
4
|
Gray CS, Hildreth AJ, Sandercock PA,
O'Connell JE, Johnston DE, Cartlidge NE, Bamford JM, James OF and
Alberti KGMM; GIST Trialists Collaboration, :
Glucose-potassium-insulin infusions in the management of
post-stroke hyperglycaemia: The UK glucose insulin in stroke trial
(GIST-UK). Lancet Neurol. 6:397–406. 2007. View Article : Google Scholar : PubMed/NCBI
|
|
5
|
Johnston KC, Bruno A, Pauls Q, Hall CE,
Barrett KM, Barsan W, Fansler A, Van de Bruinhorst K, Janis S and
Durkalski-Mauldin VLD; Neurological Emergencies Treatment Trials
Network and the SHINE Trial Investigators, : Intensive vs standard
treatment of hyperglycemia and functional outcome in patients with
acute ischemic stroke: The SHINE randomized clinical trial. JAMA.
322:326–335. 2019. View Article : Google Scholar : PubMed/NCBI
|
|
6
|
Desilles JP, Syvannarath V, Ollivier V,
Journé C, Delbosc S, Ducroux C, Boisseau W, Louedec L, Di Meglio L,
Loyau S, et al: Exacerbation of thromboinflammation by
hyperglycemia precipitates cerebral infarct growth and hemorrhagic
transformation. Stroke. 48:1932–1940. 2017. View Article : Google Scholar : PubMed/NCBI
|
|
7
|
Ergul A, Li W, Elgebaly MM, Bruno A and
Fagan SC: Hyperglycemia, diabetes and stroke: Focus on the
cerebrovasculature. Vascul Pharmacol. 51:44–49. 2009. View Article : Google Scholar : PubMed/NCBI
|
|
8
|
Jia J, Yang L, Chen Y, Zheng L, Chen Y, Xu
Y and Zhang M: The role of microglial phagocytosis in ischemic
stroke. Front Immunol. 12:7902012022. View Article : Google Scholar : PubMed/NCBI
|
|
9
|
Ding H, Li Y, Wen M, Liu X, Han Y and Zeng
H: Elevated intracranial pressure induces IL-1β and IL-18
overproduction via activation of the NLRP3 inflammasome in
microglia of ischemic adult rats. Int J Mol Med. 47:183–194. 2021.
View Article : Google Scholar : PubMed/NCBI
|
|
10
|
Song L, Pei L, Yao S, Wu Y and Shang Y:
NLRP3 inflammasome in neurological diseases, from functions to
therapies. Front Cell Neurosci. 11:632017. View Article : Google Scholar : PubMed/NCBI
|
|
11
|
Liao LZ, Chen ZC, Wang SS, Liu WB, Zhao CL
and Zhuang XD: NLRP3 inflammasome activation contributes to the
pathogenesis of cardiocytes aging. Aging (Albany NY).
13:20534–20551. 2021. View Article : Google Scholar : PubMed/NCBI
|
|
12
|
Lian H, Fang X, Li Q, Liu S, Wei Q, Hua X,
Li W, Liao C and Yuan X: NLRP3 inflammasome-mediated pyroptosis
pathway contributes to the pathogenesis of Candida albicans
keratitis. Front Med (Lausanne). 9:8451292022. View Article : Google Scholar : PubMed/NCBI
|
|
13
|
Liu L, Wang N, Kalionis B, Xia S and He Q:
HMGB1 plays an important role in pyroptosis induced blood brain
barrier breakdown in diabetes-associated cognitive decline. J
Neuroimmunol. 362:5777632022. View Article : Google Scholar : PubMed/NCBI
|
|
14
|
Ismael S, Nasoohi S, Yoo A, Ahmed HA and
Ishrat T: Tissue plasminogen activator promotes TXNIP-NLRP3
inflammasome activation after hyperglycemic stroke in mice. Mol
Neurobiol. 57:2495–2508. 2020. View Article : Google Scholar : PubMed/NCBI
|
|
15
|
Ardehali MR and Rondouin G: Microsurgical
intraluminal middle cerebral artery occlusion model in rodents.
Acta Neurol Scand. 107:267–275. 2003. View Article : Google Scholar : PubMed/NCBI
|
|
16
|
Percie du Sert N, Ahluwalia A, Alam S,
Avey MT, Baker M, Browne WJ, Clark A, Cuthill IC, Dirnagl U,
Emerson M, et al: Reporting animal research: Explanation and
elaboration for the ARRIVE guidelines 2.0. PLoS Biol.
18:e30004112020. View Article : Google Scholar : PubMed/NCBI
|
|
17
|
Ding HG, Li Y, Li XS, Liu XQ, Wang KR, Wen
MY, Jiang WQ and Zeng HK: Hypercapnia promotes microglial
pyroptosis via inhibiting mitophagy in hypoxemic adult rats. CNS
Neurosci Ther. 26:1134–1146. 2020. View Article : Google Scholar : PubMed/NCBI
|
|
18
|
Desilles JP, Meseguer E, Labreuche J,
Lapergue B, Sirimarco G, Gonzalez-Valcarcel J, Lavallée P, Cabrejo
L, Guidoux C, Klein I, et al: Diabetes mellitus, admission glucose,
and outcomes after stroke thrombolysis: A registry and systematic
review. Stroke. 44:1915–1923. 2013. View Article : Google Scholar : PubMed/NCBI
|
|
19
|
Li J, Quan K and Wang Y, Zhao X, Li Z, Pan
Y, Li H, Liu L and Wang Y: Effect of stress hyperglycemia on
neurological deficit and mortality in the acute ischemic stroke
people with and without diabetes. Front Neurol. 11:5768952020.
View Article : Google Scholar : PubMed/NCBI
|
|
20
|
Li WA, Moore-Langston S, Chakraborty T,
Rafols JA, Conti AC and Ding Y: Hyperglycemia in stroke and
possible treatments. Neurol Res. 35:479–491. 2013. View Article : Google Scholar : PubMed/NCBI
|
|
21
|
Yu P, Zhang X, Liu N, Tang L, Peng C and
Chen X: Pyroptosis: Mechanisms and diseases. Signal Transduct
Target Ther. 6:1282021. View Article : Google Scholar : PubMed/NCBI
|
|
22
|
Qiu Z, Lei S, Zhao B, Wu Y, Su W, Liu M,
Meng Q, Zhou B, Leng Y and Xia ZY: NLRP3 inflammasome
activation-mediated pyroptosis aggravates myocardial
ischemia/reperfusion injury in diabetic rats. Oxid Med Cell Longev.
2017:97432802017. View Article : Google Scholar : PubMed/NCBI
|
|
23
|
Lin J, Cheng A, Cheng K, Deng Q, Zhang S,
Lan Z, Wang W and Chen J: New insights into the mechanisms of
pyroptosis and implications for diabetic kidney disease. Int J Mol
Sci. 21:70572020. View Article : Google Scholar : PubMed/NCBI
|
|
24
|
Zhao P, Yue Z, Nie L, Zhao Z and Wang Q,
Chen J and Wang Q: Hyperglycaemia-associated macrophage pyroptosis
accelerates periodontal inflamm-aging. J Clin Periodontol.
48:1379–1392. 2021. View Article : Google Scholar : PubMed/NCBI
|
|
25
|
Cui Y, Chen XB, Liu Y, Wang Q, Tang J and
Chen MJ: Piperlongu-mine inhibits esophageal squamous cell
carcinoma in vitro and in vivo by triggering
NRF2/ROS/TXNIP/NLRP3-dependent pyroptosis. Chem Biol Interact.
390:1108752024. View Article : Google Scholar : PubMed/NCBI
|
|
26
|
Wang J, Yin Y, Zhang Q, Deng X, Miao Z and
Xu S: HgCl2 exposure mediates pyroptosis of HD11 cells
and promotes M1 polarization and the release of inflammatory
factors through ROS/Nrf2/NLRP3. Ecotoxicol Environ Saf.
269:1157792024. View Article : Google Scholar : PubMed/NCBI
|


