Introduction
Cirrhosis causes ~1.2 million deaths each year,
accounting for 3.5% of all deaths worldwide (1,2).
Cirrhosis is the end-stage of various chronic liver diseases, such
as non-alcoholic fatty liver disease, alcoholic liver disease,
viral hepatitis, autoimmune diseases and biliary disease (2). Regardless of the cause of cirrhosis,
infection is its most common complication, occurring in up to 35%
of patients with cirrhosis (1).
Spontaneous bacterial peritonitis (SBP) is one of the most common
types of infections in patients with cirrhosis, followed by lung
infection, urinary tract infections, bacteraemia, and skin and soft
tissue infections (3,4). Infections lead to decompensation,
such as variceal haemorrhage and hepatorenal syndrome, which can
increase the risk of acute chronic liver failure (3–5).
Studies have shown that the mortality rate of patients with
cirrhosis and infection is four times that of uninfected patients,
accounting for 50% of fatalities in patients with cirrhosis
(1,4).
Patients with cirrhosis have an increased
susceptibility to infection due to intestinal microbiome
disturbance and immunodeficiency syndrome (6,7).
Therefore, the translocation of intestinal bacteria is the main
pathogenesis of SBP and bacteraemia, during which the immune system
may be activated by lipopolysaccharides (LPS), which are also
termed endotoxins, that are released from the leaky gut (3). Immune dysfunction is a common symptom
in patients with cirrhosis and is known as cirrhosis-associated
immune dysfunction (CAID) (7).
CAID causes innate and acquired immune disorders by affecting the
liver and systemic immune functions, including the function of
various immune cells such as neutrophils, macrophages, B
lymphocytes and T lymphocytes (6,7).
Macrophages, derived from monocytes, are the first line of defence
against pathogens, and are divided into two subgroups based on
differences in their functional and transcriptional
characteristics. Namely, M1 macrophages induce a proinflammatory
response, and M2 macrophages induce an anti-inflammatory response
(8). In the early stages of
infection, LPS drives macrophages towards the M1 phenotype
(8). M1 macrophages engulf
bacteria and present antigens to T cells, which secrete a variety
of inflammatory factors, including interleukin (IL-)1β, IL-6,
tumour necrosis factor α (TNFα), and C-X-C motif chemokine ligand
9, thereby activating an immune response (9). M1 activation is dependent on the
transcriptional activity of nuclear factor κB (NF-κB) (9). In contrast to M1 macrophages, M2
macrophages suppress inflammatory responses, clear debris and
apoptotic cells, and facilitate tissue repair and wound healing
(8). In patients with cirrhosis,
impairment of the ability of macrophages to recognise and eliminate
harmful microbiota is a key factor that determines the
susceptibility of patients to infection (1,3,10).
Bile acids are synthesised in the liver via
cytochrome P450 (CYP450)-mediated cholesterol oxidation (11). Primary bile acids, namely cholic
acid (CA) and chenodeoxycholic acid (CDCA), and secondary bile
acids, namely deoxycholic acid (DCA) and lithocholic acid (LCA),
are the major constituents of bile acids in humans (11). Owing to abnormalities in bile acid
synthesis, metabolism and excretion, the bile acid profile of
patients with cirrhosis is significantly different compared with
the bile acid profile of the healthy population (12,13).
Among the various types of bile acid, CDCA inhibits LPS-induced
IL-6 expression in RAW264.7 cells, a widely used murine macrophage
cell line (14), while DCA
increases NLR family pyrin domain containing 3 (NLRP3) and IL-1β
expression in primary mouse macrophages and RAW264.7 cells
(15). These findings suggest that
an abnormal bile acid profile may contribute to impaired macrophage
function in patients with cirrhosis. Although an abnormal bile acid
profile in patients with cirrhosis has been reported previously,
the effect of infection on the bile acid profile in these patients
and how bile acid disturbance by infection modulates macrophage
function remains unclear. In the present study, the changes in the
bile acid profile of cirrhotic patients with infection and the
association between changes in bile acids and infection were
explored. In addition, the effects of bile acids on macrophage
function in vitro were investigated.
Materials and methods
Study population and design
A total of 57 patients with cirrhosis (without
infection, n=18; with infection, n=39) attending the Departments of
Gastroenterology and Infection of The First Affiliated Hospital of
Anhui Medical University (Hefei, China) from June 2020 to October
2020 were selected for the present study. A further 20 healthy
individuals who underwent physical examination at The First
Affiliated Hospital of Anhui Medical University during the same
period were included in the control group. The study was approved
by The Ethics Committee of the First Affiliated Hospital of Anhui
Medical University (Hefei, China; approval no. PJ2020-13-07) and
was conducted in accordance with the principles of the Declaration
of Helsinki (2008). All patients provided written informed consent
before enrolment in the study. Biochemical index data were
extracted from the medical records of patients. To analyse the
serum bile acid profile of patients, 200 µl discarded serum samples
from liver function tests were collected.
Patients with cirrhosis were identified by liver
biopsy, transient elastography, or a combination of clinical signs
and various findings provided by laboratory tests, endoscopy and
radiological imaging (16).
The inclusion criteria for cirrhosis with infection
included one of the following signs, symptoms or abnormal
laboratory test results (17–19):
i) Acute peritonitis; ii) manifestations of systemic inflammatory
response syndrome; iii) deterioration of liver function without an
obvious cause; iv) hepatic encephalopathy; v) shock; vi)
intractable ascites or unresponsiveness to diuretics or renal
failure; vii) acute gastrointestinal bleeding; and viii) abnormal
laboratory test results, namely an ascites polymorphonuclear
neutrophil count ≥0.25×10⁹/l, a positive ascites
bacterial culture or procalcitonin levels >0.5 ng/ml, excluding
other sites of infection.
The exclusion criteria were as follows: i) Patients
with hepatocellular carcinoma; ii) patients with recent severe
trauma, surgery or other serious infections caused by liver
disease; iii) patients aged <20 or >60 years; iv) incomplete
case histories; v) recent severe trauma, surgery or other severe
infections due to liver disease; vi) autoimmune diseases of the
liver (such as primary biliary cirrhosis, autoimmune hepatitis and
primary sclerosing cholangitis); and vii) severe extrahepatic
disease (such as decompensated cardiac insufficiency, severe
obstructive pulmonary disease and psychiatric disease).
Reagents and chemicals
LPS (cat. no. L2630), DCA (cat. no. D2510),
hyodeoxycholic acid (HDCA; cat. no. H3878), phorbol 12-myristate
13-acetate (PMA; cat. no. P1585) and FITC-dextran (cat. no. FD40S)
were obtained from Sigma-Aldrich. High-glucose Dulbecco's Modified
Eagle's Medium (DMEM; cat. no. 10313039), Roswell Park Memorial
Institute (RPMI) 1640 medium (cat. no. 11875085), foetal bovine
serum (cat. no. 10270106) and penicillin-streptomycin (cat. no.
15140122) were purchased from Gibco (Thermo Fisher Scientific,
Inc.). Bovine serum albumin (BSA; cat. no. 4240) was purchased from
BioFroxx (neoFroxx GmbH). The following antibodies were used in the
present study: anti-iNOS antibody (1:1,000; cat. no. AF0199;
Affinity Biosciences), anti-Arg-1 antibody (1:1,000; cat. no.
16001-1-AP; Proteintech Group, Inc.), anti-p65 antibody (1:1,000;
cat. no. 380172; Chengdu Zen-Bioscience Co., Ltd.), anti-IκBα
(1:750; cat. no. WL01936; Wanleibio Co., Ltd.), anti-phospho-IκBα
(1:750; cat. no. WL02495; Wanleibio Co., Ltd.) and anti-histone H3
(1:1,000; cat. no. WL0984a; Wanleibio Co., Ltd.).
TRIzol® reagent (cat. no. 15596026) was procured from
Invitrogen (Thermo Fisher Scientific, Inc.). SYBR Green premix
(cat. no. AG11701) and Evo M-MLV RT premix (cat. no. AG11706) were
purchased from Hunan Accurate Bio-Medical Co., Ltd.). Finally, APC
anti-mouse CD86 (1:150; cat. no. 105012), PE anti-mouse CD163
(1:50; cat. no. 155308), APC anti-human CD86 (1:150; cat. no.
374207) and PE anti-human CD163 (1:50; cat. no. 333605) were
purchased from BioLegend, Inc. The antibody dilution ratios
specified in this section were used for Western blot analysis.
Detection of the bile acid
profile
The bile acid profile was determined as described
previously (13). Briefly, 100 µl
of the serum was diluted with 500 µl 0.01% formic acid, with
dehydrocholic acid used as an internal standard. The diluted
samples were added to Oasis-HLB cartridges and washed with 1 ml
water, and then eluted in 1.5 ml methanol elution. The eluate was
evaporated and redissolved in methanol (100 µl). The analysis was
performed using a high-performance liquid chromatography (HPLC)
system (Shimadzu Corporation) coupled with a triple time-of-flight
(TOF) 5600 mass spectrometer (HPLC-QTOF-MS; Shanghai AB SCIEX
Analytical Instrument Trading Co., Ltd.). All chromatographic
separations were performed with a ZOEBAX Eclipse Plus
C18 column (2.1×150 mm; 3.5 µm; Agilent Technologies,
Inc.). The column was maintained at 40°C and the injection volume
of all samples was 5 µl. The mobile phase consisted of 2.6 mmol/l
ammonium acetate in water adjusted to pH 6.8 using ammonium
hydroxide (mobile phase A) and acetonitrile (mobile phase B). The
flow rate was 0.2 ml/min with the following mobile phase gradient:
0–5 min (20% B), 5–10 min (20–25% B), 10–20 min (25% B), 20–25 min
(25–55% B), 25–29 min (55% B), 29–31 min (55–20% B) and 31–34 min
(20% B). The mass spectrometer was operated with an atmospheric
pressure chemical ionization source in the negative ion mode. The
detection range was m/z 300–800. The following optimized condition
was used: spray voltage, 5,500 V; nebulizer gas (gas 1), 50 psi;
heater gas (gas 2), 50 psi; curtain gas, 30 psi; capillary
temperature, 400°C; declustering potential, 70 V; and collision
energy, 40eV. Nitrogen was used as nebulizer and auxiliary gas. The
data were collected and analyzed with PeakView software 1.2
(Shanghai AB SCIEX Analytical Instrument Trading Co.) and
MultiQuant software 2.1.1 (Shanghai AB SCIEX Analytical Instrument
Trading Co.).
Cell culture
The RAW264.7 macrophage cell line, purchased from
Wuhan Pronoxel, was maintained in DMEM supplemented with 10% foetal
bovine serum and 1% penicillin-streptomycin in an incubator at 37°C
and 5% CO2. The human acute monocytic leukaemia cell
line THP-1 was provided by Cell Bank/Stem Cell Bank, Chinese
Academy of Sciences, and cultured in RPMI-1640 medium with 10%
foetal bovine serum, 100 U/ml streptomycin and 100 U/ml penicillin
in an incubator at 37°C and 5% CO2. Differentiation of
THP-1 monocytes into macrophages was induced by exposure to 100
ng/ml PMA for 48 h at 37°C. The medium containing PMA was aspirated
and the differentiated THP-1 macrophages were washed with
phosphate-buffered saline (PBS). RAW264.7 and differentiated THP-1
cells were stimulated with DCA, HDCA and LPS alone or in
combination for 4 h at 37°C. The stimulatory LPS concentration was
100 ng/ml. Based on the cell viability assay results, the DCA
concentration was 200 µM for RAW264.7 cells and 100 µM for THP-1
cells, and the HDCA concentration was 100 µM for both cell lines.
The CCK-8 kit (cat. no. K101815133EF5E) was purchased from APeXBIO
Technology LLC, and cells were incubated with the CCK-8 reagent for
2 h at 37°C.
Western blotting
Western blotting was performed as described
previously (15). RAW264.7 and
THP-1 cells were collected, lysed with RIPA Lysis Buffer (cat. no.
P0013C; Beyotime Institute of Biotechnology) containing PMSF (cat.
no. ST507; Beyotime Institute of Biotechnology) and phosphatase
inhibitors (cat. no. P1081; Beyotime Institute of Biotechnology),
and centrifuged at 13,000 × g for 20 min at 4°C. The protein
concentration in the supernatant was measured using a BCA protein
assay kit (cat. no. P0010S; Beyotime Institute of Biotechnology).
Equal amounts of protein (30 µg/lane) were separated by sodium
dodecyl sulphate-polyacrylamide gel electrophoresis (SDS-PAGE, 8 or
12% gel concentration for different molecular weight proteins) and
transferred to polyvinylidene difluoride membranes. After
incubation in 5% non-fat milk in Tris-buffered saline with 0.05%
Tween-20 (TBST) for 1 h at room temperature (to block non-specific
binding), the membranes were incubated overnight at 4°C with the
appropriate primary antibody. The following day, the membranes were
washed three times with TBST and incubated with the respective
secondary antibody (1:10,000; HRP-labelled Goat Anti-Rabbit IgG,
cat. no. A0208; or HRP-labelled Goat Anti-Mouse IgG, cat. no.
A0216; Beyotime Institute of Biotechnology) for 1 h at room
temperature. Protein bands were captured using a Bioshine ChemiQ
4600 Mini Chemiluminescence Imaging System (Bioshine Co., Ltd.).
The optical density of each band was quantitated using ImageJ
software 1.45S (National Institutes of Health) and normalised to
the intensity of β-actin.
Reverse transcription-quantitative
polymerase chain reaction (RT-qPCR)
Total RNA was extracted from cultured RAW264.7 or
THP-1 cells with TRIzol® reagent (cat. no. 10296010;
Thermo Fisher Scientific, Inc.) and reverse transcribed into cDNA
using Evo M-MLV Reagent Premix (cat. no. AG11706; Hunan Accurate
Bio-Medical Co., Ltd.), under the following conditions: 37°C for 15
min, followed by a brief incubation at 85°C for 5 sec, and then
incubated at 4°C. The mRNA expression levels of Tnfα, Il6,
Il1b and Il10 were determined using RT-qPCR. The primer
sequences (Sangon Biotech Co., Ltd.) are shown in Table SI. Actb and Gapdh
were used as internal references for the mouse and human cell
lines, respectively, and a total of three biological replicates
were used for each sample. RT-qPCR was conducted using the SYBR
Green Premix (cat. no. AG11701; Accurate Bio-Medical Co., Ltd.) on
a Fluorescence Quantitative PCR Instrument (cat. no. LC480; Roche
Diagnostics). The PCR thermal cycling parameters were as follows:
95°C for 30 sec; 40 cycles of 95°C for 5 sec and 60°C for 30 sec.
Gene expression was normalised to that of the internal controls and
quantified relative to its expression in cells using the
2−ΔΔCq method (20).
Flow cytometry
Each well of a 24-well plate was inoculated with
RAW264.7 or THP-1, and cultured for 24 h at 37°C. After which,
1×10⁶ macrophages were treated with 1.3 µg/ml APC
anti-mouse CD86 and 4 µg/ml PE anti-mouse CD163 antibodies. After
incubation in the dark at 4°C for 30–45 min, 200 µl PBS was added
and the samples was analysed with flow cytometry. FITC-dextran was
added to the cells and incubated at 37°C for 1.5 h; a blank was
also prepared. Cells incubated at 4°C were used as controls to
normalise the phagocytic capacity of macrophages. After washing the
cells three times with PBS containing 0.25% BSA, 200 µl PBS was
added, and the assay was performed on a flow cytometer (CytoFLEX;
Beckman Coulter, Inc.). Analysis was performed using CytExpert
software 2.4 (Beckman Coulter, Inc.). The gating strategy for flow
cytometry is described in Fig. S1
and Fig. S2.
Immunofluorescence
RAW264.7 or THP-1 cell were stimulated with DCA,
HDCA or LPS for 4 h at 37°C. The stimulated concentrations of DCA,
HDCA, and LPS were consistent with those described in the Cell
culture section. After washing three times with PBS, the cells
were fixed in 4% paraformaldehyde for 30 min at room temperature.
After which, the cells were washed once with PBS and permeabilised
with a 0.5% Triton X-100 solution for 15 min at room temperature.
The cells were incubated with a solution containing 0.25% BSA for 1
h at room temperature. After which, the cells were incubated with
the primary antibody, anti-p65 (1:50), overnight at 4°C. The
following day, the cells were washed and incubated with the diluted
fluorescent secondary antibody (1:500; Cy3 labelled goat
anti-rabbit IgG; cat. no. A0516; Beyotime Institute of
Biotechnology) for 1 h at room temperature in the dark. After
washing three times with PBS, the cells were incubated with
4′,6-diamidino-2-phenylindole for 10 min in the dark to stain the
nuclei at room temperature. Images were obtained using a CX23
fluorescence microscope (Olympus Corporation), and analysis was
ImageJ software 1.45S.
Wound healing assay
A sterile pipette tip was used to scratch a straight
line across the macrophage monolayer. After washing away excess
cells with PBS, the medium containing 10% foetal bovine serum was
replaced with serum-free medium, and images of the scratch wound
were taken with a CX23 fluorescence microscope (Olympus
Corporation) at 0 and 24 h. Quantification was performed by
evaluating the area of the scratch blank area after 24 h using
ImageJ 1.45S.
Transwell assay
Transwell plates with 8-µm membrane pores were used
for the cell migration experiments. For each Transwell plate,
RAW264.7 or THP-1 cells were seeded in the upper chambers, with 200
µl cell suspension (1×10⁵ cells) in serum-free medium
plated. The lower chambers were filled with 500 µl complete medium
with 10% foetal bovine serum, supplemented with DCA, HDCA or LPS.
Incubation was at 37°C for 24 h. Fixation was achieved by adding
500 µl 4% paraformaldehyde to the lower chamber for 30 min at room
temperature, followed by staining with 500 µl crystal violet for 15
min at room temperature. Images were captured with a CX23
fluorescence microscope (Olympus Corporation).
Statistical analysis
The data are presented as the mean ± standard error
of the mean. Differences between the groups were analysed using
one-way analysis of variance followed by Tukey's test for normally
distributed data and the Kruskal-Wallis test for non-normally
distributed data. The chi-square test was used to compare the
differences between groups for the categorical data. Each
experiment was repeated three times. P<0.05 was considered to
indicate a statistically significant difference. Data analysis was
conducted using SPSS 25.0 (IBM Corp.). Variable importance
projection (VIP) analysis was performed using SIMCA 14.1 software
(Umetrics). Receiver operating characteristic (ROC) curves were
analysed using MedCalc 19.6 software (MedCalc Software Ltd.).
Principal component analysis (PCA) and heatmap analyses were
conducted using the MetaboAnalyst 5.0 online platform (www.metaboanalyst.ca).
Results
Demographic characteristics of the
patients
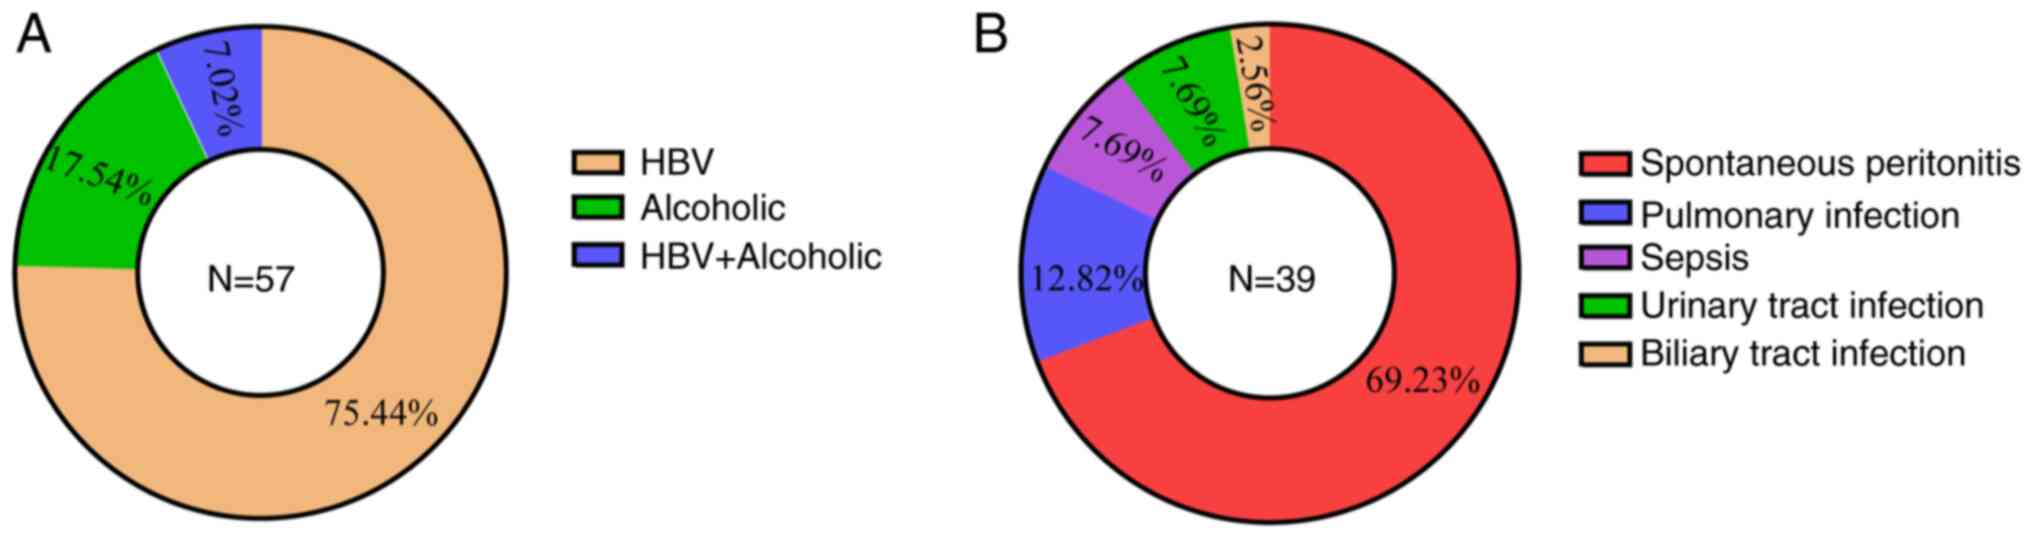
A total of 20 healthy individuals, 18 patients with
cirrhosis but without infection and 39 patients with cirrhosis and
infection were included in the present study. The causes of
cirrhosis and secondary infections are presented in Fig. 1. The demographic and routine
biochemical parameters of the recruited subjects were recorded and
age matched among the three groups (Table I). There were more men in the
sample, consistent with the fact that the incidence of cirrhosis is
higher in men (21). In addition,
infected patients with cirrhosis exhibited a higher proportion of
Child-Pugh C classification compared with uninfected patients
(Table I), indicating a worse
prognosis compared with those with Child-Pugh B (22). Compared with healthy subjects,
patients with cirrhosis had significant abnormalities in liver
functions and total bile acid (TBA) levels, which was in line with
previous studies (12,13). There were lower white blood cell
(WBC) and platelet counts in patients with cirrhosis but without
infection compared with healthy subjects due to hypersplenism in
patients with cirrhosis, resulting in increased destruction of WBCs
and platelets, a common clinical manifestation in cirrhosis
(23). Compared with the patients
with cirrhosis but without infection, patients with cirrhosis and
infection appeared to have higher serum aspartate aminotransferase
(AST), γ-glutamyltrasferase (ALP) and bilirubin levels, and lower
haemoglobin levels (Table I).
However, there was no statistically significant difference in AST
and ALP levels between patients with cirrhosis and those with
cirrhosis and infection. This suggests a deteriorating physical
state and impaired liver function in patients with cirrhosis and
infection. Indicators such as WBCs, and the percentage of
neutrophils and inflammatory factors were used to characterise the
infection status (Table I and
Fig. S3). Notably, serum levels
of TBA appeared to be higher in patients with cirrhosis and
infection than in those without infection, although the difference
was not statistically significant. The TBA levels increased
progressively in all three groups of patients (Table I), which suggests that the
progression of patients with cirrhosis and infection is accompanied
by abnormalities in bile acid metabolism.
 | Table I.Characteristics of the three clinical
sample groups. |
Table I.
Characteristics of the three clinical
sample groups.
|
Characteristics | Healthy (n=20) | Cirrhosis
(n=18) | Cirrhosis with
infection (n=39) |
|---|
| Age, years | 46.15±1.39 | 49.28±1.71 | 50.36±1.24 |
| Sex, male, n
(%) | 12 (60.00) | 10 (55.56) | 30 (76.92) |
| Glucose, mM/l | 4.81±0.08 | 5.37±0.33 |
6.81±0.56b |
| ALT, U/l | 15.50±0.88 |
55.67±20.89b |
49.15±6.85b |
| AST, U/l | 16.95±0.70 |
53.00±12.44b |
84.85±13.54b |
| ALP, U/l | – | 113.61±14.51 | 147.39±15.55 |
| GGT, U/l | – | 66.33±14.76 | 88.49±14.49 |
| Bilirubin,
mg/dl | 14.05±1.01 |
37.02±8.01a |
101.69±17.59b,d |
| TBA, ng/ml | 3.89±0.69 |
40.68±12.53b |
63.45±10.28b |
| Albumin, g/dl | 45.37±0.48 |
34.42±1.78b |
27.40±0.81b,d |
| Hemoglobin | 136.40±2.43 |
109.11±5.95b |
91.31±4.60b,c |
| Platelet,
×109/l | 230.35±9.53 |
81.33±13.95b |
86.03±11.25b |
| Urea, mM/l | 4.01±0.14 |
4.81±0.29a |
8.29±1.05b,c |
| Creatinine,
µM/l | 62.55±2.55 | 61.67±3.95 | 83.85±14.60 |
| Uric acid,
µM/l | 292.0±11.6 | 295.1±19.3 | 331.05±26.22 |
| WBC,
×109/l | 6.13±0.26 |
3.40±0.33b |
6.75±0.65d |
| NEUT, % | 55.59±1.44 | 57.73±3.26 |
69.95±2.57b,d |
| NEUT#,
×109/l | 3.40±0.17 |
1.96±0.23b |
4.88±0.54d |
| LYMPH, % | 36.64±1.39 | 31.29±2.76 |
18.55±2.18b,d |
| LYMPH#,
×109/l | 2.25±0.14 | 1.06±0.14 | 1.59±0.60 |
| MONO, % | 5.22±0.29 |
7.92±0.53b |
9.46±0.64b |
| MONO#,
×109/l | 0.32±0.02 | 0.28±0.03 |
0.62±0.06b,d |
| Child-Pugh B,
n | – | 13 | 6 |
| Child-Pugh C,
n | – | 5 | 33e |
Abnormal bile acid profile in patients
with cirrhosis and infection
Next, how the detailed bile acid profile was changed
by infection in patients with cirrhosis was investigated, and the
differences in the bile acid profile among the three groups of
patients was examined. PCA showed a significant separation of the
three groups of patients, and the comparison between each of the
two groups using orthogonal partial least squares discriminant
analysis (OPLS-DA) further supported this conclusion (Fig. 2A and Table SII). Although the Q2 for OPLS-DA
between cirrhotic patients and cirrhotic patients with infection
was only 0.207 (P<0.05), however this indicated a difference in
the bile acid profile between the two groups, which was further
shown in the heatmap analyses (Fig.
2B). As shown in Fig. 2B and
Table II, there were significant
changes in the bile acid profile between healthy subjects and
patients with cirrhosis. Specifically, there were alterations in
DCA, glycoursodeoxycholic acid (GUDCA), glycocholic acid (GCA) and
taurochenodeoxycholic acid (TCDCA), which was consistent with
previous studies (12,13). Furthermore, the bile acid profile
was different between patients with cirrhosis and patients with
cirrhosis and infection. Compared with patients with cirrhosis
without infection, some bile acid species tended to change although
without a statistical significance; in particular, HDCA and DCA
were consistently decreased across the healthy population, patients
with cirrhosis and patients with cirrhosis and infection, although
DCA levels were not statistically different between patients with
cirrhosis and patients with cirrhosis and infection.
Glycochenodeoxycholic acid, taurocholic acid (TCA), and TCDCA were
consistently elevated among the three groups, although there was no
statistical difference in these levels between the patients with
cirrhosis and patients with cirrhosis and infection.
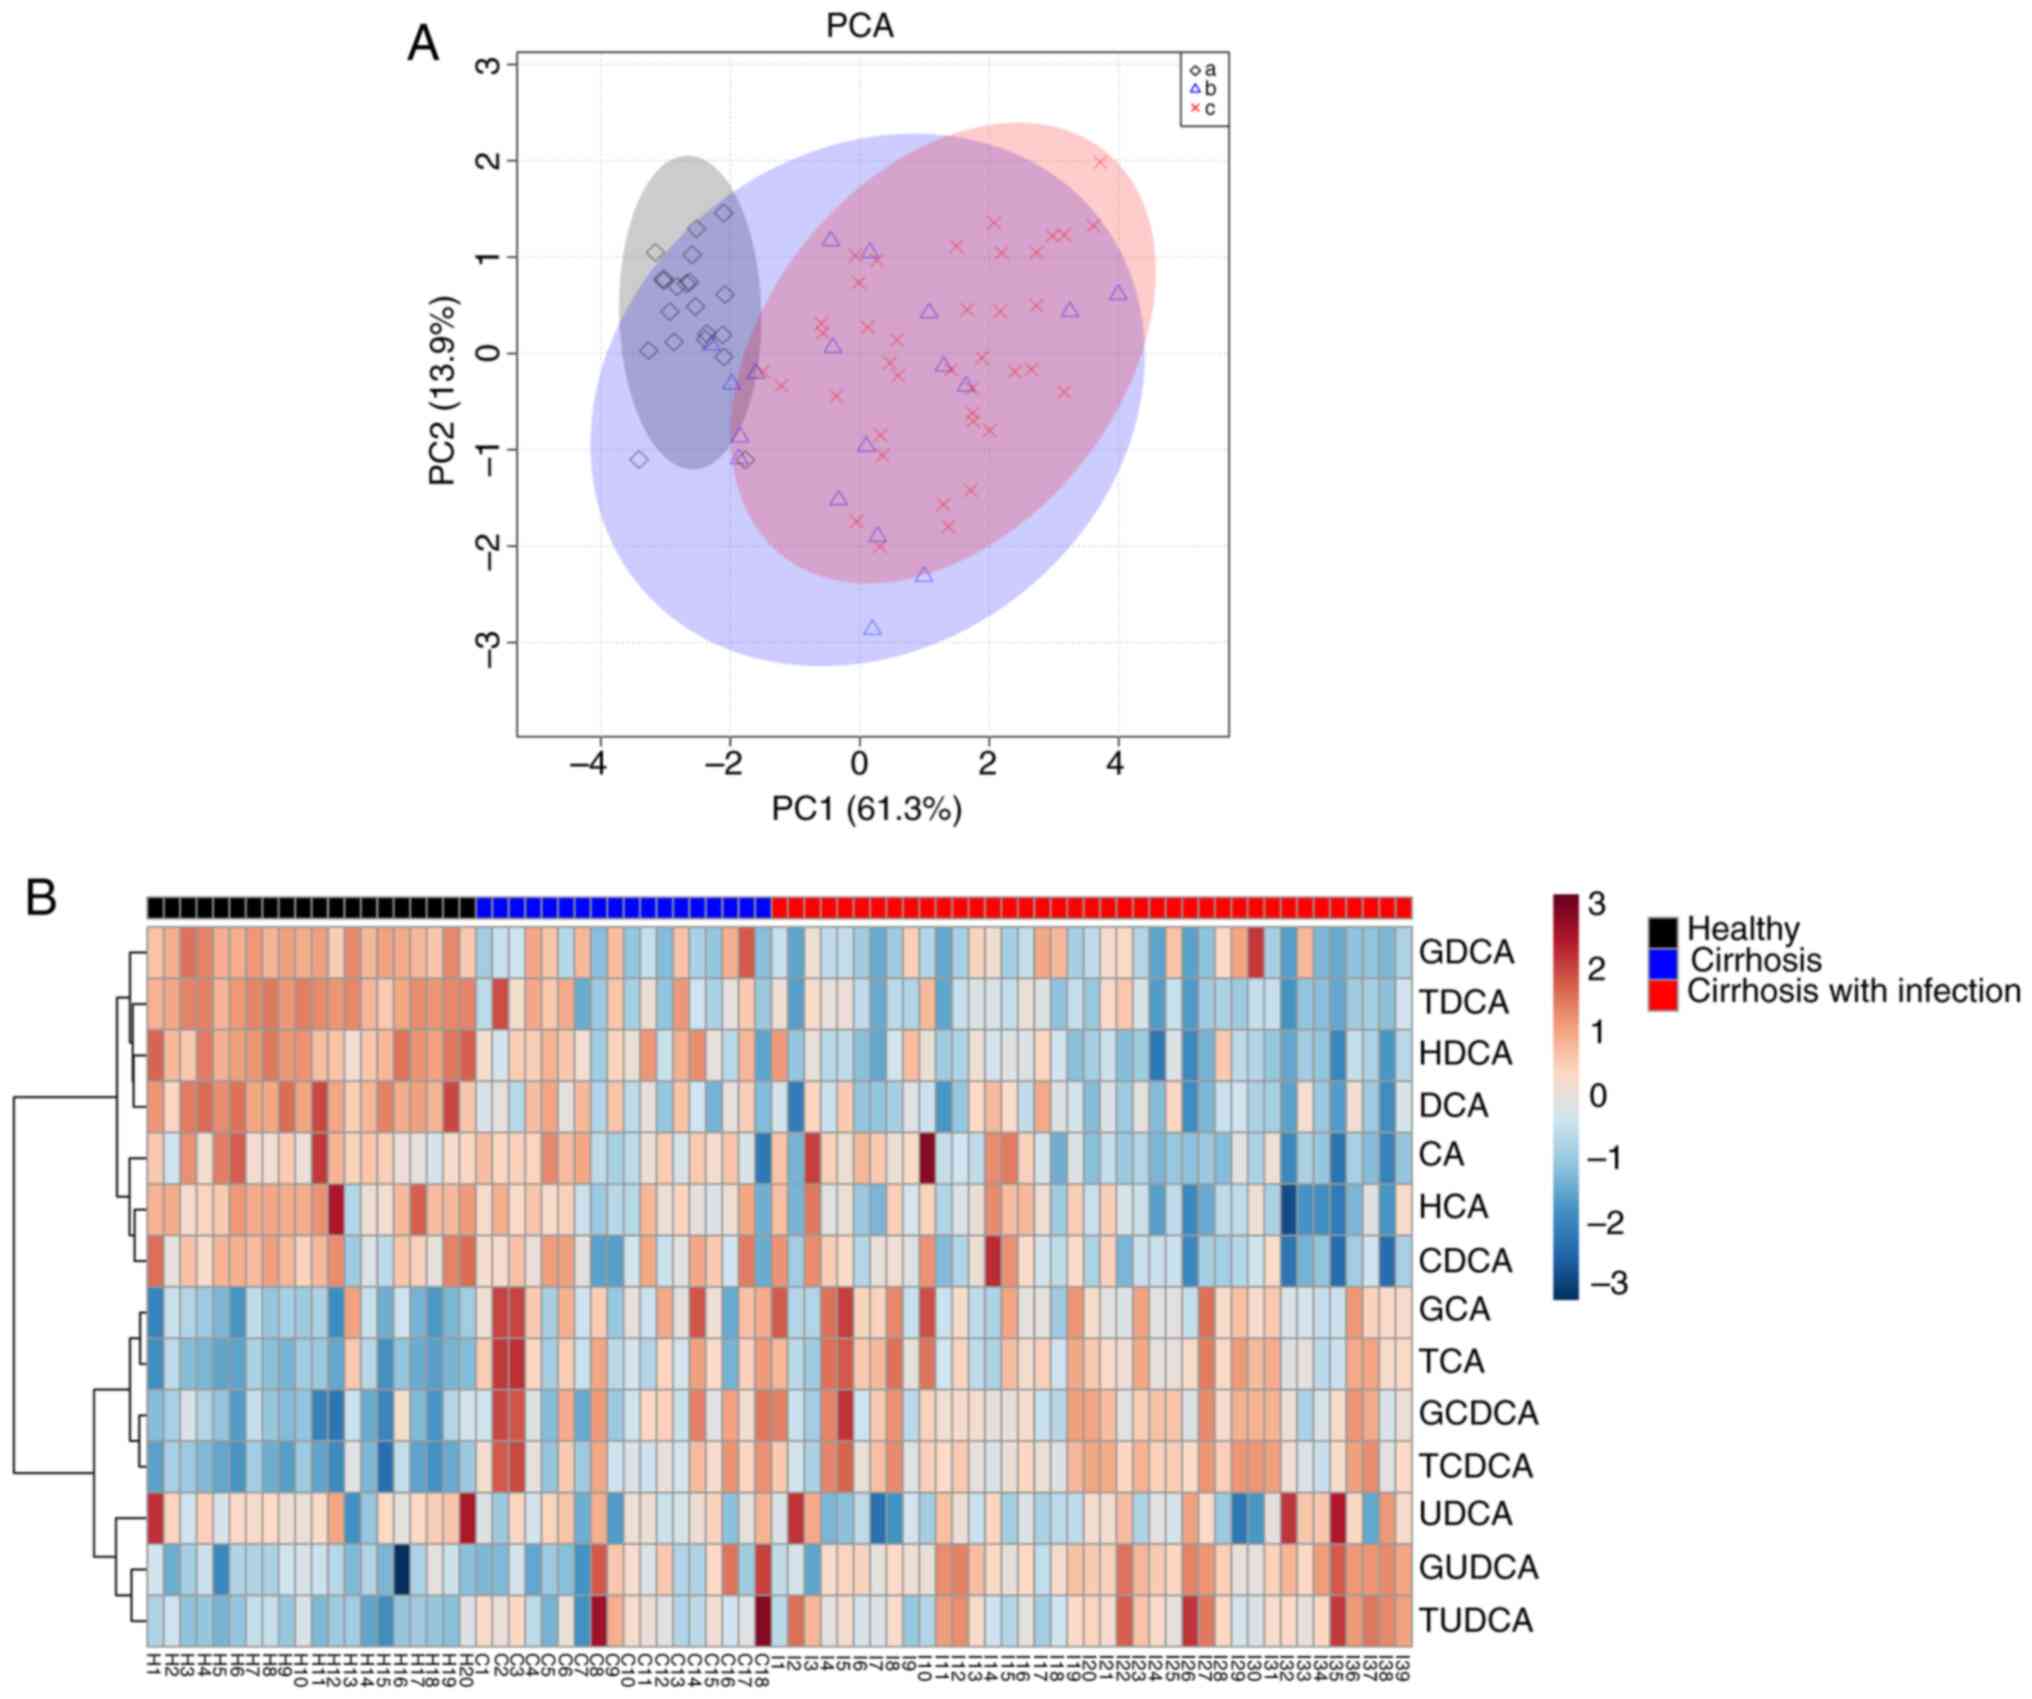 | Figure 2.Bile acid metabolic profile changes
between the three groups. (A) PCA of the serum bile acid
metabolome. (B) Heatmap illustrating serum bile acid metabolic
profiles from healthy individuals (a in the key), patients with
cirrhosis (b in the key) and patients with cirrhosis and infection
(c in the key). H1-H20 represents healthy subjects, N1-N18
represents patients with cirrhosis and I1-I39 represents patients
with cirrhosis and infection. PCA, principal component analysis;
GDCA, glycodeoxycholic acid; TDCA, taurodeoxycholic acid; HDCA,
hyodeoxycholic acid; DCA, deoxycholic acid; CA, cholic acid; HCA,
hyocholic acid; CDCA, chenodeoxycholic acid; GCA, glycocholic acid;
TCA, taurocholic acid; GCDCA, glycochenodeoxycholic acid; TCDCA,
taurochenodeoxycholic acid; UDCA, ursodeoxycholic acid; GUDCA,
glycoursodeoxycholic acid; TUDCA, tauroursodeoxycholic acid; PC1
represents the direction of maximum variance in the data, PC2
represents the secondary variance in the direction orthogonal to
PC1. |
| Table II.Bile acids levels in the serum. |
Table II.
Bile acids levels in the serum.
| Bile acids | Healthy (n=20) | Cirrhosis
(n=18) | Cirrhosis with
infection (n=39) |
|---|
| Cholic acid | 153.53±46.48 | 187.62±71.43 | 210.11±84.11 |
| Hyocholic acid | 28.27±3.75 | 25.60±3.66 | 25.40±4.87 |
| Ursodeoxycholic
acid | 59.22±12.29 | 99.50±23.22 | 380.45±132.27 |
| Hyodeoxycholic
acid | 135.34±17.70 |
85.73±19.66a |
27.02±6.19d |
| Chenodeoxycholic
acid | 260.60±30.14 | 388.29±75.36 | 407.56±61.44 |
| Deoxycholic
acid | 168.80±34.33 |
75.45±32.73b |
28.17±4.95b |
|
Glycoursodeoxycholic acid | 19.25±3.84 |
6,608.28±4,359.37a |
6,124.82±2,390.90b,d |
|
Glycochenodeoxycholic acid |
1,847.05±517.24 |
18,782.22±5,449.69b |
25,764.10±3,863.11b |
| Glycodeoxycholic
acid | 314.63±101.58 | 138.59+56.48 | 259.85±194.67 |
| Glycocholic
acid | 777.87±555.61 |
4,059.64±969.64b |
4,573.13±675.07b |
| Taurocholic
acid | 141.19±108.10 |
1,631.67±453.46b |
1,935.84±317.48b |
|
Tauroursodeoxycholic acid | 13.95±2.41 |
2,524.68±1,663.34b |
1,911.93±802.24b |
|
Taurochenodeoxycholic acid | 71.84±36.51 |
1,295.81±373.52b |
2,049.56±297.42b |
| Taurodeoxycholic
acid | 49.56±9.96 |
20.45±7.81b |
2.43±1.37b,c |
Reduction in HDCA and DCA associated
with infection
The altered bile acids were screened based on the
VIP scores, with VIP >1 and P<0.05 as the screening
conditions (24). The bile acid
species that were different between healthy subjects and patients
with cirrhosis were glycingoose DCA (GCDCA), TCDCA, TCA, GCA,
taurine ursodeoxycholic acid (TUDCA) and GUDCA. In addition, the
ROC curves suggested that HDCA, DCA, GCDCA, TCDCA and taurine DCA
(TDCA) could be well distinguished between healthy subjects and
patients with cirrhosis. The area under the ROC curve (AUC) for
each aforementioned bile acid was 0.731, 0.819, 0.942, 0.967 and
0.751, respectively (Fig. 3A).
HDCA, TDCA, DCA, TCDCA and GCDCA differed between patients with
cirrhosis and infection, and healthy subjects. The AUC was 0.946,
0.974, 0.908, 0.983 and 0.969, respectively (Fig. 3B). The VIP scores also showed that
HDCA, TCDCA, TDCA, DCA, GCDCA and TCA were different between
patients with cirrhosis, with or without infection. After which,
the association between disturbed bile acids and infection was
assessed based on ROC curves. The AUC for HDCA, DCA, GCDCA, TCDCA
and TDCA was 0.769, 0.583, 0.618, 0.630 and 0.641, respectively
(Fig. 3C). Considering the effect
of unconjugated bile acids on immune function (12,15),
it was hypothesized that the decrease in HDCA and DCA may be
closely related to infection in patients with cirrhosis.
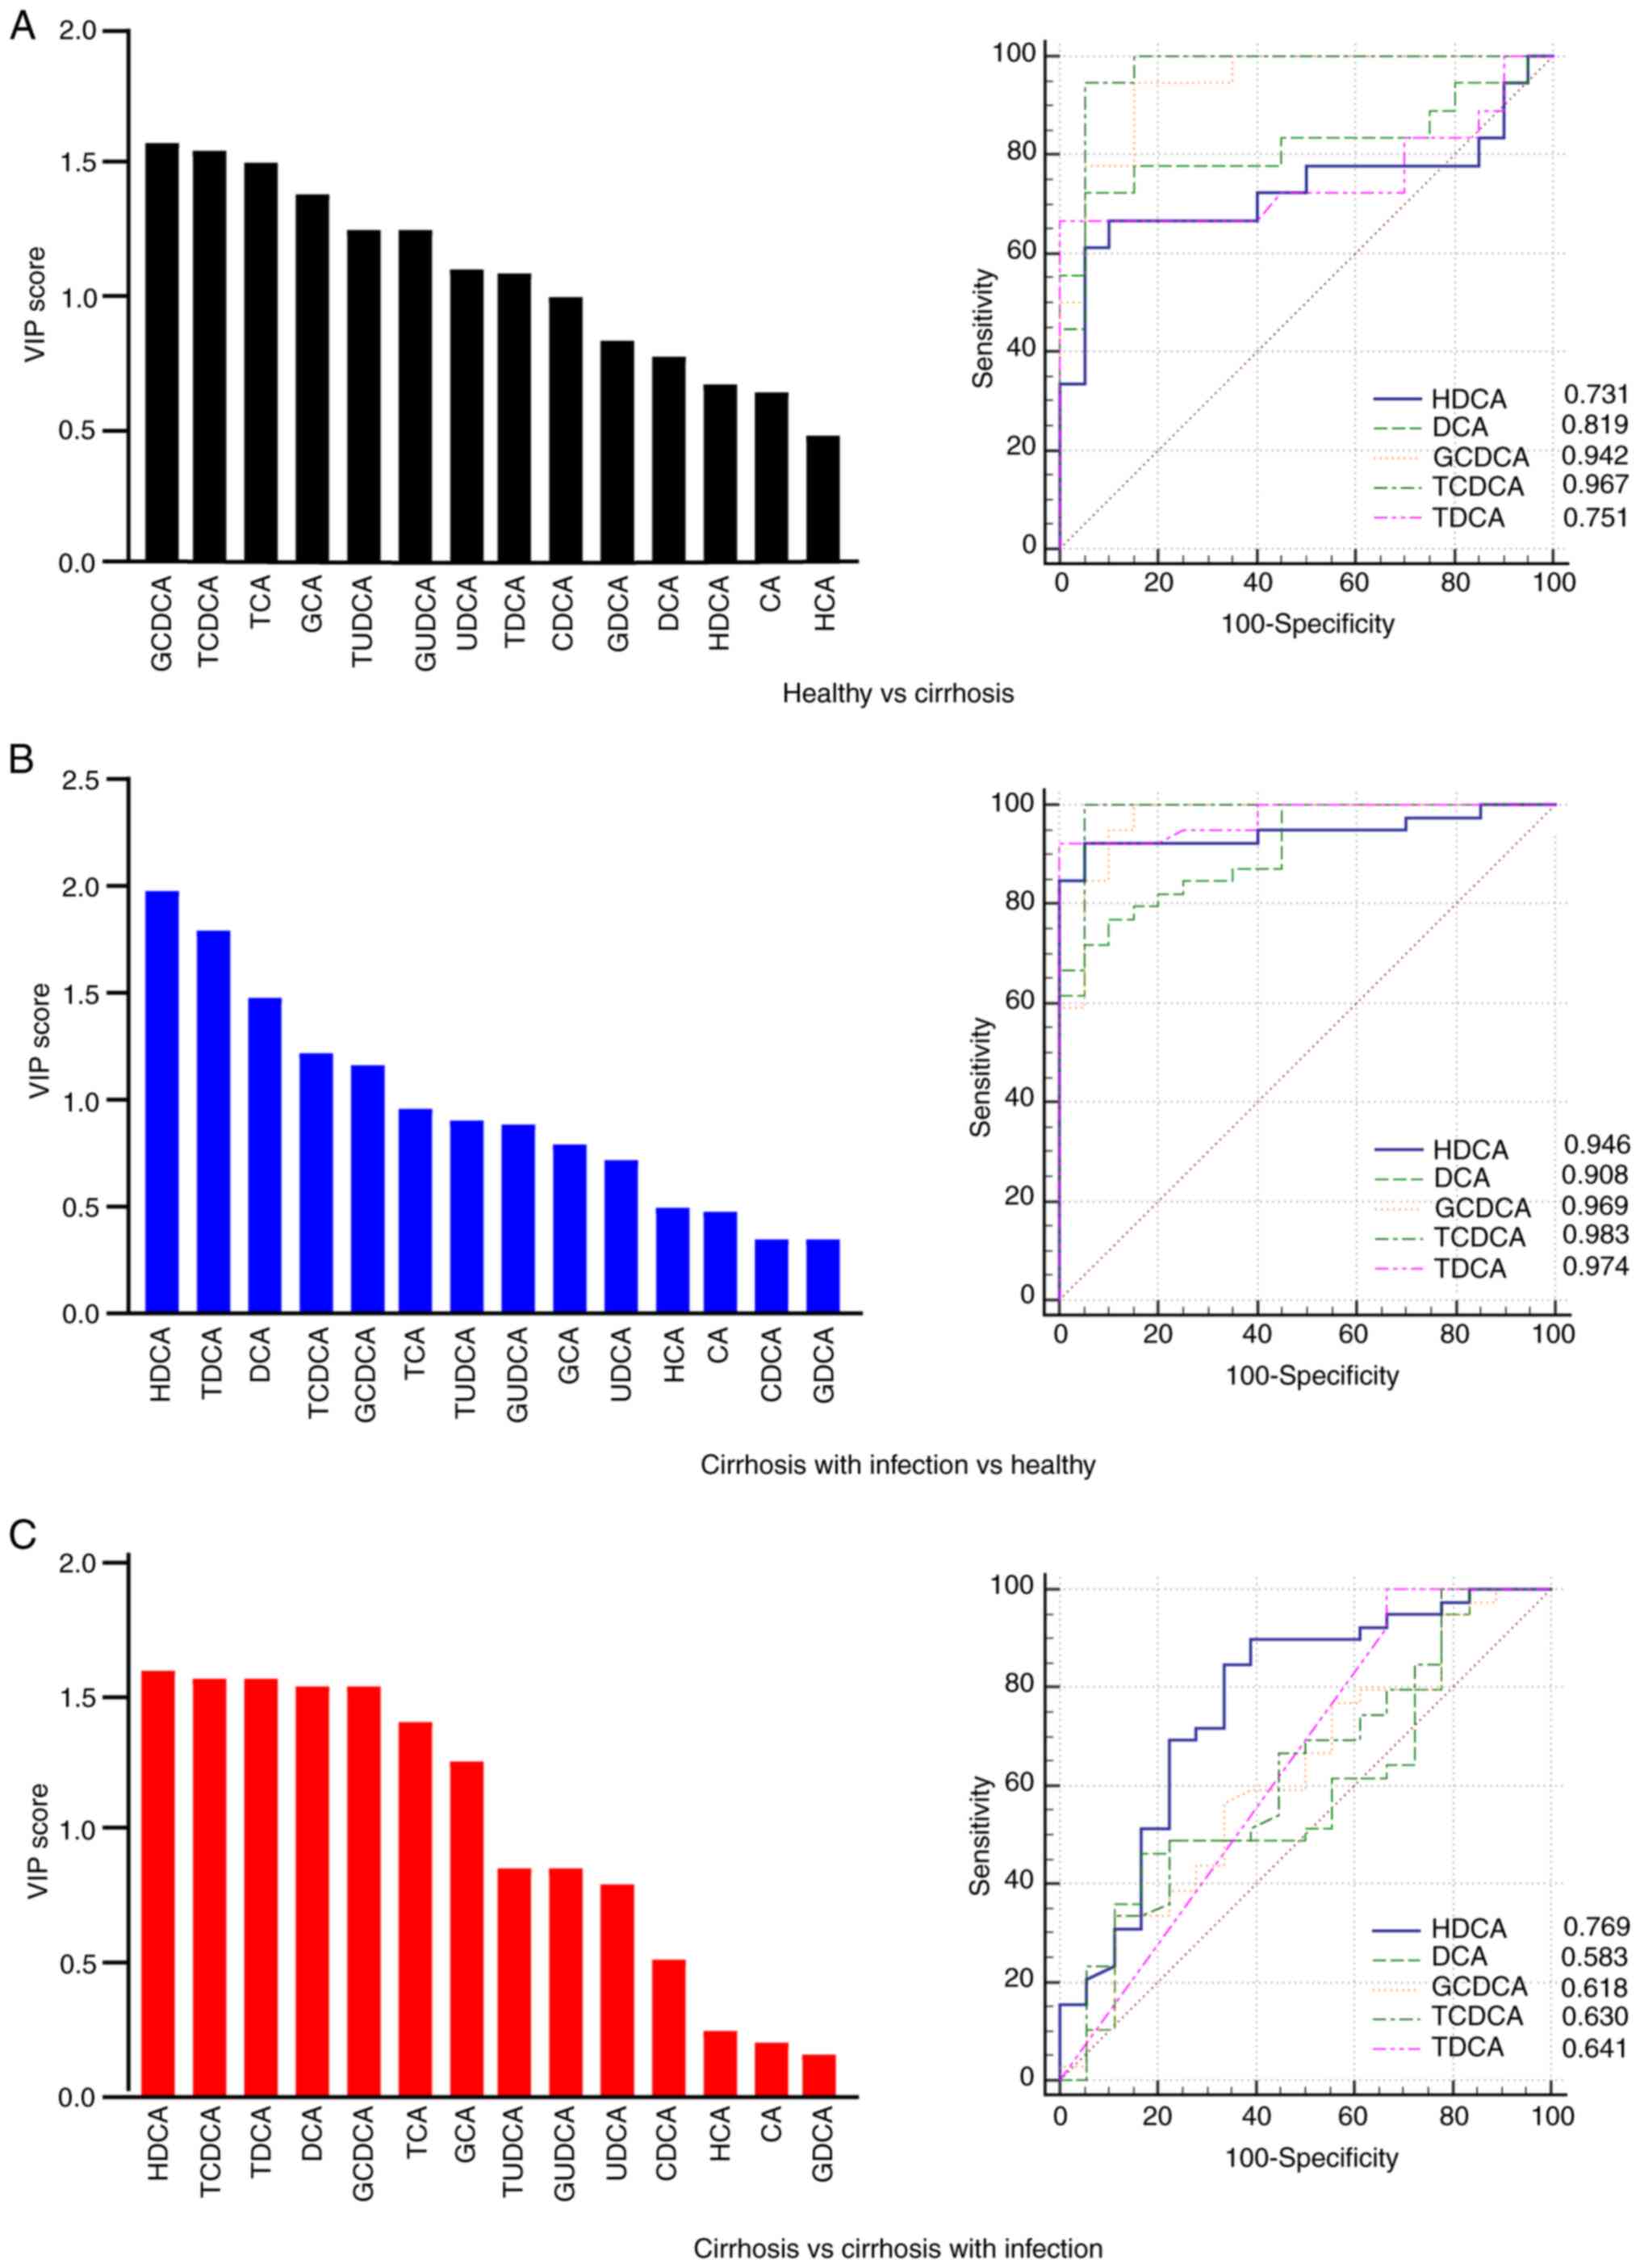 | Figure 3.VIP and ROC analysis of bile acid
profiles. (A) VIP values and ROC curves for different bile acid
subtypes between healthy subjects and cirrhotic patients. (B) VIP
values and ROC curves for different bile acid subtypes between
healthy subjects and cirrhotic patients with infection. (C) VIP
values and ROC curves for different bile acid subtypes between
cirrhotic patients and cirrhotic patients with infection. VIP,
variable importance for projection; ROC, receiver operating
characteristic; GDCA, glycodeoxycholic acid; TDCA, taurodeoxycholic
acid; HDCA, hyodeoxycholic acid; DCA, deoxycholic acid; CA, cholic
acid; HCA, hyocholic acid; CDCA, chenodeoxycholic acid; GCA,
glycocholic acid; TCA, taurocholic acid; GCDCA,
glycochenodeoxycholic acid; TCDCA, taurochenodeoxycholic acid;
UDCA, ursodeoxycholic acid; GUDCA, glycoursodeoxycholic acid;
TUDCA, tauroursodeoxycholic acid. |
DCA and HDCA increase LPS-induced M1
polarisation
Macrophages play an important role in the clearance
of infections. CDCA can influence macrophage polarisation and
function, but the role of DCA and HDCA in modulating macrophage
polarisation remains largely unknown (15). Thus, the present study assessed the
role of DCA and HDCA in macrophage polarisation by evaluating the
expression of the M1 macrophage markers iNOS and CD86 and the M2
macrophage markers Arg-1 and CD163 (25,26).
The effects of DCA (25–400 µM) and HDCA (25–400 µM) on cell
viability were assessed using the cell counting kit 8 (CCK-8) and
their stimulating concentrations were selected based on the results
of CCK-8 (Fig. S4). Following
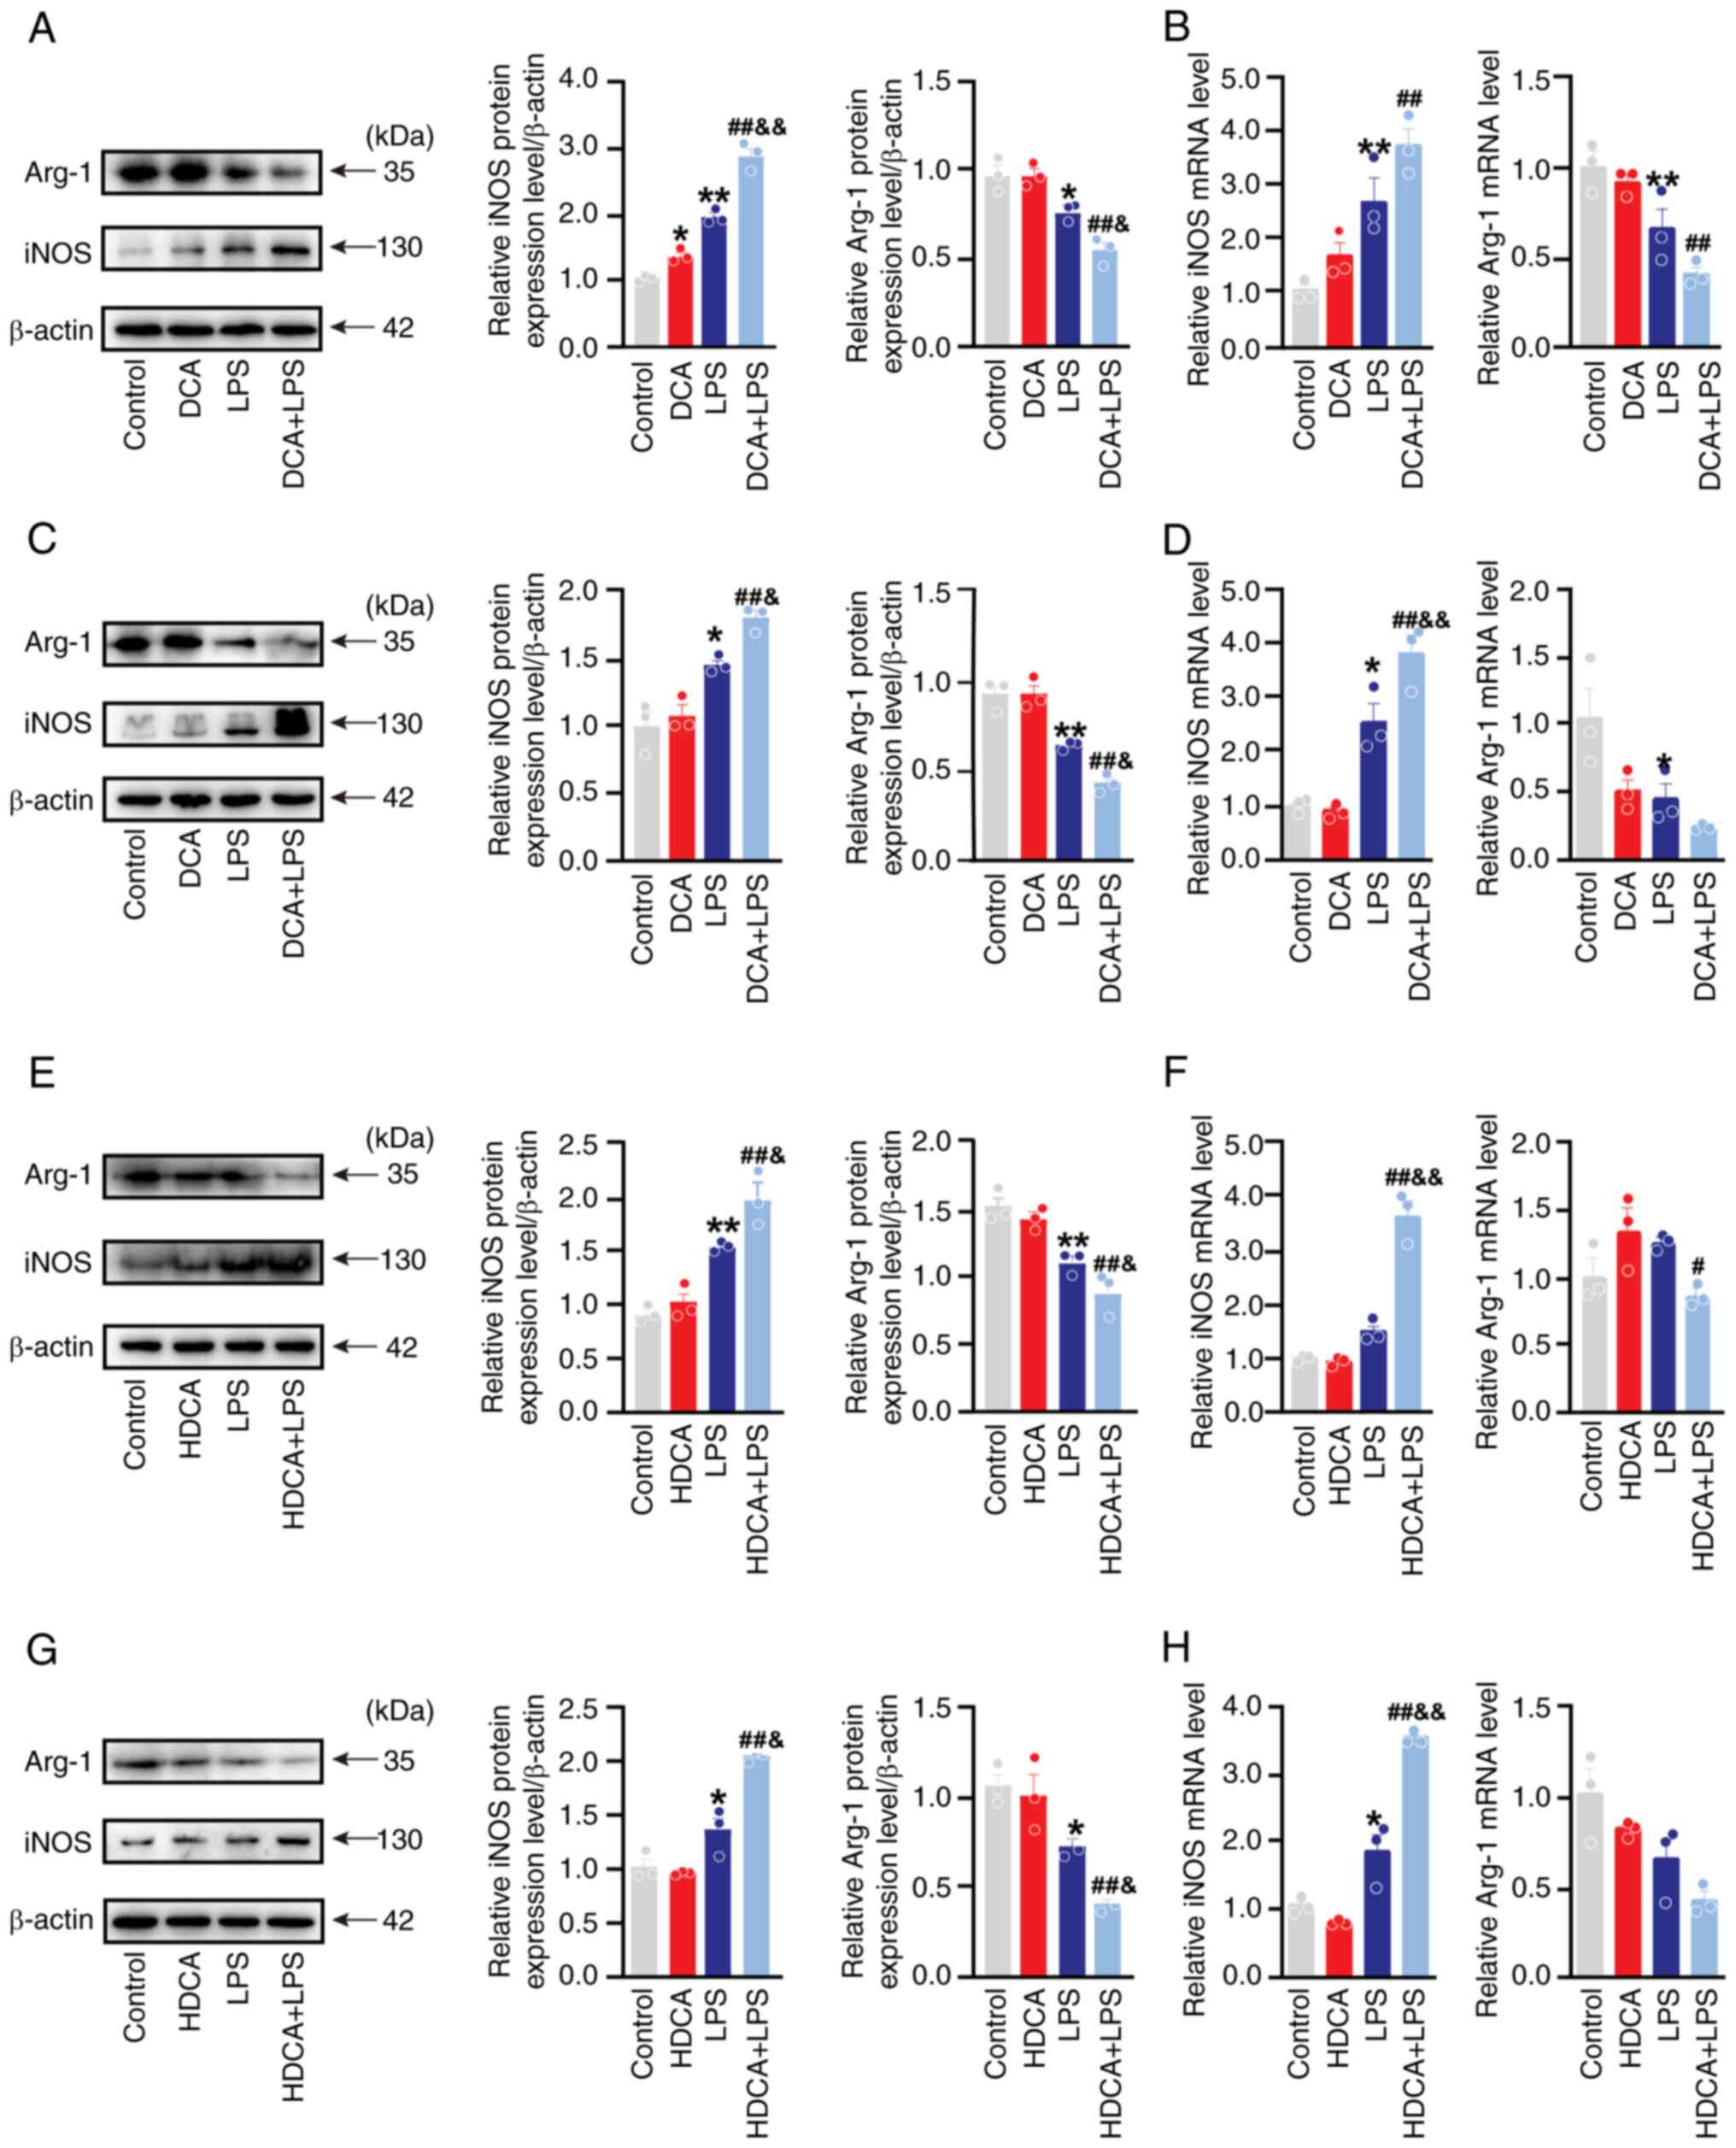
single DCA stimulation, there was a slight increase observed in
iNOS protein expression in RAW264.7 cells, with no significant
effect on iNOS mRNA levels. Notably, DCA alone did not induce
changes in either iNOS protein or mRNA expression in THP-1 cells.
Similarly, independent stimulation with DCA did not impact the
expression of Arg-1 protein or mRNA in either RAW264.7 or THP-1
cells in vitro (Fig. 4A-D).
Likewise, HDCA stimulation alone did not alter the expression of
iNOS or Arg-1 protein and mRNA in RAW264.7 and THP-1 cells in
vitro (Fig. 4E-H). However,
after co-stimulation with LPS, both DCA and HDCA significantly
enhanced the LPS-induced induction of iNOS protein and mRNA
expression compared with LPS treatment alone, although the increase
in iNOS mRNA expression by DCA in RAW264.7 cells was not
statistically significant (Fig.
4A-H). Additionally, DCA and HDCA acted synergistically with
LPS to further increase the trend of downregulation of Arg-1
protein expression, although the decrease in Arg-1 mRNA was not
statistically significant. (Fig.
4A-H). Nonetheless, they acted synergistically with LPS to
increase the value of iNOS/Arg-1 (Fig. S5). Similar to the western blotting
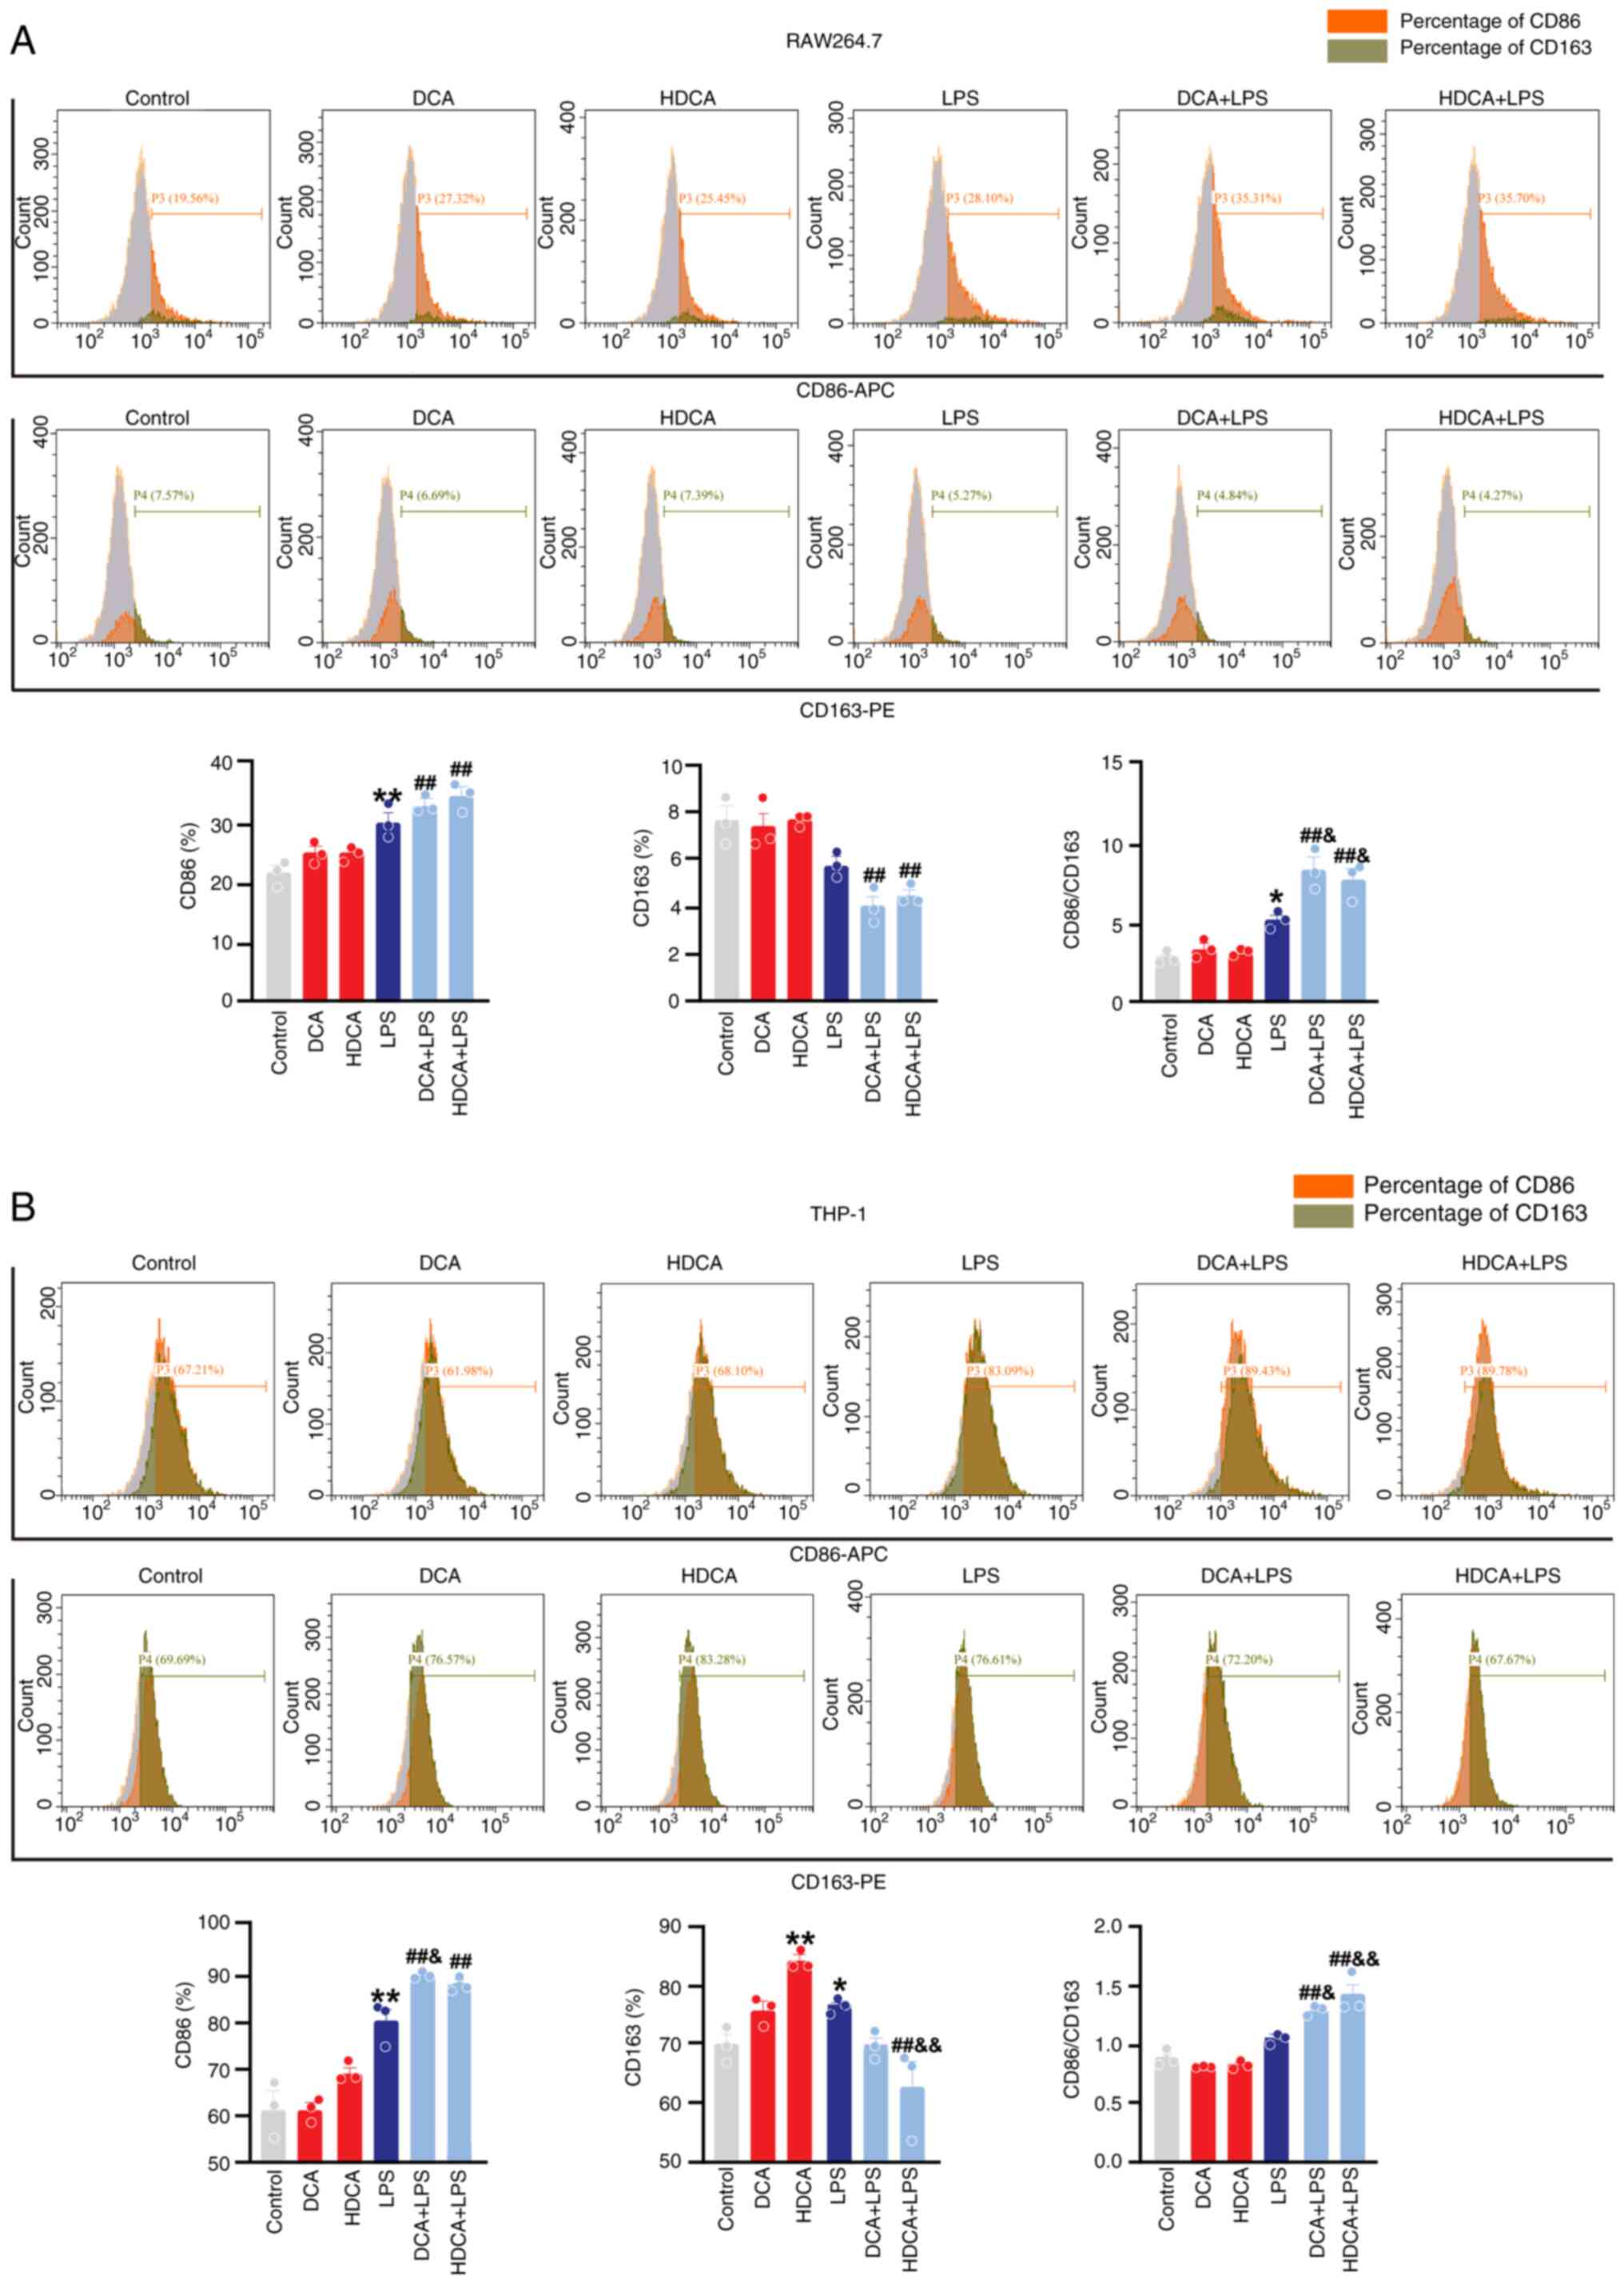
and RT-qPCR data, stimulation of RAW264.7 with DCA or HDCA alone
did not affect CD86 and CD163 expression, and HDCA mildly increased
CD163 expression in THP-1 cells (Fig.
5). DCA and HDCA enhanced the LPS-induced increase in CD86
expression and facilitated the LPS-induced downregulation of CD163
in RAW264.7 cells, though these changes were not statistically
significant. However, both DCA and HDCA significantly elevated the
LPS-induced CD86/CD163 ratio (Fig.
5A). A similar effect was observed in THP-1 cells (Fig. 5B). Thus, DCA or HDCA enhanced the
effect of LPS on the induction of the CD86/163 ratio in RAW264.7
and THP-1 cells. The results of the present study suggested that
DCA and HDCA could act synergistically with LPS to enhance
macrophage M1 polarisation; however, neither of them were effective
when used alone.
DCA and HDCA increase LPS-induced
secretion of inflammatory factors
Cytokines are important components of the macrophage
response and established indicators of the macrophage phenotype
(8). RT-qPCR was used to determine
the expression of cytokine mRNA levels in RAW264.7 and THP-1 cells
treated with DCA/HDCA in the presence or absence of LPS. DCA
stimulation alone mildly upregulated Il6 mRNA expression in
RAW264.7 cells, but the difference was not statistically
significant. This effect was not observed in THP-1 cells (Fig. 6A and B). In addition, HDCA
stimulation alone did not affect the mRNA expression of the
proinflammatory factors in RAW264.7 and THP-1 cells (Fig. 6C and D). However, co-stimulation
with LPS and DCA significantly increased LPS-induced Il6
mRNA expression in RAW264.7 cells, elevated Tnfα mRNA
expression and decreased Il10 mRNA expression in THP-1 cells
(Fig. 6A and B). In contrast,
co-stimulation of HDCA with LPS increased Il1b and
Il6 mRNA expression in RAW264.7 cells and enhanced
Il6 mRNA expression in THP-1 cells (Fig. 6C and D).
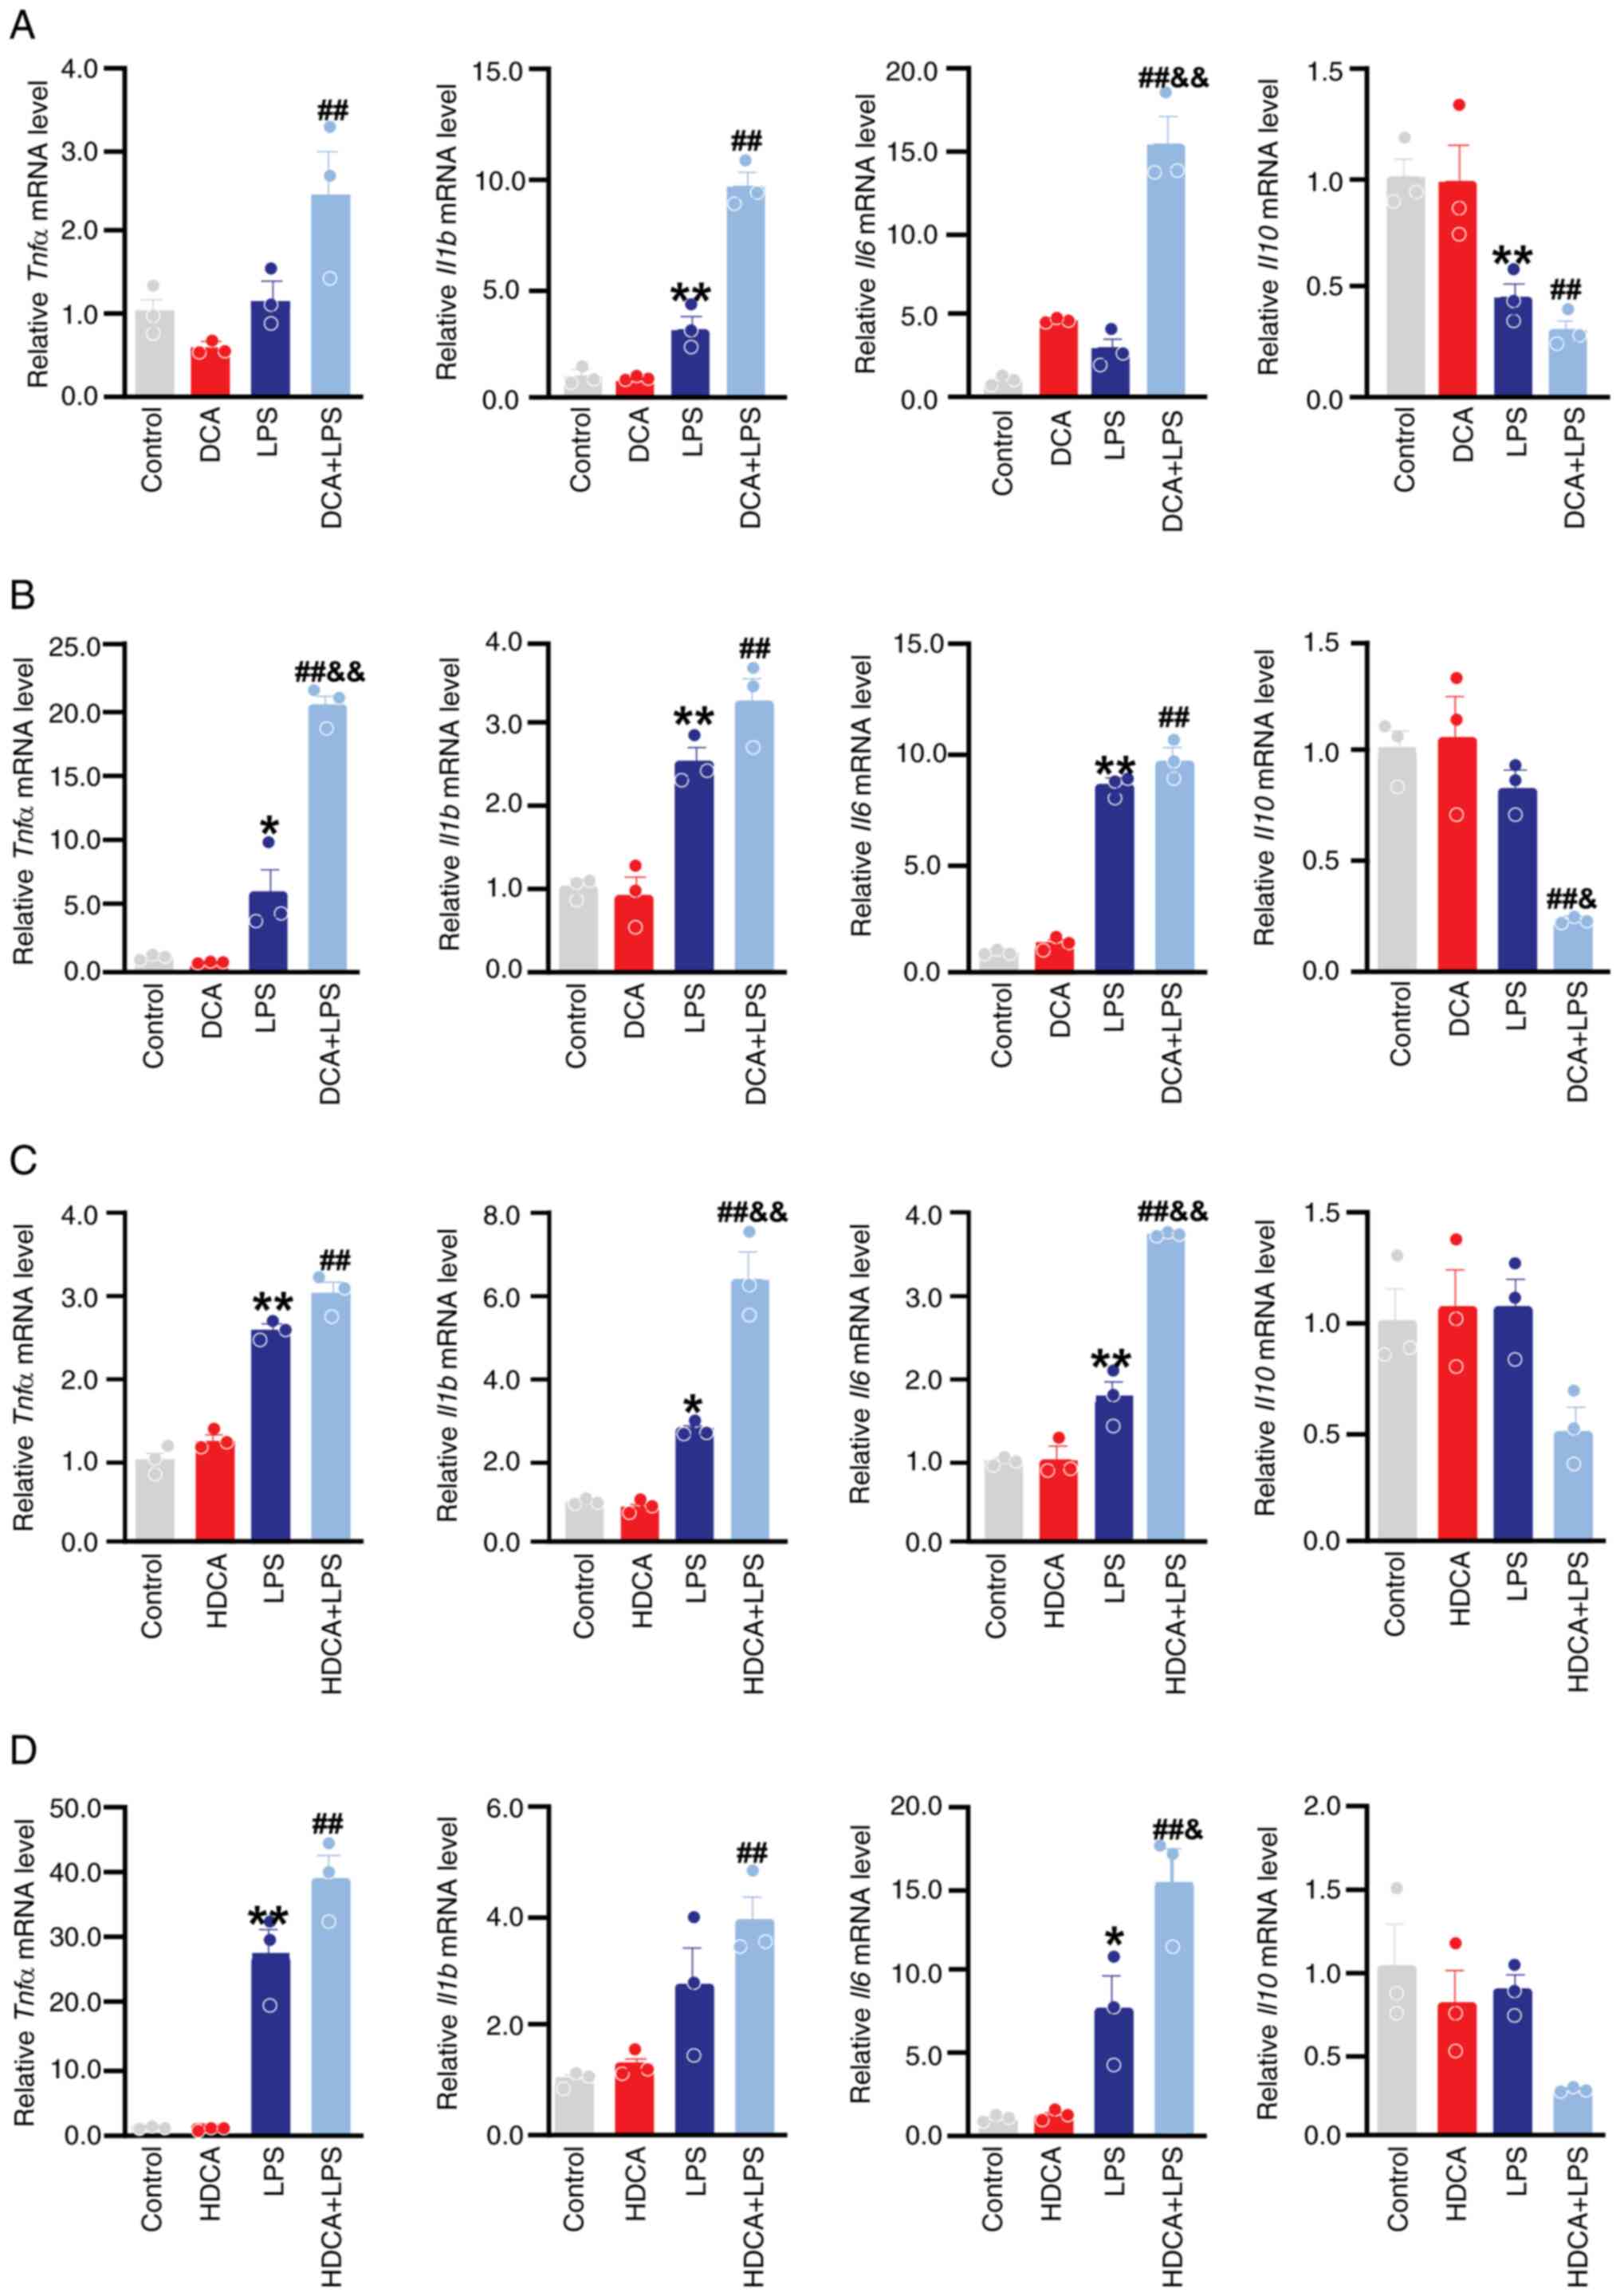 | Figure 6.Effect of DCA and HDCA on mRNA
expression of cytokines in RAW264.7 and THP-1 cells. (A) Effect of
DCA on tnfα, il6, il1β and il10 mRNA levels in
RAW264.7 cells was measured by RT-qPCR. (B) Effect of DCA on
tnfα, il6, il1β and il10 mRNA levels in THP-1 cells was
measured by RT-qPCR. (C) Effect of HDCA on tnfα, il6, il1β
and il10 mRNA levels in RAW264.7 cells was measured by
RT-qPCR. (D) Effect of HDCA on tnfα, il6, il1β and il10 mRNA
levels in THP-1 cells was measured by RT-qPCR. The stimulation
concentrations of DCA in RAW264.7 and THP-1 cells were 200 and 100
µM, respectively, while those of HDCA were 100 µM in both cell
lines. Data expressed as mean ± SEM (n=3); **P<0.01, *P<0.05
compared with the control group; ##P<0.01,
#P<0.05 compared with the DCA or HDCA group;
&&P<0.01, &P<0.05 compared
with the LPS group. DCA, deoxycholic acid; HDCA, hyodeoxycholic
acid; inducible nitric oxide synthase; LPS, lipopolysaccharide. |
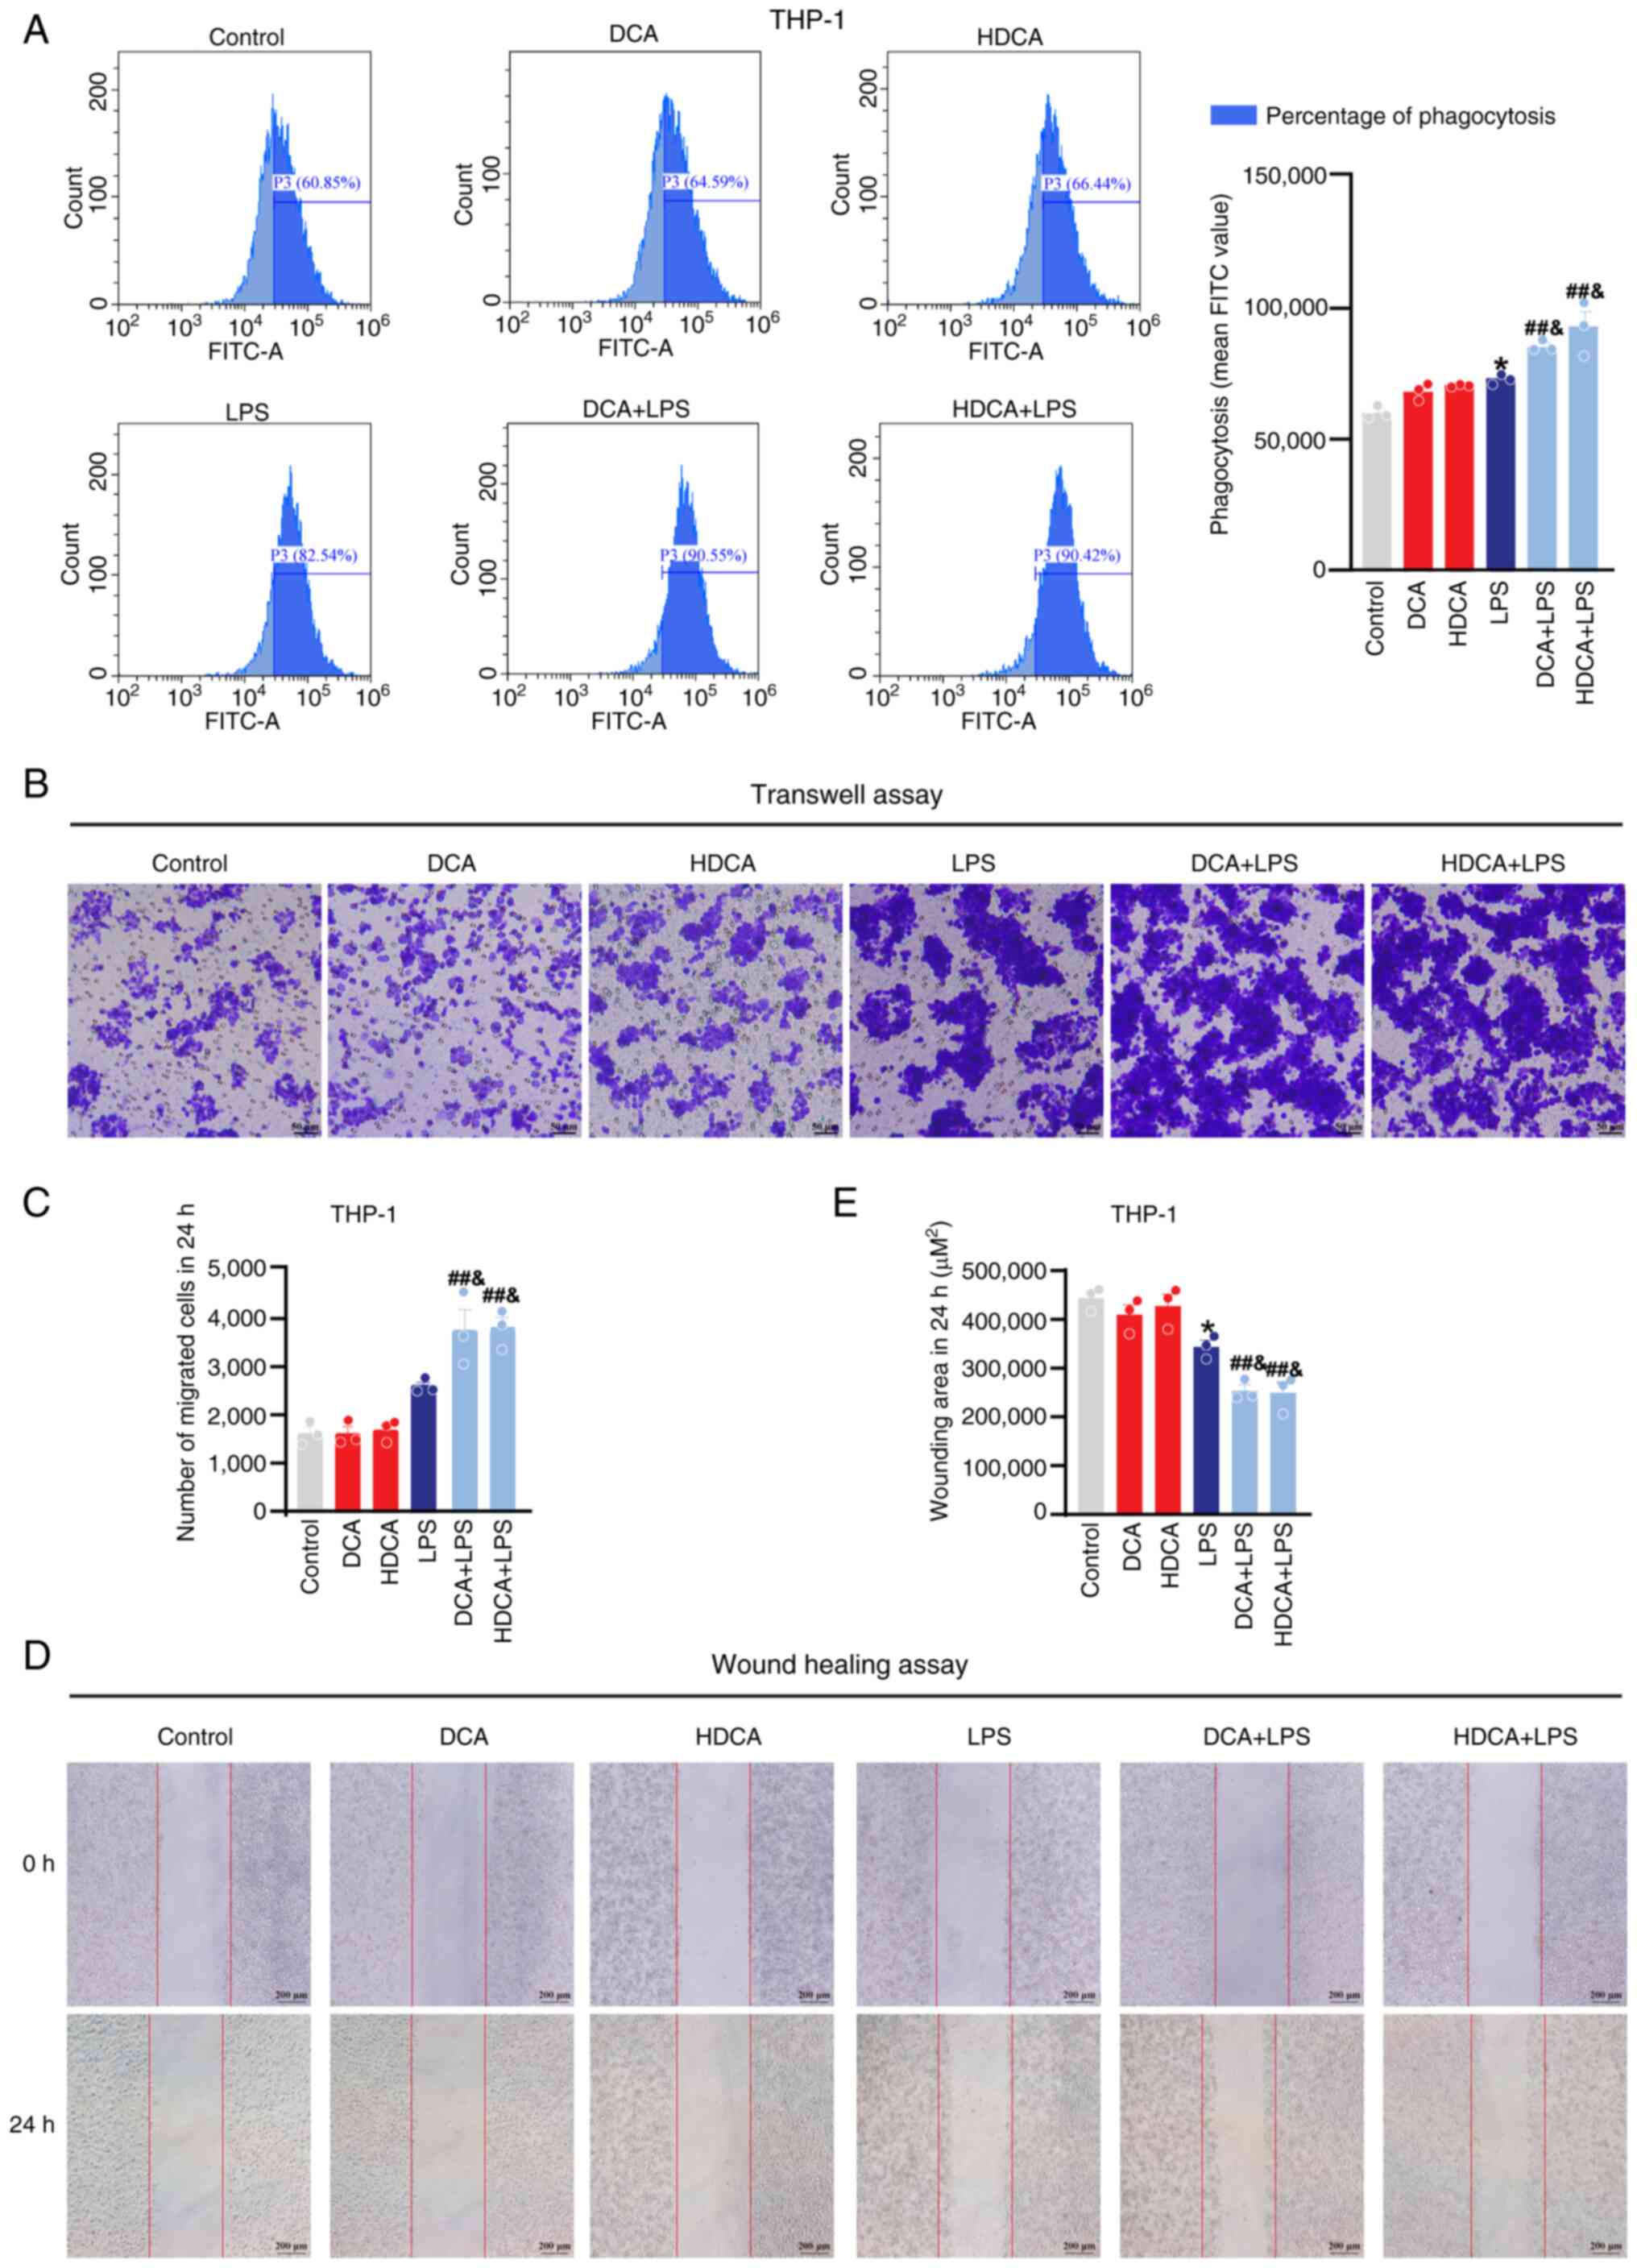
DCA and HDCA enhance phagocytosis and
migration of macrophages
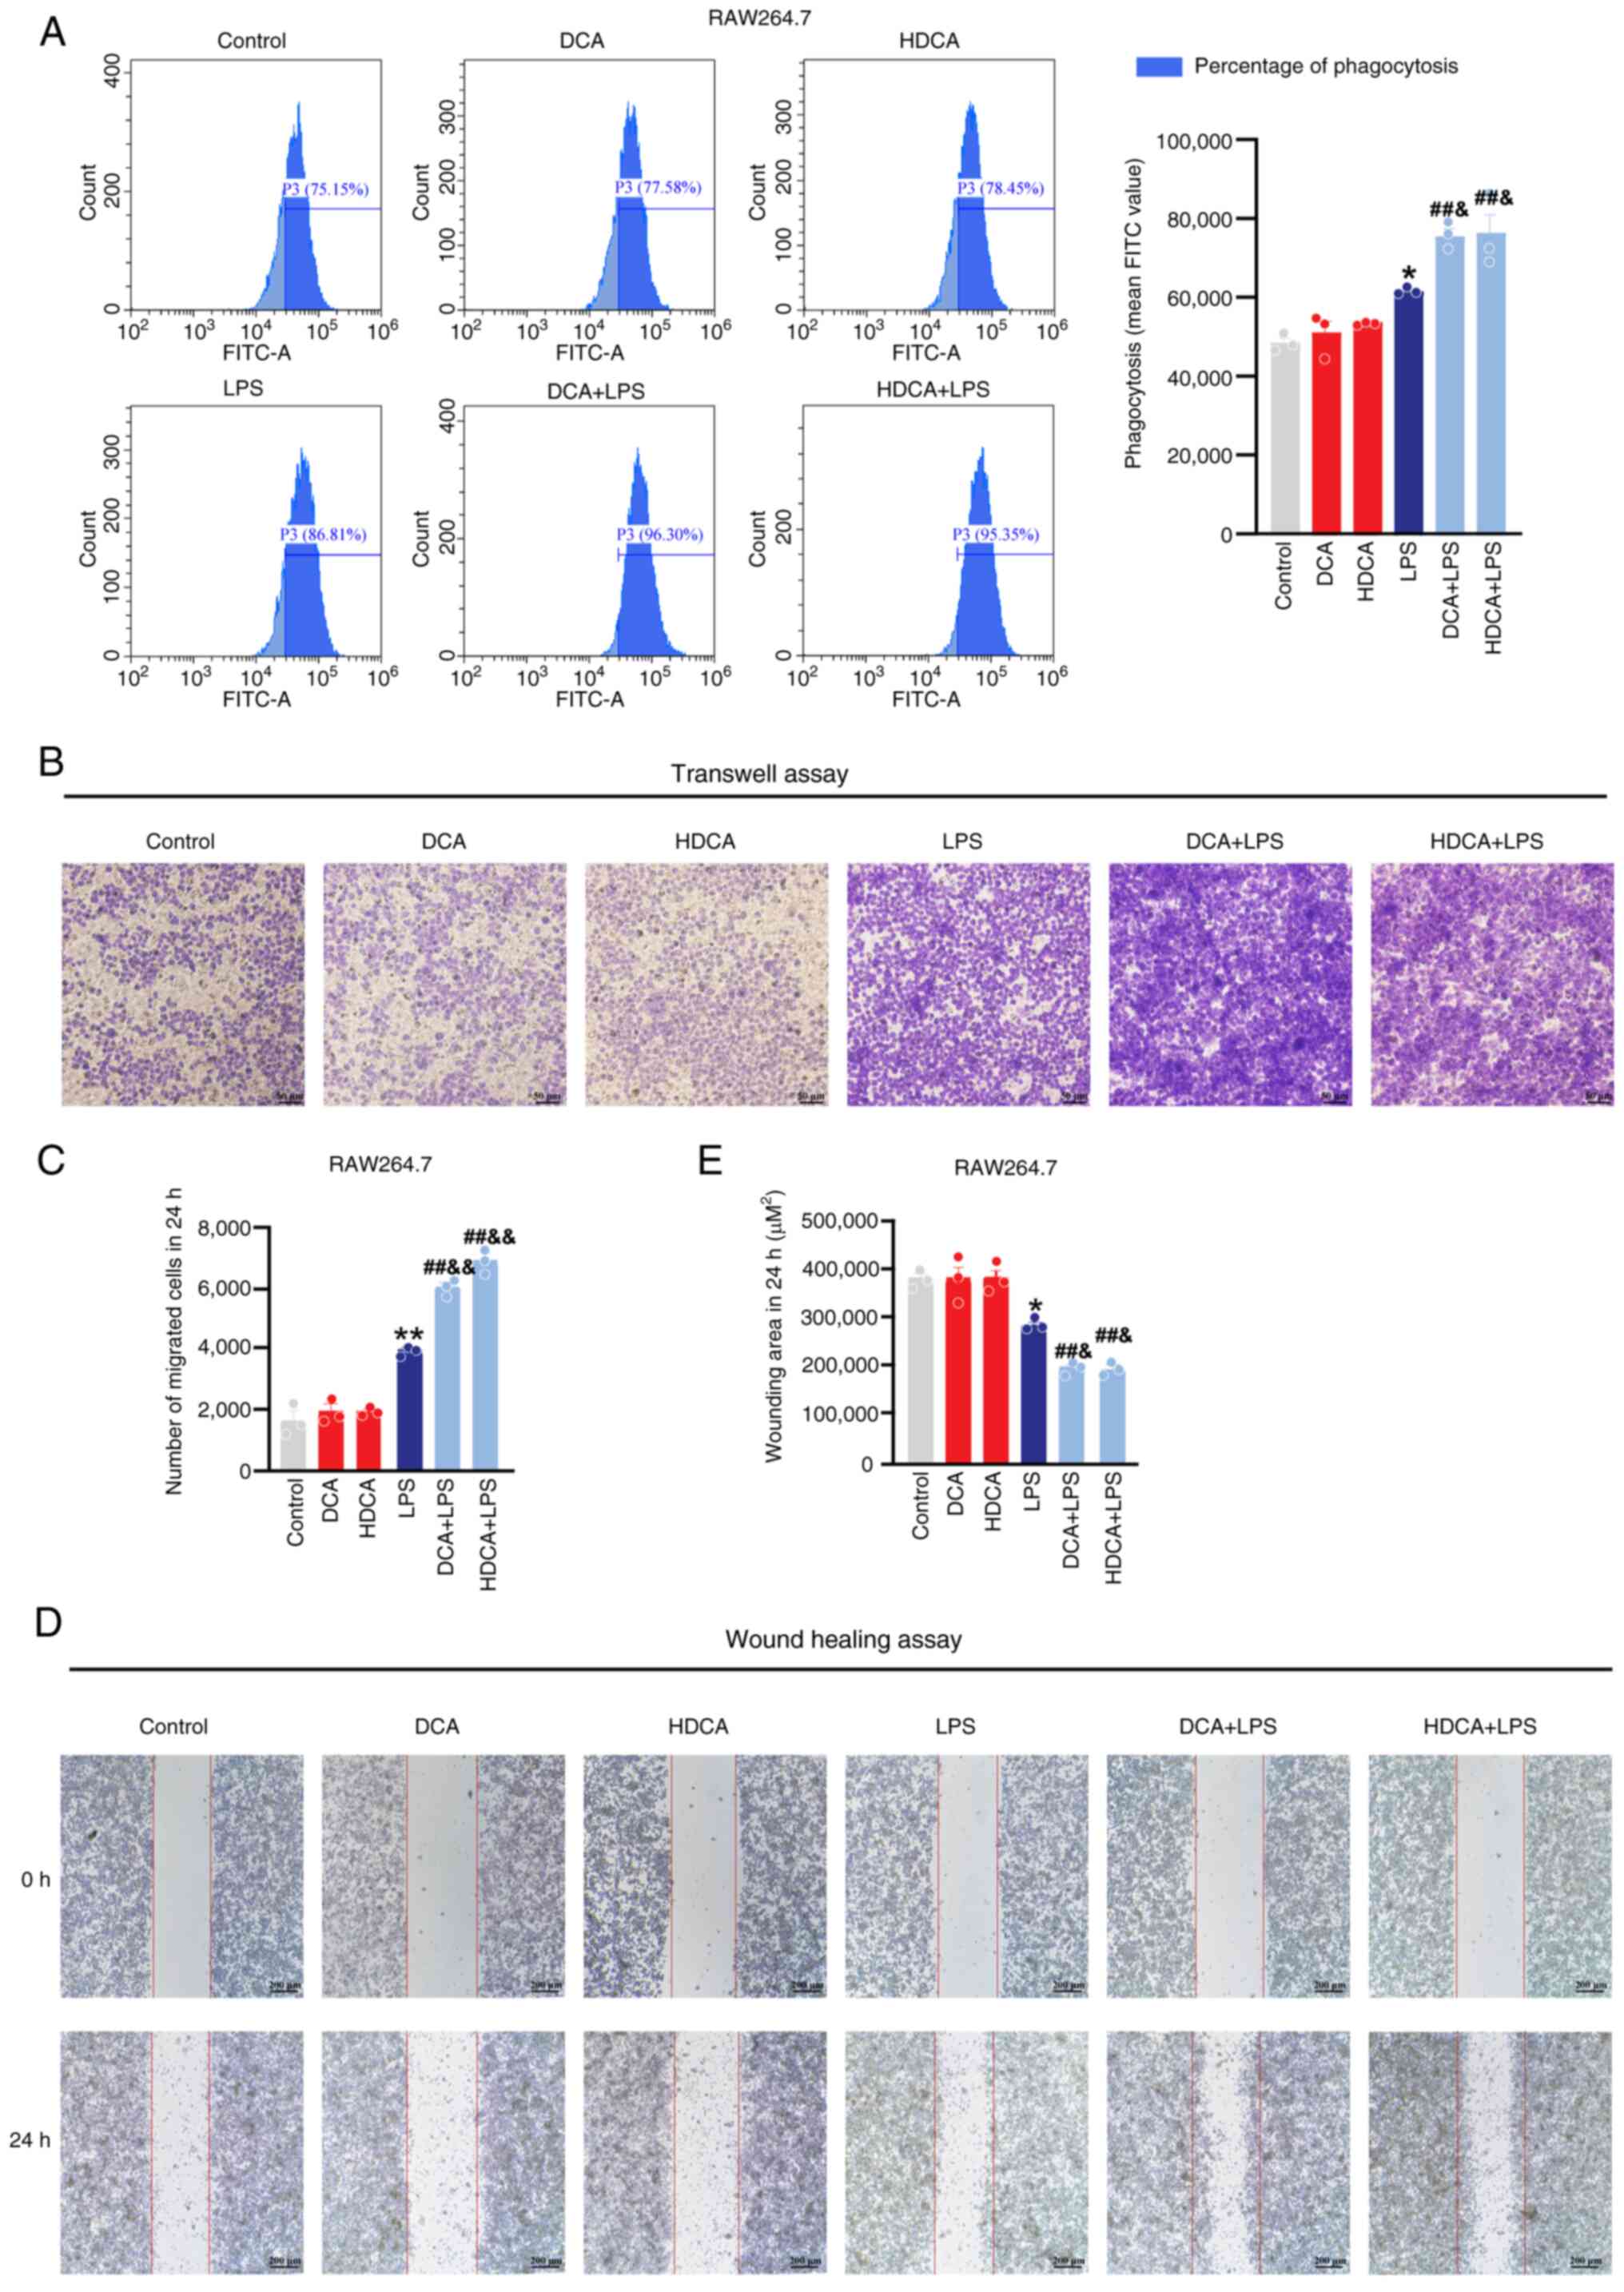
Flow cytometry and migration assays were used to
evaluate macrophage phagocytosis and migration, and to further
assess the effect of bile acids on macrophage function. The flow
cytometry results showed that macrophage phagocytosis was enhanced
after LPS stimulation, and DCA and HDCA further enhanced the
LPS-induced phagocytosis compared with LPS stimulation alone; DCA
or HDCA treatment alone had no effect in RAW264.7 cells (Fig. 7A). Meanwhile, the wound healing and
Transwell assays showed a significant increase in the migration
capacity of RAW264.7 cells after LPS stimulation, which was further
enhanced by DCA or HDCA, although neither HDCA nor DCA treatment
alone showed a significant effect on the migration behaviour of
macrophages (Fig. 7B-E). In THP-1
cells, the effects of DCA and HDCA on phagocytosis and migration
were consistent with those in RAW264.7 cells (Fig. 8). These results suggest that DCA or
HDCA alone did not affect the phagocytosis and migration of
macrophages but enhanced the LPS-induced induction of phagocytosis
and migration when used in combination with LPS.
DCA and HDCA enhance LPS-induced NF-κB
activation
NF-κB activation is essential for functions such as
M1 polarisation and inflammatory factor secretion by macrophages
(8). To further validate the
effect of bile acids on the NF-κB signalling pathway in
macrophages, the expression levels of proteins related to the NF-κB
signalling pathway were analysed. First, the expression of IκBα and
p-IκBα was assessed by western blotting; IκBα expression decreased
and p-IκBα expression increased in RAW264.7 and THP-1 cells after
LPS stimulation. DCA and HDCA stimulation alone had no significant
effect on the expression of IκBα and p-IκBα, but after
co-stimulation with LPS, the expression of IκBα in RAW264.7 and
THP-1 cells was further decreased, while the expression of p-IκBα
was further elevated compared with LPS stimulation alone (Fig. 9A-D). This suggested that DCA and
HDCA act synergistically with LPS and reduce the binding of IκBα to
p65 in the cytoplasm and promote the translocation of p65 into the
nucleus. To test this hypothesis, the expression of p65 in the
nucleus was analysed using histone H3 as an internal reference. DCA
and HDCA acted synergistically with LPS to increase the expression
of p65 in the nucleus (Fig. 9A-D).
In addition, immunofluorescence experiments confirmed the
phenomenon (Fig. 9E-H).
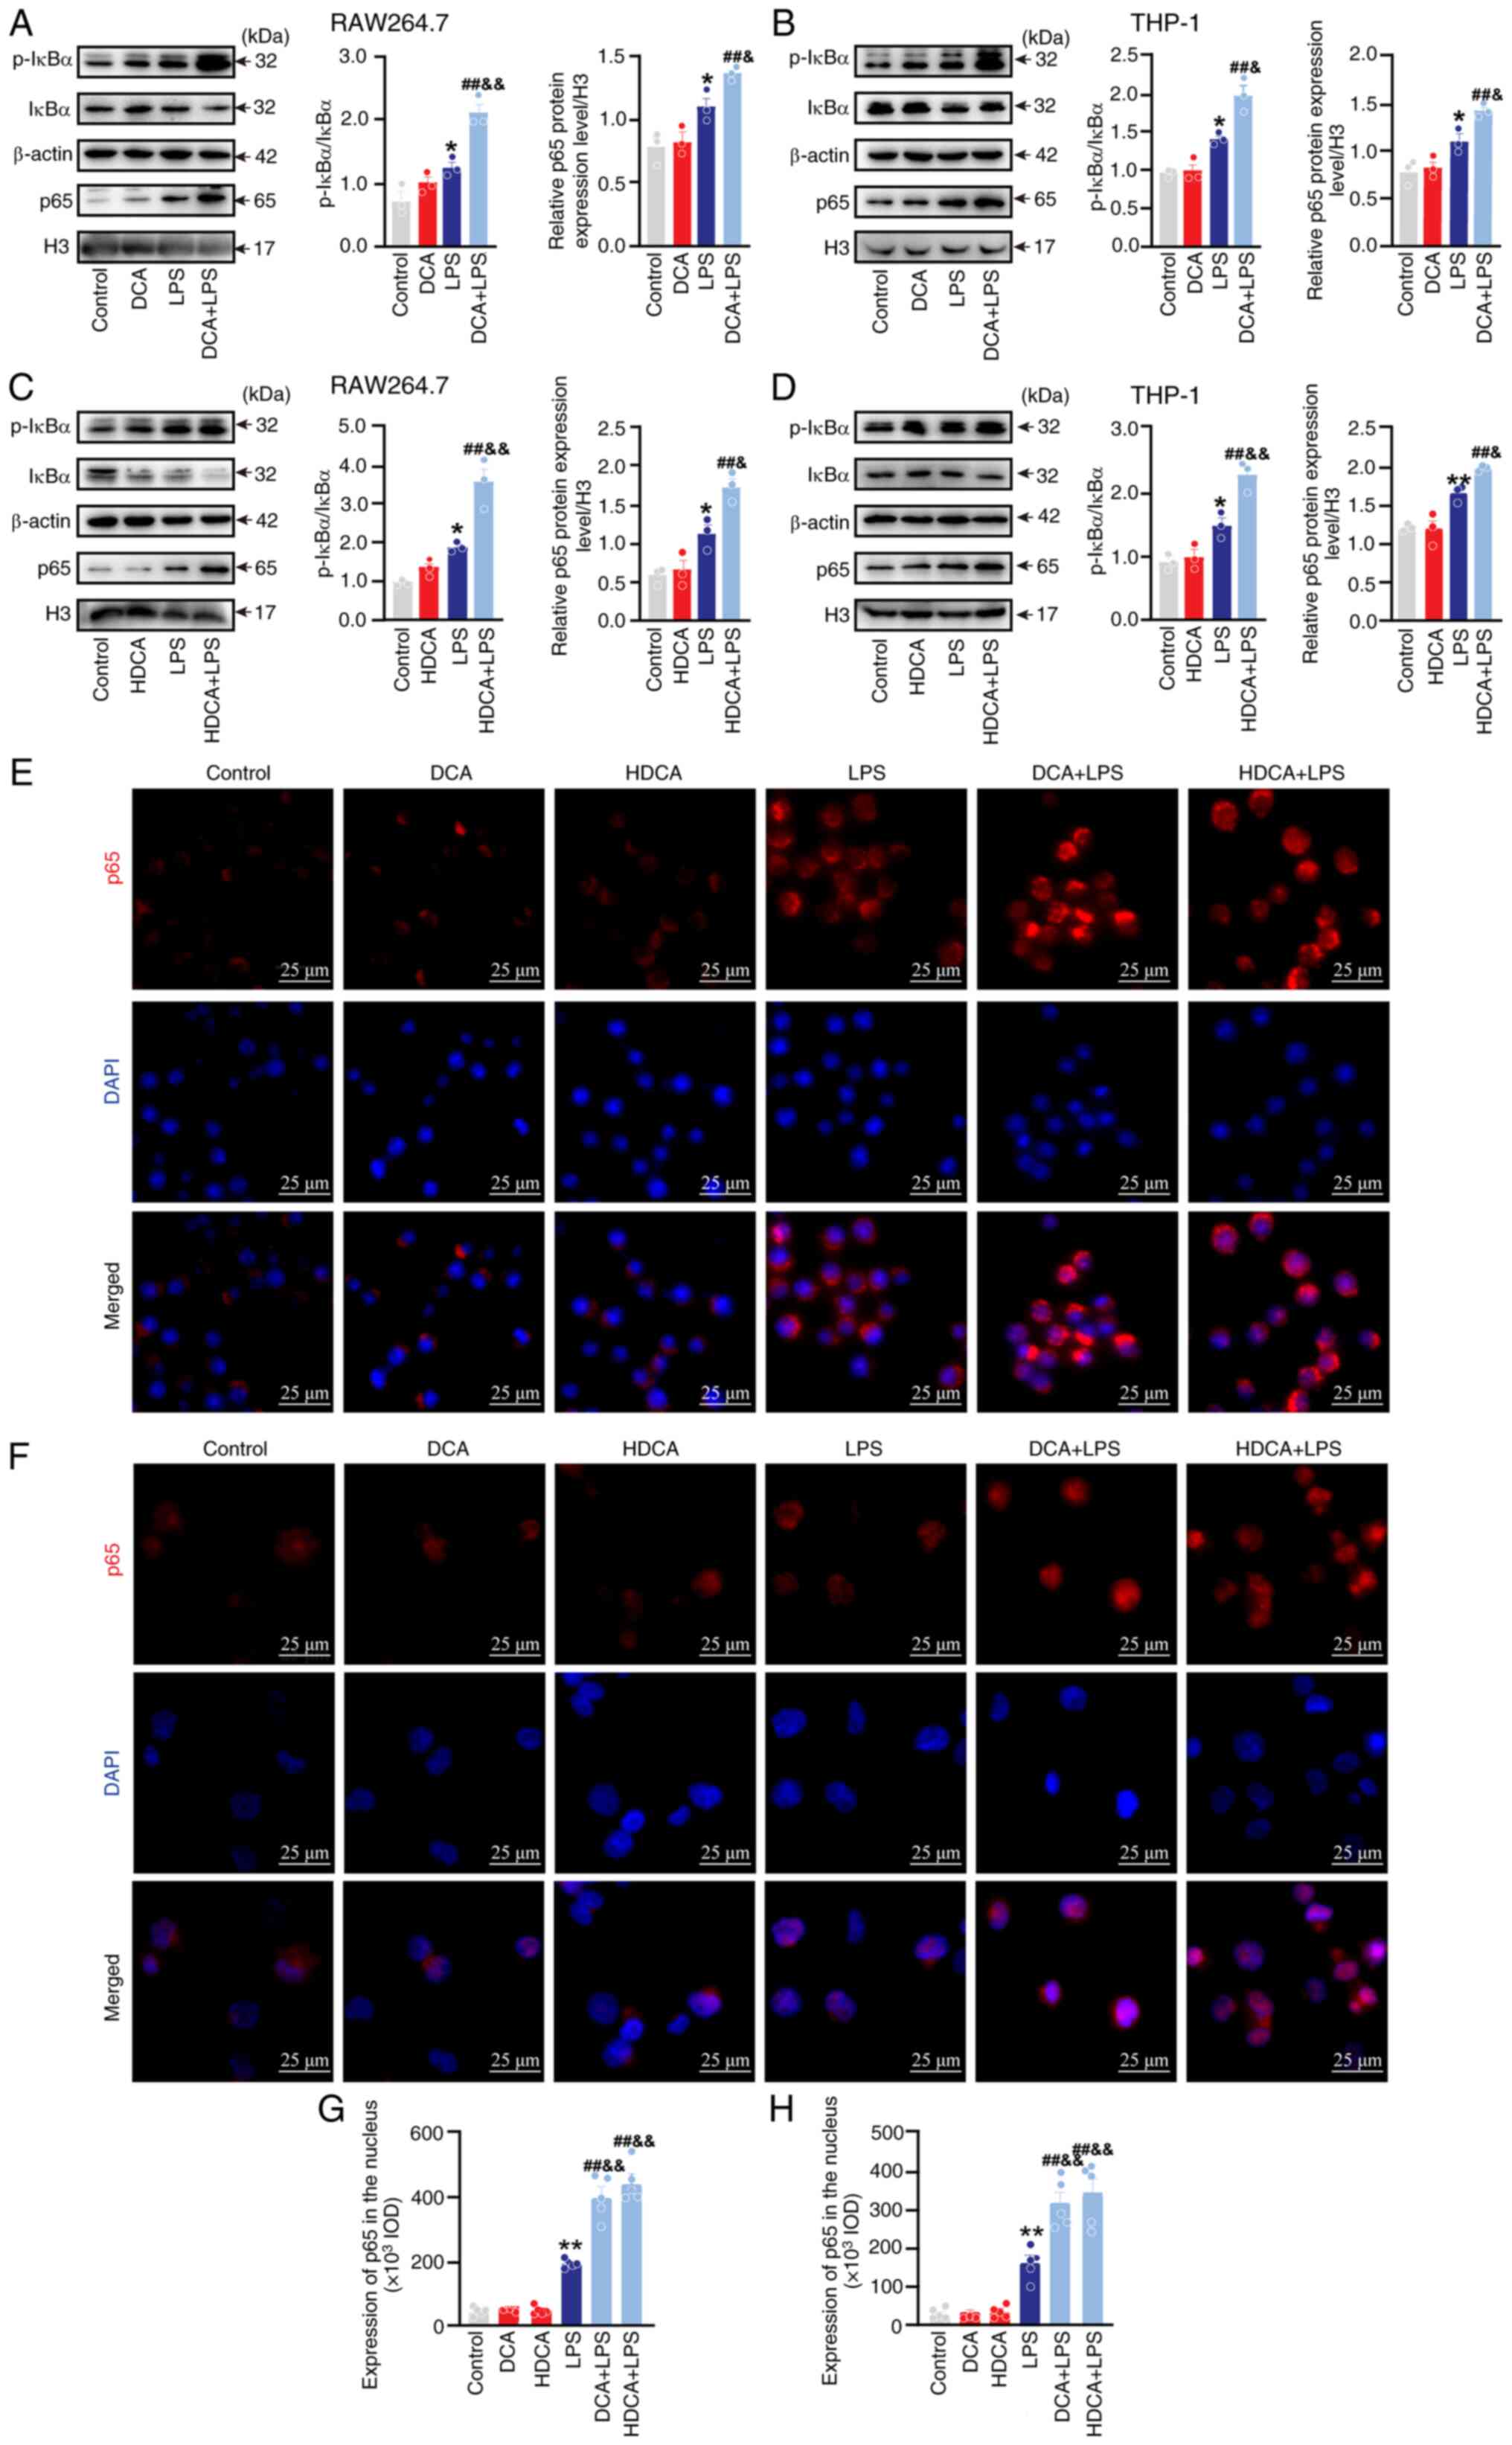 | Figure 9.Effect of DCA or HDCA on macrophage
NF-κB activation. (A) Effect of DCA on p65, IκBα and p-IκBα protein
expression in RAW264.7 cells assessed by western blotting. (B)
Effect of DCA on p65, IκBα and p-IκBα protein expression in THP-1
cells assessed by western blotting. (C) Effect of HDCA on p65, IκBα
and p-IκBα protein expression in RAW264.7 cells assessed by western
blotting. (D) Effect of HDCA on p65, IκBα and p-IκBα protein
expression in THP-1 cells assessed by western blotting. (E)
Immunofluorescence detection of the effect of DCA and HDCA on p65
expression in RAW264.7 cells (scale bar, 25 µm). (F)
Immunofluorescence detection of the effect of DCA and HDCA on p65
expression in THP-1 cells (scale bar, 25 µm). (G) Quantitative
analysis of p65 in the nucleus of RAW264.7. (H) Quantitative
analysis of p65 in the nucleus of THP-1. The stimulation
concentrations of DCA in RAW264.7 and THP-1 cells were 200 and 100
µM, respectively, while those of HDCA were 100 µM in both cell
lines. Data are expressed as mean ± SEM (n=5); **P<0.01,
*P<0.05 compared with the control group; ##P<0.01
compared with the DCA or HDCA group;
&&P<0.01, &P<0.05 compared
with the LPS group. p-, phosphorylated; DCA, deoxycholic acid;
HDCA, hyodeoxycholic acid; inducible nitric oxide synthase; LPS,
lipopolysaccharide; H3, histone 3; IOD, integrated optical
density. |
Discussion
Patients with cirrhosis are at a higher risk of
infection, with the incidence of bacterial infections reaching as
high as 32–34% (27). While nearly
two thirds of patients with cirrhosis face the threat of sepsis,
the complications associated with infection lead to a 3-fold
increase in mortality in patients with cirrhosis and 50% of
inpatients die (27). The
compromised intestinal barrier and the presence of
microbiota-derived LPS in patients with cirrhosis dysregulate
macrophage function and disrupt immune homeostasis, thereby
heightening the susceptibility to infections (3,6,7).
Macrophages play crucial roles in phagocytosis, antigen
presentation and the secretion of inflammatory factors. Reduced
macrophage efficacy in pathogen recognition and clearance is
strongly linked to the increased incidence of infections and
mortality in patients with cirrhosis (1,7,27).
However, the factors by which infection alter macrophage function
remain largely unknown.
In the present study, it was demonstrated that DCA
and HDCA were further dysregulated by infection in patients with
cirrhosis, while these two bile acids could act synergistically
with LPS to enhance macrophage polarisation, migration and
activation, accompanied by increased induction of proinflammatory
cytokines. A key finding of the present study is that infection
could further disturb bile acid homeostasis in patients with
cirrhosis. Bile acid synthesis, metabolism and transport are
impaired as cirrhosis progresses, making the bile acid profile a
potential biomarker of the disease (28,29).
Reportedly, levels of CDCA and CA are increased, while levels of
DCA are decreased in patients with cirrhosis compared with healthy
controls (13). In line with
previous studies, the results of the present study replicated the
differences in the bile acid profile observed between healthy
individuals and patients with cirrhosis (13,30).
Additionally, the present study revealed novel distinctions in the
bile acid profile between patients with cirrhosis, with or without
infection. There were differences in HDCA, DCA, GCDCA and TDCA,
among which the AUC for HDCA, DCA and TDCA was 0.769, 0.583 and
0.641, respectively, indicating a strong association between bile
acid levels and infection.
Another important finding of the present study is
the key role of HDCA and DCA, two of the bile acids altered by
infection, in modulating macrophage polarisation, migration and
function. Bile acids modulate various signal transduction pathways,
such as apoptosis, autophagy and stress management (31–35),
whereas several toxic bile acids act as potential damage-associated
molecular patterns (DAMPs) that regulate the immune system,
particularly macrophages, especially under infection or
proinflammatory conditions (36).
Taurine conjugates of DCA and CDCA were significantly elevated in
the serum, and these conjugates increase IL-1β expression in both
RAW264.7 and THP-1 cells in vitro (15). TCA promotes IL-4-induced M2-like
polarisation of bone marrow-derived macrophages in vitro,
and the mechanism may be related to gene expression of the
farnesoid X receptor (FXR), an important bile acid receptor
(37). TUDCA and taurolithocholic
acid inhibit LPS-induced iNOS expression in RAW264.7 cells
potentially by activating Takeda G protein-coupled receptor 5
(TGR5) (38). These studies
suggest that bile acid metabolites act as proinflammatory DAMPs or
immunoregulators to regulate macrophage function. NF-κB stands out
as a pivotal transcription factor governing immunity and
inflammation regulation. Previous studies have shown that the role
of bile acids in the regulation of immune cells is closely related
to NF-κB (39–41). In the present study, a novel role
of HDCA and DCA in sensitising LPS-induced macrophage activation
was introduced, accompanied by enhanced NF-κB activation, while
HDCA and DCA treatment alone showed no significant effect. These
findings suggested that the progressive reduction of HDCA and DCA
in patients with cirrhosis at least partially contributes to the
impaired responsiveness of macrophages to LPS, thus increasing the
susceptibility of patients with cirrhosis to infection. By
contrast, another study demonstrated that DCA treatment alone for
24 h promoted M1 polarisation in RAW264.7 macrophages at least
partially through Toll-like receptor 2 transactivated by the M2
muscarinic acetylcholine receptor/Src pathway, but not in
association with activation of FXR and TGR5 (39). On the other hand, HDCA inhibited
LPS-induced inflammatory responses in BV2 cells via TGR5 (42). Similar to the results of the
present study, Li et al (43) found that HDCA plasma levels were
significantly lower in patients with sepsis and negatively
correlated with disease severity. However, HDCA acted as an
endogenous TLR4 antagonist and inhibited excessive macrophage
activation. In a mouse model of liver cancer, taurine-CA (T-CA),
tauro-β-muricholic acid and tauro-ω-muricholic acid levels
increased, and T-CA induced macrophage M2 polarisation (37). CDCA and TCDCA promote IL-1β and
IL-18 secretion through activation of the macrophage NLRP3
inflammasome, which is associated with FXR binding to NLRP3 and
reduced NLRP3 activity (15),
whereas low concentrations of CDCA induced FXR binding to the IL-6
promoter, which in turn reduced IL-6 expression in macrophages
(14). Thus, the effects of
different bile acids on macrophage phenotypes depends on the
experimental context.
While controversial, recent studies increasingly
suggest that bile acids influence macrophage function via
signalling regulated by their receptors, namely FXR or TGR5
(44). Bile acids exhibit
differing affinity for FXR or TGR5. The order of potency for
natural FXR agonists is CDCA > DCA > CA > LCA, with UDCA
acting as an antagonist (45).
Regarding the TGR5 agonistic potency, the order is LCA > DCA
> CDCA > CA (45).
Additionally, other signalling molecules such as reactive oxygen
species and mitofusin 2 may play a role (46,47).
This may explain the varied effects of different bile acids on
macrophages. Furthermore, differences in the origin of macrophages
and the methods used to induce polarisation contribute to the
diverse experimental outcomes (48,49).
Thus, in the presence of multiple bile acid changes in vivo,
the effect of bile acids on macrophage function could become
complex. Further investigation is necessary to fully assess the
roles of bile acids on the immune status.
Bile acid production is intricately regulated by a
variety of metabolic enzymes, transporters and intestinal flora. As
secondary bile acids, DCA and HDCA are derived from CA and CDCA,
respectively, through bacterial metabolism in the intestine
(45). The CA and CDCA levels
gradually increase in patients with cirrhosis, with or without
infection, indicating a decrease in DCA and HDCA production likely
due to disturbances in the intestinal flora (45). Intestinal flora disorders are well
recognised in patients with cirrhosis, with recent studies
implicating intestinal flora and their metabolites as causative
factors of infections in this population (50). Restoring intestinal flora
homeostasis through supplementation with beneficial bacterial
strains holds promise as a therapeutic approach for patients with
cirrhosis and infectious complications (51,52).
The findings of the present study also suggest the potential of
supplementing bile-acid-metabolising flora, although additional
studies are needed to elucidate the specific flora involved in DCA
or HDCA metabolism in infected states. This will necessitate
conducting 16S rRNA sequencing and macrogenomic sequencing of the
gut flora of clinical patients to comprehensively assess the
composition and function of the gut flora in patients with
cirrhosis under infectious conditions, along with their
associations with DCA or HDCA metabolism. Additionally, further
exploration of the potential of transplanting flora associated with
DCA or HDCA metabolism in preventing and treating infections in
patients with cirrhosis is warranted.
The limitations of the present study include the
lack of statistical significance regarding the levels of certain
bile acid species, attributed to substantial individual variations
in bile acids and the small sample size of patients with cirrhosis.
Due to ethical requirements, the serum from patients mentioned in
the manuscript was discarded specimens after clinical testing in
2020 and analysis of bile acid profiles was completed in 2021.
Introducing new patient samples would necessitate a fresh ethical
review. Furthermore, detection errors in the bile acid profile
assay from different test lots prevent the presentation of data
from additional clinical patients. Moreover, the diverse factors
related to infection and antibiotic utilization in various cohorts
of patients with cirrhosis may introduce confounding variables,
potentially influencing bias in bile acid profiles. Therefore,
further subgroup studies with larger sample sizes are indispensable
to validate the credibility of the observations of the present
study. In addition, direct assessment of macrophage function in
patients with cirrhosis, with or without infection is crucial to
elucidate the role of bile acids in regulating macrophage function
under clinically complex conditions. Regrettably, the inability to
collect anticoagulated whole blood from the patients in the present
study impeded further exploration in this area. This underscores
the necessity for more comprehensive clinical studies to delve
deeper into this aspect. Building on this foundation, a dynamic
evaluation of changes in bile acids and macrophage function would
be more conducive to elucidating the underlying mechanisms and
identifying potential biomarkers. Moreover, the downstream
signalling pathways by which DCA and HDCA regulate macrophage
function require elucidation. Recent literature has highlighted the
crucial role of bile acids in governing mitochondrial homeostasis
(53,54). Given the pivotal significance of
energy metabolism in upholding macrophage viability (55), a comprehensive investigation into
how DCA or HDCA influences macrophage function through the
modulation of mitochondrial energy metabolism presents a promising
avenue for elucidating their mechanisms of action. The available
evidence suggests that bile acid-mediated regulation of
mitochondrial homeostasis is intricately linked to the downstream
signals of TGR5, prominently involving protein kinase C and the
mitochondrial calcium signaling pathway IP3R1-GRP75-VDAC1 (56,57).
This emphasizes the existence of a sophisticated signaling
regulatory pathway between bile acids and mitochondria. Hence,
additional experiments are necessary to thoroughly investigate the
relationship among different types of bile acids, mitochondrial
metabolism and macrophage function.
In summary, in the present study it was found that
the bile acid profiles of patients with cirrhosis and infection
were altered compared with patients with cirrhosis but without
infection, with significantly lower levels of HDCA, DCA, TDCA and
GUDCA, and higher levels of GCDCA, TCDCA and TCA. Among these bile
acids, HDCA and DCA were closely related to the occurrence of
infection. Notably, HDCA and DCA increased macrophage sensitivity
to LPS stimulation. An infection-induced decrease in HDCA and DCA
may impair the sensitivity of macrophages to LPS stimulation, which
partially explains the infection-induced vulnerability of patients
with cirrhosis to immune disorders and death. However, changes in
other bile acids or factors may also contribute, which cannot be
neglected. These findings suggest that the bile acid profile,
particularly the HDCA and DCA levels, may be potential biomarkers
for patients with cirrhosis and infection, although their roles and
mechanisms of action on the immune system still need to be explored
further. Assessing the DCA and HDCA levels in patients with
cirrhosis may provide insights into the risk of infection and
prognosis. Additionally, restoring metabolic homeostasis of bile
acids through supplementation of beneficial flora holds promise as
a potential therapeutic strategy to address the infectious
complications associated with cirrhosis.
Supplementary Material
Supporting Data
Supporting Data
Acknowledgements
The authors would like to thank Dr Yuan Che, Dr
Shuang Cui and Dr Chujie Ding (China Pharmaceutical University,
Jiangsu, China) for providing technical assistance.
Funding
This study was financially supported by grants from the National
Nature Science Foundation of China (grant no. 82204703), National
Nature Science Foundation of Anhui Province (grant no.
2008085MH287), Anhui Province Traditional Chinese Medicine
Inheritance and Innovation Scientific Research Project (grant no.
2020cczd03), Natural Science Foundation of Anhui Medical University
(grant no. 2022×kj158) and The Beijing Kangmeng Charity Foundation
Medical Research Development Fund Project (grant no. HS202007).
Availability of data and materials
The data generated in the present study may be
requested from the corresponding author.
Authors' contributions
CG and YS designed the study; QZ collected the serum
from the patients; CG tested the levels of bile acid; YS, QZ, QW
and MJ performed the western blotting, RT-qPCR and flow cytometry
experiments; XZ, YD and JW performed the immunofluorescence, wound
healing and Transwell experiments; and XW completed the statistical
analysis of the data and the production of the graphs. YS and CG
confirm the authenticity of all the raw data. All authors read and
approved the final version of the manuscript.
Ethics approval and consent to
participate
The study was approved by The Ethics Committee of
The First Affiliated Hospital of Anhui Medical University (approval
no. PJ2020-13-07; Hefei, China) and was conducted in accordance
with the principles of the Declaration of Helsinki (2008). All
patients provided written informed consent before enrollment in the
study.
Patient consent for publication
Not applicable.
Competing interests
The authors declare that they have no competing
interests.
References
|
1
|
Wilde B and Katsounas A: Immune
dysfunction and albumin-related immunity in liver cirrhosis.
Mediators Inflamm. 2019:75376492019. View Article : Google Scholar : PubMed/NCBI
|
|
2
|
Ginès P, Krag A, Abraldes JG, Solà E,
Fabrellas N and Kamath PS: Liver cirrhosis. Lancet. 398:1359–1376.
2021. View Article : Google Scholar : PubMed/NCBI
|
|
3
|
Irvine KM, Ratnasekera I, Powell EE and
Hume DA: Causes and consequences of innate immune dysfunction in
cirrhosis. Front Immunol. 10:2932019. View Article : Google Scholar : PubMed/NCBI
|
|
4
|
Haidar G and Singh N: The evolving
challenge of infections in cirrhosis. N Engl J Med. 385:1150–1151.
2021. View Article : Google Scholar : PubMed/NCBI
|
|
5
|
Fernández J, Piano S, Bartoletti M and Wey
EQ: Management of bacterial and fungal infections in cirrhosis: The
MDRO challenge. J Hepatol. 75 (Suppl 1):S101–S117. 2021. View Article : Google Scholar : PubMed/NCBI
|
|
6
|
Albillos A, Lario M and Álvarez-Mon M:
Cirrhosis-associated immune dysfunction: Distinctive features and
clinical relevance. J Hepatol. 61:1385–1396. 2014. View Article : Google Scholar : PubMed/NCBI
|
|
7
|
Noor MT and Manoria P: Immune dysfunction
in cirrhosis. J Clin Transl Hepatol. 5:50–58. 2017.PubMed/NCBI
|
|
8
|
Yunna C, Mengru H, Lei W and Weidong C:
Macrophage M1/M2 polarization. Eur J Pharmacol. 877:1730902020.
View Article : Google Scholar : PubMed/NCBI
|
|
9
|
Geiß C, Salas E, Guevara-Coto J,
Régnier-Vigouroux A and Mora-Rodriguez RA: Multistability in
macrophage activation pathways and metabolic implications. Cells.
11:4042022. View Article : Google Scholar
|
|
10
|
Van der Merwe S, Chokshi S, Bernsmeier C
and Albillos A: The multifactorial mechanisms of bacterial
infection in decompensated cirrhosis. J Hepatol. 75 (Suppl
1):S82–S100. 2021. View Article : Google Scholar : PubMed/NCBI
|
|
11
|
Jia W, Xie G and Jia W: Bile
acid-microbiota crosstalk in gastrointestinal inflammation and
carcinogenesis. Nat Rev Gastroenterol Hepatol. 15:111–128. 2018.
View Article : Google Scholar : PubMed/NCBI
|
|
12
|
Balazs I, Horvath A, Leber B, Feldbacher
N, Sattler W, Rainer F, Fauler G, Vermeren S and Stadlbauer V:
Serum bile acids in liver cirrhosis promote neutrophil dysfunction.
Clin Transl Med. 12:e7352022. View Article : Google Scholar : PubMed/NCBI
|
|
13
|
Zhou J, Huang N, Guo Y, Cui S, Ge C, He Q,
Pan X, Wang G, Wang H and Hao H: Combined obeticholic acid and
apoptosis inhibitor treatment alleviates liver fibrosis. Acta Pharm
Sin B. 9:526–536. 2019. View Article : Google Scholar : PubMed/NCBI
|
|
14
|
Cao S, Meng X, Li Y, Sun L, Jiang L, Xuan
H and Chen X: Bile acids elevated in chronic periaortitis could
activate farnesoid-X-receptor to suppress IL-6 production by
macrophages. Front Immunol. 12:6328642021. View Article : Google Scholar : PubMed/NCBI
|
|
15
|
Hao H, Cao L, Jiang C, Che Y, Zhang S,
Takahashi S, Wang G and Gonzalez FJ: Farnesoid X receptor
regulation of the NLRP3 inflammasome underlies
cholestasis-associated sepsis. Cell Metab. 25:856–867.e5. 2017.
View Article : Google Scholar : PubMed/NCBI
|
|
16
|
Yoshiji H, Nagoshi S, Akahane T, Asaoka Y,
Ueno Y, Ogawa K, Kawaguchi T, Kurosaki M, Sakaida I, Shimizu M, et
al: Evidence-based clinical practice guidelines for liver cirrhosis
2020. J Gastroenterol. 56:593–619. 2021. View Article : Google Scholar : PubMed/NCBI
|
|
17
|
European Association for the Study of the
Liver, . EASL clinical practice guidelines on the management of
ascites, spontaneous bacterial peritonitis, and hepatorenal
syndrome in cirrhosis. J Hepatol. 53:397–417. 2010. View Article : Google Scholar : PubMed/NCBI
|
|
18
|
Aithal GP, Palaniyappan N, China L,
Härmälä S, Macken L, Ryan JM, Wilkes EA, Moore K, Leithead JA,
Hayes PC, et al: Guidelines on the management of ascites in
cirrhosis. Gut. 70:9–29. 2021. View Article : Google Scholar : PubMed/NCBI
|
|
19
|
Chinese Society of Hepatology Chinese
Medical Association, ; Xu X, Duan Z, Ding H, Li W, Jia J, Wei L,
Linghu E and Zhuang H: Chinese guidelines on the management of
ascites and its related complications in cirrhosis. Hepatol Int.
13:1–21. 2019. View Article : Google Scholar : PubMed/NCBI
|
|
20
|
Fuenzalida B, Yañez MJ, Mueller M, Mistry
HD, Leiva A and Albrecht C: Evidence for hypoxia-induced
dysregulated cholesterol homeostasis in preeclampsia: Insights into
the mechanisms from human placental cells and tissues. FASEB J.
38:e234312024. View Article : Google Scholar : PubMed/NCBI
|
|
21
|
Buzzetti E, Parikh PM, Gerussi A and
Tsochatzis E: Gender differences in liver disease and the drug-dose
gender gap. Pharmacol Res. 120:97–108. 2017. View Article : Google Scholar : PubMed/NCBI
|
|
22
|
Durand F and Valla D: Assessment of the
prognosis of cirrhosis: Child-Pugh versus MELD. J Hepatol. 42
(Suppl):S100–S107. 2005. View Article : Google Scholar : PubMed/NCBI
|
|
23
|
Qamar AA, Grace ND, Groszmann RJ,
Garcia-Tsao G, Bosch J, Burroughs AK, Ripoll C, Maurer R, Planas R,
Escorsell A, et al: Incidence, prevalence, and clinical
significance of abnormal hematologic indices in compensated
cirrhosis. Clin Gastroenterol Hepatol. 7:689–695. 2009. View Article : Google Scholar : PubMed/NCBI
|
|
24
|
Deng W, Rao J, Chen X, Li D, Zhang Z, Liu
D, Liu J, Wang Y and Huang O: Metabolomics study of serum and urine
samples reveals metabolic pathways and biomarkers associated with
pelvic organ prolapse. J Chromatogr B Analyt Technol Biomed Life
Sci. 1136:1218822020. View Article : Google Scholar : PubMed/NCBI
|
|
25
|
Xia L, Zhang C, Lv N, Liang Z, Ma T, Cheng
H, Xia Y and Shi L: AdMSC-derived exosomes alleviate acute lung
injury via transferring mitochondrial component to improve
homeostasis of alveolar macrophages. Theranostics. 12:2928–2947.
2022. View Article : Google Scholar : PubMed/NCBI
|
|
26
|
Weber M, Lutz R, Olmos M, Glajzer J, Baran
C, Nobis CP, Möst T, Eckstein M, Kesting M and Ries J: Beyond
PD-L1-identification of further potential therapeutic targets in
oral cancer. Cancers (Basel). 14:18122022. View Article : Google Scholar : PubMed/NCBI
|
|
27
|
Bonnel AR, Bunchorntavakul C and Reddy KR:
Immune dysfunction and infections in patients with cirrhosis. Clin
Gastroenterol Hepatol. 9:727–738. 2011. View Article : Google Scholar : PubMed/NCBI
|
|
28
|
Garrido A, Kim E, Teijeiro A, Sánchez
Sánchez P, Gallo R, Nair A, Matamala Montoya M, Perna C, Vicent GP,
Muñoz J, et al: Histone acetylation of bile acid transporter genes
plays a critical role in cirrhosis. J Hepatol. 76:850–861. 2022.
View Article : Google Scholar : PubMed/NCBI
|
|
29
|
Rauchbach E, Zeigerman H, Abu-Halaka D and
Tirosh O: Cholesterol induces oxidative stress, mitochondrial
damage and death in hepatic stellate cells to mitigate liver
fibrosis in mice model of NASH. Antioxidants (Basel). 11:5362022.
View Article : Google Scholar : PubMed/NCBI
|
|
30
|
Aliwa B, Horvath A, Traub J, Feldbacher N,
Habisch H, Fauler G, Madl T and Stadlbauer V: Altered gut
microbiome, bile acid composition and metabolome in sarcopenia in
liver cirrhosis. J Cachexia Sarcopenia Muscle. 14:2676–2691. 2023.
View Article : Google Scholar : PubMed/NCBI
|
|
31
|
Bertolini A, Fiorotto R and Strazzabosco
M: Bile acids and their receptors: Modulators and therapeutic
targets in liver inflammation. Semin Immunopathol. 44:547–564.
2022. View Article : Google Scholar : PubMed/NCBI
|
|
32
|
Režen T, Rozman D, Kovács T, Kovács P,
Sipos A, Bai P and Mikó E: The role of bile acids in
carcinogenesis. Cell Mol Life Sci. 79:2432022. View Article : Google Scholar : PubMed/NCBI
|
|
33
|
Wang H, Ge C, Zhou J, Guo Y, Cui S, Huang
N, Yan T, Cao L, Che Y, Zheng Q, et al: Noncanonical farnesoid X
receptor signaling inhibits apoptosis and impedes liver fibrosis.
EBioMedicine. 37:322–333. 2018. View Article : Google Scholar : PubMed/NCBI
|
|
34
|
Thomas JP, Modos D, Rushbrook SM, Powell N
and Korcsmaros T: The emerging role of bile acids in the
pathogenesis of inflammatory bowel disease. Front Immunol.
13:8295252022. View Article : Google Scholar : PubMed/NCBI
|
|
35
|
Thibaut MM and Bindels LB: Crosstalk
between bile acid-activated receptors and microbiome in
entero-hepatic inflammation. Trends Mol Med. 28:223–236. 2022.
View Article : Google Scholar : PubMed/NCBI
|
|
36
|
Yan T, Yan N, Wang H, Yagai T, Luo Y,
Takahashi S, Zhao M, Krausz KW, Wang G, Hao H and Gonzalez FJ:
FXR-deoxycholic Acid-TNF-α axis modulates acetaminophen-induced
hepatotoxicity. Toxicol Sci. 181:273–284. 2021. View Article : Google Scholar : PubMed/NCBI
|
|
37
|
Sun R, Zhang Z, Bao R, Guo X, Gu Y, Yang
W, Wei J, Chen X, Tong L, Meng J, et al: Loss of SIRT5 promotes
bile acid-induced immunosuppressive microenvironment and
hepatocarcinogenesis. J Hepatol. 77:453–466. 2022. View Article : Google Scholar : PubMed/NCBI
|
|
38
|
Romero-Ramirez L, Garcia-Rama C, Wu S and
Mey J: Bile acids attenuate PKM2 pathway activation in
proinflammatory microglia. Sci Rep. 12:14592022. View Article : Google Scholar : PubMed/NCBI
|
|
39
|
Wang L, Gong Z, Zhang X, Zhu F, Liu Y, Jin
C, Du X, Xu C, Chen Y, Cai W, et al: Gut microbial bile acid
metabolite skews macrophage polarization and contributes to
high-fat diet-induced colonic inflammation. Gut Microbes. 12:1–20.
2020. View Article : Google Scholar
|
|
40
|
Pi Y, Wu Y, Zhang X, Lu D, Han D, Zhao J,
Zheng X, Zhang S, Ye H, Lian S, et al: Gut microbiota-derived
ursodeoxycholic acid alleviates low birth weight-induced colonic
inflammation by enhancing M2 macrophage polarization. Microbiome.
11:192023. View Article : Google Scholar : PubMed/NCBI
|
|
41
|
Mobraten K, Haugbro T, Karlstrom E,
Kleiveland CR and Lea T: Activation of the bile acid receptor TGR5
enhances LPS-induced inflammatory responses in a human monocytic
cell line. J Recept Signal Transduct Res. 35:402–409. 2015.
View Article : Google Scholar : PubMed/NCBI
|
|
42
|
Zhu H, Bai Y, Wang G, Su Y, Tao Y, Wang L,
Yang L, Wu H, Huang F, Shi H and Wu X: Hyodeoxycholic acid inhibits
lipopolysaccharide-induced microglia inflammatory responses through
regulating TGR5/AKT/NF-κB signaling pathway. J Psychopharmacol.
36:849–859. 2022. View Article : Google Scholar : PubMed/NCBI
|
|
43
|
Li J, Chen Y, Li R, Zhang X, Chen T, Mei
F, Liu R, Chen M, Ge Y, Hu H, et al: Gut microbial metabolite
hyodeoxycholic acid targets the TLR4/MD2 complex to attenuate
inflammation and protect against sepsis. Mol Ther. 31:1017–1032.
2023. View Article : Google Scholar : PubMed/NCBI
|
|
44
|
Fiorucci S, Biagioli M, Zampella A and
Distrutti E: Bile acids activated receptors regulate innate
immunity. Front Immunol. 9:18532018. View Article : Google Scholar : PubMed/NCBI
|
|
45
|
Cai J, Rimal B, Jiang C, Chiang JYL and
Patterson AD: Bile acid metabolism and signaling, the microbiota,
and metabolic disease. Pharmacol Ther. 237:1082382022. View Article : Google Scholar : PubMed/NCBI
|
|
46
|
Che Y, Xu W, Ding C, He T, Xu X, Shuai Y,
Huang H, Wu J, Wang Y, Wang C, et al: Bile acids target mitofusin 2
to differentially regulate innate immunity in physiological versus
cholestatic conditions. Cell Rep. 42:1120112023. View Article : Google Scholar : PubMed/NCBI
|
|
47
|
Liu J, Wei Y, Jia W, Can C, Wang R, Yang
X, Gu C, Liu F, Ji C and Ma D: Chenodeoxycholic acid suppresses AML
progression through promoting lipid peroxidation via ROS/p38
MAPK/DGAT1 pathway and inhibiting M2 macrophage polarization. Redox
Biol. 56:1024522022. View Article : Google Scholar : PubMed/NCBI
|
|
48
|
Vogel DY, Glim JE, Stavenuiter AW, Breur
M, Heijnen P, Amor S, Dijkstra CD and Beelen RH: Human macrophage
polarization in vitro: Maturation and activation methods compared.
Immunobiology. 219:695–703. 2014. View Article : Google Scholar : PubMed/NCBI
|
|
49
|
Li P, Hao Z, Wu J, Ma C, Xu Y, Li J, Lan
R, Zhu B, Ren P, Fan D and Sun S: Comparative proteomic analysis of
polarized human THP-1 and mouse RAW264.7 macrophages. Front
Immunol. 12:7000092021. View Article : Google Scholar : PubMed/NCBI
|
|
50
|
Bajaj JS and Khoruts A: Microbiota changes
and intestinal microbiota transplantation in liver diseases and
cirrhosis. J Hepatol. 72:1003–1027. 2020. View Article : Google Scholar : PubMed/NCBI
|
|
51
|
Liu J, Yang D, Wang X, Asare PT, Zhang Q,
Na L and Shao L: Gut microbiota targeted approach in the management
of chronic liver diseases. Front Cell Infect Microbiol.
12:7743352022. View Article : Google Scholar : PubMed/NCBI
|
|
52
|
Philips CA, Ahamed R, Abduljaleel JKP,
Rajesh S and Augustine P: Identification and analysis of gut
microbiota and functional metabolism in decompensated cirrhosis
with infection. J Clin Transl Hepatol. 11:15–25. 2023.PubMed/NCBI
|
|
53
|
Abrigo J, Olguin H, Tacchi F,
Orozco-Aguilar J, Valero-Breton M, Soto J, Castro-Sepúlveda M,
Elorza AA, Simon F and Cabello-Verrugio C: Cholic and deoxycholic
acids induce mitochondrial dysfunction, impaired biogenesis and
autophagic flux in skeletal muscle cells. Biol Res. 56:302023.
View Article : Google Scholar : PubMed/NCBI
|
|
54
|
Zhao Q, Dai MY, Huang RY, Duan JY, Zhang
T, Bao WM, Zhang JY, Gui SQ, Xia SM, Dai CT, et al: Parabacteroides
distasonis ameliorates hepatic fibrosis potentially via modulating
intestinal bile acid metabolism and hepatocyte pyroptosis in male
mice. Nat Commun. 14:18292023. View Article : Google Scholar : PubMed/NCBI
|
|
55
|
Chen Y, Yang M, Huang W, Chen W, Zhao Y,
Schulte ML, Volberding P, Gerbec Z, Zimmermann MT, Zeighami A, et
al: Mitochondrial metabolic reprogramming by CD36 signaling drives
macrophage inflammatory responses. Circ Res. 125:1087–1102. 2019.
View Article : Google Scholar : PubMed/NCBI
|
|
56
|
Li Y, Zhu L, Cai MX, Wang ZL, Zhuang M,
Tan CY, Xie TH, Yao Y and Wei TT: TGR5 supresses cGAS/STING pathway
by inhibiting GRP75-mediated endoplasmic reticulum-mitochondrial
coupling in diabetic retinopathy. Cell Death Dis. 14:5832023.
View Article : Google Scholar : PubMed/NCBI
|
|
57
|
Zhang MY, Zhu L, Zheng X, Xie TH, Wang W,
Zou J, Li Y, Li HY, Cai J, Gu S, et al: TGR5 activation ameliorates
mitochondrial homeostasis via regulating the PKCδ/Drp1-HK2
signaling in diabetic retinopathy. Front Cell Dev Biol.
9:7594212022. View Article : Google Scholar : PubMed/NCBI
|