Introduction
The cell surface marker CD133 (prominin 1) has long
been regarded as a classic signature of cancer stem cells (CSCs) in
glioblastomas (1,2). However, there has been controversy
surrounding the existence of brain tumor-initiating cells lacking
CD133 expression (3–7), as well as subpopulation heterogeneity in
CD133+ cells (8). For
convenience, CSCs are designated here as
CD133+-expressing cells of glioblastomas. Despite
conflicting views concerning their origin, evidence from previous
studies, including our own previous study, has revealed that the
endothelial progenitor cell (EPC) subpopulation in CSCs
(CD34+/CD133+ cells) has angiogenic potential
(9–12). Our previous study demonstrated that
this proportion of the CD34+/CD133+ EPC
subpopulation in CSCs varies among different tumor types, and that
EPCs are not oncogenic (9). In fact,
it is the non-EPC subpopulation in CSCs
(CD34−/CD133+ cells) that has oncogenic
potential (9). Therefore, it is of
interest to evaluate the fractions of these cell subpopulations in
CSCs from individual glioblastoma patients and to predict their
oncogenic and angiogenic potential.
Glioblastoma is a highly vascularized tumor. Glioma
contrast enhancement detected using magnetic resonance imaging
(MRI) may be due to angiogenesis, tumor cell proliferation and
blood-brain barrier disruption. Numerous studies have investigated
the correlation between characteristics identified by tumor imaging
and the molecular signatures of gliomas (13–15). Thus,
the finding of significant associations between molecular
characteristics and specific MRI tumor features may lead to the
establishment of a non-invasive method of predicting molecular
signatures that aids in selecting treatment options, or even in
predicting the prognosis of individual patients.
In this study, we examined the associations between
subpopulation fractions of CSCs and their MRI characteristics.
First, we tested whether contrast enhancement is associated with
EPC fractions in glioblastoma CSCs and then investigated whether
angiogenesis is influenced by EPC fractions. We observed that
non-EPC fractions in CSCs are associated with the proliferation and
contrast enhancement phenotype in glioblastomas.
Materials and methods
Study population
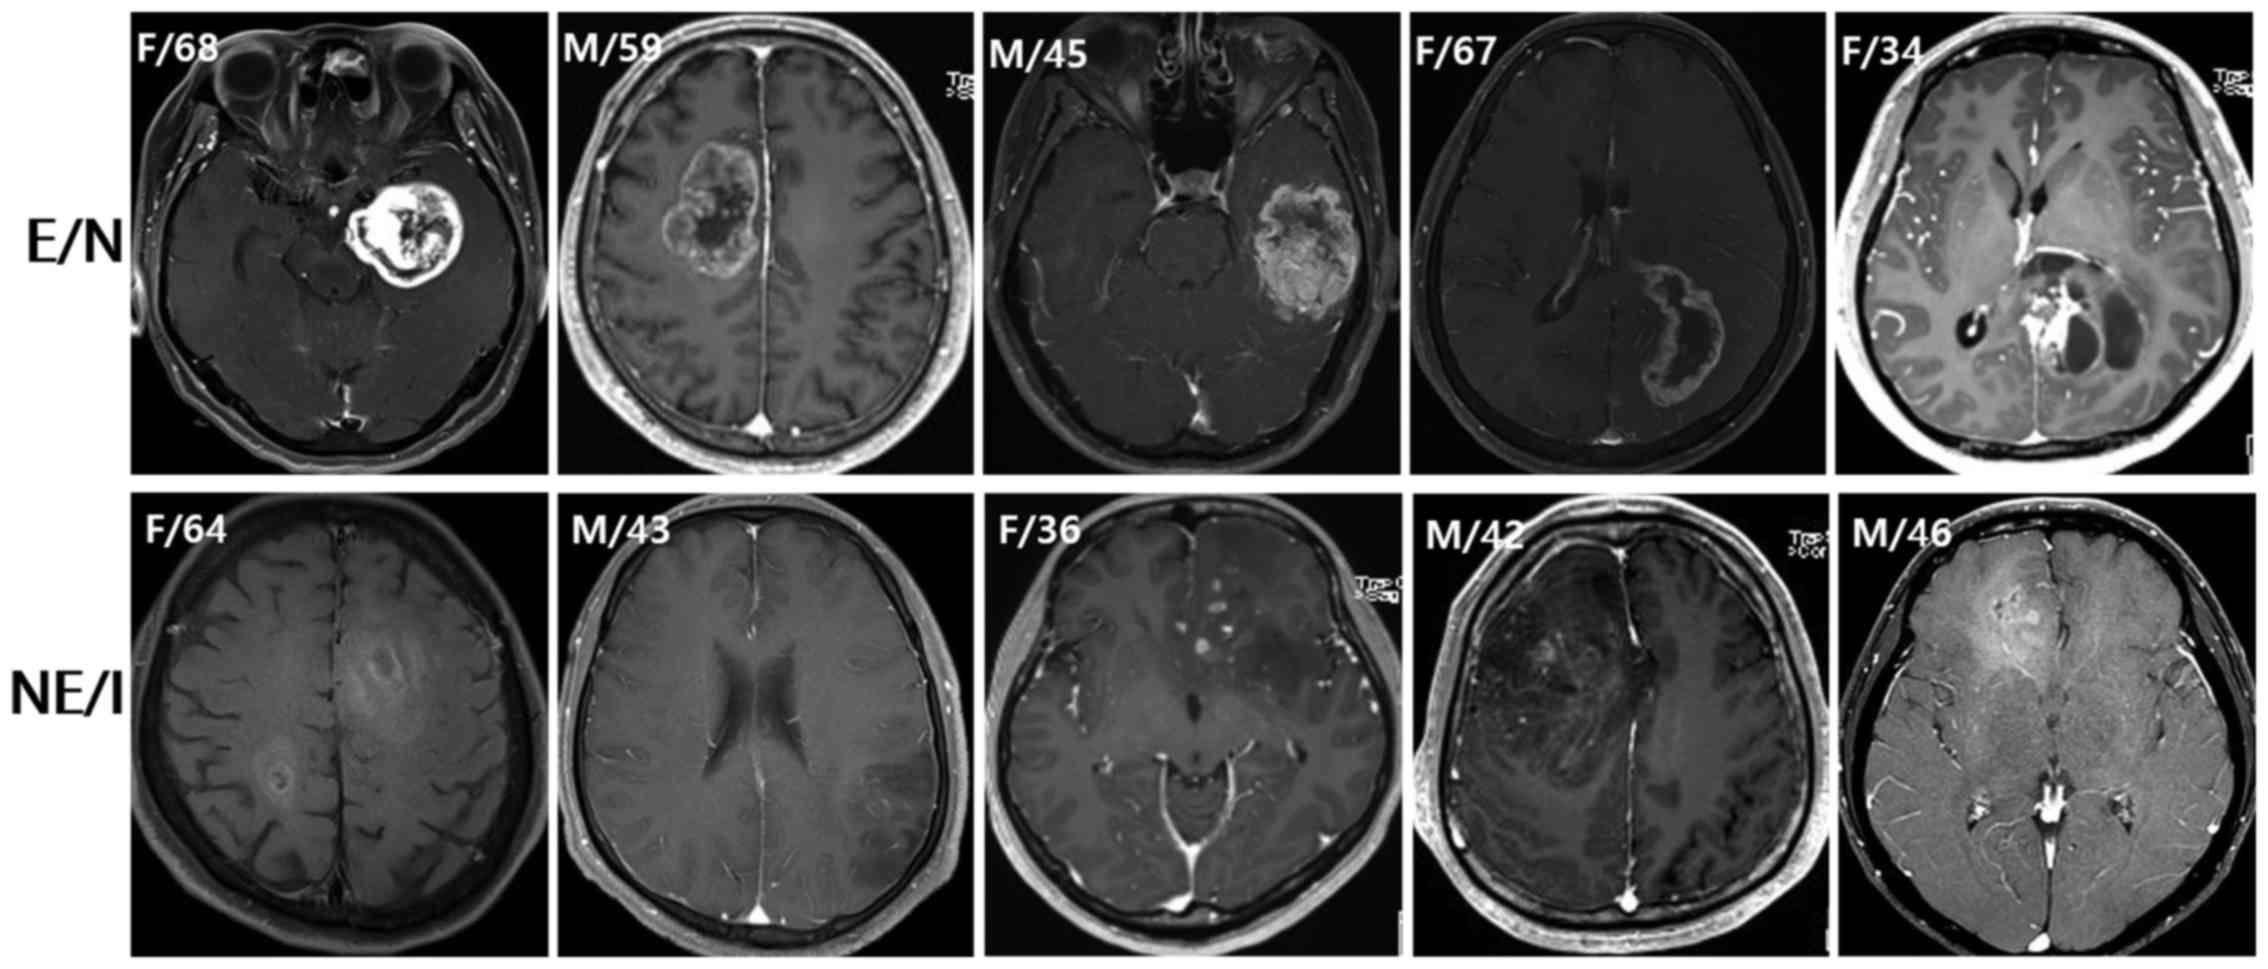
Ten patients with newly diagnosed glioblastoma were
selected from the Department of Neurosurgery database (Seoul
National University Hospital, Korea), according to the radiographic
characteristics. Based on preoperative MRIs demonstrating contrast
enhancement, necrosis and infiltrative patterns, patients were
classified into two groups: the enhancement/necrosis group (E/N,
n=5) and the non-enhancement/infiltration group (NE/I, n=5;
Fig. 1). For the E/N group, patients
were selected if they had the following MRI characteristics: a
contrast-enhancing volume exceeding 50% of the entire tumor volume;
the presence of necrosis; and minimal-high T2 signal intensity
areas around the contrast-enhancing and necrotic portions of the
tumor. For the NE/I group, patients were selected if they had the
following MRI characteristics: the absence of, or only patchy
(<5% of the entire tumor volume) enhancement in the tumor; no
evidence of necrosis; and an ill-defined margin of high T2 signal
intensity without the classic appearance of vasogenic edema. The
histological diagnosis of glioblastoma was confirmed in all cases
following surgery. The general characteristics of the patients and
molecular characteristics of their tumors are summarized in
Table I. This study was approved by
the Institutional Review Board of Seoul National University
Hospital, and patient consent was obtained.
 | Table I.Baseline information of the study
populations. |
Table I.
Baseline information of the study
populations.
| A,
Enhancement/necrosis group |
|---|
|
|---|
| Case | Gender/age | Extent of
resection | Pathology | MGMT promoter
methylation | IDH1 mutation | EGFR
amplification |
|---|
| 1 | F/68 | GTR | GBM (giant
cell) | Unmethylated | Wild-type | No |
| 2 | M/59 | GTR | GBM (gemistocytic
astrocytes) | Methylated | Wild-type | No |
| 3 | M/45 | GTR | GBM | Methylated | Wild-type | Yes |
| 4 | F/67 | NTR | GBM (small
cell) | Methylated | Wild-type | No |
| 5 | F/34 | STR | GBM
(oligodendroglial component) | Methylated | Mutation | No |
|
| B,
Non-enhancement/infiltration group |
|
| Case | Gender/age | Extent of
resection | Pathology | MGMT promoter
methylation | IDH1 mutation | EGFR
amplification |
|
| 6 | F/64 | STR | GBM (small
cell) | Methylated | Wild-type | Yes |
| 7 | M/43 | NTR | GBM (gemistocytic
astrocytes) | Methylated | Wild-type | No |
| 8 | F/36 | STR | GBM
(oligodendroglial component) | Methylated | Mutation | No |
| 9 | M/42 | GTR | GBM
(oligodendroglial component) | Methylated | Mutation | No |
| 10 | M/46 | GTR | GBM | Unmethylated | Wild-type | No |
Tissue samples
Tissue samples were obtained intra-operatively. A
number of tumor samples were snap-frozen in liquid nitrogen in the
operating room and stored at −80°C until subsequent use for
fluorescence-activated cell sorting (FACS) analyses. The remaining
tissue samples were fixed with formalin and embedded in paraffin
(FFPE). Using the FFPE samples, a tissue microarray was built for
immunohistochemistry (IHC) studies. Representative paraffin blocks
were selected and mounted on slides for hematoxylin and eosin
(H&E) staining. Cores from representative areas of each tumor
were marked on an H&E-stained tissue section and an original
donor block. Three 2-mm-diameter tissue cores were extracted from
the marked area of each donor block. A 4-µm-thick section was cut
from each array block.
Tissue FACS
Tissue FACS was performed as previously described,
with a few modifications (16). For
the dissociation of frozen tumor tissues, the tissues were washed
twice with sterile phosphate-buffered saline (PBS) and minced using
a steel blade. The tissues were enzymatically digested by
incubation with an enzyme cocktail (100 U/ml collagenase, 0.001
U/ml DNase1 and 2.4 U/ml dispase) for 1 h at 37°C and then filtered
through a Falcon® 40 µm cell strainer (cat. no. 352340;
Corning Life Sciences, Corning, NY, USA) to remove any clumps or
tissue debris. Red blood cells in the samples were removed by
incubation with Buffer EL (cat. no. 19075, Qiagen, Valencia, CA,
USA). Cells were re-suspended in Dulbecco's modified Eagle's medium
(DMEM; cat. no. LM001-05; Welgene Inc., Seoul, Korea), with 10%
Gibco® fetal bovine serum (FBS; cat. no. 12483-020;
Invitrogen Life Technologies, Carlsbad, CA, USA) and 1% Gibco
Antibiotic-Antimycotic (cat. no. 15240-060; Invitrogen Life
Technologies), and then incubated overnight at 37°C in humidified
atmosphere containing 5% carbon dioxide.
Specimens were washed twice with FACS buffer (PBS
containing 2% Gibco FBS (cat. no. 12483-020; Invitrogen Life
Technologies) and stained with pre-conjugated monoclonal antibodies
with allophycocyanin (APC)-conjugated CD133/2 antibody (cat. no.
130-090-854; 1:10; clone 293C3; Miltenyi Biotec, Bergisch Gladbach,
Germany) or fluorescein isothiocyanate (FITC)-conjugated CD34
antibody (cat. no. 130-081-001; 1:10; clone AC136; Miltenyi Biotec)
for 30 min at 4°C, and then washed twice with FACS buffer. Flow
cytometry analysis was performed on an LSRII (BD Biosciences, San
Jose, CA, USA), and forward light scatter and side scatter were
recorded using 100,000 cells. Data were analyzed using FlowJo
software (Tree Star Inc., Ashland, OR, USA).
Immunohistochemistry
IHC was performed as previously described, with a
few modifications (17,18). Briefly, tissue microarrays of human
glioblastoma samples were deparaffinized and rehydrated, and then
endogenous peroxidase activity was blocked with 3% hydrogen
peroxide in methanol for 5 min. Following incubation with a
universal blocking buffer (2% FBS in PBS) for 30 min to suppress
nonspecific binding, the array slides were coated with primary
antibodies [rabbit anti-CD133 (PROM1), 1:100, Abnova, Taipei,
Taiwan; goat anti-CD45 (N-19), 1:100, Santa Cruz Biotechnology,
Inc., Dallas, TX, USA; rabbit anti-vascular endothelial growth
factor receptor 1 (VEGFR1; Y103), 1:25, Abcam, Cambridge, MA, USA;
rabbit anti-VEGFR2 (EPRER16Y), 1:50, Abcam; rat anti-Notch1 (bTAN
20), 1:100, Abcam; mouse anti-integrin β4 (58XB4), 1:100, Abcam;
and rat anti-CD34 (QBEnd 10), 1:100, Dako, Glostrup, Denmark] for 1
h at room temperature. The detection system used was a Universal
Dako Labelled Streptavidin-Biotin2 system, Horseradish Peroxidase
(LSAB2 system, HRP) for CD133, VEGFR1, VEGFR2 and integrin β4, and
a VECTASTAIN Elite ABC kit for CD45, Notch1 and CD34.
All slides, except for CD34 [which used
3-amino-9-ethylcarbazole (product no. K346430; Dako) for 10 min],
were developed using 3,3′-diaminobenzidine (product no. S196730;
Dako) for 10 min, and each slide was counterstained with Mayer's
hematoxylin for 15 sec. Staining intensity was quantified using the
Aperio ImageScope (v12.0; Aperio Technologies, Vista, CA, USA)
positive pixel count algorithm in 10 random fields (250×250 µm)
from each slide (19). IHC staining
results were semiquantitatively graded as follows: no staining
detected (0, no positive tumor cells), faint staining (1+, <10%
positive tumor cells), moderate staining (2+, 10–50% positive tumor
cells), and strong staining (3+, >50% positive tumor cells). In
the case of the proliferation index assessed using antibody Ki-67,
positive staining was defined as 2+ or 3+ based on the percentage
of tumor cells demonstrating immunoreactivity.
Microvessel density (MVD) was assessed as described
previously (20). Briefly, the areas
of highest neovascularization were selected, and single, or
clusters of, endothelial cells that were positive for CD31 or CD34
were counted. A minimum of five histological fields were assessed
to estimate the mean MVD for each case.
Imaging
Follow-up MRI scans of all patients were carried out
using a 3-Tesla MR imaging scanner (Signa Excite, GE Medical
Systems, Milwaukee, WI, USA; and Verio, Siemens Medical Solutions,
Erlangen, Germany) with an eight-channel head coil. The imaging
protocol included spin-echo (SE) T1-weighted images (T1WIs), fast
SE (FSE) T2-weighted images (T2WIs), fluid-attenuated inversion
recovery (FLAIR) images, echo-planar diffusion-weighted images,
susceptibility-weighted images (SWIs), dynamic susceptibility
contrast-enhanced perfusion-weighted images (DSC PWIs) with
gadobutrol (Gadovist, Bayer Schering Pharma, Berlin, Germany), and
subsequent contrast-enhanced (CE) SE T1WIs. The MRI parameters were
as follows: 558–650/8–20 ms/70–90°/384×192–212 [repetition time
(TR)/echo time (TE)/flip angle (FA)/matrix] for SE T1WIs;
4500–5160/91–106.3 ms/90–130°/448–640×220 for FSE T2WIs;
9000–9900/97–162.9 ms/90–130°/199–220×220 for FLAIR images; and
28/20 ms/15°/448×255 for SWIs. The other parameters included
section thickness of 5 mm with a 1-mm gap and field of view (FOV)
of 240×240 mm.
DSC PWI was performed with a single-shot
gradient-echo echo-planar imaging sequence during intravenous
injection of the contrast agent. The imaging parameters of DSC PWI
were as follows: TR/TE, 1500/30–40 ms; FA, 35–90°; FOV, 240×240 mm;
15–20 sections; matrix, 128×128; section thickness, 5 mm;
intersection gap, 1 mm; and voxel resolution, 1.86×1.86×5 mm. For
each section, 60 images were obtained at intervals equal to the
repetition time. After 4–5 time points, a bolus of gadobutrol, at a
dose of 0.1 mmol/kg of body weight and a rate of 4 ml/second, was
injected with a MR-compatible power injector (Spectris; Medrad
Inc., Pittsburgh, PA, USA). The bolus of the contrast material was
followed by a 30-ml bolus of saline, which was administered at the
same injection rate.
Quantitative analysis of imaging
values
The MRI data for the conventional MR images, the
apparent diffusion coefficient (ADC) maps, and the DSC PWIs were
digitally transferred from the picture archiving and communication
system workstation to a personal computer for further analyses.
Relative cerebral blood volumes (rCBVs) were obtained using a
dedicated software package (nordicICE; NordicImagingLab, Bergen,
Norway), with an established tracer kinetic model applied to
first-pass data. First, realignment was performed to minimize
patient motion during the dynamic scans. Gamma-variate function,
which is an approximation of the first-pass response as it would
appear in the absence of recirculation, was used to fit the 1/T2*
(1/T2 + γΔBinhom, where γ is the gyromagnetic ratio) curves to
reduce the effects of recirculation. To reduce contrast agent
leakage effects, the dynamic curves were mathematically corrected
(21). Following elimination of
recirculation and of leakage of the contrast agent, the rCBV was
computed by means of numeric integration of the curve. To minimize
variances in the rCBV value in an individual patient, the
pixel-based rCBV maps were normalized by dividing every rCBV value
in a specific section by the rCBV value in the unaffected white
matter, as defined by a neuroradiologist (22). Co-registrations between the CE T1WIs
and the normalized CBV (nCBV) maps, and between the CE T1WIs and
the ADC maps, were performed, based on geometric information stored
in their respective data sets, using the dedicated software package
nordicICE (22). The differences in
slice thickness between the images were corrected automatically by
the reslicing and co-registration method, which was based on the
underlying and structural images. The nCBV and ADC maps were
displayed as color overlays on the CE T1WIs.
Using histograms of the nCBV and ADC maps, we
obtained the mean, mode, skewness and kurtosis for comparison.
Statistical analysis
All statistical analyses were carried out using IBM
SPSS statistical software version 21 (IBM SPSS, Armonk, NY, USA).
The Mann-Whitney U test was used to compare two groups of
observations, and the Kendall tau to calculate the correlation
coefficient. All analyses were two-sided, and P<0.1 was
considered to indicate a statistically significant difference.
Results
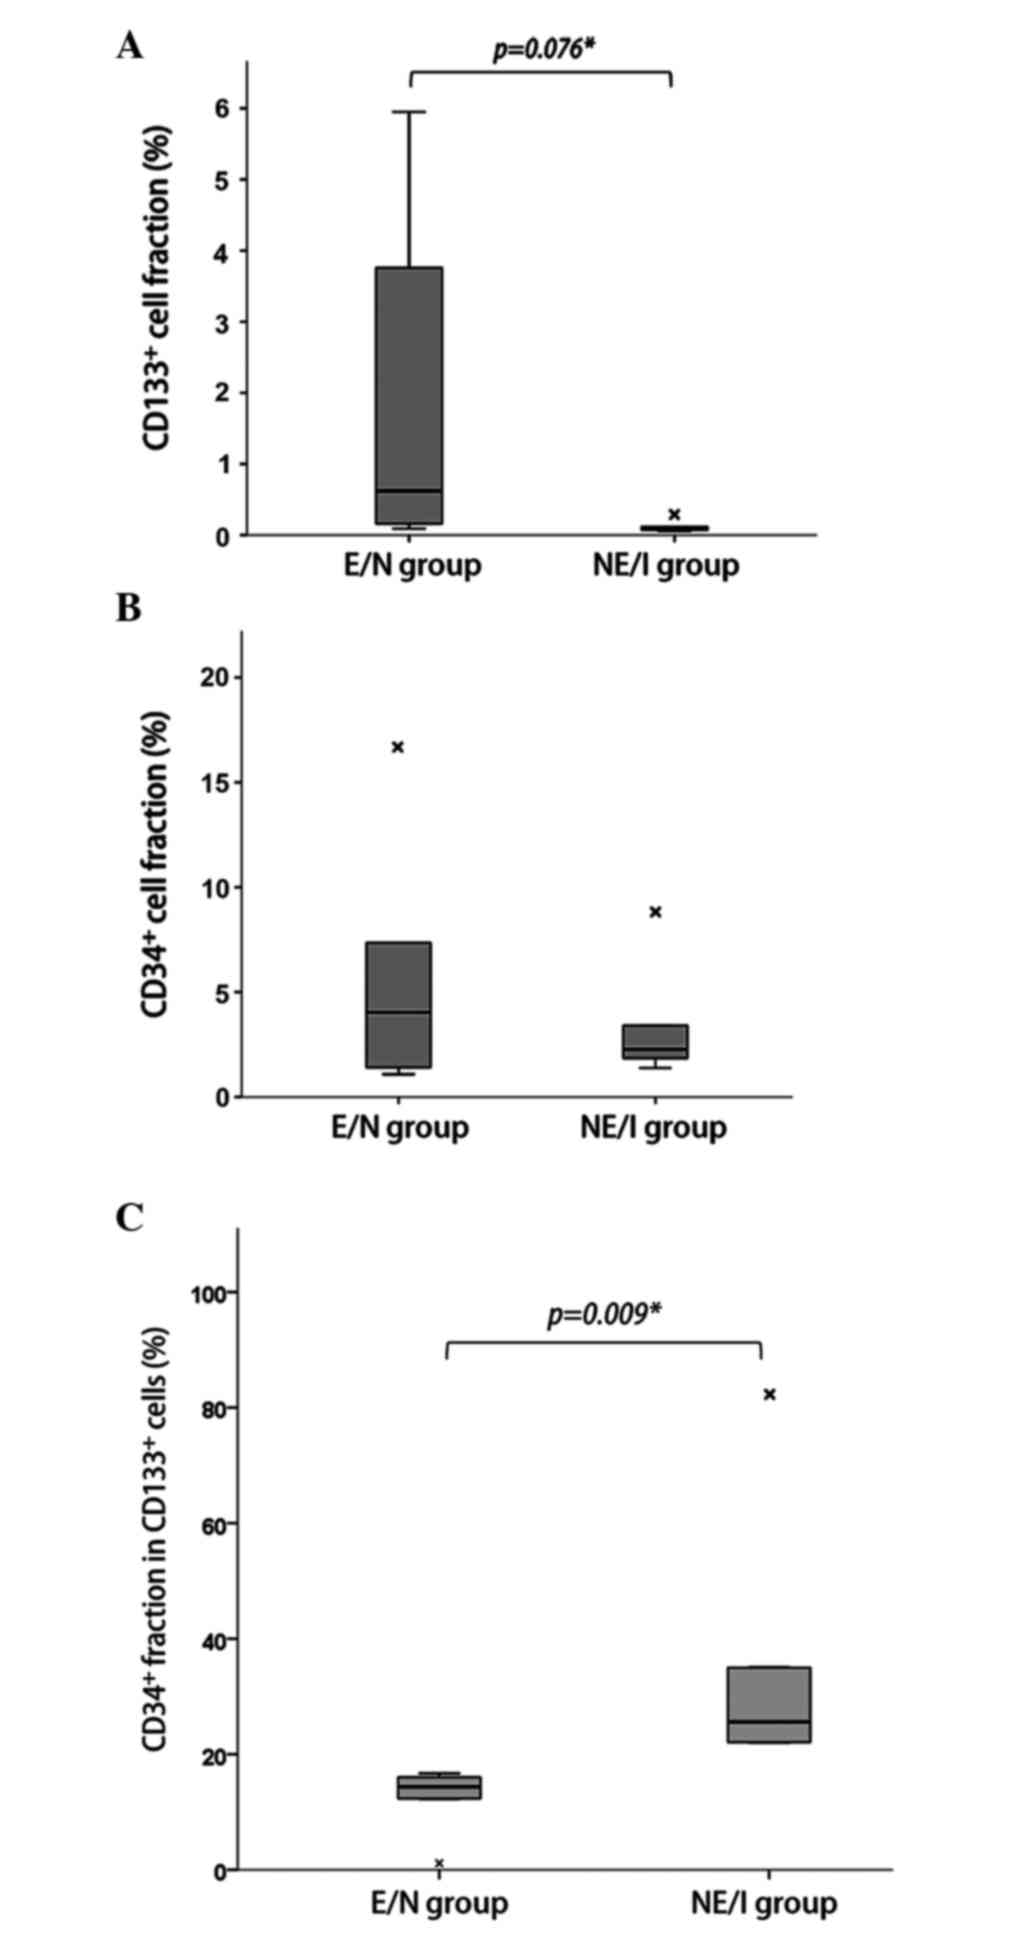
Higher CD34+ cell fraction
in CD133+ cells in NE/I glioblastomas
Tumor cell populations expressing CD133 and CD34
were measured by tissue FACS. The subpopulation fraction results
for individual cases are presented in Table II. The median fraction of
CD133+ cells represented 0.16% (range, 0.05–5.95%) of
the total tumor cell population per case. The CD133+
cell fraction was higher in the E/N group than in the NE/I group
(Fig. 2A; median 0.62% vs. 0.07%,
respectively; P=0.076). However, there was no difference in the
CD34+ cell fraction between the two groups (Fig. 2B; median 4.04% vs. 3.41%,
respectively; P=0.754). The median fraction of CD34+
cells in the total tumor cell population per case was 3.41% (range,
1.08–16.78%). However, the percentage expressing CD34+
in the CD133+ cell fraction (EPC fraction in CSCs,
CD34+/CD133+) was significantly higher in the
NE/I group than the E/N group (Fig.
2C; 25.58% vs. 14.37%, respectively; P=0.009). On the other
hand, the percentage expressing CD34− cells in the
CD133+ cell fraction (non-EPC fraction in CSCs,
CD34−/CD133+) was significantly higher in the
E/N group than the NE/I group (87.90% vs. 62.63%, respectively;
P=0.008).
| Table II.Distribution of tumor cell
subpopulations expressing CD133 and CD34 in individual cases. |
Table II.
Distribution of tumor cell
subpopulations expressing CD133 and CD34 in individual cases.
| A,
Enhancement/necrosis group |
|---|
|
|---|
|
|
|
|
|
CD133+ |
CD133− |
|---|
|
|
|
|
|
|
|
|---|
| Case | Gender/age | Total
CD133+ (%) | Total
CD34+ (%) | CD34+
(%) | CD34−
(%) | CD34+
(%) | CD34−
(%) |
|---|
| 1 | F/68 | 0.09 |
1.40 |
1.12 | 98.88 |
0.95 | 99.05 |
| 2 | M/59 | 0.62 |
7.36 | 12.32 | 87.68 |
7.17 | 92.83 |
| 3 | M/45 | 0.16 | 16.78 | 14.37 | 85.63 | 12.25 | 87.75 |
| 4 | F/67 | 3.76 |
4.04 | 16.04 | 83.96 |
4.10 | 95.90 |
| 5 | F/34 | 5.95 |
1.08 | 16.67 | 83.33 |
0.89 | 99.11 |
|
| B,
Non-enhancement/infiltration group |
|
|
|
|
|
|
CD133+ |
CD133− |
|
|
|
|
|
|
|
| Case | Gender/age | Total
CD133+ (%) | Total
CD34+ (%) | CD34+
(%) | CD34−
(%) | CD34+
(%) | CD34−
(%) |
|
| 6 | F/64 | 0.28 |
8.82 | 22.00 | 78.00 |
9.07 | 90.93 |
| 7 | M/43 | 0.12 |
1.38 | 22.06 | 77.94 |
1.19 | 98.81 |
| 8 | F/36 | 0.10 |
1.85 | 25.58 | 74.42 |
1.63 | 98.37 |
| 9 | M/42 | 0.05 |
3.41 | 35.00 | 65.00 |
3.29 | 96.71 |
| 10 | M/46 | 0.07 |
2.27 | 82.22 | 17.78 |
2.10 | 97.90 |
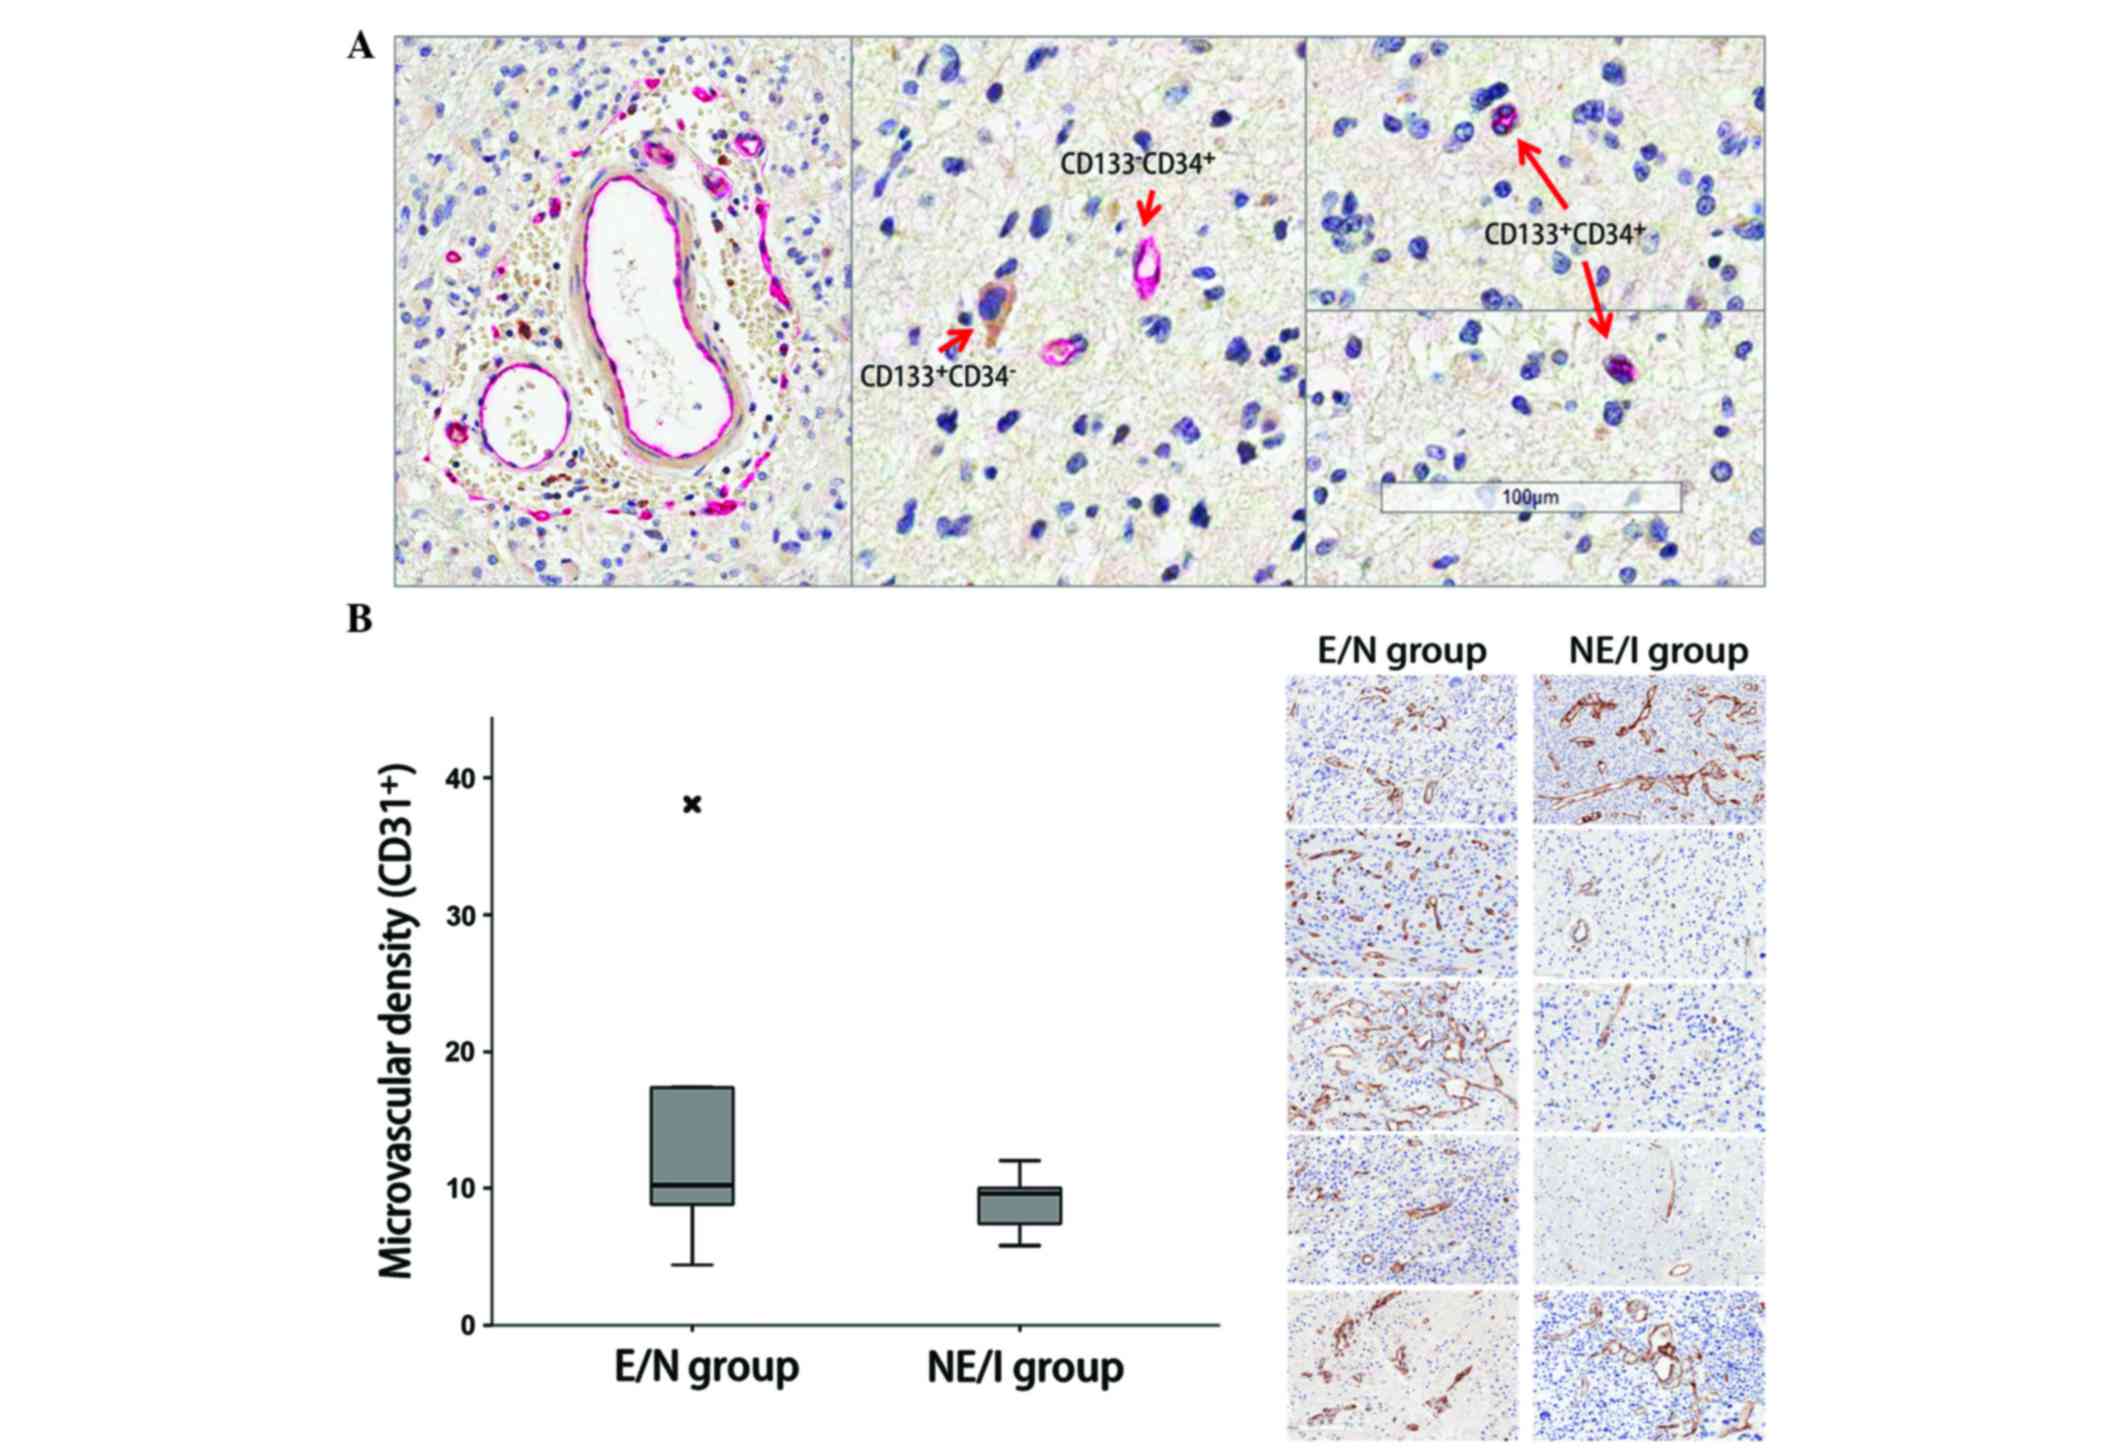
Angiogenesis is phenotype-independent
in glioblastomas
Double-staining IHC for CD133 and CD34 identified
the perivascular localization of the
CD34+/CD133+ cells (Fig. 3A). However, there was no statistical
difference in MVD between the E/N and NE/I groups (Fig. 3B). There was also no difference in
protein expression related to angiogenesis between the two groups
(Table III).
| Table III.Angiogenesis-related protein
expression. |
Table III.
Angiogenesis-related protein
expression.
| Gene |
Enhancement/necrosis group (%) |
Non-enhancement/infiltration group
(%) |
|---|
| CD45 | 2.2±1.7 | 1.8±1.4 |
| VEGFR1 | 3.8±1.3 | 4.5±3.4 |
| VEGFR2 | 3.3±3.1 | 2.7±1.3 |
| Notch1 | 0.2±0.1 | 0.3±0.4 |
| Integrin β4 | 1.2±1.6 | 1.1±0.6 |
Histogram analysis for perfusion MRI is summarized
in Table IV. When comparing the
histogram parameters between the E/N and NE/I groups, only the
skewness of nCBV was significantly different (P=0.048). There were
no differences in other perfusion MRI parameters between the two
groups.
| Table IV.Normalized cerebral blood volume
histogram parameters of each phenotype group. |
Table IV.
Normalized cerebral blood volume
histogram parameters of each phenotype group.
| Gene |
Enhancement/necrosis group (%) |
Non-enhancement/infiltration group
(%) | P-value |
|---|
| Mean | 2.4±0.9 | 2.0±0.8 | 0.535 |
| Mode | 1.8±0.9 | 2.8±0.7 | 0.921 |
| Kurtosis | 2.8±1.3 | 1.9±1.4 | 0.365 |
| Skewness | 1.5±0.4 | 1.0±0.4 | 0.048 |
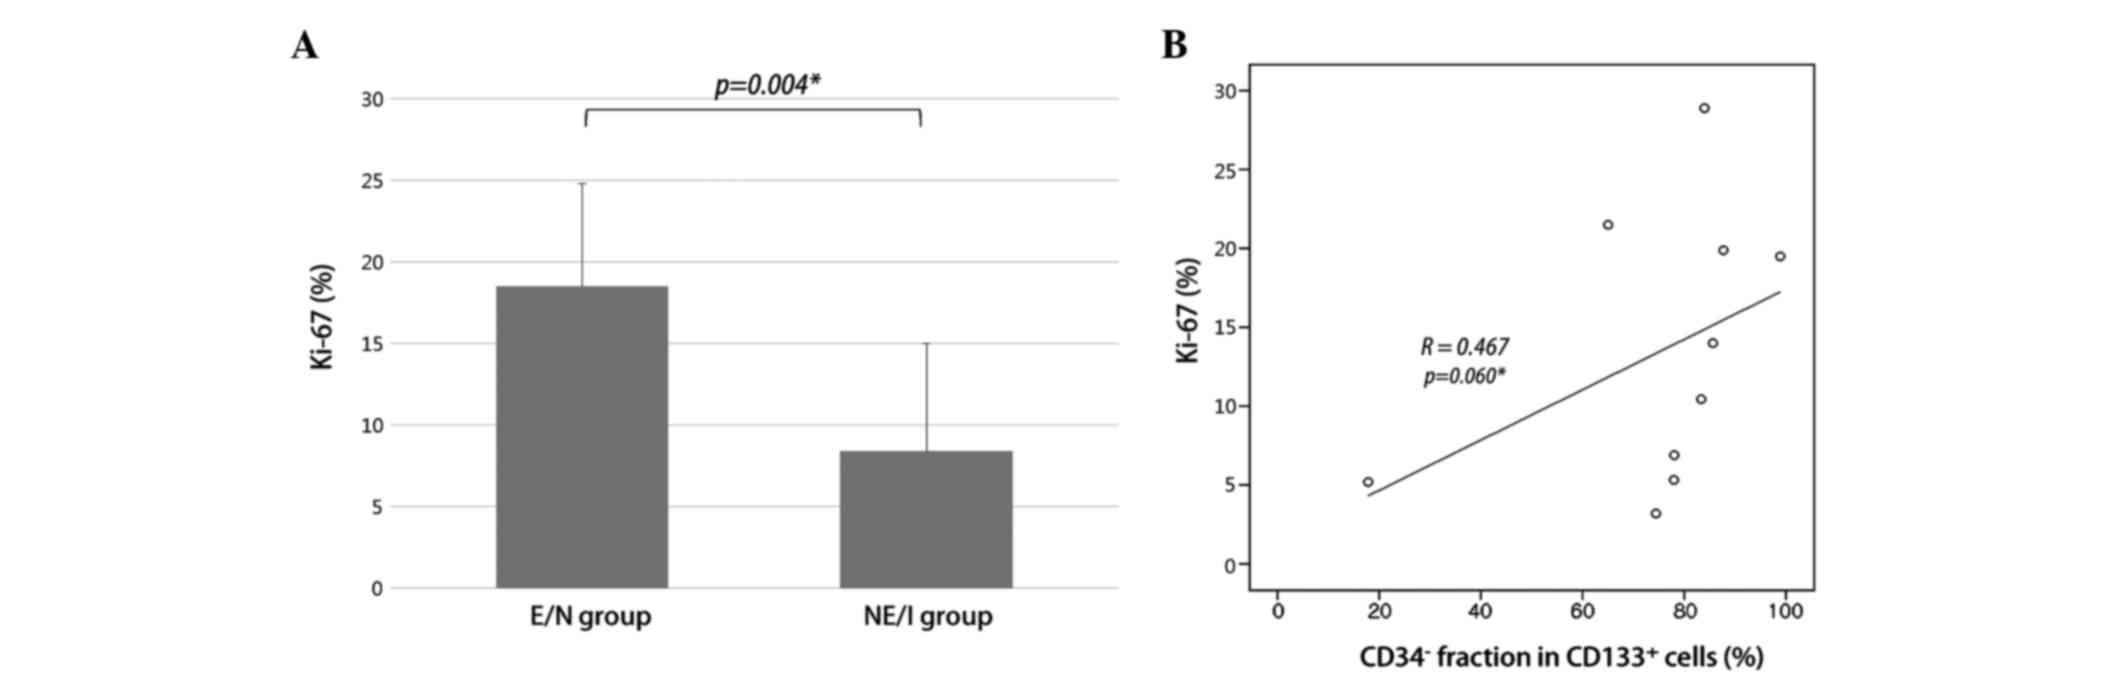
Higher proliferative potential in E/N
glioblastomas correlates with CD34−/CD133+
cell fraction
Proliferation index measurement, using Ki-67 IHC,
revealed a significant increase in the E/N group, compared with the
NE/I group (Fig. 4A; 18.5±6.3% vs.
8.4±6.6%; P=0.004). As the E/N group had a larger
CD34−/CD133+ cell fraction than the NE/I
group, we examined the correlation between
CD34−/CD133+ cell fractions and Ki-67 in
whole-study samples. A positive correlation was observed between
CD34−/CD133+ cell fractions and Ki-67
(Fig. 4B; R=0.467, P=0.060).
This result indicates that a larger
CD34−/CD133+ cell fraction correlates with a
greater cellular proliferation and is associated with the E/N
radiographic phenotype.
Discussion
We have previously demonstrated that there is a
distinct subpopulation of CD133+ cells in human brain
tumors, with characteristics of EPCs
(CD34+/CD133+) (9). The functional role of EPCs in
oncogenesis has been identified as that of increased angiogenic
potential, which is an essential element for tumor progression
(9). EPCs are known to be recruited
to sites of neovascularization from the bone marrow, or to be
transdifferentiated from CSCs (12,23–26). In
addition, we observed various EPC fractions in CSCs among different
cancer types (9). This led to the
speculation of a possible correlation between EPC fractions and
phenotypic characteristics associated with angiogenesis in specific
tumors. Glioblastoma is the ideal tissue material to test this
hypothesis, as it harbors heterogeneous imaging characteristics,
thus implying a diverse degree of angiogenesis, necrosis and
proliferation. Furthermore, it has also been studied extensively
using advanced imaging techniques, thus providing us with
sufficient cumulative knowledge for the imaging characteristics to
be interpreted. Therefore, we defined two phenotypically distinct
groups of glioblastoma, based on their MRI characteristics, which
we then used to test the hypothesis. We consider that the E/N group
is representative of angiogenesis-prone cases while the NE/I group
represents cases with lower angiogenic potential.
Against our expectations, there was no evidence of
differences in angiogenic activity between the two groups assessed
by MVD. Moreover, the EPC fraction
(CD34+/CD133+) in CSCs was higher in the NE/I
group whereas the CD34−/CD133+ cell fraction
in the CD133+ cell population was significantly higher
in the E/N group, compared with the NE/I group. This implies that
angiogenic potential is not a major factor associated with
radiographic phenotypic changes. There were also no differences in
the perfusion MRI parameters, thus supporting the microscopic IHC
evidence. This is in line with the findings of a previous study on
glioblastoma, which revealed that there was histopathologically no
difference in overall and simple vascular hyperplasia between
samples from T1 contrast enhancement areas and samples from
non-contrast areas (27). This study
further demonstrated that delicate microvascular hyperplasia is
more frequently observed in specimens from non-enhancement areas
(27). Another previous study on the
use of anti-angiogenic therapy for glioblastoma revealed that the
significant reduction in contrast enhancement following
anti-angiogenic treatment was not due to the decrease in MVD
(28). The authors concluded that
contrast enhancement does not accurately reflect vascular density
(28). However, there are still
conflicting views on the role of perfusion MRI for predicting MVD
(29).
In our previous study, we confirmed that the
CD34−/CD133+ subpopulation comprised the
oncogenic cells that led to tumors in vivo (9). In the same study, we also revealed the
CD34−/CD133+ cell fraction to be the major
component for proliferation in tumor models (9). Results from the present study indicate
that the CD34−/CD133+ fraction in the
CD133+ cell population is higher in the E/N group
compared with the NE/I group, and this correlated with the
proliferation index. Therefore, this finding provides further
support for the proliferative potential of the
CD34−/CD133+ cell fraction in human
glioblastoma samples. Moreover, we established an association
between this subpopulation of CSCs and the radiographic
characteristics of the tumors. Studies investigating MRI
characteristics in the early phase of glioblastoma evolution have
reported that ill-defined hyperintense areas on T2WIs without
contrast enhancement represent the incipient stage of cancer
(30,31). Furthermore, a higher proliferative
index in contrast-enhanced areas was documented by another research
group (27).
The EPC fraction in CSCs was increased in
glioblastomas without contrast enhancement on MRI. However,
angiogenesis was not a major factor influencing radiographic
characteristics. Our study suggests that the non-EPC fractions in
CSCs are associated with oncogenic proliferation and are
responsible for radiographic changes in glioblastomas. Therefore,
as a surrogate marker of proliferation potential, the simple
non-invasive assessment method of contrast enhancement lesions in
glioblastoma could be used to estimate CSC subpopulations or to
guide in the selection of therapeutic agents targeting CSCs. The
limitation of this study is the lax statistical standard, and the
small number of samples, which prohibits parametric tests between
groups. Larger study samples are required to validate the results
in the future.
Simple non-invasive assessment of contrast
enhancement lesions for glioblastoma may be utilized to provide a
biomarker for estimating the presence of subpopulations of
CSCs.
Acknowledgements
This study was supported by grants from the Korea
Health Technology R&D Project, Ministry of Health and Welfare,
Republic of Korea (A120446), and the Seoul National University
Hospital Research Fund (03-2012-0130).
References
|
1
|
Singh SK, Clarke ID, Hide T and Dirks PB:
Cancer stem cells in nervous system tumors. Oncogene. 23:7267–7273.
2004. View Article : Google Scholar : PubMed/NCBI
|
|
2
|
Singh SK, Hawkins C, Clarke ID, Squire JA,
Bayani J, Hide T, Henkelman RM, Cusimano MD and Dirks PB:
Identification of human brain tumour initiating cells. Nature.
432:396–401. 2004. View Article : Google Scholar : PubMed/NCBI
|
|
3
|
Bidlingmaier S, Zhu X and Liu B: The
utility and limitations of glycosylated human CD133 epitopes in
defining cancer stem cells. J Mol Med (Berl). 86:1025–1032. 2008.
View Article : Google Scholar : PubMed/NCBI
|
|
4
|
Joo KM, Kim SY, Jin X, Song SY, Kong DS,
Lee JI, Jeon JW, Kim MH, Kang BG, Jung Y, et al: Clinical and
biological implications of CD133-positive and CD133-negative cells
in glioblastomas. Lab Invest. 88:808–815. 2008. View Article : Google Scholar : PubMed/NCBI
|
|
5
|
Beier D, Hau P, Proescholdt M, Lohmeier A,
Wischhusen J, Oefner PJ, Aigner L, Brawanski A, Bogdahn U and Beier
CP: CD133(+) and CD133(−) glioblastoma-derived cancer stem cells
show differential growth characteristics and molecular profiles.
Cancer Res. 67:4010–4015. 2007. View Article : Google Scholar : PubMed/NCBI
|
|
6
|
Ogden AT, Waziri AE, Lochhead RA, Fusco D,
Lopez K, Ellis JA, Kang J, Assanah M, McKhann GM, Sisti MB, et al:
Identification of A2B5+CD133- tumor-initiating cells in adult human
gliomas. Neurosurgery. 62:505–514; discussion 514–515. 2008.
View Article : Google Scholar : PubMed/NCBI
|
|
7
|
Wang J, Sakariassen PØ, Tsinkalovsky O,
Immervoll H, Bøe SO, Svendsen A, Prestegarden L, Røsland G, Thorsen
F, Stuhr L, et al: CD133 negative glioma cells form tumors in nude
rats and give rise to CD133 positive cells. Int J Cancer.
122:761–768. 2008. View Article : Google Scholar : PubMed/NCBI
|
|
8
|
Christensen K, AabergJessen C, Andersen C,
Goplen D, Bjerkvig R and Kristensen BW: Immunohistochemical
expression of stem cell, endothelial cell, and chemosensitivity
markers in primary glioma spheroids cultured in serum-containing
and serum-free medium. Neurosurgery. 66:933–947. 2010. View Article : Google Scholar : PubMed/NCBI
|
|
9
|
Choi SA, Wang KC, Phi JH, Lee JY, Park CK,
Park SH and Kim SK: A distinct subpopulation within CD133 positive
brain tumor cells shares characteristics with endothelial
progenitor cells. Cancer Lett. 324:221–230. 2012. View Article : Google Scholar : PubMed/NCBI
|
|
10
|
Ribatti D: The involvement of endothelial
progenitor cells in tumor angiogenesis. J Cell Mol Med. 8:294–300.
2004. View Article : Google Scholar : PubMed/NCBI
|
|
11
|
Ricci-Vitiani L, Pallini R, Biffoni M,
Todaro M, Invernici G, Cenci T, Maira G, Parati EA, Stassi G,
Larocca LM and De Maria R: Tumour vascularization via endothelial
differentiation of glioblastoma stem-like cells. Nature.
468:824–828. 2010. View Article : Google Scholar : PubMed/NCBI
|
|
12
|
Wang R, Chadalavada K, Wilshire J, Kowalik
U, Hovinga KE, Geber A, Fligelman B, Leversha M, Brennan C and
Tabar V: Glioblastoma stem-like cells give rise to tumour
endothelium. Nature. 468:829–833. 2010. View Article : Google Scholar : PubMed/NCBI
|
|
13
|
Diehn M, Nardini C, Wang DS, McGovern S,
Jayaraman M, Liang Y, Aldape K, Cha S and Kuo MD: Identification of
noninvasive imaging surrogates for brain tumor gene-expression
modules. Proc Natl Acad Sci USA. 105:5213–5218. 2008. View Article : Google Scholar : PubMed/NCBI
|
|
14
|
Aghi M, Gaviani P, Henson JW, Batchelor
TT, Louis DN and Barker FG II: Magnetic resonance imaging
characteristics predict epidermal growth factor receptor
amplification status in glioblastoma. Clin Cancer Res.
11:8600–8605. 2005. View Article : Google Scholar : PubMed/NCBI
|
|
15
|
Tykocinski ES, Grant RA, Kapoor GS, Krejza
J, Bohman LE, Gocke TA, Chawla S, Halpern CH, Lopinto J, Melhem ER
and O'Rourke DM: Use of magnetic perfusion-weighted imaging to
determine epidermal growth factor receptor variant III expression
in glioblastoma. Neuro Oncol. 14:613–623. 2012. View Article : Google Scholar : PubMed/NCBI
|
|
16
|
Butts CL and Sternberg EM: Flow cytometry
as a tool for measurement of steroid hormone receptor protein
expression in leukocytes. Methods Mol Biol. 505:35–50. 2009.
View Article : Google Scholar : PubMed/NCBI
|
|
17
|
Liu X, Zhou B, Xue L, Shih J, Tye K, Lin
W, Qi C, Chu P, Un F, Wen W and Yen Y: Metastasis-suppressing
potential of ribonucleotide reductase small subunit p53R2 in human
cancer cells. Clin Cancer Res. 12:6337–6344. 2006. View Article : Google Scholar : PubMed/NCBI
|
|
18
|
Simon R, Mirlacher M and Sauter G:
Immunohistochemical analysis of tissue microarrays. Methods Mol
Biol. 664:113–126. 2010. View Article : Google Scholar : PubMed/NCBI
|
|
19
|
Pio R, Jia Z, Baron VT and Mercola D: UCI
NCI SPECS Consortium of the Strategic Partners for the Evaluation
of Cancer Signatures-Prostate Cancer: Early growth response 3
(Egr3) is highly over-expressed in non-relapsing prostate cancer
but not in relapsing prostate cancer. PLoS One. 8:e540962013.
View Article : Google Scholar : PubMed/NCBI
|
|
20
|
Weidner N, Semple JP, Welch WR and Folkman
J: Tumor angiogenesis and metastasis-correlation in invasive breast
carcinoma. N Engl J Med. 324:1–8. 1991. View Article : Google Scholar : PubMed/NCBI
|
|
21
|
Boxerman JL, Schmainda KM and Weisskoff
RM: Relative cerebral blood volume maps corrected for contrast
agent extravasation significantly correlate with glioma tumor
grade, whereas uncorrected maps do not. AJNR Am J Neuroradiol.
27:859–867. 2006.PubMed/NCBI
|
|
22
|
Wetzel SG, Cha S, Johnson G, Lee P, Law M,
Kasow DL, Pierce SD and Xue X: Relative cerebral blood volume
measurements in intracranial mass lesions: interobserver and
intraobserver reproducibility study. Radiology. 224:797–803. 2002.
View Article : Google Scholar : PubMed/NCBI
|
|
23
|
Mohle R, Bautz F, Rafii S, Moore MA,
Brugger W and Kanz L: The chemokine receptor CXCR-4 is expressed on
CD34+ hematopoietic progenitors and leukemic cells and mediates
transendothelial migration induced by stromal cell-derived
factor-1. Blood. 91:4523–4530. 1998.PubMed/NCBI
|
|
24
|
Scully S, Francescone R, Faibish M,
Bentley B, Taylor SL, Oh D, Schapiro R, Moral L, Yan W and Shao R:
Transdifferentiation of glioblastoma stem-like cells into mural
cells drives vasculogenic mimicry in glioblastomas. J Neurosci.
32:12950–12960. 2012. View Article : Google Scholar : PubMed/NCBI
|
|
25
|
Soda Y, Marumoto T, FriedmannMorvinski D,
Soda M, Liu F, Michiue H, Pastorino S, Yang M, Hoffman RM, Kesari S
and Verma IM: Transdifferentiation of glioblastoma cells into
vascular endothelial cells. Proc Natl Acad Sci USA. 108:4274–4280.
2011. View Article : Google Scholar : PubMed/NCBI
|
|
26
|
Patenaude A, Parker J and Karsan A:
Involvement of endothelial progenitor cells in tumor
vascularization. Microvasc Res. 79:217–223. 2010. View Article : Google Scholar : PubMed/NCBI
|
|
27
|
Barajas RF Jr, Phillips JJ, Parvataneni R,
Molinaro A, EssockBurns E, Bourne G, Parsa AT, Aghi MK, McDermott
MW, Berger MS, et al: Regional variation in histopathologic
features of tumor specimens from treatment-naive glioblastoma
correlates with anatomic and physiologic MR imaging. Neuro Oncol.
14:942–954. 2012. View Article : Google Scholar : PubMed/NCBI
|
|
28
|
Jalali S, Chung C, Foltz W, Burrell K,
Singh S, Hill R and Zadeh G: MRI biomarkers identify the
differential response of glioblastoma multiforme to anti-angiogenic
therapy. Neuro Oncol. 16:868–879. 2014. View Article : Google Scholar : PubMed/NCBI
|
|
29
|
Sadeghi N, D'Haene N, Decaestecker C,
Levivier M, Metens T, Maris C, Wikler D, Baleriaux D, Salmon I and
Goldman S: Apparent diffusion coefficient and cerebral blood volume
in brain gliomas: relation to tumor cell density and tumor
microvessel density based on stereotactic biopsies. AJNR Am J
Neuroradiol. 29:476–482. 2008. View Article : Google Scholar : PubMed/NCBI
|
|
30
|
Okamoto K, Ito J, Takahashi N, Ishikawa K,
Furusawa T, Tokiguchi S and Sakai K: MRI of high-grade astrocytic
tumors: early appearance and evolution. Neuroradiology. 44:395–402.
2002. View Article : Google Scholar : PubMed/NCBI
|
|
31
|
Nishi N, Kawai S, Yonezawa T, Fujimoto K
and Masui K: Early appearance of high grade glioma on magnetic
resonance imaging. Neurol Med Chir (Tokyo). 49:8–12. 2009.
View Article : Google Scholar : PubMed/NCBI
|