Introduction
Tumor development is a complex process that involves
genetic and epigenetic abnormalities. These alterations may
contribute to the inactivation of tumor suppressor genes and
eventually induce tumorigenesis (1).
Phosphatase and tensin homolog (PTEN) is a lipid
phosphatase that negatively regulates the phosphoinositide
3-kinase/protein kinase B/mechanistic target of rapamycin signaling
axis and thereby inhibits cell proliferation and metabolism
(2). Tumor protein 53 (P53) is a DNA
sequence-specific transcription factor that is able to selectively
activate genes involved in cell cycle arrest, apoptosis and
senescence in response to diverse cellular stresses (3). Accordingly, PTEN and P53 are key
suppressors in neoplastic progression and are inactivated via gene
mutation (4,5) or aberrant DNA methylation (6,7) in
numerous types of malignant tumor.
MutS homolog 2 (MSH2) is an essential component of
the DNA mismatch repair (MMR) singling pathway, which is essential
for maintenance of genome integrity as it identifies and corrects
mismatched nucleotides and triggers homologous recombination during
DNA replication (8). Defects in the
MSH2 gene abrogate the MMR response (9). In addition, these engender genome-wide
instability and thus increase the risk of malignant transformation
(10). Although the three
aforementioned tumor suppressor genes have been well-studied
separately, the alterations in their expression levels during the
progression of a single tumor remain unclear, and may reveal the
combined contribution of the three genes to the initiation,
progression and maintenance of a single tumor.
Genetic changes, including mutations, have a
clear-cut function in tumor progression; however, the mechanistic
insights and importance of epigenetic changes in carcinogenesis are
comparatively less well understood (11). DNA methylation is the best-known
epigenetic modification, and aberrant methylation in the promoter
region 5′-C-phosphate-G-3′ (CpG) islands is associated with gene
silencing, as this downregulates transcription (12,13). In
human types of cancer, altered methylation patterns epigenetically
repress tumor suppressor genes, providing a direct link between
epigenetic regulation and cancer (14).
N-methyl-N-nitrosourea (MNU) is one of the most
potent mutagenic nitrosourea compounds due to its ability to
interact directly with, and alkylate, genomic DNA (15). MNU is able to induce numerous types of
mammary tumors, and MNU-induced thymic lymphoma is a
well-established animal model (16).
In a previous study by our group, a relatively high frequency
(61.3%) of thymic lymphoma was induced in C57BL/6J mice using MNU
(17); however, the complete process
of thymic lymphoma induced by MNU in these mice was not determined.
In an attempt to describe the process of tumorigenesis more
comprehensively, the present study determined the protein
expression status of PTEN, transformation protein 53 (TRP53) and
MSH2 simultaneously in various tissues of MNU-exposed mice, and
further explored the promoter methylation status of each gene by
MassARRAY analysis.
Materials and methods
Ethics statement
All of the experiments and animal procedures were
performed in accordance with the Guidelines of Capital Medical
University Animal Experiments and Experimental Animals Management
Committee (Beijing, China). The protocol was approved by the Animal
Experiments and Experimental Animal Welfare Committee of Capital
Medical University (permit no. 2011-X-009).
Animal experiments
The MNU-induced thymic lymphoma model in C57BL/6J
mice was developed as previously described (17). In brief, 5–6-week-old (15–20 g body
weight) C57BL/6J male mice (The Academy of Military Medical
Sciences, Beijing, China) were used in the present study. The
animals (5 mice per cage) were housed in a barrier system and were
maintained in controlled conditions: Temperature (23±2°C), humidity
(55±10%) and lighting (12 h light/dark cycle). The mice were
allowed access to food and water ad libitum. The mice were allowed
to acclimate to the environment for 1 week prior to commencement of
the experiments.
MNU (Sigma-Aldrich; Merck KGaA, Darmstadt, Germany)
was dissolved in dimethyl sulfoxide (DMSO) and diluted in phosphate
buffer (PBS, pH 7.2) to a concentration of 5 mg/ml immediately
prior to use. A total of 40 mice in the MNU group were administered
a single intraperitoneal dose of 90 mg/kg body weight and 10 mice
in the control group were injected with the solvent only (DMSO and
PBS) in a corresponding dose of 90 mg/kg body weight. The animals
were euthanized 16 weeks following the initial injection and the
liver, kidney, spleen and thymus of each mouse were immediately
collected. Thymic lymphomas and the metastatic tumors in the liver,
kidney and spleen were identified by morphological and
immunohistochemical studies as previously described (17).
Western blot analysis
A total of 9 mice in three groups, including the
control group (n=3), tumor group (n=3; mice with thymic lymphoma
and tumor metastasis to the liver, kidney and spleen) and non-tumor
group (n=3; mice with no tumors in the thymus, liver, kidney and
spleen) were used to investigate the expression levels of TRP53,
PTEN and MSH2. Proteins were extracted from the thymus, livers,
spleens and kidneys of each mice using a Protein Extraction kit
(CWBio, Beijing, China) and quantified using BCA-Reagents (CWBio).
Protein lysates (20 µg/lane) were subjected to SDS-PAGE at 160 V on
a 12% gel (CWBio) for 1 h, and then transferred to a 0.45-µm
nitrocellulose filter membrane (buffer: Tris 5.8 g, glycine 2.9 g,
SDS 0.376 g, methyl alcohol 200 ml to 1 l) at 200 mA for 2 h using
Semi Dry Transfer method (ice-bath). Primary antibodies against P53
(cat no. 2524 s), PTEN (cat no. 9559S) and MSH2 (cat no. 2017S)
were diluted to 1:1,000. GAPDH antibodies (cat no. 5174S) were
diluted to 1:2,000. All of the primary antibodies were incubated at
4°C for 12 h. The secondary antibodies (goat anti-rabbit IgG
conjugated to horseradish peroxidase; cat no. 7074S) were diluted
to 1:5,000 and incubated at room temperature for 1 h (all the
antibodies were purchased from Cell Signaling Technology, Inc.,
Danvers, MA, USA). The membranes were washed thoroughly
(Tris-buffered saline with Tween) and visualized using enhanced
chemiluminescence detection reagents (Thermo Fisher Scientific,
Inc., Waltham, MA, USA). Semi-quantitative results were normalized
to the housekeeping gene, GAPDH, following scanning to obtain a
grayscale image (Gel DocXR System; 1708170EDU; Bio-Rad
Laboratories, Inc., Hercules, CA, USA).
DNA methylation analysis
The promoter CpG islands of Trp53, Pten and Msh2
were identified using CpG Island Searcher (http://cpgislands.usc.edu) between 5,000–1,000 base
pairs of the transcriptional start site. Primers for amplifying the
upstream CpG islands were designed using Methyl Primer Express
version 1.0 (Applied Biosystems; Thermo Fisher Scientific, Inc.)
and Vector NTI Advance 10 (Invitrogen; Thermo Fisher Scientific,
Inc.; Table I). The methylation
status of the three genes was analyzed in the thymus, liver, kidney
and spleen of 26 mice (control=6, tumor=10, non-tumor=10) using
MassARRAY Spectrometry, as previously described (18). Briefly, 1 µg genomic DNA was isolated
using standard phenol-chloroform extraction and ethanol
precipitation (anhydrous ethanol, −20°C) method, and was treated
with sodium bisulfate (3.1 M, Sigma-Aldrich; Merck KGaA) for 16 h
at 55°C. Polymerase chain reaction amplifications were performed to
obtain the CpG island sequences of the three genes as follows:
Amplifications were performed in 100 µl reaction mixtures
containing 5 µl bisulphite-treated genomic DNA, 200 µM dNTPs, luM
primers, 3 mM MgCl2, 50 mM KCI, 10 mM Tris-HCI pH 8.3,
0.5 µl (2.5 units) AmpliTaq DNA polymerase (Cetus), in a gradient
thermal cycler (Bio-Rad Laboratories, Inc.; ALS1296) under the
following conditions: 94°C/2 min for 1 cycle; 94°C/1 min, 50°C/2
min, 72°C/3 min for 5 cycles; 94°C/0.5 min, 50°C/2 min, 72°C/1.5
min for 25 cycles; 72°C/6 min for 1 cycle. Subsequently, DNA
methylation status was quantitatively analyzed by matrix-assisted
laser desorption ionization-time of flight mass spectrometry
(18), and methylation data for each
CpG site was generated using EpiTyper version 1.0.5 software
(Sequenom, San Diego, CA, USA).
 | Table I.Primer information for Trp53,
Pten and Msh2. |
Table I.
Primer information for Trp53,
Pten and Msh2.
| Gene | Primer | Product size
(bp) | Detectable CpG
sites |
|---|
| Trp53 | Forward:
5′-aggaagagagGGTTAGGTTAGGAGGGAGGTTATT-3′ | 427 | 26 |
|
| Reverse:
3′cagtaatacgactcactatagggagaaggctCAAAACCCAAAATTCAAACTACAAC-5′ |
|
|
| Pten | Forward:
5′-aggaagagagGGATGTGGTTGTTTGTGTAATTAGT-3′ | 516 | 22 |
|
| Reverse:
3′-cagtaatacgactcactatagggagaaggctAATCACAACCAAACTCAATCTTCAA-5′ |
|
|
| Msh2 | Forward:
5′-aggaagagagTTGGGTTAGTAAGAGGTTGTGTAGAA-3′ | 478 | 22 |
|
| Reverse:
3′-cagtaatacgactcactatagggagaaggctACCAACACCACTAAAACACAAAAC-5′ |
|
|
Statistical analysis
Statistical analysis was performed using GraphPad
Prism version 5.0 (GraphPad Software, Inc., La Jolla, CA, USA). The
comparisons between various groups were performed using the
χ2 test and one-way analysis of variance followed by
Tukey's post-hoc test. P<0.05 was considered to indicate a
statistically significant difference.
Results
Protein expression levels of TRP53,
PTEN and MSH2 in various tissues following MNU treatment
In the present study, the protein expression levels
of TRP53, PTEN and MSH2 in MNU-induced thymus, liver, spleen and
kidney tumor tissues and normal non-exposed tissue samples were
determined by western blotting.
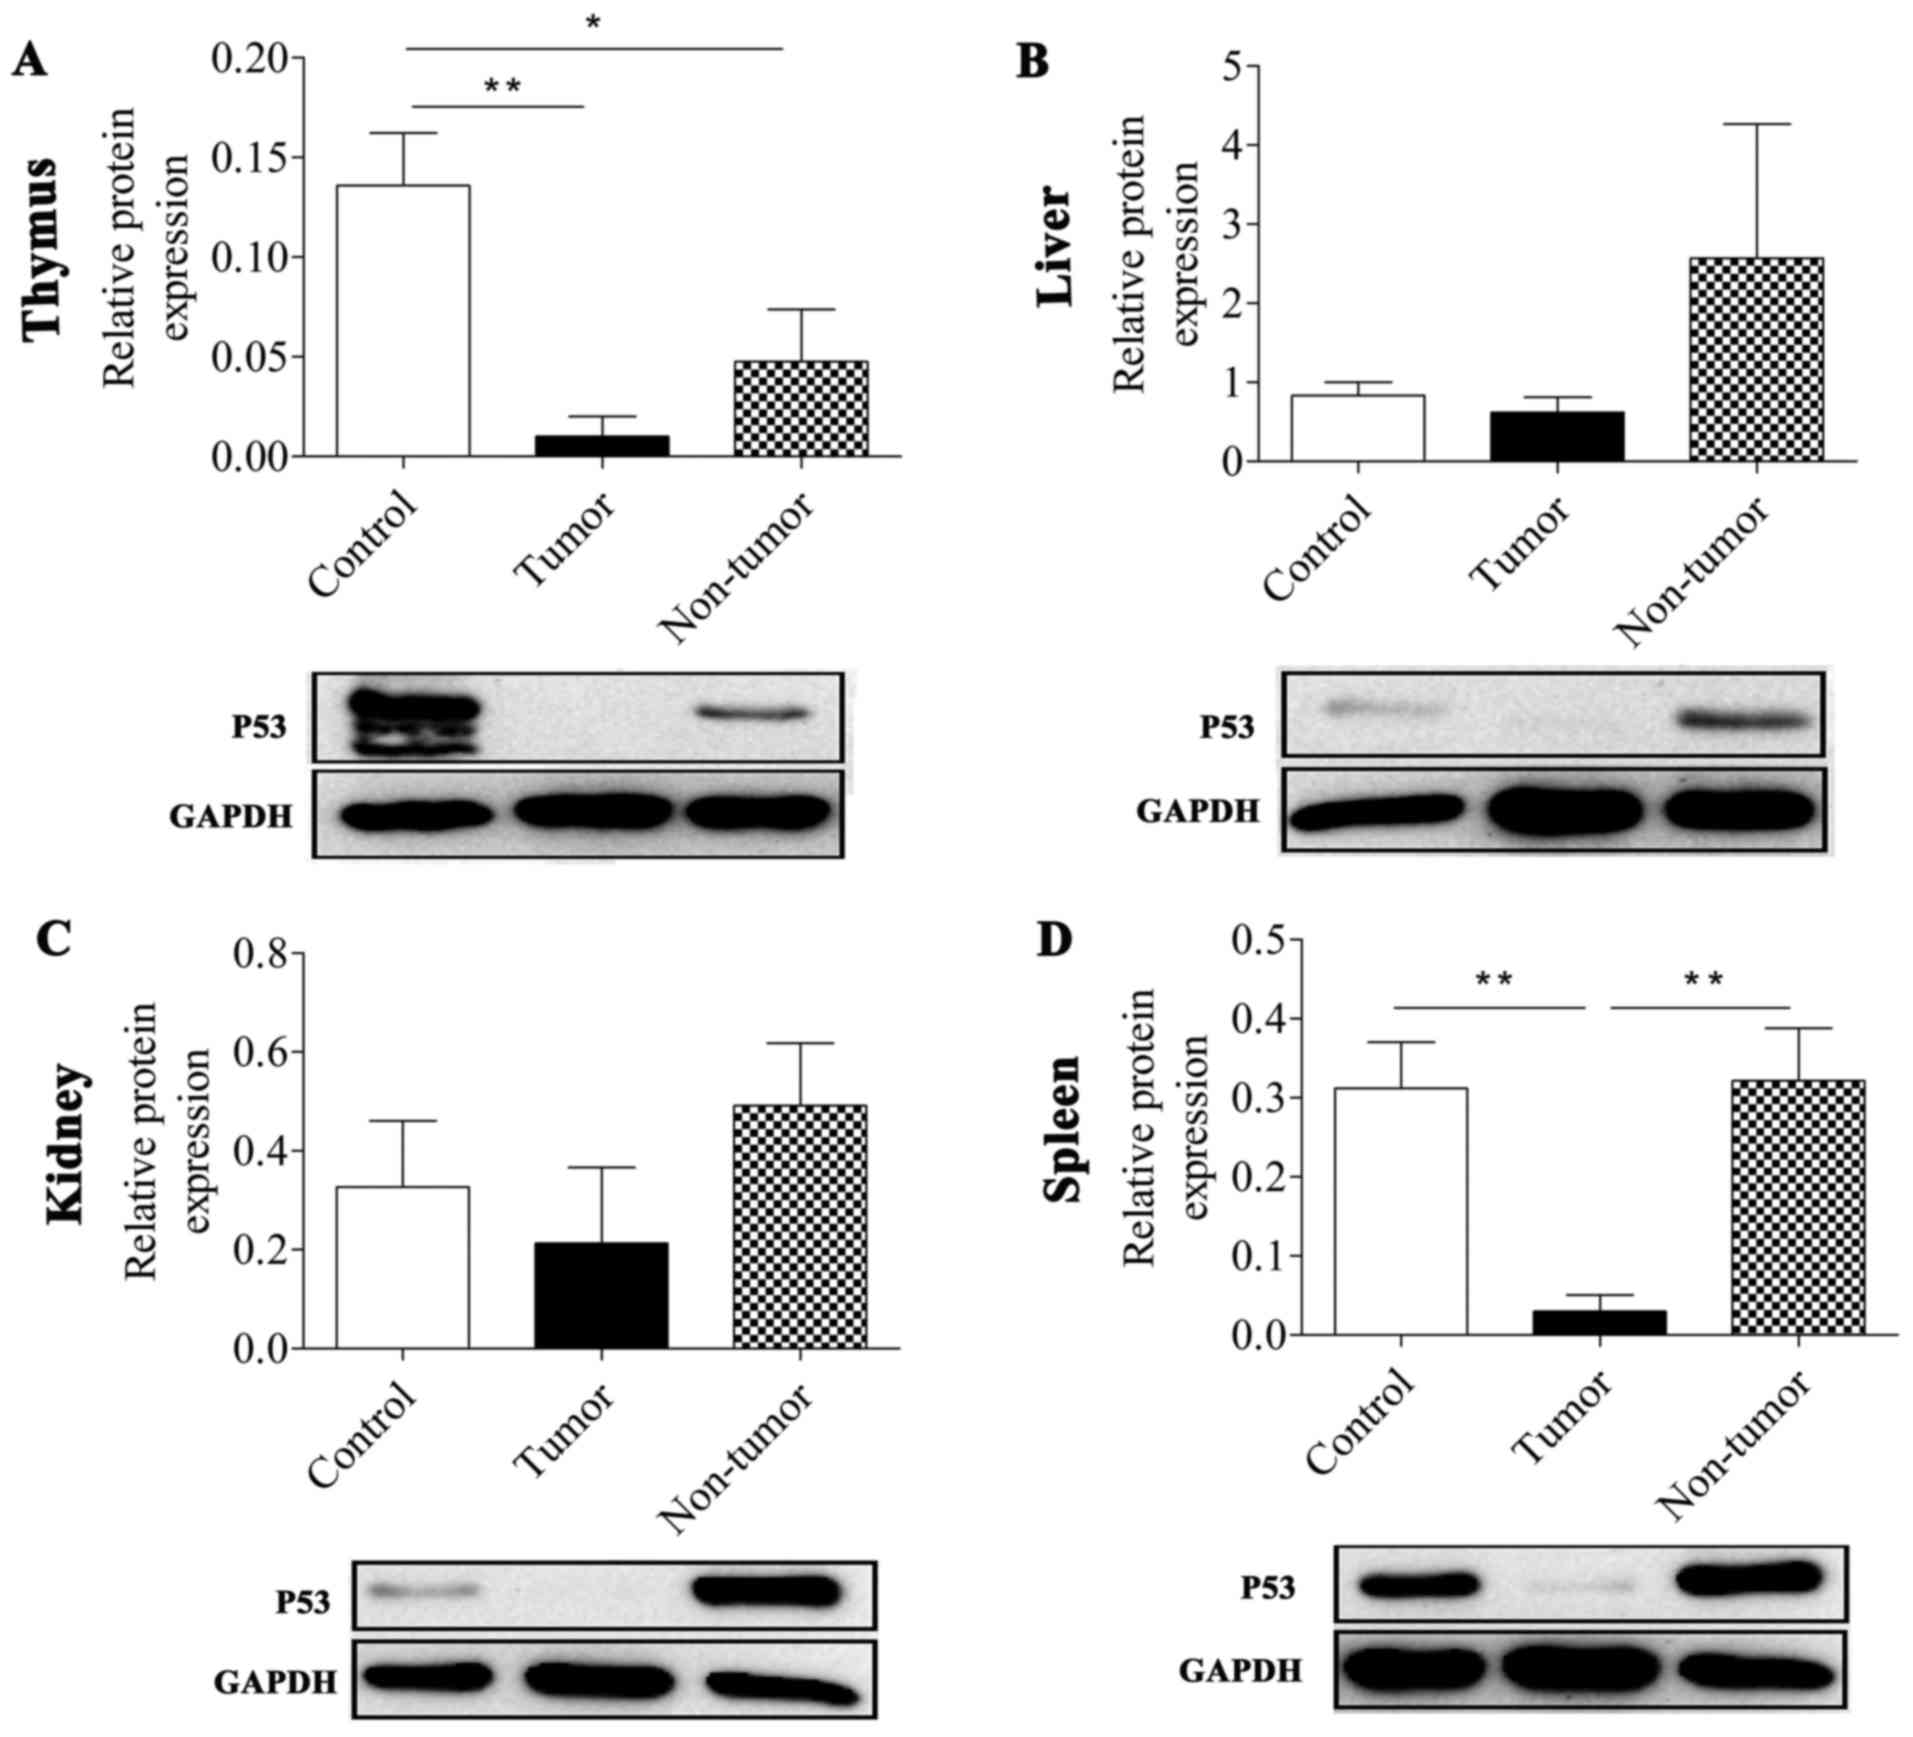
It was revealed that MNU treatment reduced the
expression level of TRP53 protein in tumor tissues. The TRP53
expression level in thymic lymphoma tissues and non-tumor thymus
tissue was significantly lower compared with in normal non-treated
thymus tissues (P=0.007 and P=0.031, respectively; Fig. 1; Table
II). In the spleen, the expression level of P53 was
significantly repressed in the tumor group compared with in the
control and non-tumor groups (P=0.009 and P=0.008, respectively).
As presented in Fig. 1, all the tumor
groups in the thymus, liver, spleen and kidney tissues exhibited a
reduced TRP53 expression level compared with the control group and
the non-tumor treatment group, particularly in the thymus and
spleen. However, TRP53 expression level in the non-tumor groups,
except in the thymus, did not affect the development of tumors in
the mice although they were also treated with MNU.
| Table II.Protein expression levels of TRP53,
PTEN and MSH2 in four types of tissue. |
Table II.
Protein expression levels of TRP53,
PTEN and MSH2 in four types of tissue.
|
| Thymus | Liver | Kidney | Spleen |
|---|
|
|
|
|
|
|
|---|
| Expression | C | T | NT | C | T | NT | C | T | NT | C | T | NT |
|---|
| TRP35 | – | ↓a | ↓b | – | ↓ | ↑ | – | ↓ | ↑ | – | ↓c | ↑ |
| PTEN | – | ↓d | ↑ | – | ↑ | ↑ | – | ↑ | ↑ | – | ↓ | ↑ |
| MSH2 | – | ↑ | ↑ | – | ↑e | ↑ | – | ↑f | ↓ | – | ↑g | ↑ |
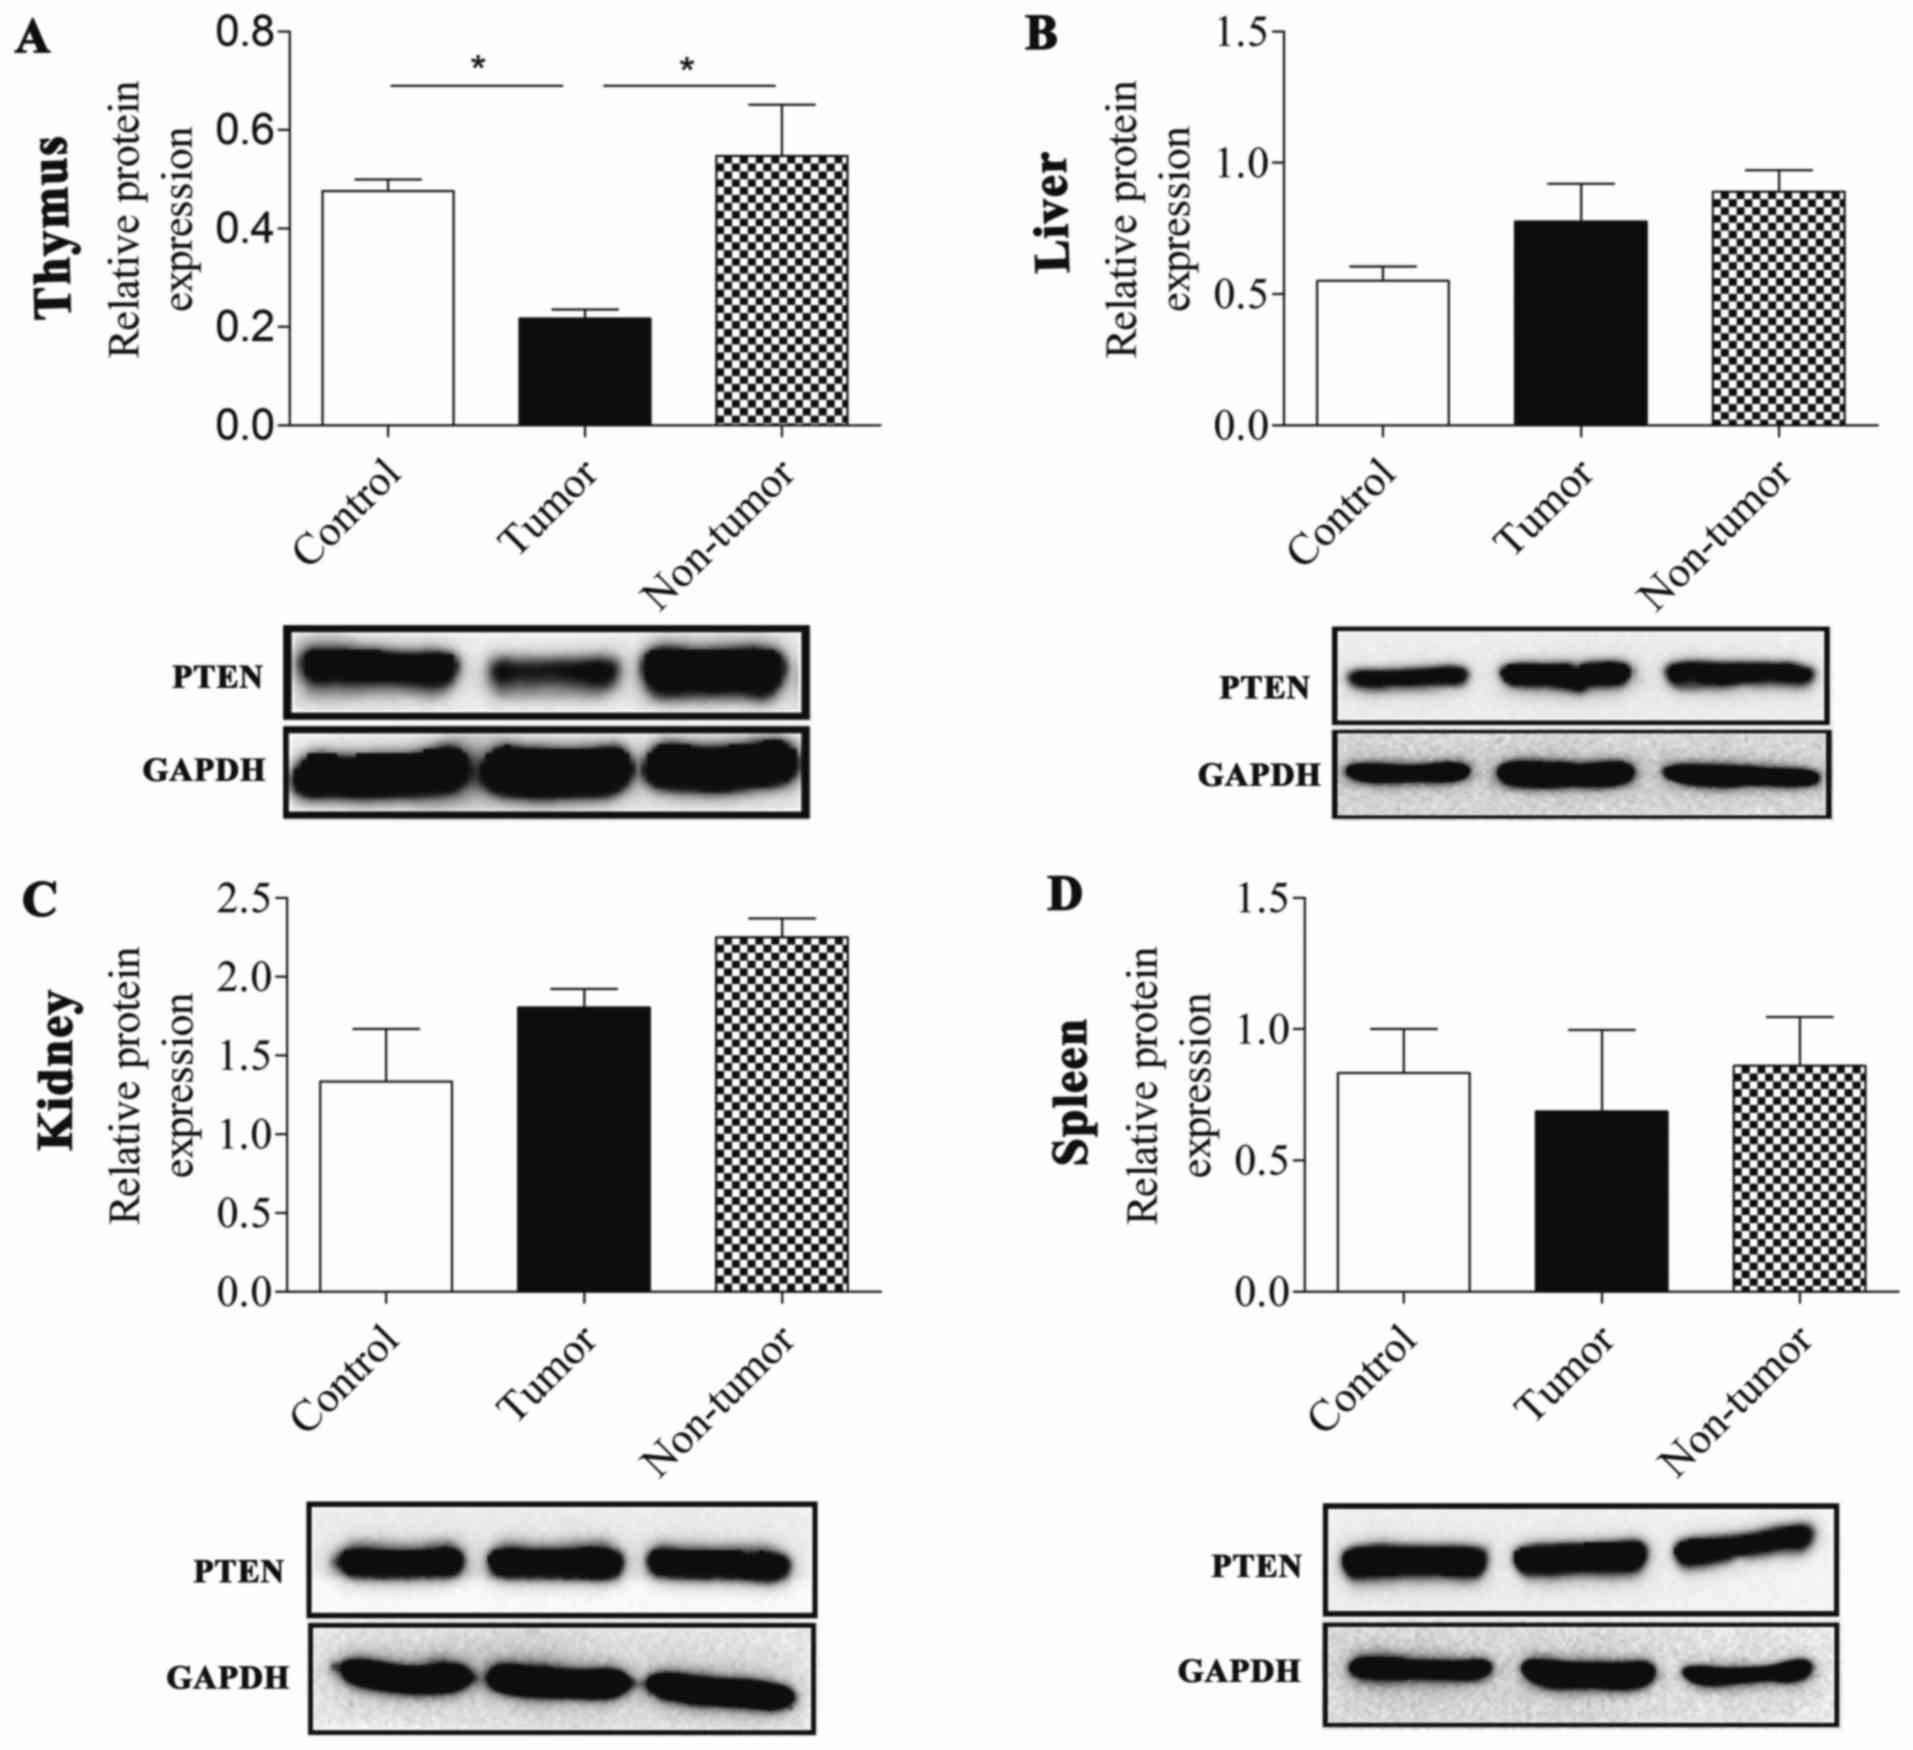
The present study demonstrated that PTEN was
downregulated in MNU-induced thymic lymphoma tissues relative to
the control and non-tumor groups (P=0.027 and P=0.01,
respectively). Conversely, PTEN expression levels were not
downregulated in tumor or non-tumor groups of the liver, kidney and
spleen compared with the control group. In addition, the PTEN
expression level in the liver and kidney were slightly increased
compared with the control (Fig. 2;
Table II).
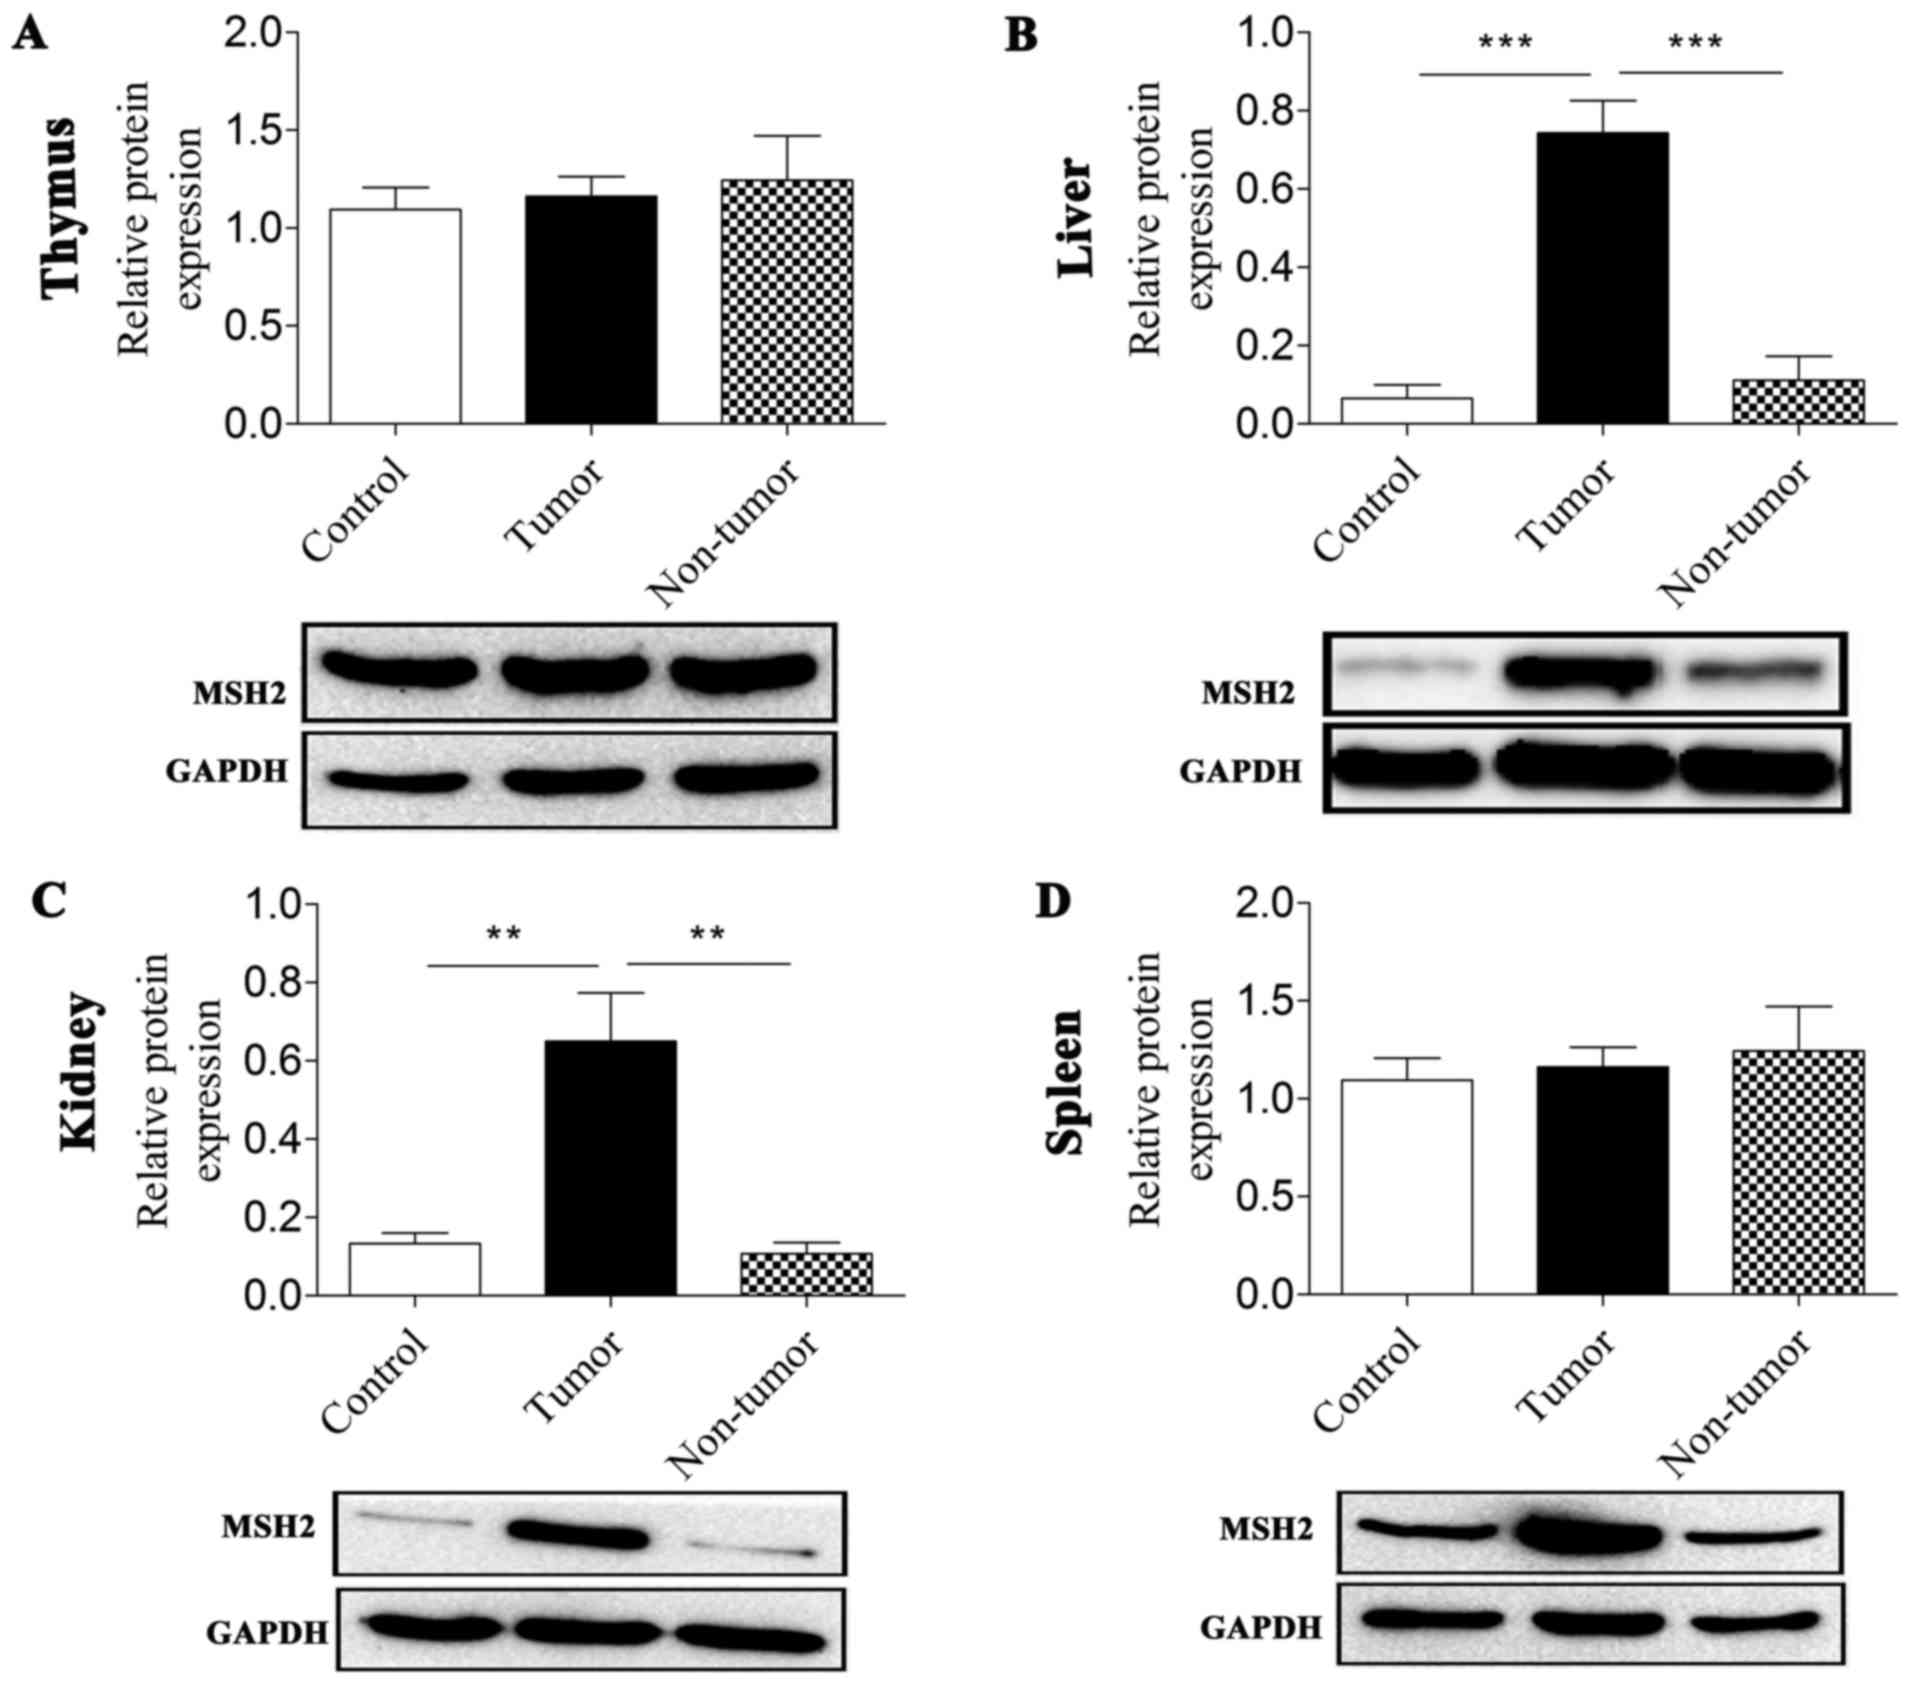
The expression level of MSH2 revealed distinctive
features in the thymus, liver, spleen and kidney tissues. In the
thymus tissue, MNU treatment did not induce any significant changes
in MSH2 expression levels, including in thymic lymphomas and thymus
tissue from the non-tumor group. Of note, the expression levels of
MSH2 in the liver, kidney and spleen in the three groups were
similar to each other. An elevation in MSH2 expression levels was
observed in tumor-bearing tissues compared with in control groups
(P<0.001, P=0.003 and P=0.012 for the liver, kidney and spleen,
respectively) and non-tumor groups (P<0.000 and P=0.002 for the
liver and kidney, respectively; Fig.
3; Table II).
Trp53 methylation status
Subsequently, MassARRAY analysis was performed to
detect the methylation status of the genes for which protein
expression level was markedly altered.
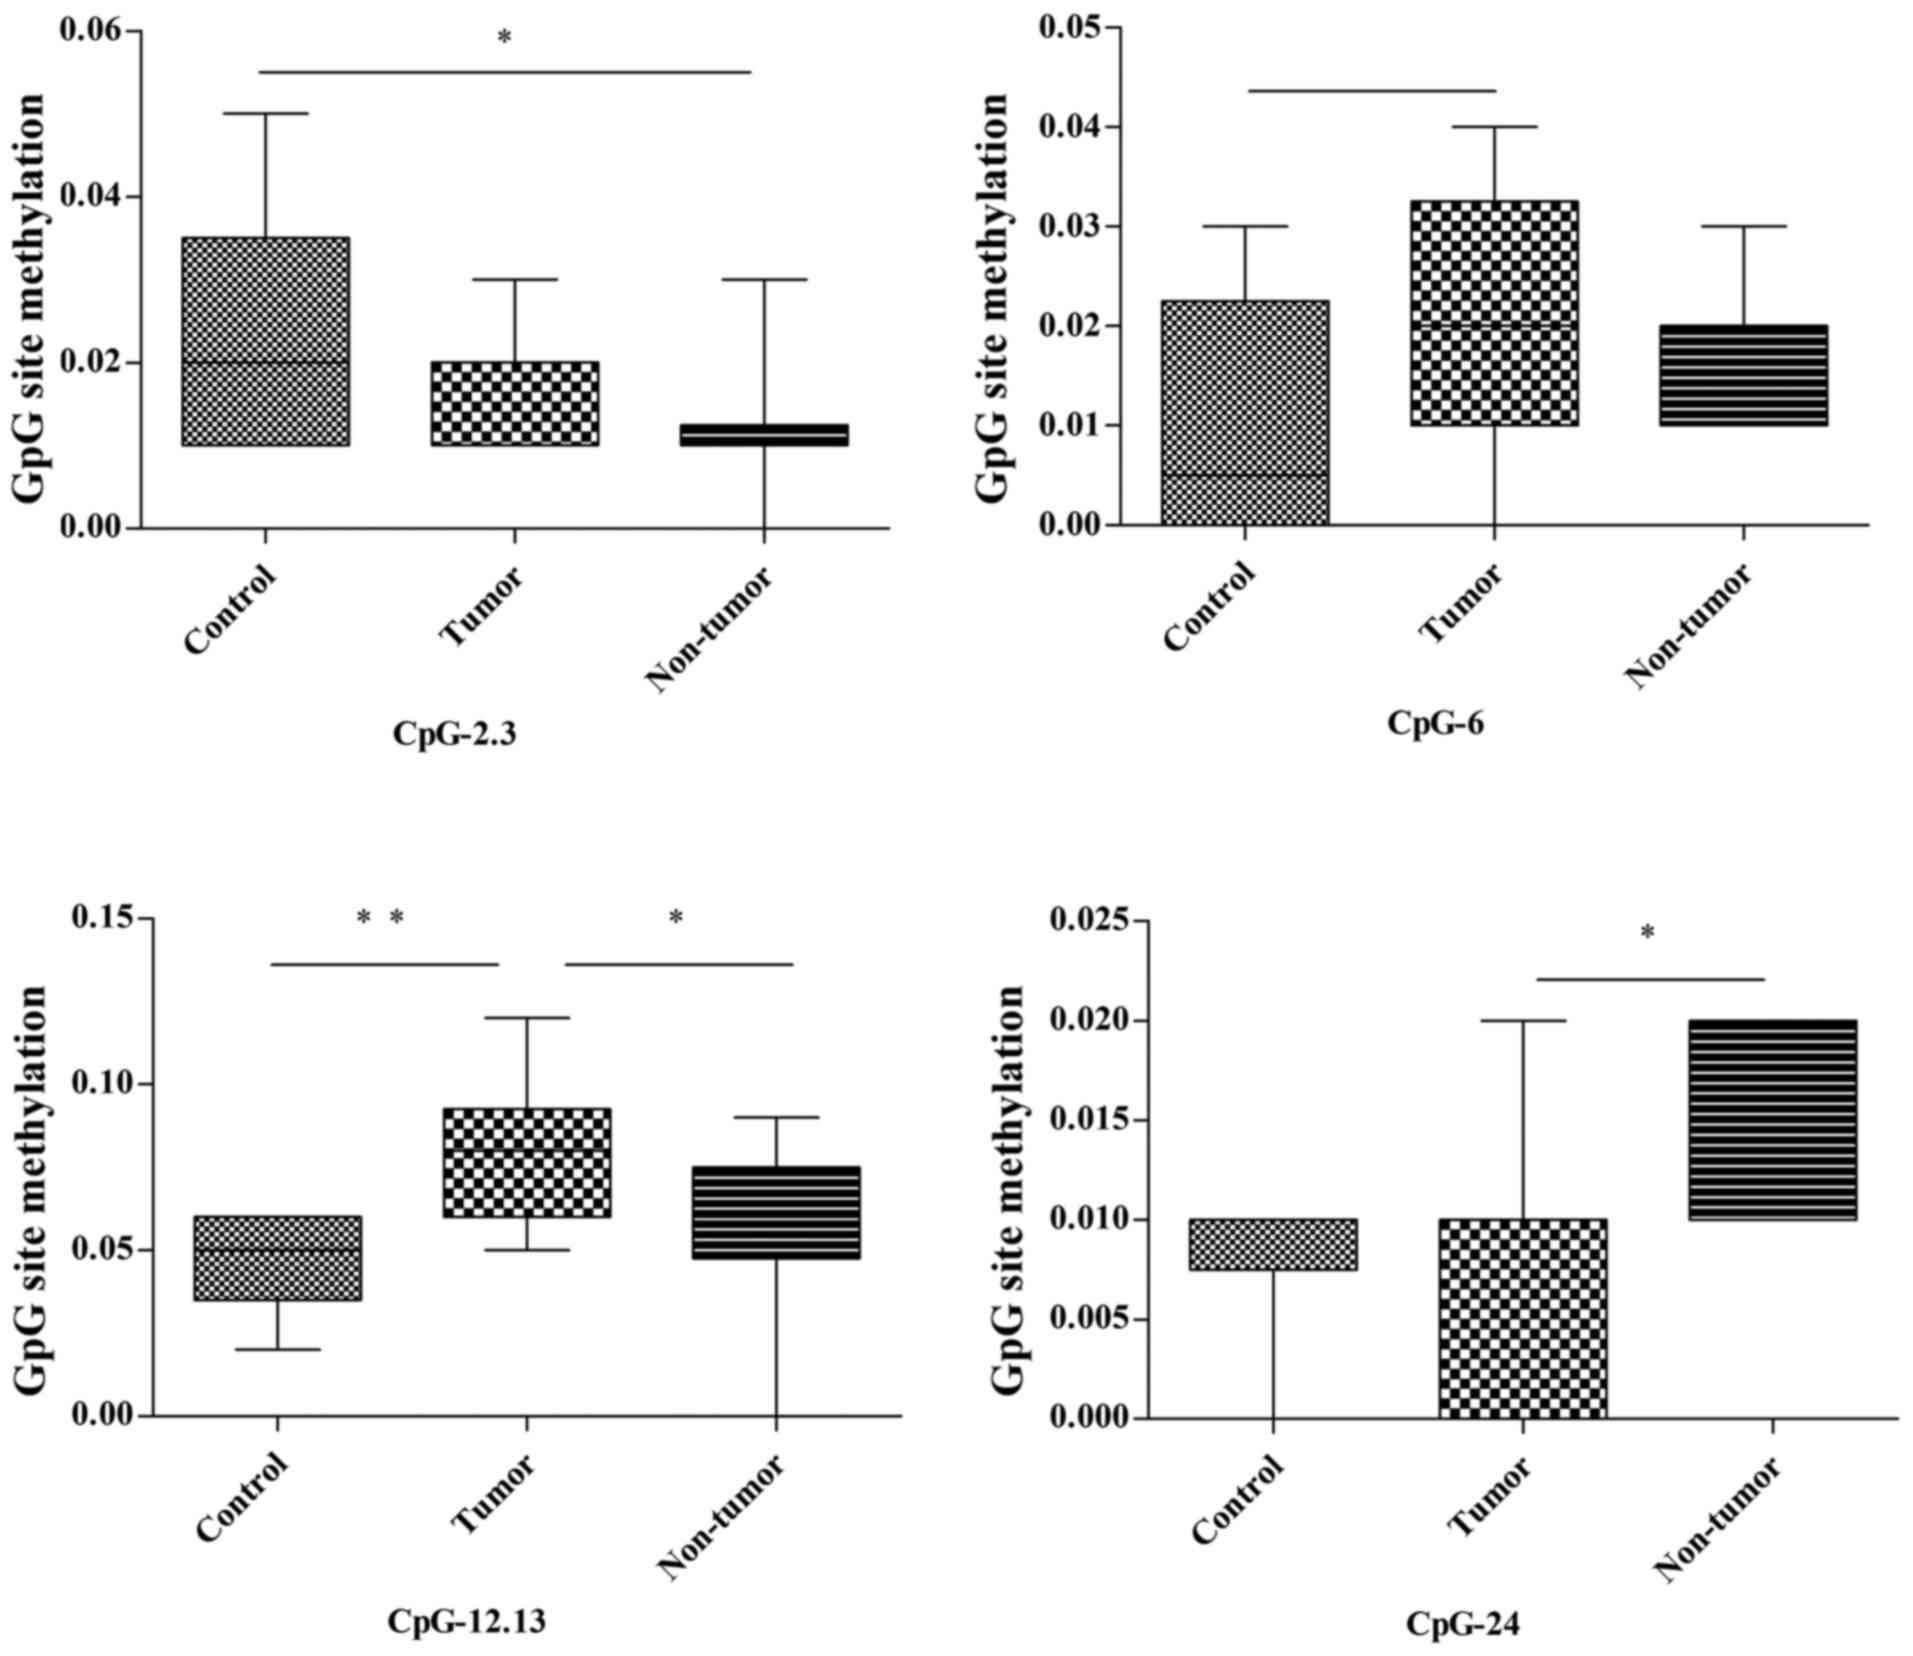
In the thymus, among the 26 detected CpG units in
the Trp53 promoter, 3 (CpG-2.3, CpG-12.13 and CpG-24; 3/26,
11.5%) were differently methylated between the control, tumor and
non-tumor groups (Fig. 4; Table III). The methylation of CpG-2.3 in
the non-tumor group was significantly lower compared with in the
control group (P=0.033); however, there was no statistical
difference between the tumor group and the other two groups
(control and non-tumor) regarding methylation status. The
methylation of CpG-12.13 in the tumor group was notably higher
compared with in the control group (P=0.008) and non-tumor group
(P=0.044); however, there was no significant difference in
methylation status between the control and non-tumor groups. The
methylation of CpG-24 in the tumor group was lower compared with in
the non-tumor group (P=0.047), whereas no statistical difference in
methylation status was revealed between controls and the other two
groups. In addition, CpG-24 methylation was increased in the tumor
group compared with in the control group P=0.07; Fig. 4; Table
III).
| Table III.The methylation alterations of
Trp53, Pten and Msh2. |
Table III.
The methylation alterations of
Trp53, Pten and Msh2.
|
| Thymus | Liver | Kidney | Spleen |
|---|
|
|
|
|
|
|
|---|
| Gene | Unit | C | T | NT | Unit | C | T | NT | Unit | C | T | NT | Unit | C | T | NT |
|---|
| Trp53 | CpG-2.3 | – | ↓ | ↓a |
|
|
|
|
|
|
|
| CpG-5 | – | ↓e | ↓f |
|
| CpG-6 | – | ↑b | ↑ |
|
|
|
|
|
|
|
|
|
|
|
|
|
| CpG-12.13 | – | ↑c | ↑ |
|
|
|
|
|
|
|
|
|
|
|
|
|
| CpG-24 | – | ↓ | ↑d |
|
|
|
|
|
|
|
|
|
|
|
|
| Pten | CpG-11.12 | – | ↑g | ↓ |
|
|
|
|
|
|
|
|
|
|
|
|
|
| CpG-23 | – | ↑h | ↑ |
|
|
|
|
|
|
|
|
|
|
|
|
|
| CpG-24.25 | – | ↑i | ↑j |
|
|
|
|
|
|
|
|
|
|
|
|
| Msh2 |
|
|
|
| CpG-10.11 | – | ↑ | ↑k | CpG-5 | – | ↑ | ↑q |
|
|
|
|
|
|
|
|
|
| CpG-12 | – | ↓ | ↓l | CpG-20 | – | ↑ | ↑r |
|
|
|
|
|
|
|
|
|
| CpG-14.15 | – | ↑ | ↑m | CpG-21 | – | ↓ | ↑s |
|
|
|
|
|
|
|
|
|
| CpG-20 | – | ↓n | ↓o |
|
|
|
|
|
|
|
|
|
|
|
|
|
| CpG-21 | – | ↑ | ↑p |
|
|
|
|
|
|
|
|
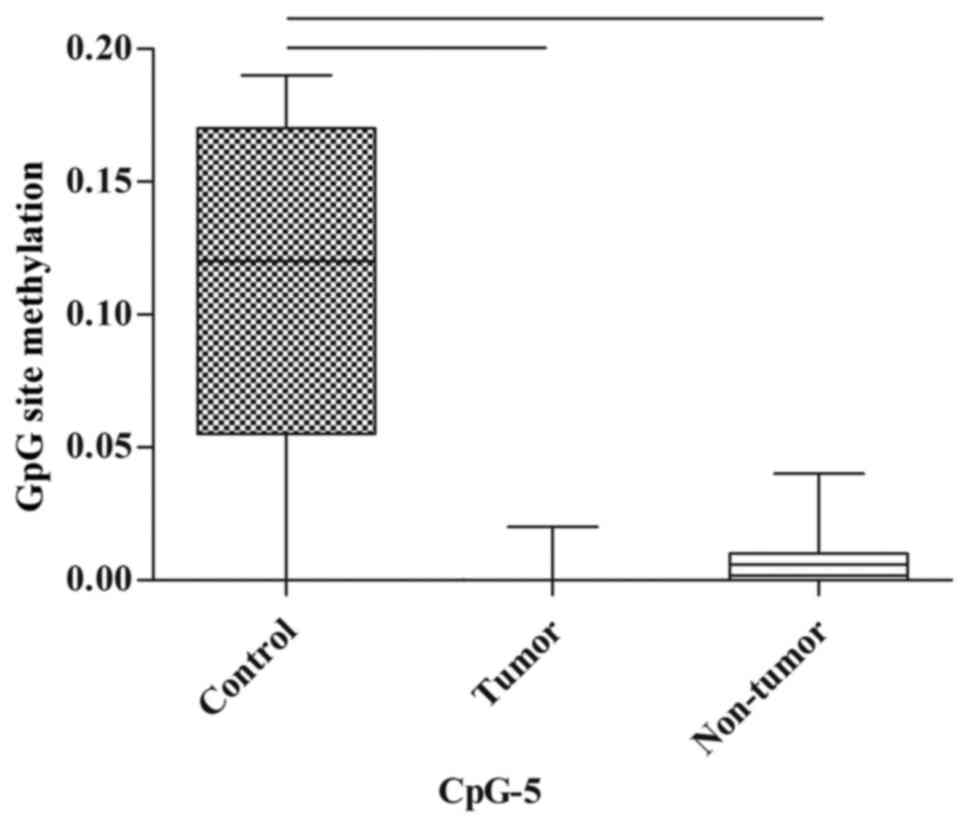
In the spleen, there were no statistically
significant differences in the methylation of CpG sites between the
control, tumor and non-tumor groups; however, the methylation of
CpG-5 tended towards a decrease in the tumor group and non-tumor
group when compared with the control group (P=0.07 and P=0.077,
respectively; Fig. 5; Table III).
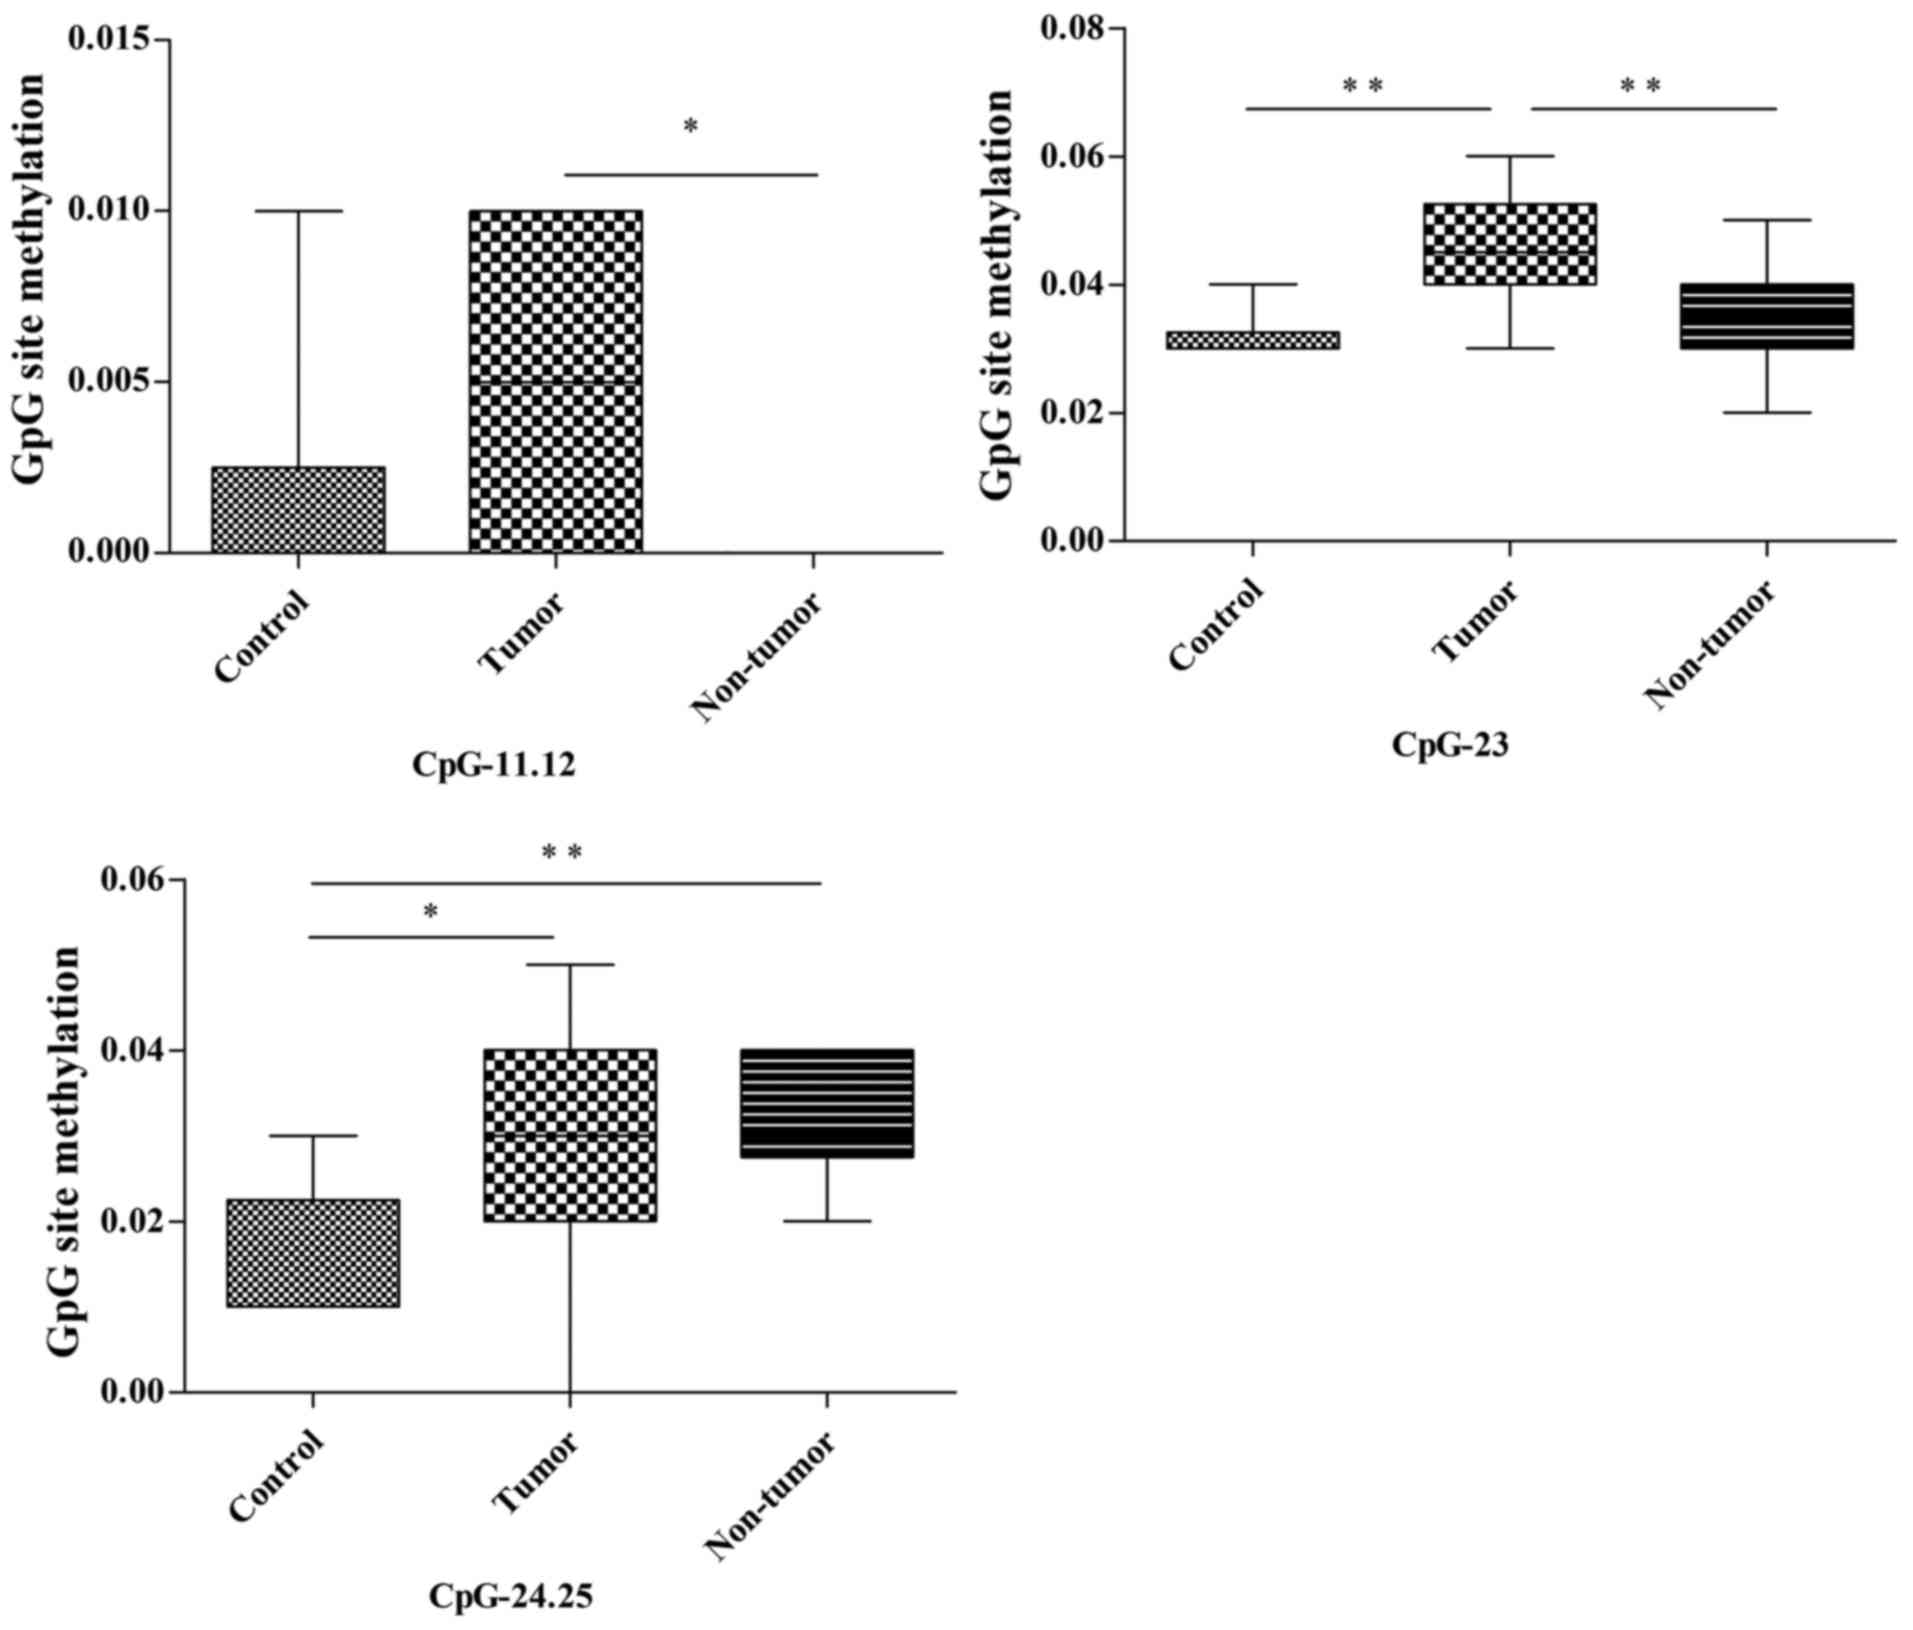
Pten methylation status
Among the 22 CpG units of the Pten promoter in the
thymus, CpG-11.12, CpG-23 and CpG-24.25 (3/22, 13.6%) demonstrated
different methylation statuses in the control, tumor and non-tumor
groups (Fig. 6; Table III). The methylation of CpG-11.12 in
the tumor group was notably higher compared with in the non-tumor
group (P=0.044); however, no statistical differences in methylation
status were identified between the control and tumor/non-tumor
groups. The methylation of CpG-23 in the tumor group was
significantly higher compared with in the control and non-tumor
groups (P=0.003 and P=0.007, respectively); however, there was no
statistical difference in methylation status between the non-tumor
and control groups. The methylation of CpG-24.25 in the tumor and
non-tumor groups were significantly higher compared with in the
control group (P=0.027 and P=0.008, respectively), whereas no
statistical differences in methylation status were revealed between
the tumor and non-tumor groups.
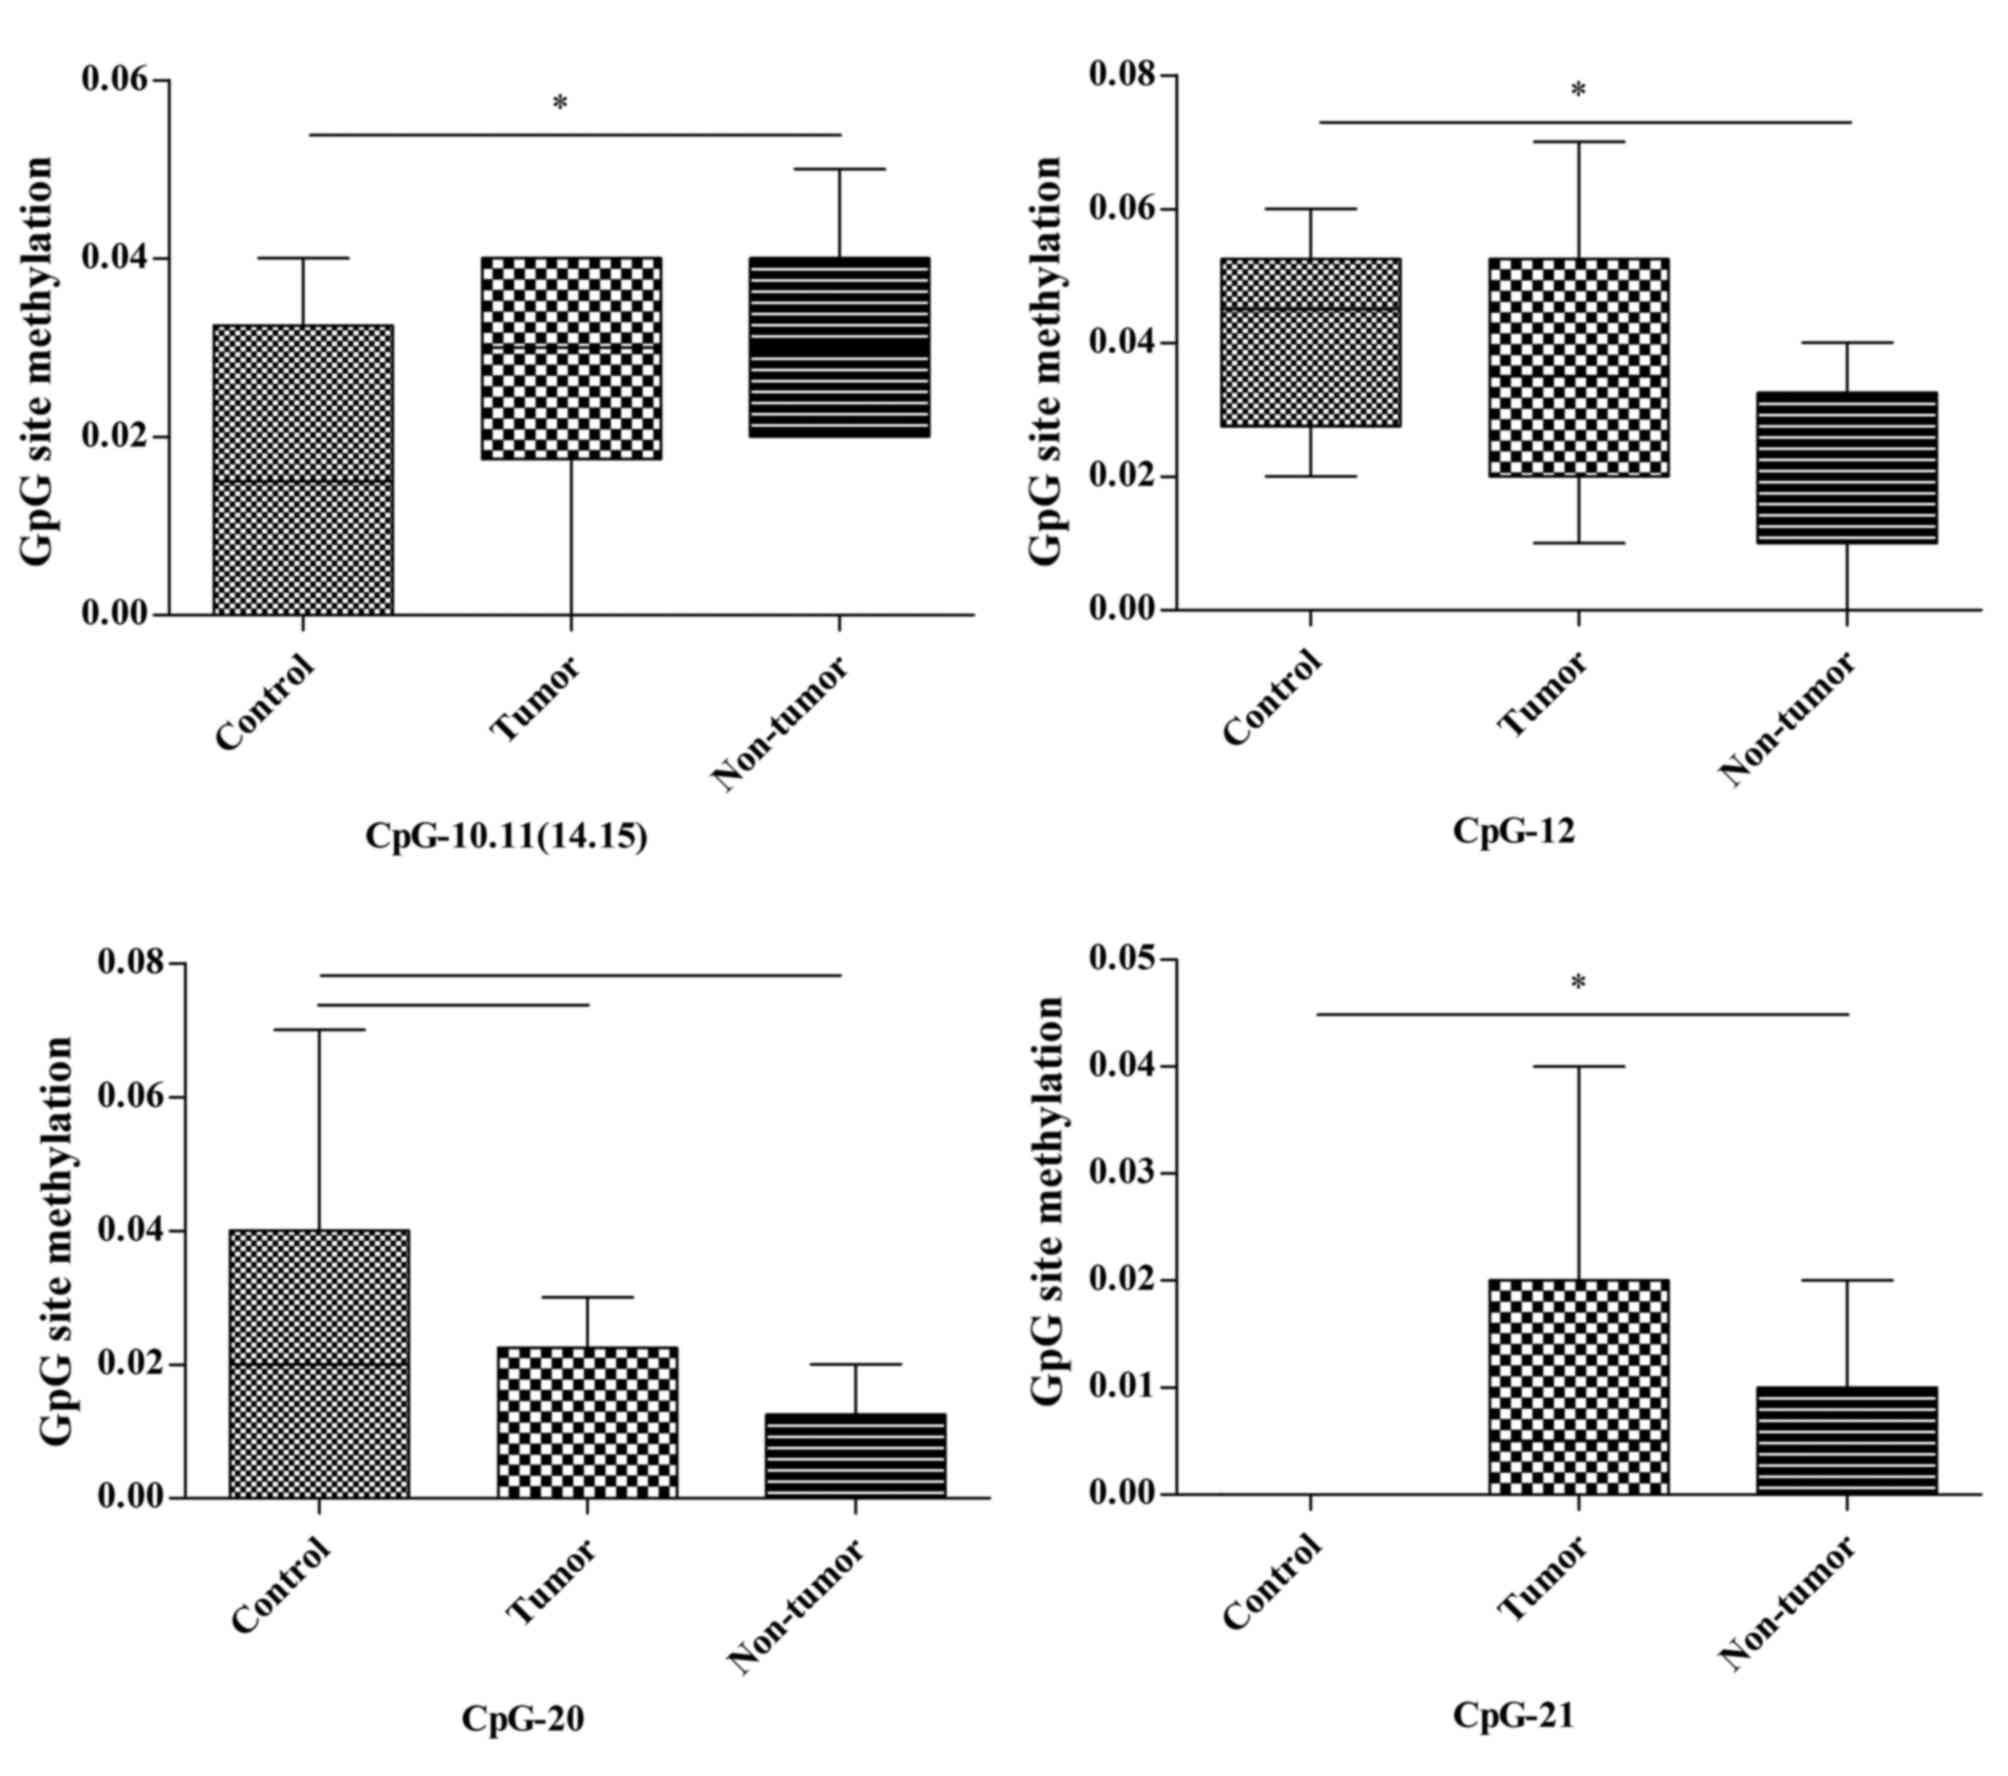
Msh2 methylation status
In the liver, CpG-10.11 (14.15), CpG-12 and CpG-21
(4/22, 18.2%) in 22 CpG units of the Msh2 promoter exhibited
alterations in methylation status across the three groups. The
methylation of CpG-10.11 (14.15) and CpG-21 in the non-tumor group
was significantly increased compared with in the control group
(P=0.036 and P=0.028, respectively). Conversely, the methylation of
CpG-12 in the non-tumor group was significantly lower compared with
in the control group (P=0.048). No other differences were detected
in these CpG sites. The methylation of CpG-20 in the tumor and
non-tumor groups demonstrated a decreased tendency compared with in
the control group (P=0.066 and P=0.066, respectively; Fig. 7; Table
III).
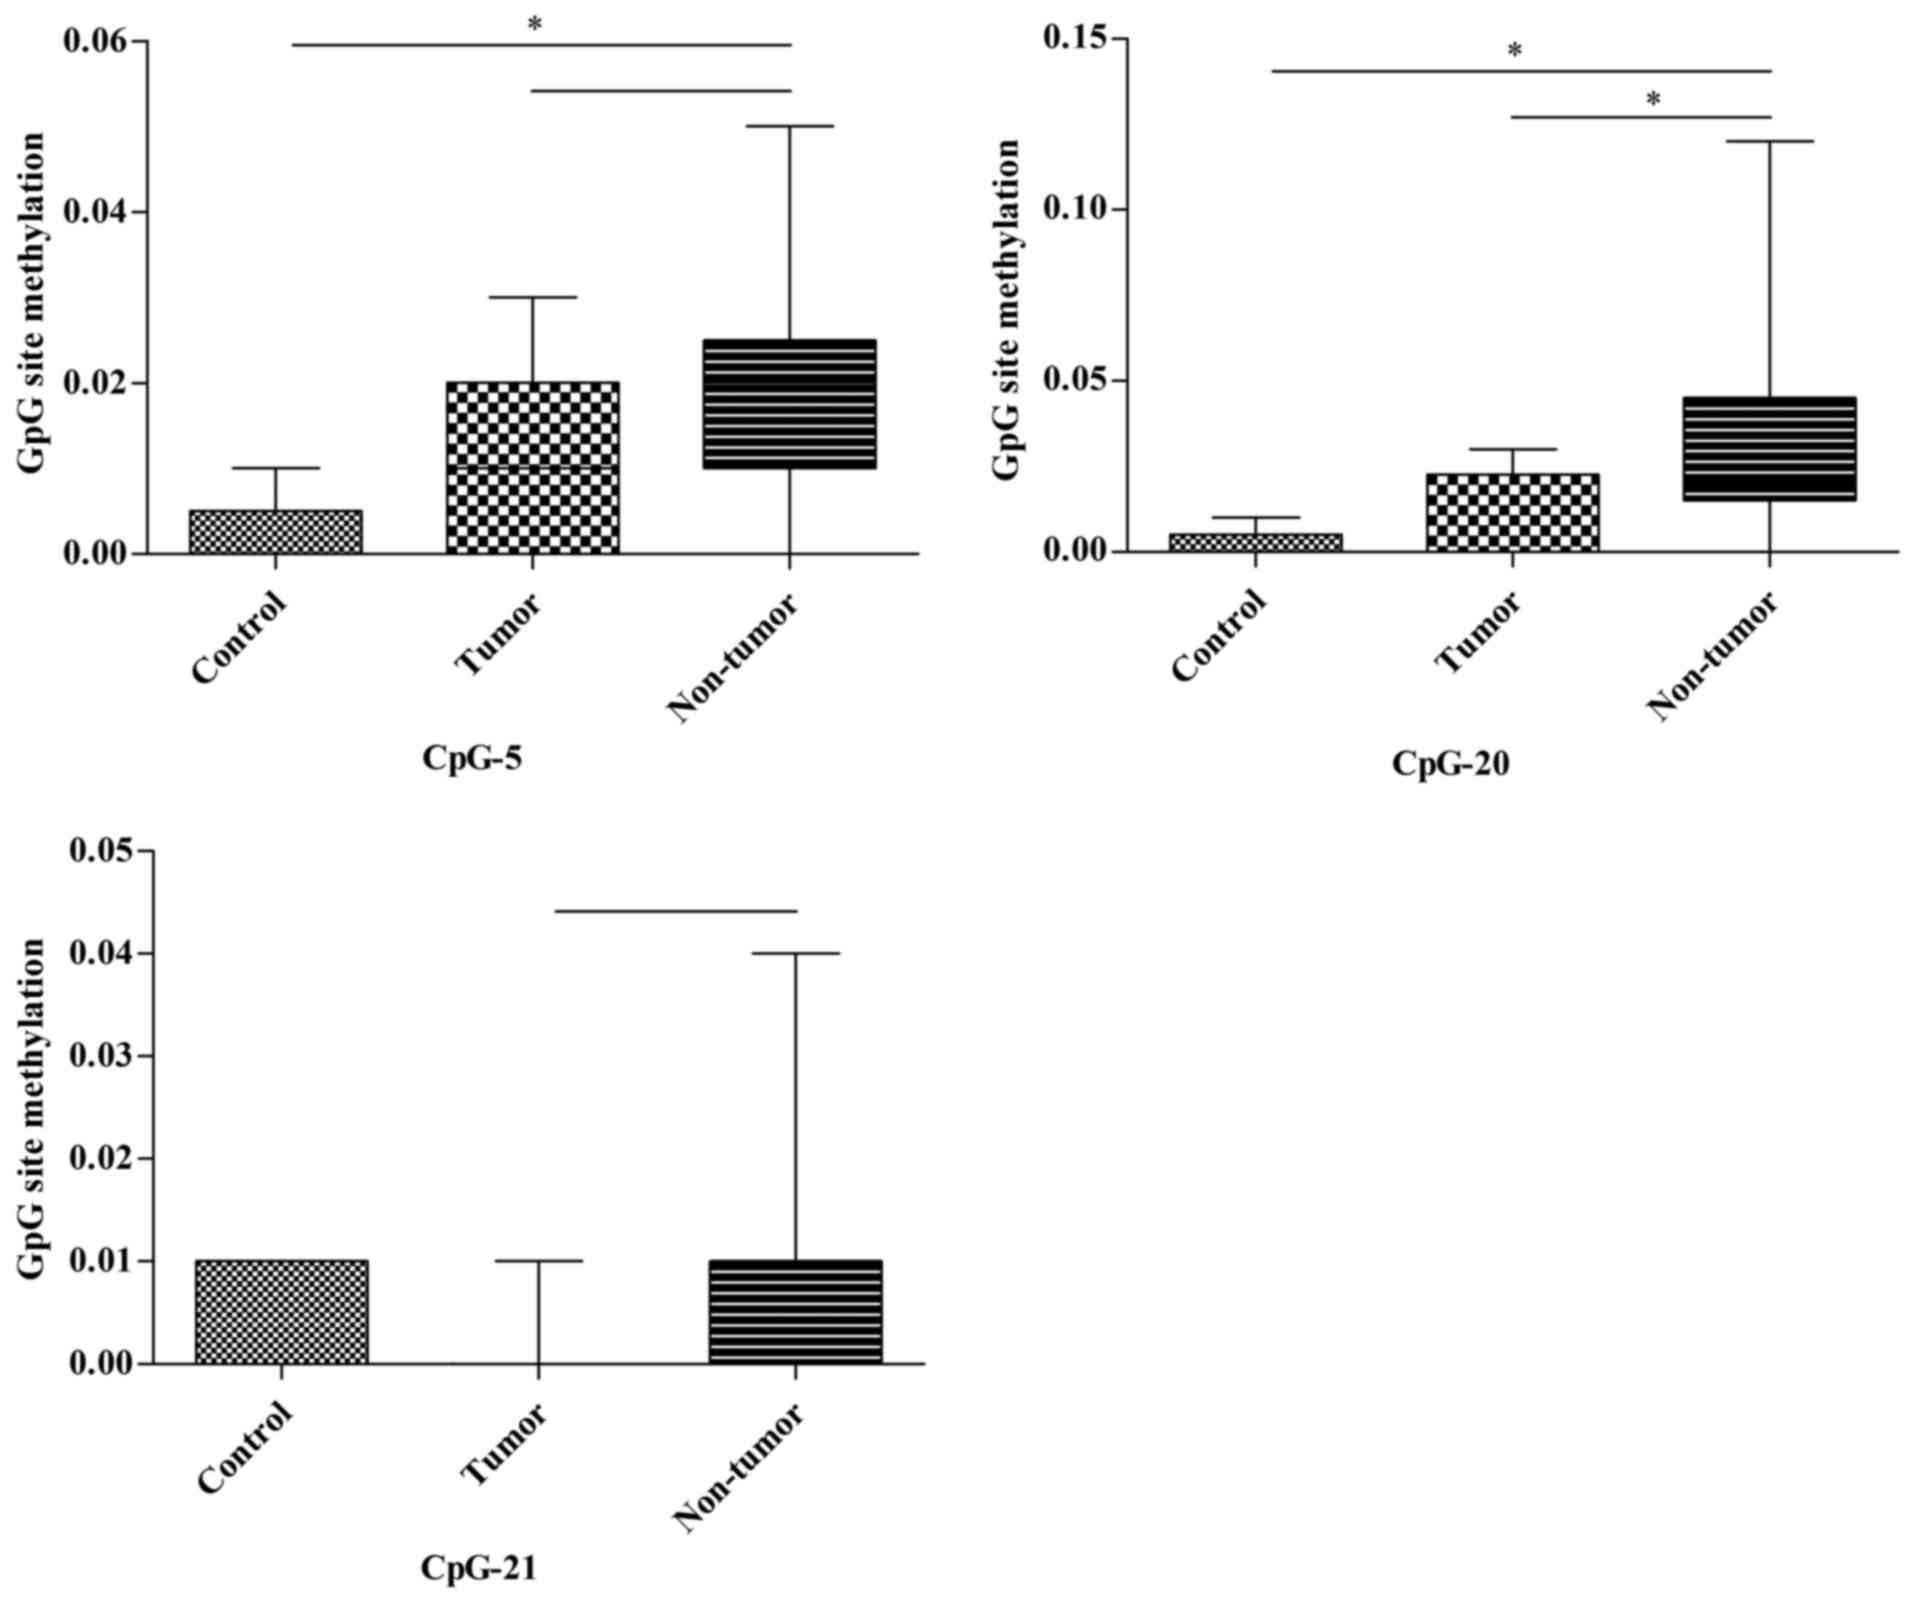
In the kidney, two notable CpG units (2/22, 9.1%) of
the Msh2 promoter were captured. CpG-5 of the Msh2
promoter in the non-tumor group demonstrated a significantly
increased methylation status compared with in the control group
(P=0.009) and a slightly higher methylation tendency compared with
in the tumor group (P=0.068). Similarly, the methylation of CpG-20
in the non-tumor group was significantly higher compared with in
the control and tumor groups (P=0.024 and P=0.031, respectively).
No significant differences were identified in the CpG-5 and CpG-20
units. Furthermore, the methylation of CpG-21 in the non-tumor
group tended to be higher compared with in the tumor group
(P=0.055; Fig. 8; Table III).
In the spleen, none of the 22 CpG sites demonstrated
significant changes of methylation status between the various
groups.
Discussion
Although numerous genes encode tumor suppressors, in
general, each is dedicated to specific defense pathways (19). Therefore, these genes may act during
various periods of tumorigenesis, and may provide a more robust
contribution when they are simultaneously activated. For instance,
Msh2 and Trp53 promote genome stability. However,
Msh2 contributed to the suppression of spontaneous
microsatellite instability (MSI) by directly eliminating altered
sequences at the nucleotide level, but had no effect on
radiation-induced MSI (19).
Conversely, TRP53 suppressed radiation-induced MSI by removing
damaged cells, but did not affect spontaneous MSI in a previous
study (19). Thus, the present study
inferred that it is essential that groups of tumor suppressor genes
are examined concomitantly.
In the present study, the protein expression level
of TRP53 decreased in the thymus in the tumor and non-tumor groups,
indicating that MNU induction impaired TRP53 expression. The marked
reduction of TRP53 protein expression in the tumor group may
suggest that the occurrence of thymic lymphoma is associated with
TRP53 deficiency, which is consistent with previous studies that
reducing TRP53 promoted the development of thymic lymphoma
(20). In the spleen, the TRP53
expression levels in the tumor group were markedly lower compared
with in the control and non-tumor groups. This suggested that there
may be an association between TRP53 deficiency and metastasis of
thymic lymphoma to the spleen.
In the thymus, the downregulation of PTEN in the
thymic lymphoma group but not in the control and non-tumor groups
suggested that PTEN loss may be an aggravating factor in tumor
development. This was supported by a previous study, which revealed
that PTEN deficiency serves an important function in the
oncogenesis of T cell lymphoma (21),
and Pten-knockout mice will develop T cell lymphoma
uniformly within 10–16 weeks (22–25). No
significant difference in the expression levels of PTEN in the
control, tumor and non-tumor groups of the liver, kidney and spleen
were identified, indicating that there was no association between
PTEN expression level and thymic lymphoma metastasis.
The result that there was no significant difference
in MSH2 expression levels in the control, tumor and non-tumor
thymus groups suggested that MSH2 does not serve a major function
in the formation of thymic lymphoma. However, the expression levels
of MSH2 in the liver, kidney and spleen demonstrated a positive
association between MSH2 overexpression and the metastasis of
thymic lymphoma.
According to the aforementioned results, the present
study hypothesized that mice that revealed a reduction in P53 and
PTEN expression levels may be prone to thymic lymphoma development,
that the reduced expression level of TRP53 may promote spleen
metastasis of thymic lymphoma and that the upregulation of MSH2 may
be associated with metastasis of thymic lymphoma to the liver,
kidney and spleen. However, further studies are required to confirm
these hypotheses.
MNU is an alkylating agent that induces extensive
methylation of DNA and hypermethylation in the promoter regions,
which may consequently induce the silencing of numerous tumor
suppressor genes. Accordingly, the present study hypothesized that
aberrant methylations may epigenetically repress gene expression
and promote the formation of thymic lymphoma. However, the
methylation state is not often detectable in tissue samples
(11) and no study has analyzed the
DNA methylation of P53, Pten and Msh2 in
MNU-induced thymic lymphoma. The present study investigated the
methylation status of Trp53, Pten and Msh2 in
four types of MNU-induced tissues.
The reduction of P53 expression levels in thymic
lymphoma may be associated with the hypermethylation of CpG-12.13
and the hypermethylation tendency of CpG-6 in the Trp53
promoter, and P53 expression in the thymic lymphoma was revealed to
be lower compared with that of the non-tumor group. This may
partially be due to the hypermethylation of CpG-12.13.
The downregulation of PTEN in thymic lymphoma may be
associated with the hypermethylation of CpG-23 in Pten. The
lower PTEN expression levels observed in thymic lymphoma compared
with in the non-tumor group may be associated with the
hypermethylation of CpG-23 and CpG-11.12 compared with the
non-tumor group. CpG-24.25, which was hypermethylated in the tumor
and non-tumor thymus tissues, may be associated with MNU treatment
but not PTEN expression levels.
In the liver, the hypermethylation of CpG-10.11
(14,15), CpG-21 and the hypomethylation of
CpG-12 in Msh2, which were all uniquely detected in
non-tumor groups, may be associated with tumor-free status
following MNU induction. Similarly, in the kidney, the
hypermethylation of CpG-5, CpG-20 may be associated with tumor-free
status following MNU induction. However, all the aforementioned
assumptions, which are based on the results of DNA methylation
analysis, require further confirmation.
The present study described the changes in the
expression levels of PTEN, TRP53 and MSH2 concomitantly in
MNU-induced thymic lymphoma, and from the results it was inferred
that tumor suppressor genes may be involved in various stages of
tumor development. The present study also investigated the promoter
methylation profile of each gene and deduced that the methylation
status of certain CpG sites was involved in the regulation of gene
expression. Furthermore, Song et al (11) revealed that hypermethylation of 8 CpG
sites in the p16 promoter may reduce its expression level in
the thymic lymphoma following irradiation; a similar result to the
present study. Additionally, in the Msh2 promoter, the CpG
sites in which methylation status changed in the non-tumor group
specifically may be potential markers of tumor-free status. These
results help to further understanding of the development of
lymphoma. Nevertheless, the underlying molecular mechanisms of
Pten, Trp53 and Msh2 cooperation during
tumorigenesis remain unclear. Further studies are required to
investigate the function of these genes and epigenetic regulation
in mutagen-induced cancer.
References
|
1
|
Han SW, Lee HJ, Bae JM, Cho NY, Lee KH,
Kim TY, Oh DY, Im SA, Bang YJ, Jeong SY, et al: Methylation and
microsatellite status and recurrence following adjuvant FOLFOX in
colorectal cancer. Int J Cancer. 132:2209–2216. 2013. View Article : Google Scholar : PubMed/NCBI
|
|
2
|
Salmena L, Carracedo A and Pandolfi PP:
Tenets of PTEN tumor suppression. Cell. 133:403–414. 2008.
View Article : Google Scholar : PubMed/NCBI
|
|
3
|
Li T, Kon N, Jiang L, Tan M, Ludwig T,
Zhao Y, Baer R and Gu W: Tumor suppression in the absence of
p53-mediated cell-cycle arrest, apoptosis, and senescence. Cell.
149:1269–1283. 2012. View Article : Google Scholar : PubMed/NCBI
|
|
4
|
Vazquez F and Devreotes P: Regulation of
PTEN function as a PIP3 gatekeeper through membrane interaction.
Cell Cycle. 5:1523–1527. 2006. View Article : Google Scholar : PubMed/NCBI
|
|
5
|
Vousden KH and Prives C: P53 and
prognosis: New insights and further complexity. Cell. 120:7–10.
2005. View Article : Google Scholar : PubMed/NCBI
|
|
6
|
Soria JC, Lee HY, Lee JI, Wang L, Issa JP,
Kemp BL, Liu DD, Kurie JM, Mao L and Khuri FR: Lack of PTEN
expression in non-small cell lung cancer could be related to
promoter methylation. Clin Cancer Res. 8:1178–1184. 2002.PubMed/NCBI
|
|
7
|
Jesionek-Kupnicka D, Szybka M, Malachowska
B, Fendler W, Potemski P, Piaskowski S, Jaskolski D, Papierz W,
Skowronski W, Och W, et al: TP53 promoter methylation in primary
glioblastoma: Relationship with TP53 mRNA and protein expression
and mutation status. Dna Cell BioL. 33:217–226. 2014. View Article : Google Scholar : PubMed/NCBI
|
|
8
|
Zeng X and Kinsella TJ: A novel role for
DNA mismatch repair and the autophagic processing of chemotherapy
drugs in human tumor cells. Autophagy. 3:368–370. 2007. View Article : Google Scholar : PubMed/NCBI
|
|
9
|
Harfe BD and Jinks-Robertson S: Sequence
composition and context effects on the generation and repair of
frameshift intermediates in mononucleotide runs in Saccharomyces
cerevisiae. Genetics. 156:571–578. 2000.PubMed/NCBI
|
|
10
|
Campbell MR, Wang Y, Andrew SE and Liu Y:
Msh2 deficiency leads to chromosomal abnormalities, centrosome
amplification, and telomere capping defect. Oncogene. 25:2531–2536.
2006. View Article : Google Scholar : PubMed/NCBI
|
|
11
|
Song W, Liu Y, Liu Y, Zhang C, Yuan B,
Zhang L and Sun S: Increased P16 DNA methylation in mouse thymic
lymphoma induced by irradiation. PLoS One. 9:e938502014. View Article : Google Scholar : PubMed/NCBI
|
|
12
|
Douet V, Heller MB and Le Saux O: DNA
methylation and Sp1 binding determine the tissue-specific
transcriptional activity of the mouse Abcc6 promoter. Biochem
Biophys Res Commun. 354:66–71. 2007. View Article : Google Scholar : PubMed/NCBI
|
|
13
|
Suzuki MM and Bird A: DNA methylation
landscapes: Provocative insights from epigenomics. Nat Rev Genet.
9:465–476. 2008. View
Article : Google Scholar : PubMed/NCBI
|
|
14
|
Nishida N and Kudo M: Alteration of
epigenetic profile in human hepatocellular carcinoma and its
clinical implications. Liver Cancer. 3:417–427. 2014. View Article : Google Scholar : PubMed/NCBI
|
|
15
|
Singla N and Dhawan DK: N-methyl
N-nitrosourea induced functional and structural alterations in mice
brain-role of curcumin. Neurotox Res. 22:115–126. 2012. View Article : Google Scholar : PubMed/NCBI
|
|
16
|
Chang YC, Hsu JD, Lin WL, Lee YJ and Wang
CJ: High incidence of acute promyelocytic leukemia specifically
induced by N-nitroso-N-methylurea (NMU) in Sprague-Dawley rats.
Arch Toxicol. 86:315–327. 2012. View Article : Google Scholar : PubMed/NCBI
|
|
17
|
Huo X, Zhang S, Li Z, Gao J, Wang C, Li C,
Guo M, Du X and Chen Z: Analysis of the relationship between
microsatellite instability and thymic lymphoma induced by
N-methyl-N-nitrosourea in C57BL/6J mice. Mutat Res. 771:21–28.
2015. View Article : Google Scholar : PubMed/NCBI
|
|
18
|
Coolen MW, Statham AL, Gardiner-Garden M
and Clark SJ: Genomic profiling of CpG methylation and allelic
specificity using quantitative high-throughput mass spectrometry:
Critical evaluation and improvements. Nucleic Acids Res.
35:e1192007. View Article : Google Scholar : PubMed/NCBI
|
|
19
|
Otozai S, Ishikawa-Fujiwara T, Oda S,
Kamei Y, Ryo H, Sato A, Nomura T, Mitani H, Tsujimura T, Inohara H
and Todo T: p53-Dependent suppression of genome instability in germ
cells. Mutat Res. 760:24–32. 2014. View Article : Google Scholar : PubMed/NCBI
|
|
20
|
Kamimura K, Ohi H, Kubota T, Okazuka K,
Yoshikai Y, Wakabayashi Y, Aoyagi Y, Mishima Y and Kominami R:
Haploinsufficiency of Bcl11b for suppression of lymphomagenesis and
thymocyte development. Biochem Biophys Res Commun. 355:538–542.
2007. View Article : Google Scholar : PubMed/NCBI
|
|
21
|
Guo W, Schubbert S, Chen JY, Valamehr B,
Mosessian S, Shi H, Dang NH, Garcia C, Theodoro MF, Varella-Garcia
M and Wu H: Suppression of leukemia development caused by PTEN
loss. Proc Natl Acad Sci USA. 108:1409–1414. 2011. View Article : Google Scholar : PubMed/NCBI
|
|
22
|
Buckler JL, Walsh PT, Porrett PM, Choi Y
and Turka LA: Cutting edge: T cell requirement for CD28
costimulation is due to negative regulation of TCR signals by PTEN.
J Immunol. 177:4262–4266. 2006. View Article : Google Scholar : PubMed/NCBI
|
|
23
|
Hagenbeek TJ and Spits H: T-cell lymphomas
in T-cell-specific Pten-deficient mice originate in the thymus.
Leukemia. 22:608–619. 2008. View Article : Google Scholar : PubMed/NCBI
|
|
24
|
Suzuki A, Yamaguchi MT, Ohteki T, Sasaki
T, Kaisho T, Kimura Y, Yoshida R, Wakeham A, Higuchi T, Fukumoto M,
et al: T cell-specific loss of Pten leads to defects in central and
peripheral tolerance. Immunity. 14:523–534. 2001. View Article : Google Scholar : PubMed/NCBI
|
|
25
|
Xue L, Nolla H, Suzuki A, Mak TW and
Winoto A: Normal development is an integral part of tumorigenesis
in T cell-specific PTEN-deficient mice. Proc Natl Acad Sci USA.
105:2022–2027. 2008. View Article : Google Scholar : PubMed/NCBI
|