Introduction
Hepatocellular carcinoma (HCC) is one of the most
common cancers globally. High-risk screening and early detection
have improved the prognosis of patients with HCC. However, the
prognosis of advanced HCC remains poor despite the introduction of
molecular targeted therapies. Portal vein invasion (PVI) is a major
prognostic factor and is associated with intrahepatic metastasis
and recurrence following curative resection.
Des-γ-carboxyprothrombin (DCP) levels and/or macroscopic findings,
including simple nodular type tumors with extranodular growth and
confluent multinodular type tumors, have been reported to be
associated with PVI (1–4). Several molecules, including
ubiquitin-conjugating enzyme E2C (5),
importin-α1 (6), lysosomal-associated
transmembrane protein 4β-35 (7),
protein tyrosine phosphatase type IVA3 (8) and caveolin-1 (9), are reported to be associated with PVI.
However, the precise mechanisms involved in the regulation of PVI
remain to be elucidated. Therefore, identification of the molecules
regulating PVI is expected to contribute to the development of new
molecular targeting therapies.
In the present study, molecules regulating PVI were
probed using laser microdissection (LMD) and cDNA microarray
analysis, and the role of these molecules in human HCC samples was
evaluated.
Materials and methods
Ethics statement
The present study was approved by the Ethics
Committee of Kurume University (Kurume, Japan; approval no. 13029).
Written informed consent was obtained for cases from 2013. The
Ethics Committee waived the requirement for written informed
consent for cases from 2000 to 2004 as the data for these patients
were retrospectively analyzed.
LMD
Frozen sections were obtained from 3 patients with
HCC and PVI. All patients underwent curative hepatectomies for HCC
at Kurume University Hospital (Kurume, Japan) from January 2013 to
March 2013. All patients were male; the patients were 59, 68 and 76
years old. No treatment prior to surgery had been conducted in all
patients.
Cancerous tissue with the PVI and paired
noncancerous tissue was immediately cut from the surgically
resected livers and embedded in Tissue Tek O.C.T. compound (Sakura
Finetek USA, Inc., Torrance, CA, USA). These samples were kept at
−80°C until use in the following procedure.
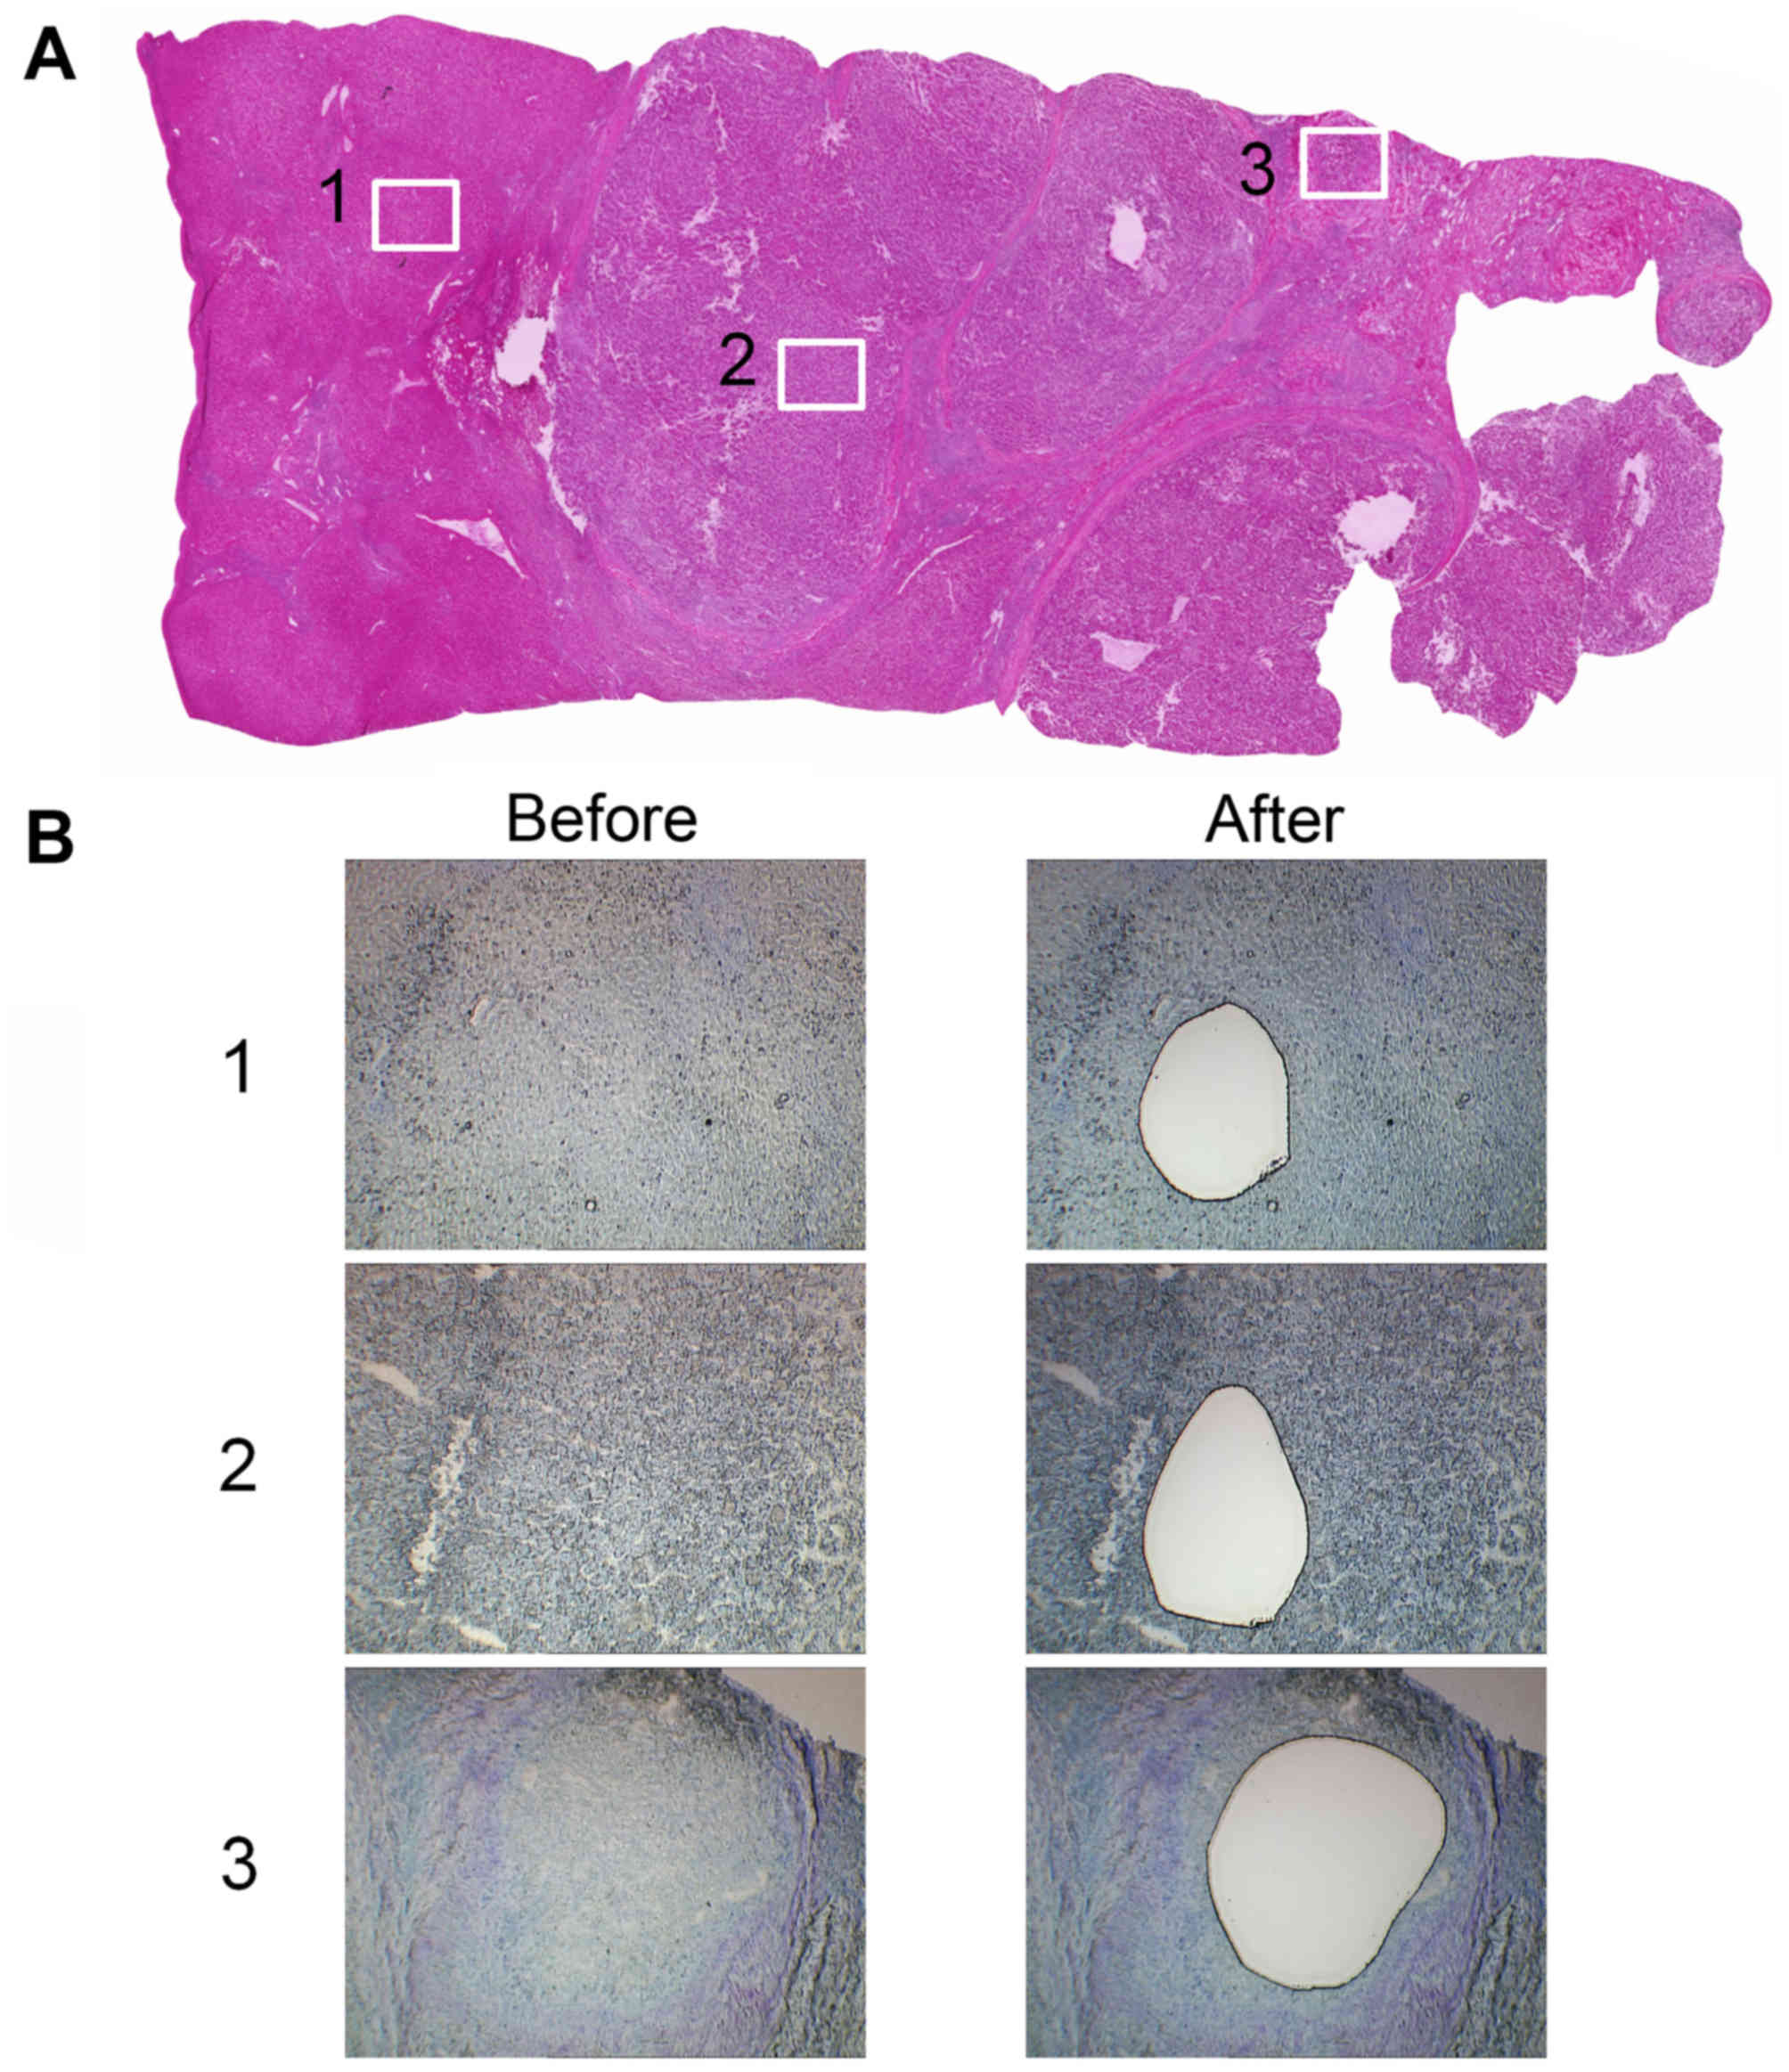
Sections (16 µm) were cut from the frozen tissue and
the sections were stained with 0.05% toluidine blue. Each area
(cancerous, paired noncancerous and PVI area) was microdissected
using an LMD system (Leica LMD6000, Leica Microsystems GmbH,
Wetzlar, Germany; Fig. 1).
Gene expression microarrays
Total RNA in each of the 3 areas was extracted using
an RNAqueous-Micro kit (Ambion; Thermo Fisher Scientific, Inc.,
Waltham, MA, USA) according to the manufacturer's protocol. The
cRNA was amplified and labeled using a Low Input Quick Amp Labeling
kit (Agilent Technologies, Inc., Santa Clara, CA, USA), and
hybridized to a 60K Agilent 60-mer oligomicroarray (SurePrint G3
Human Gene Expression Microarray 8×60 K v2; Agilent Technologies,
Inc., Santa Clara, CA, USA) according to the manufacturer's
protocol. All hybridized microarray slides were scanned using an
Agilent scanner (Agilent Technologies, Inc.). Relative
hybridization intensities and background hybridization values were
calculated using Agilent Feature Extraction software (9.5.1.1;
Agilent Technologies, Inc.).
Data analysis and filter criteria
Raw signal intensities and flags for each probe were
calculated from hybridization intensities (gProcessedSignal) and
spot information (gIsSaturated, etc.), according to the procedures
recommended by Agilent Technologies, Inc. The flag criteria on
GeneSpring software, version 12 (Agilent Technologies, Inc.) was as
follows: Absent (A), feature is not positive, significant or above
background; marginal (M), feature is not uniform, is saturated, and
is a population outlier; present (P), others. The raw signal
intensities of two samples were log2-transformed and
normalized by quantile algorithm with the ‘preprocessCore’ library
package (10) on Bioconductor
software, version 2.12 (11).
Probes with the ‘P’ flag were selected from the two
samples. To identify up or downregulated genes, Z-scores (12) and ratios (non-log scaled fold-change)
were calculated from the normalized signal intensities of each
probe, for comparison between control and experimental samples.
Then, criteria for regulated genes was established as follows:
Upregulated genes were genes with a Z-score ≥2.0 and ratio
≥1.5-fold, while downregulated genes had a Z-score ≤-2.0 and ratio
≤0.66. A heat map was generated using MeV software, version 4.7.2
(13).
Reverse transcription-quantitative
polymerase chain reaction (RT-qPCR)
Frozen cancerous tissue and paired noncancerous
tissue samples were obtained from 32 cases of HCC. All patients
underwent curative hepatectomies for HCC at Kurume University
Hospital (Kurume, Japan) from January 2000 to December 2003. No
patients received preoperative anticancer therapies, including
transcatheter arterial embolization or radiofrequency ablation.
Patients with recurrent HCC and multiple HCC nodules were
excluded.
Total RNA from cancerous tissue and paired
noncancerous tissue was extracted using TRIzol reagent (Invitrogen;
Thermo Fisher Scientific, Inc.), and complementary DNA (cDNA) was
synthesized using the Reverse Transcription System (Promega,
Madison, WI, USA), according to the manufacturers' protocols.
RT-qPCR was performed using a 7500 Real Time PCR System and TaqMan
PCR Gene Expression Master Mix with Taqman PCR assay probe/primers
for integrin β3 (ITGB3; Hs01001469_m1), secreted phosphoprotein 1
(SPP1; Hs00959010_m1), regulator of G-protein signaling 5 (RGS5;
Hs01591223_s1), metallothionein 1 G (MT1G; Hs02578922_gH) and
metallothionein 1H (MT1H; Hs00823168_g1); β-actin (Hs99999903-m1)
was used as an internal control gene (all from Applied Biosystems;
Thermo Fisher Scientific, Inc.). Thermocycler conditions were as
follows: An initial incubation at 50°C for 2 min, then 95°C for 10
min, and then 45 cycles of 95°C for 15 sec, 60°C for 1 min. To
compare the mRNA expression levels in cancerous and noncancerous
tissue, and thus the relationships between mRNA expression levels
and clinicopathological factors, relative gene expression levels
normalized by β-actin were calculated using the 2−ΔΔCq
method (14).
Morphological observations
Formalin-fixed, paraffin embedded (FFPE) 4-µm
sections were deparaffinized with xylene and soaked in hematoxylin
for 5 min, followed by eosin for 5 min, at room temperature.
Morphological observations were conducted on these FFPE sections
under a light microscope (low magnification ×40 to high
magnification ×400; BX41; Olympus Corporation, Tokyo, Japan).
Immunohistochemistry
To further validate the expression of the candidate
genes identified by cDNA microarrays at the protein level and their
relationships with clinicopathologic factors, immunohistochemical
staining was performed on 4-µm FFPE tissue sections from 60 cases
of HCC, containing cancerous and noncancerous tissues, that were
surgically resected at Kurume University Hospital (Kurume, Japan)
between January 2000 and December 2004. Of these 60 cases, 29 were
additionally used in the RT-qPCR analysis. No patients received
preoperative anticancer therapies, including transcatheter arterial
embolization or radiofrequency ablation, prior to surgical
resection. Patients with recurrent HCC and multiple HCC nodules
were excluded. Clinicopathological features of the 60 patients with
HCC are summarized in Table I.
Sections (4 µm) were cut from the FFPE liver samples that contained
cancerous tissue and paired noncancerous tissue.
 | Table I.Clinicopathological factors of the 60
cases of hepatocellular carcinoma. |
Table I.
Clinicopathological factors of the 60
cases of hepatocellular carcinoma.
| Clinicopathological
factor | Value |
|---|
| Age (years; mean ±
SD) | 66.3±10.2 |
| Sex
(male/female) | 52/8 |
| Serum AFP levels
(ng/ml; mean ± SD) | 1733.4±5872.1 |
| Serum DCP levels
(mAU/ml; mean ± SD) | 3377.7±12947.7 |
| Gross type, n
(%) |
|
| SN | 39 (65.0) |
| SNEG | 13 (21.7) |
| CM | 7 (11.7) |
| SNIM | 1 (1.7) |
| Tumor size (mm; mean
± SD) | 36.0±21.9 |
| Histological grade, n
(%) |
|
|
Well-differentiated | 2 (3.3) |
|
Moderately-differentiated | 51 (85.0) |
|
Poorly-differentiated | 7 (11.7) |
| Capsule formation, n
(%) | 45 (75.0) |
| Capsule invasion, n
(%) | 43 (71.7) |
| Portal vein invasion,
n (%) | 24 (40.0) |
| Intrahepatic
metastasis n (%) | 9 (15.0) |
For RGS5, the sections were deparaffinized and
rehydrated with xylene and 100% graded ethanol, respectively. The
sections were subsequently soaked in Target Retrieval Solution, pH
9 (Dako; Agilent Technologies, Inc.) and treated at 95°C in a
pressure cooker for 40 min. Immunohistochemical staining was
performed using a CSA II system (Dako; Agilent Technologies, Inc.)
according to the manufacturer's protocol, with minor modification.
The modifications were as follows: Endogenous peroxidase activity
was quenched by incubation in H2O2 for 30
min. Nonspecific binding sites were blocked using a blocking
solution for endogenous peroxidase (Dako; Agilent Technologies,
Inc.) for 30 min, then tissue sections were incubated with the
primary antibody for 15–60 min at room temperature. The primary
antibody used was a mouse monoclonal anti-human RGS5 (clone, 1C1;
cat no. NBP2-00880; dilution, 1:250; Novus Biologicals, LLC,
Littleton, CO, USA).
The results of the staining were evaluated
independently, according to the staining intensity and the
percentage of positive cells, by two pathologists, using the
previously described light microscope. Initially, the whole slide
was observed at ×40 magnification in order to assess the percentage
of stained area. The staining intensity was then assessed at ×200
magnification. The number of fields of view assessed depended on
the stained area percentage. The staining intensity of the
cancerous and PVI areas was scored on a scale from 0 to 3 compared
with the noncancerous area, as follows: 0, when the intensity in
the cancerous area was equal to that of the noncancerous area; 1,
when the intensity in the cancerous area was slightly higher than
that in the noncancerous area; 2, moderately higher and 3, markedly
higher. The total expression score in the cancerous area was
calculated by multiplying the staining intensity score by the
percentage of stained area.
Statistical analysis
The Mann-Whitney U-test was used to examine the
expression levels of ITGB3, SPP1, RGS5, MT1G and MT1H between
noncancerous tissues and cancerous tissues, and to examine the
association between expression levels of these molecules and
clinicopathological factors. Associations among RGS5 expression,
serum DCP levels, serum α-fetoprotein (AFP) levels (as evaluated
during routine practice, prior to the present study) and tumor size
were examined by calculating Spearman's rank correlation
coefficients. Associations between RGS5 expression levels, serum
DCP levels and serum AFP levels with clinicopathological factors
were examined using Mann-Whitney U-tests. Logistic regression was
used to determine whether RGS5 expression, serum DCP levels and
serum AFP levels were associated with intrahepatic metastasis (IM)
or PVI, adjusting for other clinicopathological factors including
age, sex, histological grade and gross type. Furthermore, logistic
regression was used to examine whether RGS5 expression, serum DCP
levels and serum AFP levels were associated with gross type,
adjusting for other clinicopathological factors. P<0.05 was
considered to indicate a statistically significant difference.
Results
cDNA microarray analysis
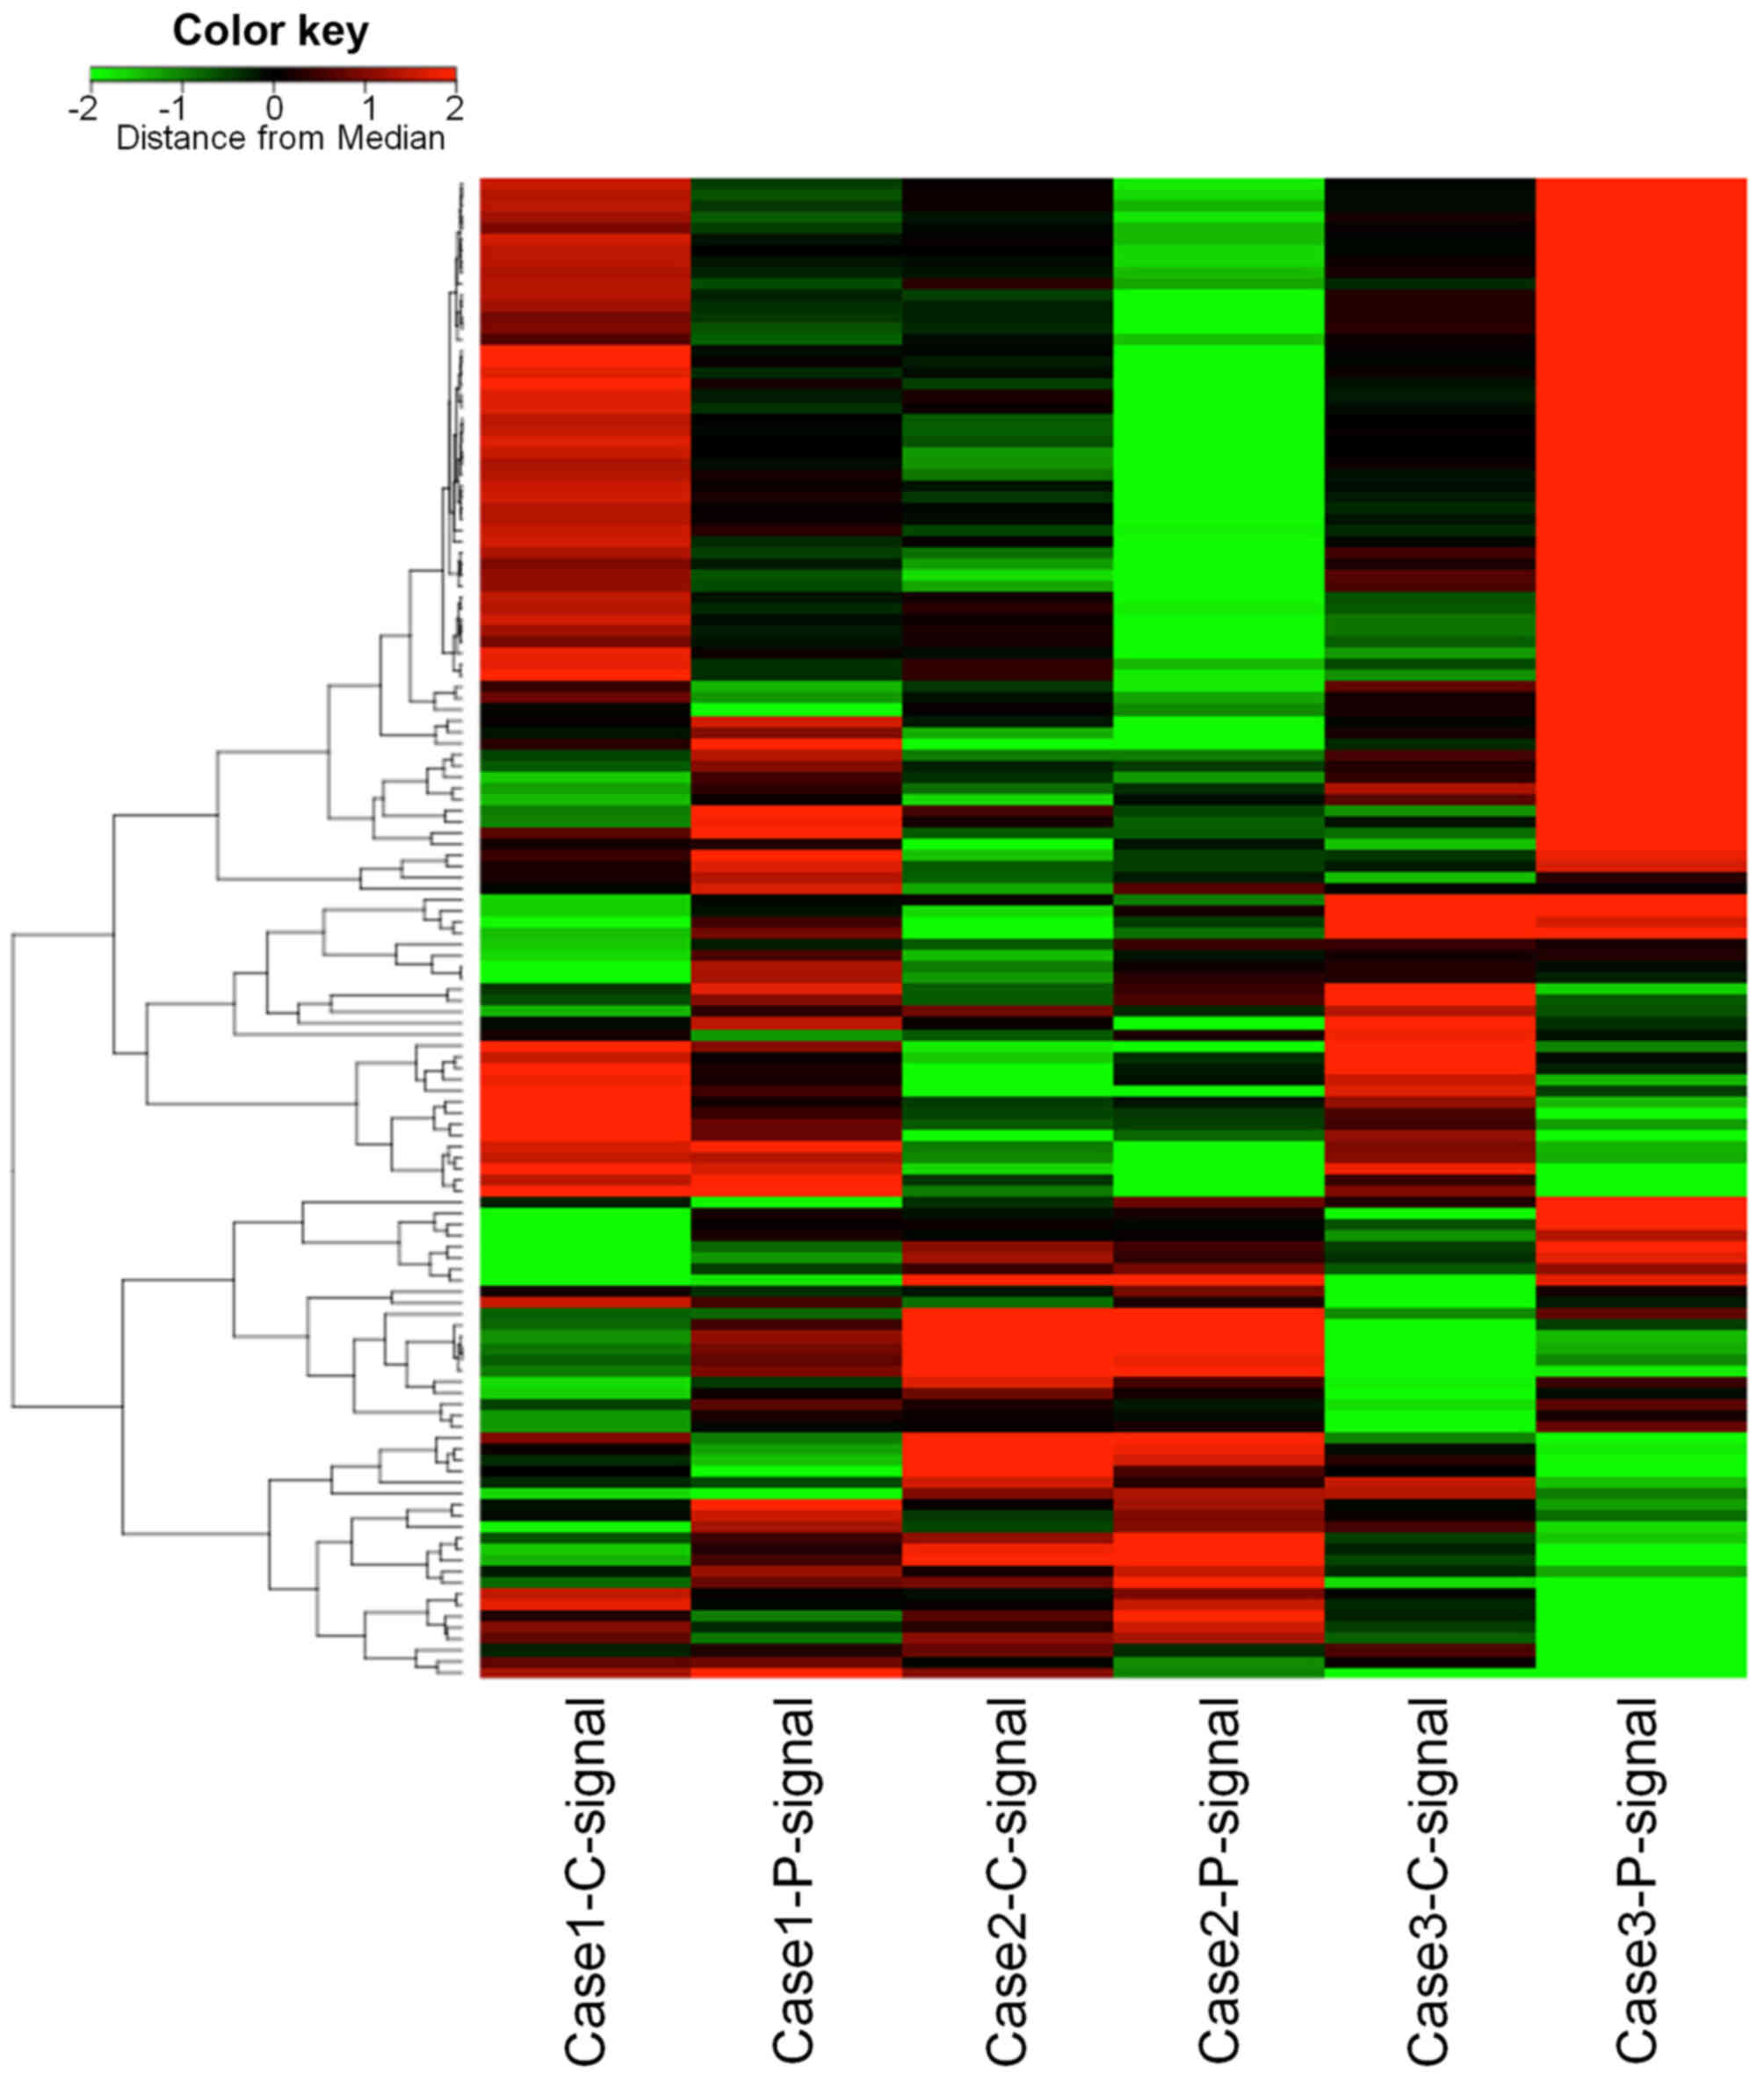
Upregulated or downregulated molecules in PVI tissue
compared with cancerous tissue were detected by cDNA microarray
analysis (Fig. 2). Only ITGB3 was
upregulated in all 3 HCC cases that were examined. On the other
hand, MT1G and MT1H were downregulated in all 3 cases. Of the
upregulated molecules in 2 cases with high Z-scores, SPP1 and RGS5
were selected. Integrins are a family of transmembrane receptors
and SPP1 is a ligand of integrin αVβ3, which
is a combination of integrin subunit αV and
β3. RGS5 has been reported to be a marker of
cancer-associated endothelial cells (15) and is an endothelial cell marker that
is highly expressed in HCC (16).
Therefore, ITGB3, SPP1, RGS5, MT1 G and MT1H were focused on by the
present study.
RT-qPCR analysis
RGS5 was significantly overexpressed at the mRNA
level in cancerous tissue compared with noncancerous tissue
(P=0.0196; Fig. 3). However, there
was no significant difference in ITGB3 and SPP1 mRNA expression
(P=0.1265 and P=0.1165, respectively; Fig. 3). MT1G and MT1H mRNA expression levels
were significantly lower in cancerous tissue compared with
noncancerous tissue (P<0.01; Fig.
3). There were no significant associations between the
expression of these molecules and any clinicopathological factors,
including PVI.
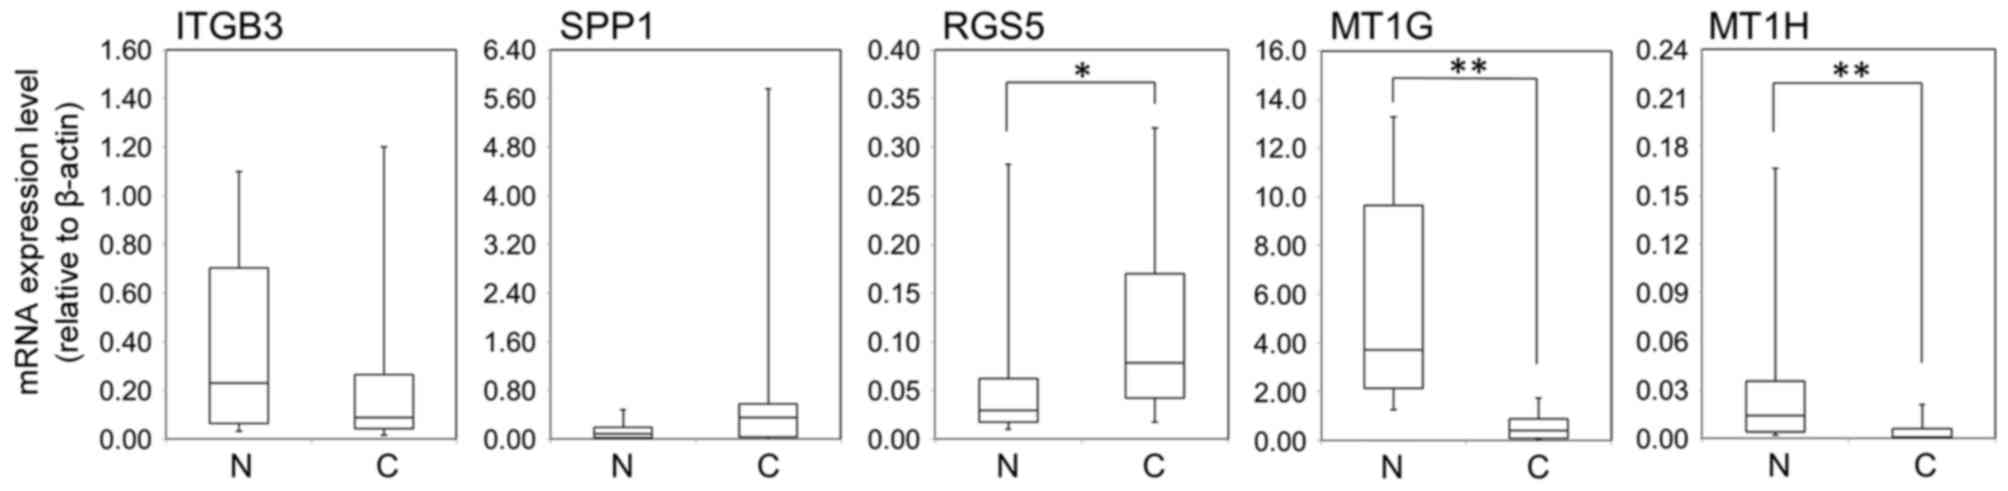 | Figure 3.Comparison of ITGB3, SPP1, RGS5, MT1G
and MT1H gene expression levels between N and C tissue. Capped bars
represent the 10 and 90th percentiles. *P<0.05 and **P<0.01
vs. N. ITGB3, integrin β3; SPP1, secreted phosphoprotein 1; RGS5,
regulator of G-protein signaling 5; MT1 G, metallothionein 1G;
MT1H, metallothionein 1H; N, noncancerous; C, cancerous. |
RGS5 expression in HCC and
clinicopathological factors
Immunohistochemical staining demonstrated that RGS5
protein expression was higher in cancerous tissue compared with
paired noncancerous tissue in 38/60 (63.3%) of HCC cases. RGS5
expression was observed in the cytoplasm. The average RGS5
expression score in cancerous tissue was 0.58±0.68. RGS5 expression
was significantly associated with PVI (P=0.0025; Table II) and tended to be associated with
IM (P=0.1019; Table II). Out of RGS5
expression, serum DCP levels and serum AFP levels, only RGS5 was
significantly associated with gross type (P=0.0068; Table II): RGS5 was higher in the confluent
multinodular type. Spearman's rank correlation coefficients for
RGS5 expression, serum DCP levels, serum AFP levels and tumor size
revealed that RGS5 expression and serum AFP levels were
significantly associated with each other (r=0.387; P=0.0027), RGS5
expression was not associated with serum DCP levels or tumor size.
On the other hand, serum DCP levels were significantly associated
with tumor size (r=0.596; P<0.0001).
| Table II.Summary of RGS5 expression by portal
vein invasion, intrahepatic metastasis and clinicopathological
factors. |
Table II.
Summary of RGS5 expression by portal
vein invasion, intrahepatic metastasis and clinicopathological
factors.
| Clinicopathological
factor | n | min | q1 | median | q3 | max | P-value |
|---|
| Sex |
|
|
|
|
|
| 0.4891 |
|
Female | 8 | 0.1 | 0.15 | 0.4 | 0.75 | 1.3 |
|
|
Male | 52 | 0 | 0 | 0.2 | 1.15 | 2.4 |
|
| Gross type |
|
|
|
|
|
| 0.0068 |
| SN | 39 | 0 | 0 | 0.1 | 0.5 | 1.9 |
|
|
SNEG | 13 | 0.1 | 0.5 | 1 | 1.3 | 2.1 |
|
| CM | 7 | 0 | 0 | 0.6 | 2.3 | 2.4 |
|
|
SNIM | 1 | 0 | 0 | 0 | 0 | 0 |
|
| Histological
grade |
|
|
|
|
|
| 0.0313 |
|
Well | 2 | 0 | 0 | 0.1 | 0.2 | 0.2 |
|
|
Moderate | 51 | 0 | 0 | 0.2 | 1.1 | 2.4 |
|
|
Poor | 7 | 0.3 | 0.4 | 0.6 | 1.8 | 2.1 |
|
| Portal vein
invasion |
|
|
|
|
|
| 0.0025 |
| − | 36 | 0 | 0 | 0.05 | 0.5 | 1.6 |
|
| + | 24 | 0 | 0.15 | 0.8 | 1.45 | 2.4 |
|
| Intrahepatic
metastasis |
|
|
|
|
|
| 0.1019 |
| − | 51 | 0 | 0 | 0.2 | 1 | 2.4 |
|
| + | 9 | 0 | 0.5 | 0.8 | 1.4 | 1.9 |
|
The results of the logistic regression analyses for
PVI and IM were summarized in Tables
III and IV, respectively. In
these analyses, patients with well-differentiated type or small
nodular type with an indistinct margin were excluded, since only a
few patients were classified into these categories. Gross type was
associated with PVI (P=0.0012; Table
III), whereas RGS5 expression, serum DCP levels and serum AFP
levels were not associated with PVI. No clear association was
observed between IM and gross type (P=0.0698; Table IV). Logistic regression analysis for
associations between gross type and other factors revealed that
RGS5 expression was significantly associated with gross type
(P=0.0145; Table V), but not with
serum DCP levels or serum AFP levels, upon adjusting for other
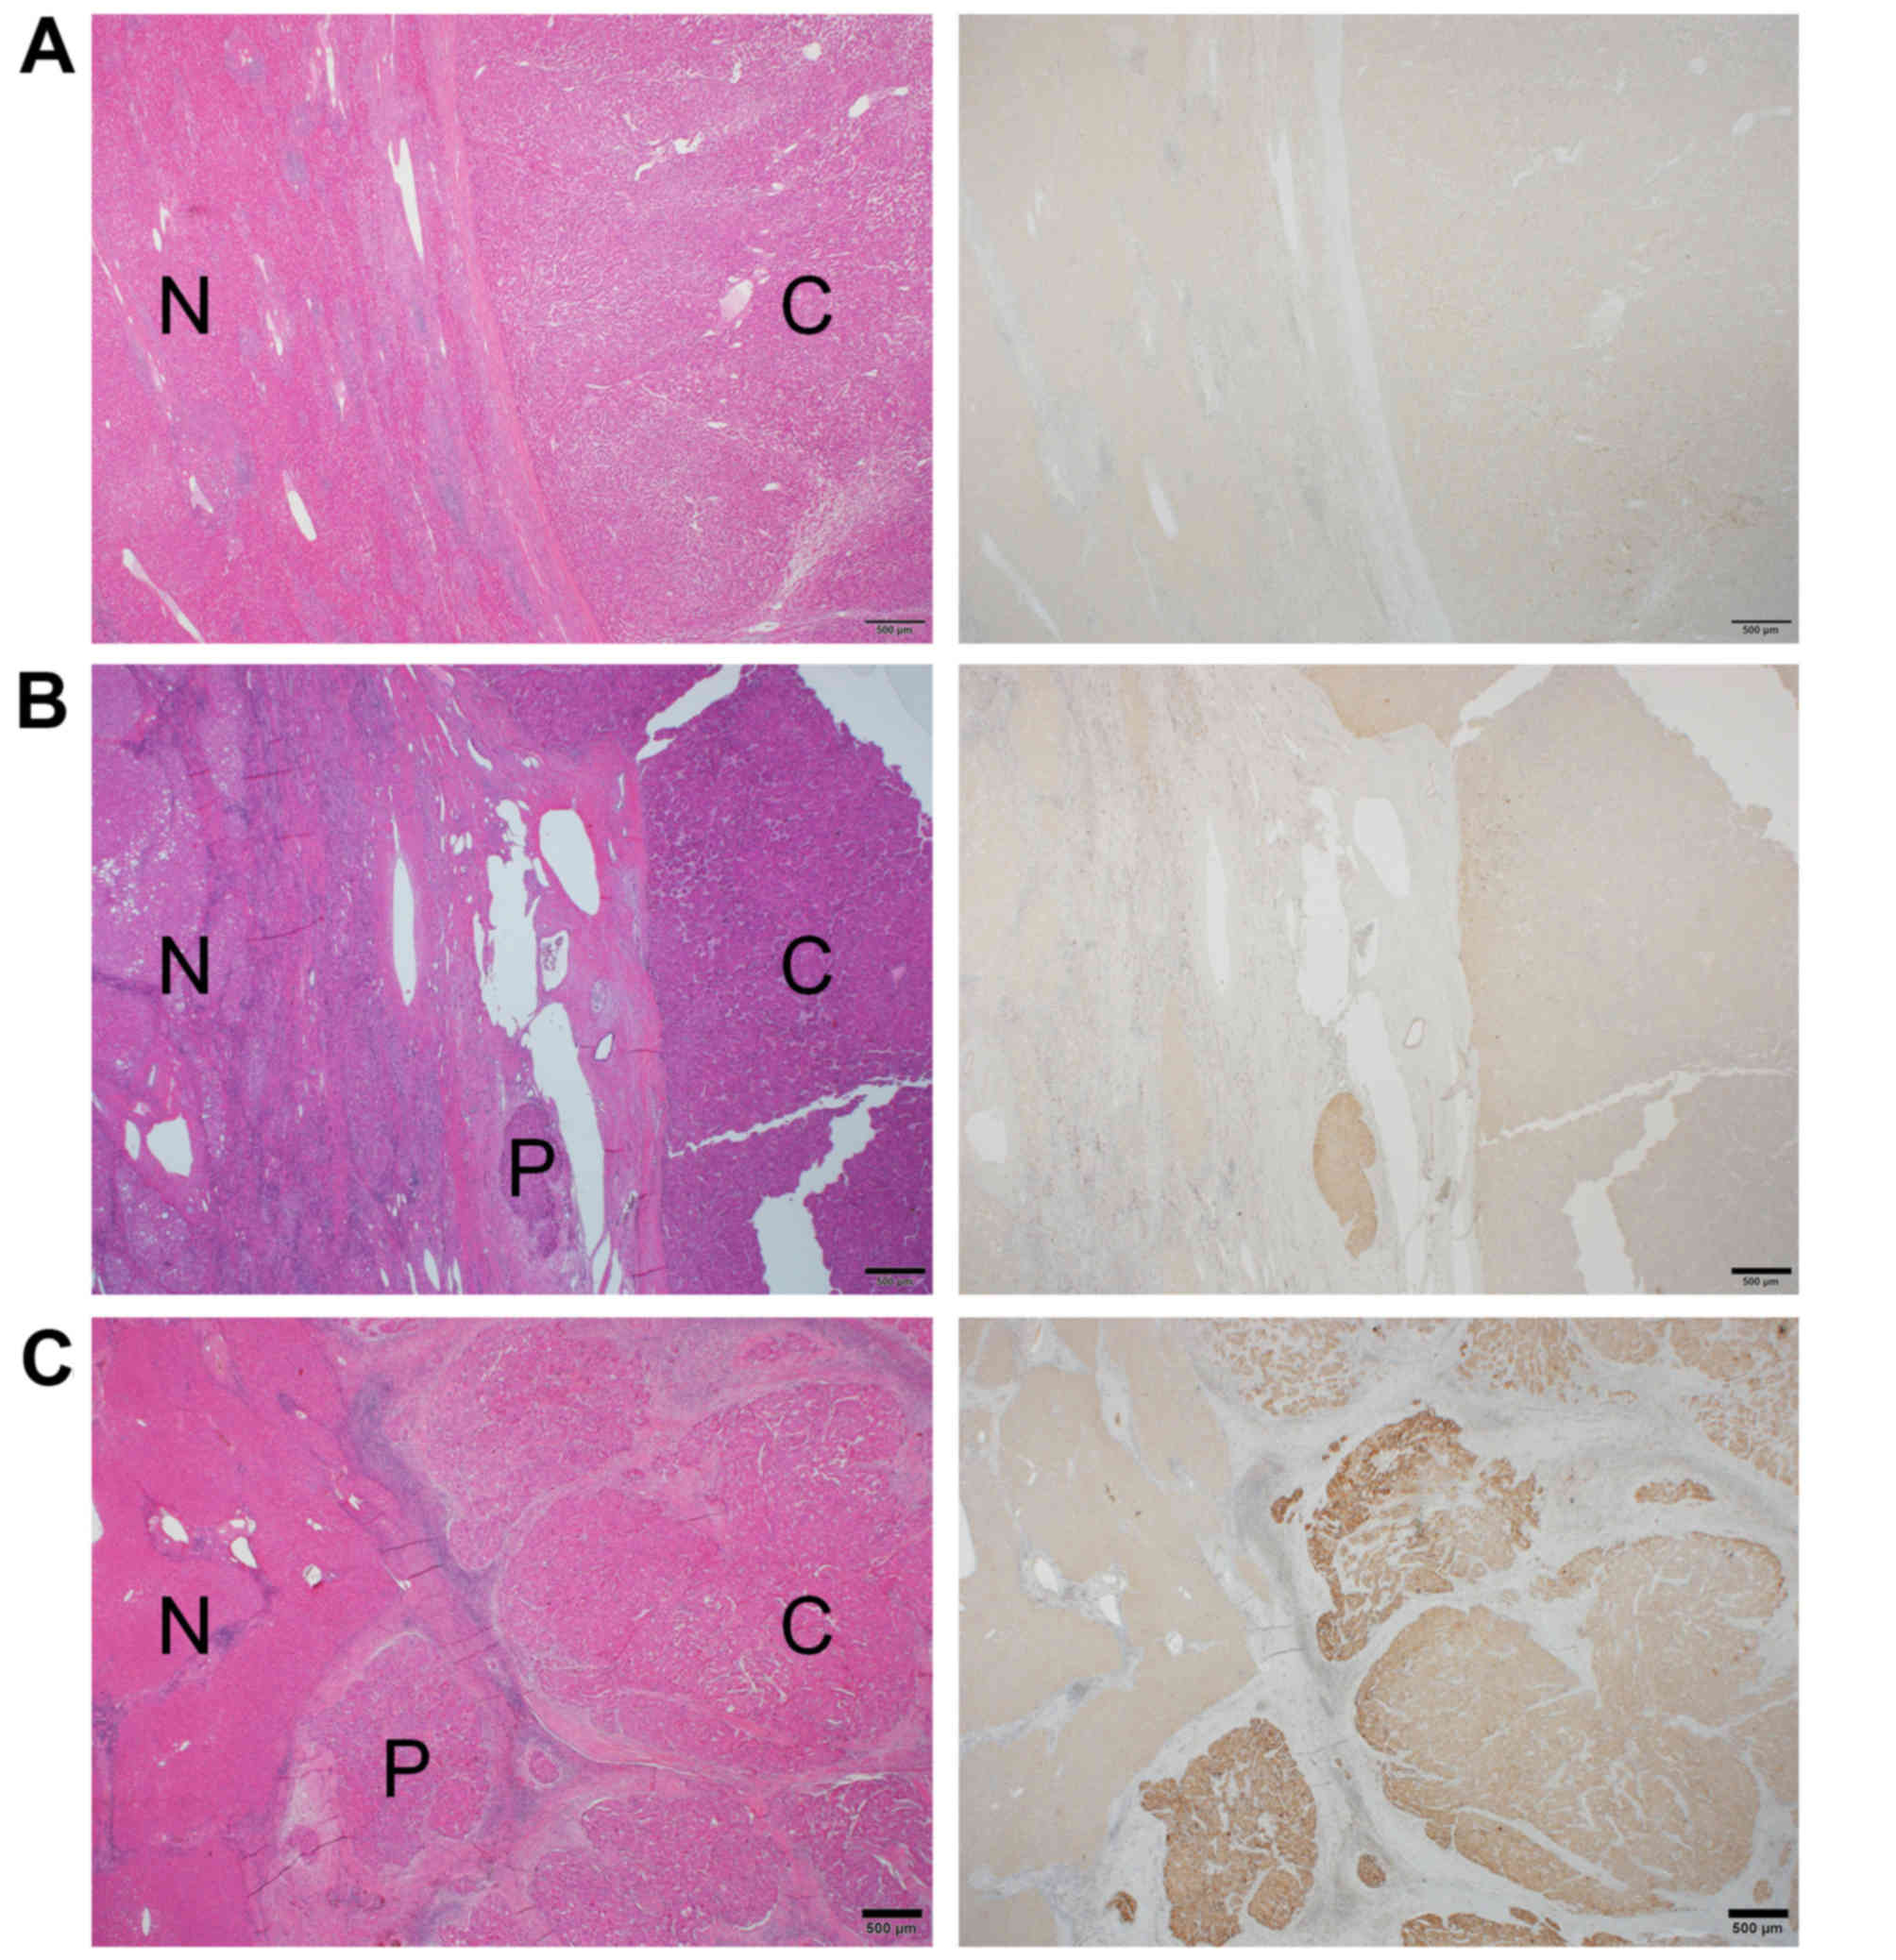
clinicopathological factors. In addition, in 16/24 (66.7%) cases of
HCC with PVI, the staining intensity within the PVI area was equal
to or stronger than that of cancerous tissue (Fig. 4).
| Table III.Logistic regression for portal vein
invasion. |
Table III.
Logistic regression for portal vein
invasion.
| Clinicopathological
feature | Unit | OR | (95% CI) | P-value |
|---|
| Age | 10 | 1.209 | (0.6–2.436) | 0.5949 |
| Sex | Female/Male | 2.703 | (0.379–19.288) | 0.3212 |
| Histological
grade | Mode/Poor | 0.264 | (0.016–4.487) | 0.3569 |
| Gross type | SNEG, CM/SN | 12.059 | (2.664–54.586) | 0.0012 |
| RGS5 | 1 | 2.359 | (0.74–7.517) | 0.1466 |
| AFP | 480 | 1.071 | (0.957–1.197) | 0.2324 |
| DCP | 500 | 0.968 | (0.916–1.024) | 0.2576 |
| Table IV.Logistic regression for intrahepatic
metastasis. |
Table IV.
Logistic regression for intrahepatic
metastasis.
| Clinicopathological
feature | Unit | OR | (95% CI) | P-value |
|---|
| Age | 10 | 1.274 | (0.513–3.168) | 0.6021 |
| Sex | Female/Male | 0.468 | (0.028–7.911) | 0.5984 |
| Histological
grade | Mode/Poor | 1.048 | (0.073–15.127) | 0.9726 |
| Gross type | SNEG, CM/SN | 4.57 | (0.884–23.629) | 0.0698 |
| RGS5 | 1 | 1.517 | (0.439–5.235) | 0.5098 |
| AFP | 480 | 1.052 | (0.952–1.162) | 0.3184 |
| DCP | 500 | 0.991 | (0.945–1.039) | 0.7012 |
| Table V.Logistic regression for gross
type. |
Table V.
Logistic regression for gross
type.
| Clinicopathological
feature | Unit | OR | (95% CI) | P-value |
|---|
| Age | 10 | 1.175 | (0.654–2.111) | 0.5905 |
| Sex | Female/Male | 0.74 | (0.091–6.035) | 0.7786 |
| Histological
grade | Mode/Poor | 0.654 | (0.065–6.585) | 0.7184 |
| RGS5 | 1 | 3.628 | (1.291–10.196) | 0.0145 |
| AFP | 480 | 0.928 | (0.788–1.093) | 0.371 |
| DCP | 500 | 1.036 | (0.968–1.108) | 0.3079 |
Discussion
In the present study, noncancerous, cancerous and
PVI areas were selected using the LMD method, and a comprehensive
analysis of these samples was conducted using cDNA microarray
techniques. Among the extracted molecules, RGS5 was demonstrated to
potentially regulate PVI in HCC.
RGS5 is a member of the RGS protein family and RGS
proteins act as GTPase-activating proteins for heterotorimeric G
protein α subunits, negatively regulating G-protein signaling
(17–19). RGS5 was reported to be expressed in
the heart, lung, skeletal muscle and small intestine (20). It is also reported to be expressed in
pericytes and vascular smooth muscle cells (21). With regard to RGS5 and cancer, RGS5
expression has been demonstrated to be positively correlated with
the degree of tumor differentiation in gastric carcinoma (22).
The results of the present study support those of Hu
et al (23) who also used
RT-qPCR to analyze tissue from 20 patients with HCC and revealed
that RGS5 expression was higher in cancerous tissue compared with
noncancerous tissue, and that RGS5 expression was higher in liver
cancer cell lines than in matched normal tissue. They also reported
that recurrence and venous infiltration were more frequent and that
disease-free survival was lower in 40 cases of HCC that
overexpressed RGS5, as determined by RT-qPCR. The present study
observed no significant difference in RGS5 expression at the mRNA
level (P=0.1844), but immunohistochemical staining revealed that
high RGS5 expression in cancer tissue was significantly correlated
with PVI. There was also a tendency towards increased IM in cases
with high RGS5 expression, although the difference was not
statistically significant. One potential reason RGS5 expression was
not significantly associated with PVI at the mRNA level may be that
the number of cases examined by RT-qPCR was too small, consisting
of only 29 of the 60 cases subjected to immunostaining.
Furthermore, with regard to gross type, cases where immunostaining
revealed high expression of RGS5 were significantly more likely to
be confluent multinodular type HCC. The logistic regression
analyses revealed that RGS5 expression was not an independent
prognostic factor for PVI, whereas the gross type was. RGS5 was
revealed to be associated with the gross type independently of
other clinicopathological factors, indicating that RGS5 is involved
in the determination of the gross type and thus may contribute to
PVI. In HCC, gross classification as confluent multinodular type or
nodular type with extranodular growth has frequently been
associated with PVI (2–4), and these previous reports support the
results of the present study; that RGS5 is associated with PVI.
Furuya et al (24) examined the localization of RGS5 by
using in situ hybridization (ISH) in the kidney, and
observed strong expression of RGS5 in vessels within tumor cell
nests, but not in tumor cells or in endothelial cells of normal
kidney vasculature. Immunohistochemical staining suggested that the
primary location of RGS5 was tumor endothelial cells. Silini et
al (15) reported higher levels
of RGS5 mRNA in endothelial cells isolated from carcinomas,
primarily ovarian carcinomas, compared with endothelial cells
isolated from non-neoplastic tissue. In a study of hepatic tissue,
Chen et al (16) used ISH to
demonstrate that RGS5 was not expressed in sinusoidal endothelial
cells in non-tumor liver tissues, detected RGS5 mRNA in the
sinusoidal endothelial cells in the HCC samples. The present study
used immunohistochemical staining to reveal that RGS5 was expressed
in the cytoplasm of HCC cells. Staining was not clearly observed in
sinusoidal endothelial cells in the noncancerous and cancerous
areas. Wang et al (22)
performed immunohistochemical staining of RGS5 in gastric carcinoma
and revealed that RGS5 was expressed in the cytoplasm of cancer
cells. Huang et al (25) also
reported RGS5 expression in the cytoplasm and the cell membrane of
non-small cell lung cancer cells, using immunostaining.
Furthermore, unpublished data from this laboratory used western
blotting to observe RGS5 expression in an HCC cell line (data not
shown), a result that supported the immunohistochemical staining
results, which revealed RGS5 expression in HCC cells.
Furthermore, in 66.7% of the HCC cases with PVI,
immunohistochemical staining intensity was as strong or stronger in
the PVI tissue as in the cancerous tissue. Hu et al
(23) reported that knockdown of RGS5
suppressed cell migration and invasion, suggesting that cancer
cells with high RGS5 expression have increased invasive activity,
including PVI.
In conclusion, RGS5 expression in cancerous tissues
was significantly upregulated at the mRNA and protein levels
compared with noncancerous tissue, and was significantly associated
with PVI in HCC. RGS5 may therefore be a useful prognostic
biomarker as well as a potential target for molecular therapy for
the treatment of HCC.
Acknowledgements
The authors would like to thank Dr Hiroaki Miyoshi,
Mr. Kazutaka Nakashima, Ms. Akiko Tanaka, Ms. Sachiyo Maeda, Ms.
Yukina Maruyama and Ms. Akemi Fujiyoshi for their technical
assistance.
References
|
1
|
Koike Y, Shiratori Y, Sato S, Obi S,
Teratani T, Imamura M, Yoshida H, Shiina S and Omata M:
Des-gamma-carboxy prothrombin as a useful predisposing factor for
the development of portal venous invasion in patients with
hepatocellular carcinoma: A prospective analysis of 227 patients.
Cancer. 91:561–569. 2001. View Article : Google Scholar : PubMed/NCBI
|
|
2
|
Hui AM, Takayama T, Sano K, Kubota K,
Akahane M, Ohtomo K and Makuuchi M: Predictive value of gross
classification of hepatocellular carcinoma on recurrence and
survival after hepatectomy. J Hepatol. 33:975–979. 2000. View Article : Google Scholar : PubMed/NCBI
|
|
3
|
Murakata A, Tanaka S, Mogushi K, Yasen M,
Noguchi N, Irie T, Kudo A, Nakamura N, Tanaka H and Arii S: Gene
expression signature of the gross morphology in hepatocellular
carcinoma. Ann Surg. 253:94–100. 2011. View Article : Google Scholar : PubMed/NCBI
|
|
4
|
Sumie S, Kuromatsu R, Okuda K, Ando E,
Takata A, Fukushima N, Watanabe Y, Kojiro M and Sata M:
Microvascular invasion in patients with hepatocellular carcinoma
and its predictable clinicopathological factors. Ann Surg Oncol.
15:1375–1382. 2008. View Article : Google Scholar : PubMed/NCBI
|
|
5
|
Ieta K, Ojima E, Tanaka F, Nakamura Y,
Haraguchi N, Mimori K, Inoue H, Kuwano H and Mori M: Identification
of overexpressed genes in hepatocellular carcinoma, with special
reference to ubiquitin-conjugating enzyme E2C gene expression. Int
J Cancer. 121:33–38. 2007. View Article : Google Scholar : PubMed/NCBI
|
|
6
|
Yoshitake K, Tanaka S, Mogushi K, Aihara
A, Murakata A, Matsumura S, Mitsunori Y, Yasen M, Ban D, Noguchi N,
et al: Importin-α1 as a novel prognostic target for hepatocellular
carcinoma. Ann Surg Oncol. 18:2093–2103. 2011. View Article : Google Scholar : PubMed/NCBI
|
|
7
|
Yang H, Xiong FX, Lin M, Yang Y, Nie X and
Zhou RL: LAPTM4B-35 overexpression is a risk factor for tumor
recurrence and poor prognosis in hepatocellular carcinoma. J Cancer
Res Clin Oncol. 136:275–281. 2010. View Article : Google Scholar : PubMed/NCBI
|
|
8
|
Mayinuer A, Yasen M, Mogushi K, Obulhasim
G, Xieraili M, Aihara A, Tanaka S, Mizushima H, Tanaka H and Arii
S: Upregulation of protein tyrosine phosphatase type IVA member 3
(PTP4A3/PRL-3) is associated with tumor differentiation and a poor
prognosis in human hepatocellular carcinoma. Ann Surg Oncol.
20:305–317. 2013. View Article : Google Scholar : PubMed/NCBI
|
|
9
|
Tang Y, Zeng X, He F, Liao Y, Qian N and
Toi M: Caveolin-1 is related to invasion, survival and poor
prognosis in hepatocellular cancer. Med Oncol. 29:977–984. 2012.
View Article : Google Scholar : PubMed/NCBI
|
|
10
|
Bolstad BM, Irizarry RA, Astrand M and
Speed TP: A comparison of normalization methods for high density
oligonucleotide array data based on variance and bias.
Bioinformatics. 19:185–193. 2003. View Article : Google Scholar : PubMed/NCBI
|
|
11
|
Gentleman RC, Carey VJ, Bates DM, Bolstad
B, Dettling M, Dudoit S, Ellis B, Gautier L, Ge Y, Gentry J, et al:
Bioconductor: Open software development for computational biology
and bioinformatics. Genome Biol. 5:R802004. View Article : Google Scholar : PubMed/NCBI
|
|
12
|
Quackenbush J: Microarray data
normalization and transformation. Nat Genet. 32 Suppl:S496–S501.
2002. View
Article : Google Scholar
|
|
13
|
Saeed AI, Sharov V, White J, Li J, Liang
W, Bhagabati N, Braisted J, Klapa M, Currier T, Thiagarajan M, et
al: TM4: A free, open-source system for microarray data management
and analysis. Biotechniques. 34:374–378. 2003.PubMed/NCBI
|
|
14
|
Livak KJ and Schmittgen TD: Analysis of
relative gene expression data using real-time quantitative PCR and
the 2(-Delta Delta C(T)) method. Methods. 25:402–408. 2001.
View Article : Google Scholar : PubMed/NCBI
|
|
15
|
Silini A, Ghilardi C, Figini S, Sangalli
F, Fruscio R, Dahse R, Pedley RB, Giavazzi R and Bani M: Regulator
of G-protein signaling 5 (RGS5) protein: A novel marker of cancer
vasculature elicited and sustained by the tumor's proangiogenic
microenvironment. Cell Mol Life Sci. 69:1167–1178. 2012. View Article : Google Scholar : PubMed/NCBI
|
|
16
|
Chen X, Higgins J, Cheung ST, Li R, Mason
V, Montgomery K, Fan ST, van de Rijn M and So S: Novel endothelial
cell markers in hepatocellular carcinoma. Mod Pathol. 17:1198–1210.
2004. View Article : Google Scholar : PubMed/NCBI
|
|
17
|
Hepler JR: Emerging roles for RGS proteins
in cell signalling. Trends Pharmacol Sci. 20:376–382. 1999.
View Article : Google Scholar : PubMed/NCBI
|
|
18
|
Siderovski DP, Strockbine B and Behe CI:
Whither goest the RGS proteins? Crit Rev Biochem Mol Biol.
34:215–251. 1999. View Article : Google Scholar : PubMed/NCBI
|
|
19
|
Zheng B, De Vries L and Gist Farquhar M:
Divergence of RGS proteins: Evidence for the existence of six
mammalian RGS subfamilies. Trends Biochem Sci. 24:411–414. 1999.
View Article : Google Scholar : PubMed/NCBI
|
|
20
|
Seki N, Sugano S, Suzuki Y, Nakagawara A,
Ohira M, Muramatsu M, Saito T and Hori T: Isolation, tissue
expression, and chromosomal assignment of human RGS5, a novel
G-protein signaling regulator gene. J Hum Genet. 43:202–205. 1998.
View Article : Google Scholar : PubMed/NCBI
|
|
21
|
Bondjers C, Kalen M, Hellstrom M, Scheidl
SJ, Abramsson A, Renner O, Lindahl P, Cho H, Kehrl J and Betsholtz
C: Transcription profiling of platelet-derived growth
factor-B-deficient mouse embryos identifies RGS5 as a novel marker
for pericytes and vascular smooth muscle cells. Am J Pathol.
162:721–729. 2003. View Article : Google Scholar : PubMed/NCBI
|
|
22
|
Wang JH, Huang WS, Hu CR, Guan XX, Zhou HB
and Chen LB: Relationship between RGS5 expression and
differentiation and angiogenesis of gastric carcinoma. World J
Gastroenterol. 16:5642–5646. 2010. View Article : Google Scholar : PubMed/NCBI
|
|
23
|
Hu M, Chen X, Zhang J, Wang D, Fang X,
Wang X, Wang G, Chen G, Jiang X, Xia H, et al: Over-expression of
regulator of G protein signaling 5 promotes tumor metastasis by
inducing epithelial-mesenchymal transition in hepatocellular
carcinoma cells. J Surg Oncol. 108:192–196. 2013. View Article : Google Scholar : PubMed/NCBI
|
|
24
|
Furuya M, Nishiyama M, Kimura S, Suyama T,
Naya Y, Ito H, Nikaido T and Ishikura H: Expression of regulator of
G protein signalling protein 5 (RGS5) in the tumour vasculature of
human renal cell carcinoma. J Pathol. 203:551–558. 2004. View Article : Google Scholar : PubMed/NCBI
|
|
25
|
Huang G, Song H, Wang R, Han X and Chen L:
The relationship between RGS5 expression and cancer differentiation
and metastasis in non-small cell lung cancer. J Surg Oncol.
105:420–424. 2012. View Article : Google Scholar : PubMed/NCBI
|