Introduction
Incidental prostate cancer (IPCa) is diagnosed
incidentally from the histopathological examination of specimens
obtained at the time of transurethral resection of the prostate
(TURP) or adenomectomy intended to treat benign prostatic
hyperplasia (BPH). Although the majority of cases of IPCa are
clinically insignificant, the biological behavior of IPCa may
change, and the speed of progression of individuals remains
unpredictable (1). Therefore, the
accurate preoperative identification of IPCa is of great
importance, as these patients would benefit the most from an
appropriate treatment for IPCa.
Recently, multi-parametric magnetic resonance
imaging (MRI) techniques, including T2-weighted imaging (T2WI),
magnetic resonance spectroscopy (MRS) and diffusion-weighted MRI
(DWI), are useful tools for the diagnosis of prostatic diseases,
including the central gland (CG) and peripheral zone (PZ) of the
prostate. The results of prior studies (2–12) indicate
that the apparent diffusion coefficient (ADC) value of malignant
regions was lower than that of the benign regions, and the [choline
(Cho) + creatine (Cre)]/citrate (Cit) (CC/C) value of the former
was higher than the latter.
There are a number of studies concerning the
morphological and functional parameters of MRI on the CG and PZ of
clinical prostate cancer (4–12); however, to the best of our knowledge,
no public literature concerning MRS and DWI in IPCa in the CG of
the prostate. The present study aimed to investigate the
differences in conventional MRI manifestation, CC/C value, and ADC
value between IPCa and BPH, and whether there are benefits to using
these techniques to differentiate between the two diseases.
Materials and methods
Patients
Informed consent was waived by the Nantong Medical
Institutional Review Board for this retrospective study. All
patients who underwent MRI of the prostate (T1WI, T2WI, MRS and
DWI) between July 2006 and March 2013 in the radiological database
of the Third People's Hospital of Nantong were retrospectively
reviewed. In total, 164 patients who had been diagnosed as BPH on
MRI then underwent TURP were collected.
A total of 9 patients were postoperatively diagnosed
with IPCa, (mean age, 73.56±5.18 years; range, 66–84 years). Mean
total-prostate specific antigen (T-PSA), 10.87±4.80 ng/ml; range,
5.19–20.97 ng/ml. Gleason scores (13) varied from 2 to 7, including lower
scores (2 or 3 or 4) in 3 cases (33%) and higher certainty scores
(5 or 6 or 7) in 6 of the 9 patients (67%) with IPCa. Among these 9
patients with MRI imaging, 7 exhibited MRS and 8 exhibited DWI.
A total of 155 patients were definitively diagnosed
with BPH following surgery, of whom 118 underwent MRS or DWI before
operations (mean age, 69.38±6.43 years; range, 55–87 years). Mean
T-PSA 14.39±11.51 ng/ml, range 0.75–92.50 ng/ml. Preoperative MRS
was performed in 99 patients, including 7 cases of glandular
hyperplasia (GH), 30 cases of stromal hyperplasia (SH), 62 cases of
mixed hyperplasia (MH). In total, 85 patients underwent
preoperative DWI, which revealed that there were 7 cases of GH, 18
cases of SH and 63 cases of MH.
MRI
All MRIs were performed using GE 1.5 SignaTwinSpeed
magnetic resonance scanner (GE Healthcare, Chicago, IL, USA).
Conventional MR scan
The patients were examined using a body coil for
excitation and an abdominal phased array coil for reception. A fast
spin-echo (FSE) T2WI was applied with the following parameters:
Repetition time/echo time (TR/TE), 3,500/85 msec; echo train length
(ETL), 19; slice thickness/gap 5/0.5 mm; field of view (FOV), 24×24
cm; number of excitations (NEX), 4; matrix, 320×256. The parameters
of T1WI were as follows: TR/TE, 450/12 ms; slice thickness/gap,
5/0.5 mm, FOV 24×24 cm; NEX, 2; matrix, 256×192.
3D 1H-MRS scan
Before April 2008, patients were scanned using FSE
T2WI with an endorectalcoil (TR/TE, 3,500/85 msec; ETL, 19; slice
thickness/gap, 3/0 mm; FOV, 13×13 cm; NEX, 4; matrix, 320×256).
There sulting images were used as a scanogram of 3D
1H-MRS examination and images were integrated with
metabolic and anatomical information. A 3D 1H-MRS
examination was performed using the prostate spectroscopy and
imaging examination (PROSE) sequence (TR/TE, 1,000/130 msec; FOV,
11×11 cm; NEX, 1; matrix, 16×8; scanning time, 17–19 min). The
axial images were used to guide the positioning of the
spectroscopic volume of interest. This volume was selected to
maximize coverage of prostate while minimizing the inclusion of
periprostatic fat and rectal air. In the axial plane, the saturated
zone was added on to the edge of the region of interest to
eliminate the effects of fat tissues around the rectanglular region
of interest and endorectal gas at the rear of prostate. The
conventional automatic pre-scan was performed prior to collection
of MRS data, including automatic shimming and water suppression;
full width half maximum was usually <15 Hz for collecting MRS
data. After April 2008, patients were scanned using FSE T2WI with a
body coil line. 3D 1H-MRS examination was performed
using PROSE sequence (TR/TE, 1,000/130 msec; FOV, 11×11 cm; NEX,
10; matrix, 12×8; total scan time, 16 min 4 sec).
DWI scan
A single-shot EPI sequence was used, with b values
of 0 and 800 sec/mm2. Before February 2006, the body
coil was used as the receiver coil (TR/TE 3,000/6.6 msec; slice
thickness/gap, 6/0 mm; FOV, 26×26 cm; NEX, 2; matrix, 96×96; scan
time, 24 sec). After February 2006, the abdominal phased array coil
was used as the receiving coil (TR/TE, 3,500/56.4 msec; slice
thickness/gap, 6/0 mm; FOV, 26×26 cm; NEX, 4; matrix, 128×128; scan
time, 56 sec).
Imaging analysis
MRS
The criteria of usable MRS voxels was as follows: i)
At least 75% of the voxel was located in the central gland, and had
not been polluted by the signals from unsuppressed water and fat;
ii) the urethra and periurethral glands were not included; and iii)
the signal-to-noise ratio of three main metabolites, Cho, Cre and
Cit, in each spectrum was >3.
DWI
ADC values in each slice of the central gland of
each patient (the ADC values of the central gland) and minimal ADC
value in the central glands (the minimal ADC values) were measured.
The region of interest (ROI) placement guidelines for the central
gland ADC values were as follows: The largest ROI of central gland
in all scanning planes was hand-painted, the ROI edges were as far
as possible consistent with the edges of the central gland. The ROI
placement guidelines for the minimal ADC value were as follows: i)
The ROI was placed in the central gland where the ADC value was
lowest (referring to the ADC map); ii) the junction area of the
peripheral zone, the central zone, the urethra, blood vessels,
hemorrhage or calcification were avoided; and iii) ROI was oval
with an area of 30–50 mm2.
Statistical analysis
All data were statistically analyzed using SPSS16.0
software (SPSS, Inc., Chicago, IL, USA). All data were expressed as
mean ± standard deviation. The group data were firstly tested to
assess whether they were distributed normally. The
independent-samples t-test was used to compare data between two
groups. Levene's test was first used to compare between data among
three groups, with the data that met the homogeneity of variance
were compared using the χ2 test of variance, the data
which did not meet the homogeneity of variance were compared using
the Kruskal-Wallis H-test. P<0.05 was considered to indicate a
statistically significant difference.
Results
Manifestation of IPCa on conventional
MRI and DWI Conventional MRI findings
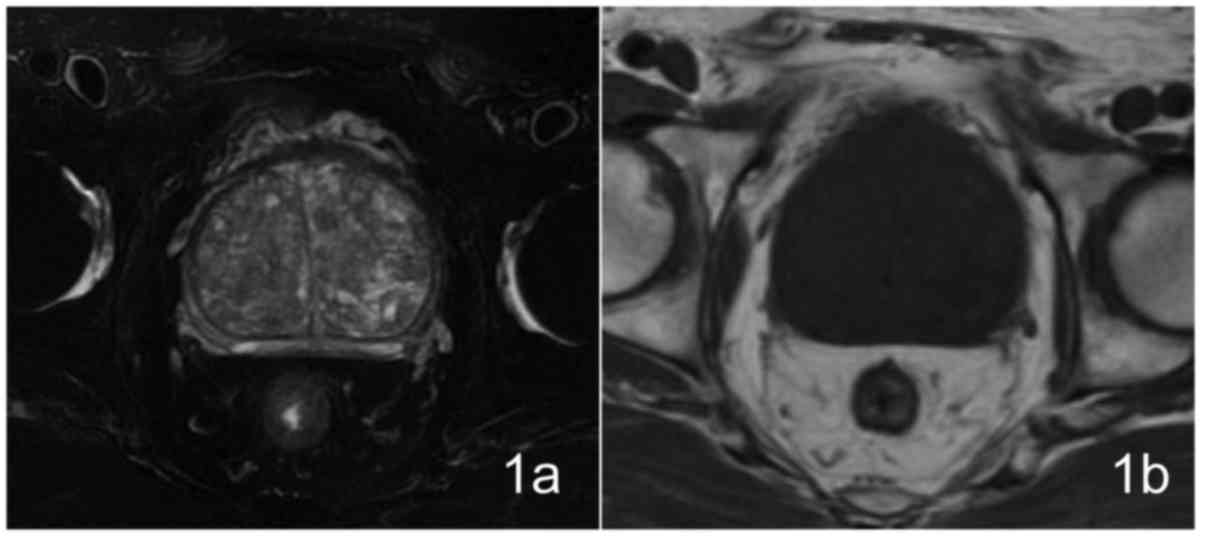
A total of 9 patients exhibited prostate enlargement
to varying degrees, observed by T2WI, which was more evident in the
central gland with mixed signal intensity, different numbers of
hyperplastic nodules with hyperintensity or hypointensity were
visible, the peripheral zone was compressed and thinned; 4 patients
exhibited homogeneous hypointensity on T1WI imaging, 5 patients
exhibited punctate hyperintensity within the hypointensity area,
which were considered to be due to bleeding (Fig. 1). The pelvis and vertebral body
exhibited no abnormal signal within the scan range and no lymph
node enlargement was observed in the pelvic or groin areas.
Patients were all diagnosed as BPH preoperatively by MRI. IPCa did
not exhibit areas of clear high signal intensity on DWI.
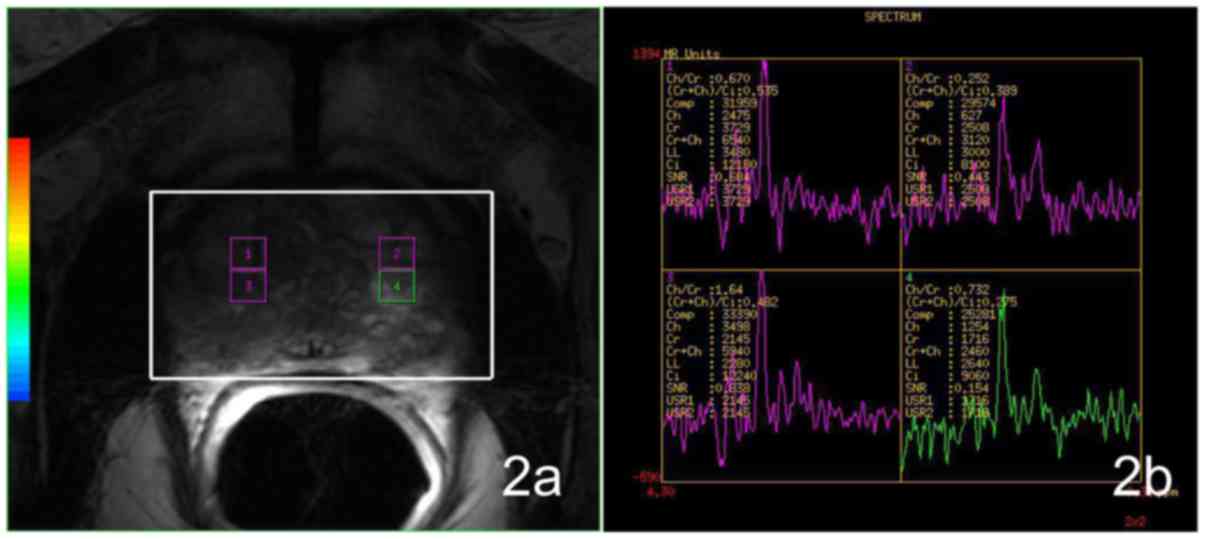
Analysis of 3DMRS and DWI Data
Results of 3DMRS and DWI are depicted in Table I.
 | Table I.CC/C, ADC values of the central gland
and the minimal ADC values of IPCa and BPH (including GH, SH and
MH). |
Table I.
CC/C, ADC values of the central gland
and the minimal ADC values of IPCa and BPH (including GH, SH and
MH).
| Group | n | CC/C value | n | Central gland ADC
value | Minimal ADC
value |
|---|
| IPCa | 7 | 1.04±0.28 | 8 | 1.48±0.18 | 1.15±0.10 |
| BPH | 99 | 1.09±0.58 | 88 | 1.49±0.14 | 1.14±0.11 |
| GH | 7 | 0.99±0.05 | 7 | 1.60±0.16 | 1.21±0.12 |
| SH | 30 | 1.31±0.94 | 18 | 1.37±0.10 | 1.15±0.06 |
| MH | 62 | 0.99±0.31 | 63 | 1.48±0.12 | 1.12±0.10 |
CC/C values
There was no significant difference (t=−0.205,
P=0.838) between CC/C values of the IPCa and BPH groups. No
significant difference (χ2=2.595, P=0.458) could be
detected among the IPCa, GH, SH and MH groups (Fig. 2).
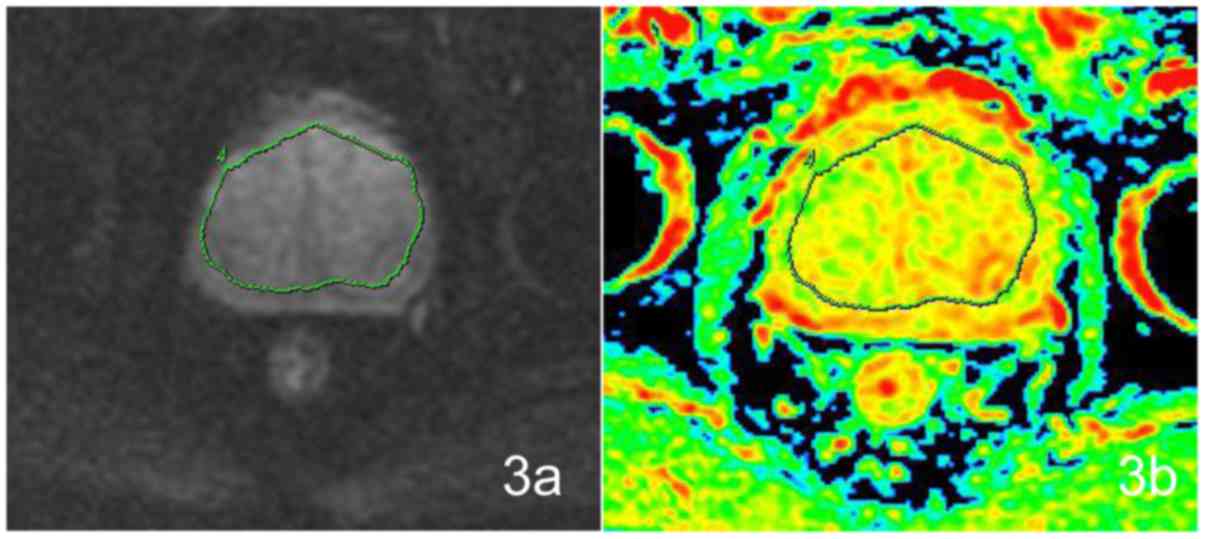
ADC values of the central glands
There was no significant difference (t=−0.224,
P=0.823) between the two groups of IPCa and BPH. There was a
statistically significant (F=6.181, P=0.001) difference
between the IPCa, GH, SH and MH groups. Of the four groups, the
difference was statistically significant between the IPCa and the
GH (P=0.037), in comparison of the IPCa and SH (P=0.127), IPCa and
MH (P=0.908), no significant differences could be detected
(Fig. 3).
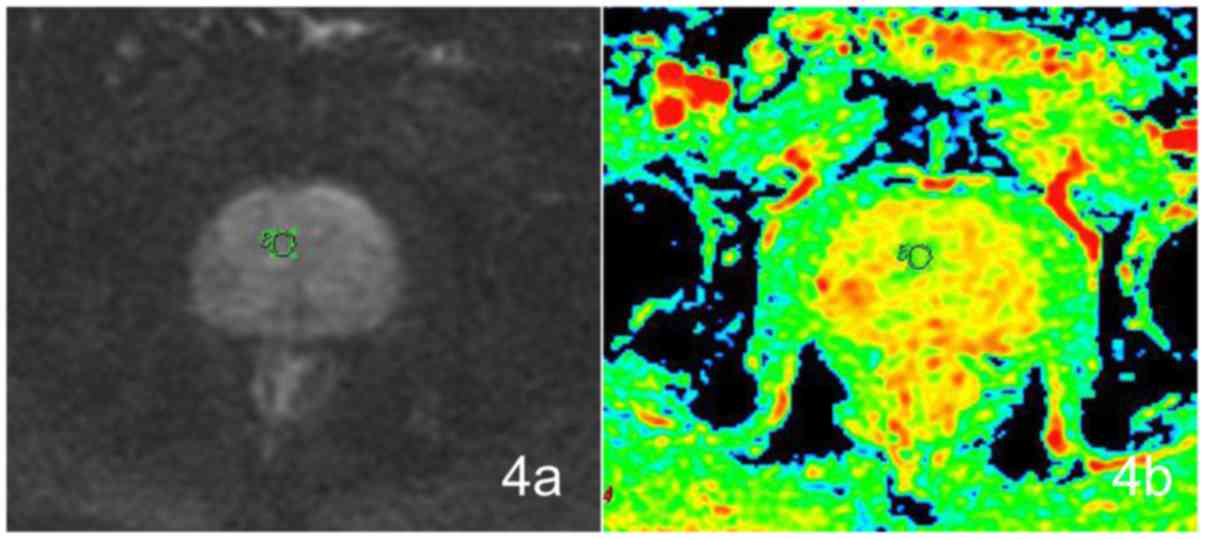
Minimal ADC values
No statistically significant difference existed
between the IPCa and BPH groups (t=0.139, P=0.890). The difference
in the minimal ADC values among the four groups was statistically
significant (F=2.897, P=0.039). No significant differences could be
detected between IPCa and GH (P=0.930), IPCa and SH (P=0.192), and
IPCa and MH (P=0.544) (Fig. 4).
Discussion
As the non-invasive functional MRI, MRS and DWI
techniques are not influenced by the experience of the operator and
are conducive to improving the diagnostic efficacy (14–18), and
serve an important role in the detection, localization, and staging
of prostate cancer (9).
IPCa refers to that patients have been clinically
diagnosed with BPH, with no evidence of prostate cancer upon
digital rectal examination or various imaging examinations. After
undergoing open prostatectomy or TURP, the prostate cancer tissues
were found in the inspection samples. There was a remarkable
difference in morbidity between domestic and abroad reports
(19–22). In this study, out of 164 patients who
were diagnosed as BPH by MR examination after TURP, 155 patients
were confirmed as BPH, 9 patients were confirmed as IPCa,
accounting for 5.49%. The group of 9 patients with IPCa had the
following characteristics: i) PSA levels were increased slightly
compared with those with BPH; and ii) tumors had low Gleason scores
and they were mostly well-or moderately differentiated
carcinomas.
Cancer in the CG of the prostate exhibits the
following features: Homogeneous low signal intensity on T2WI, lack
of capsule, ill-defined margins, increased CC/C value, high signal
intensity on DWI and decreased ADC value (2,3,8,12,23). In the present study, the T1WI and T2WI
findings for the 9 patients with IPCa were similar to those with
BPH, and did not exhibit any apparently cancerous areas. As such,
they were all preoperatively diagnosed as BPH by MRI.
The CC/C value of IPCa and BPH was not significantly
different in the present study. Furthermore, no significant
difference in either the ADC value of the central gland or the
minimal ADC value were identified. According to the pathological
findings, the BPH group was divided into 3 subgroups: GH, SH and
MH. Compared with IPCa, the differences in CC/C values were not
statistically significant, and the IPCa CC/C value was lower than
that of SH, and slightly higher than those of GH and MH; the CC/C
value of IPCa was between those of BPH groups. There was only
statistically significant difference in ADC value, which was
between IPCa and GH; there were no statistically significant
differences in minimal ADC value between IPCa and various BPH
groups. It was therefore clear that the CC/C value and the ADC
value of IPCa were close to those of BPH groups, which indicated at
the difficulties of preoperative MRI diagnosis.
Previous studies reported that the CC/C and ADC
values of benign prostate disease were significantly different from
those of prostate cancer (3,24–27). As
only the proportion of glandular and stromal tissue was changed in
BPH, which would not have a significant impact on the secretory
function of the gland, These pathological features were different
from clinically detected prostate cancer. In addition, Montironi
et al reported that the staging, positive surgical margin
rate, Gleason score and invasiveness of IPCa were lower than those
of the clinically detected prostate cancer (28,29), which
indicated that IPCa is less aggressive compared with clinically
detected cancer.
According to a previous study (3), GH exhibited hyperintensity on T2WI, with
pathology revealing that it contained a large number of dilated
glandular ducts and retention cysts and fewer stromal components.
SH exhibited hypointensity, with pathology revealing that the
hyperplastic nodules contained more collagen and stromal cells
(including fibroblasts and smooth muscle cells) and fewer glandular
components (3). The ADC value of the
prostate gland tissue was higher than that of the prostate stromal
tissue (30). Notably, the
pathological findings of the present study revealed the presence of
7 cases of GH, 18 cases of SH and 63 cases of MH, all displayed
asymmetrical enlargement of central glands with heterogeneous
nodules on T2WI. On the ADC images, 4 cases (4/7) of GH had
hyperintensity, 12 cases (12/18) of SH exhibited considerable
hypointensity, measured using two methods of the central gland ADC
values and the minimal ADC value. SH is formed of a greater
cellular component, is more dense and containsless extracellular
fluid than GH; these differences could explain the smaller ADCs in
SH, in accordance with the findings of a previous study (3).
In addition, a prior report indicated that metabolic
performance of SH could be similar to that of atypical prostate
cancer (31); the results of a
present study were similar. The CC/C value of the SH group was the
highest of the four groups assessed in the current study. In the
preoperative MRI diagnosis, the CC/C values for certain SH cases
were significantly increased, reaching a maximal value of 8,
providing evidence of the metabolic characteristics of typical
prostate cancer, and leading to 5 cases being misdiagnosed as
cancer. This misdiagnosis may be due to the fact that SH tissues
have less glandular and ductal components, and low Citlevels,
meaning that the CC/C value was increased.
There are limitations to the present study. First,
because it is a retrospective study, there may be selection bias in
the patient cohort. Second, the IPCa sample size was relatively
small. Since the exact location of the occurrence of the incidental
carcinoma could not be obtained by pathological examination
following TURP, the CC/C values of all available voxels in the
central gland were measured in the present study. Owing to the
impact of the partial volume effect in sample slices, the measured
CC/C values may have been be slightly lower than those of the areas
of cancer, although they could also reflect metabolic changes to
IPCa. In addition, two methods were used to measure ADC values in
the present study: The ADC value of the central gland and the
minimal ADC value of the central gland. The two methods had
advantages and disadvantages. Measuring the ADC value of the
central gland, the ROI was drawn as large as possible, in
accordance with the size of the central gland. The measured value
was the ADC value of the central gland at this slice, including the
cancerous and non-cancerous areas, and even calcification and
bleeding within the ROI. Owing to the impact of the partial volume
effect, measurement of the ADC value of the central gland could not
reflect the real ADC value of the cancerous area, although use of
this method was suitable when the lesion location could not be
defined. The second method was to measure the minimal ADC value of
the central gland, which avoided the partial volume effect
(5,9–11,17,18). The
minimal ADC value of the cancerous tissue was lower than that of
the normal tissue or benign lesion, which may reflect a more
realistic ADC value.
Taken together, the results of the present study
demonstrate that the performance characteristics of IPCa are
similar to those of BPH on 3D MRS and DWI, meaning that IPCa cannot
be distinguished preoperatively from BPH using current MRI
examination techniques. Further and larger studies are required,
however, to confirm these findings.
Acknowledgements
Not applicable.
Funding
The present study was supported by the funding from
China Postdoctoral Science Foundation (grant no. 2016M592595).
Availability of data and materials
The datasets used and/or analyzed during the current
study are available from the corresponding author on reasonable
request.
Authors' contribution
JL and QZ guaranteed the integrity of the study.
XQZ, XRY and JL were involved in study conceptrion and design. ZLD
and XFM conducted the clinical studies and data analysis. XQZ and
XRY were involved in manuscript preparation. QZ performed
statistical analysis and edited the manuscript.
Ethics approval and consent to
participate
Informed consent was waived by the Nantong Medical
Institutional Review Board for this retrospective study.
Consent for publication
Not applicable.
Competing interests
The authors declare that they have no competing
interests.
References
|
1
|
Mazzucchelli R, Barbisan F, Scarpelli M,
Lopez-Beltran A, van der Kwast TH, Cheng L and Montironi R: Is
incidentally detected prostate cancer in patients undergoing
radical cystoprostatectomy clinically significant? Am J Clin
Pathol. 131:279–283. 2009. View Article : Google Scholar : PubMed/NCBI
|
|
2
|
Chesnais AL, Niaf E, Bratan F,
Mège-Lechevallier F, Roche S, Rabilloud M, Colombel M and Rouvière
O: Differentiation of transitional zone prostate cancer from benign
hyperplasia nodules: Evaluation of discriminant criteria at
multiparametric MRI. Clin Radiol. 68:e323–e330. 2013. View Article : Google Scholar : PubMed/NCBI
|
|
3
|
Oto A, Kayhan A, Jiang Y, Tretiakova M,
Yang C, Antic T, Dahi F, Shalhav AL, Karczmar G and Stadler WM:
Prostate cancer: Differentiation of central gland cancer from
benign prostatic hyperplasia by using diffusion-weighted and
dynamic contrast-enhanced MR imaging. Radiology. 257:715–723. 2010.
View Article : Google Scholar : PubMed/NCBI
|
|
4
|
Hoeks CM, Hambrock T, Yakar D,
Hulsbergen-van de Kaa CA, Feuth T, Witjes JA, Fütterer JJ and
Barentsz JO: Transition zone prostate cancer: Detection and
localization with 3-T multiparametric MR imaging. Radiology.
266:207–217. 2013. View Article : Google Scholar : PubMed/NCBI
|
|
5
|
Mazaheri Y, Shukla-Dave A, Hricak H, Fine
SW, Zhang J, Inurrigarro G, Moskowitz CS, Ishill NM, Reuter VE,
Touijer K, et al: Prostate cancer: Identification with combined
diffusion-weighted MR imaging and 3D 1H MR spectroscopic
imaging-correlation with pathologic findings. Radiology.
246:480–488. 2008. View Article : Google Scholar : PubMed/NCBI
|
|
6
|
Hoeks CM, Barentsz JO, Hambrock T, Yakar
D, Somford DM, Heijmink SW, Scheenen TW, Vos PC, Huisman H, van
Oort IM, et al: Prostate cancer: Multiparametric MR imaging for
detection, localization and staging. Radiology. 261:46–66. 2011.
View Article : Google Scholar : PubMed/NCBI
|
|
7
|
Bratan F, Niaf E, Melodelima C, Chesnais
AL, Souchon R, Mège-Lechevallier F, Colombel M and Rouvière O:
Influence of imaging and histological factors on prostate cancer
detection and localisation on multiparametric MRI: A prospective
study. Eur Radiol. 23:2019–2029. 2013. View Article : Google Scholar : PubMed/NCBI
|
|
8
|
Yoshizako T, Wada A, Hayashi T, Uchida K,
Sumura M, Uchida N, Kitagaki H and Igawa M: Usefulness of
diffusion-weighted imaging and dynamic contrast-enhanced magnetic
resonance imaging in the diagnosis of prostate transition-zone
cancer. Acta Radiol. 49:1207–1213. 2008. View Article : Google Scholar : PubMed/NCBI
|
|
9
|
Li B, Cai W, Lv D, Guo X, Zhang J, Wang X
and Fang J: Comparison of MRS and DWI in the diagnosis of prostate
cancer based on sextant analysis. J Magn Reson Imaging. 37:194–200.
2013. View Article : Google Scholar : PubMed/NCBI
|
|
10
|
Ren J, Huan Y, Wang H, Zhao H, Ge Y, Chang
Y and Liu Y: Diffusion-weighted imaging in normal prostate and
differential diagnosis of prostate diseases. Abdom Imaging.
33:724–728. 2008. View Article : Google Scholar : PubMed/NCBI
|
|
11
|
Manenti G, Squillaci E, Di Roma M, Carlani
M, Mancino S and Simonetti G: In vivo measurement of the apparent
diffusion coefficient in normal and malignant prostatic tissue
using thin-slice echo-planar imaging. Radiol Med. 111:1124–1133.
2006.(In English, Italian). View Article : Google Scholar : PubMed/NCBI
|
|
12
|
Kim JH, Kim JK, Park BW, Kim N and Cho KS:
Apparent diffusion coefficient: Prostatecancer versus noncancerous
tissue according to anatomical region. J Magn Reson Imaging.
28:1173–1179. 2008. View Article : Google Scholar : PubMed/NCBI
|
|
13
|
Mian BM, Lehr DJ, Moore CK, Fisher HA,
Kaufman RP Jr, Ross JS, Jennings TA and Nazeer T: Role of prostate
biopsy schemes in accurate prediction of Gleason scores. Urology.
67:379–383. 2006. View Article : Google Scholar : PubMed/NCBI
|
|
14
|
Zakian KL, Eberhardt S, Hricak H,
Shukla-Dave A, Kleinman S, Muruganandham M, Sircar K, Kattan MW,
Reuter VE, Scardino PT and Koutcher JA: Transition zone prostate
cancer: Metabolic characteristics at 1H MR spectroscopic
imaging-initial results. Radiology. 229:241–247. 2003. View Article : Google Scholar : PubMed/NCBI
|
|
15
|
Mueller-Lisse UG and Scherr MK: Proton MR
spectroscopy of the prostate. Eur J Radiol. 63:351–360. 2007.
View Article : Google Scholar : PubMed/NCBI
|
|
16
|
Wu LM, Xu JR, Gu HY, Hua J, Chen J, Zhang
W, Zhu J, Ye YQ and Hu J: Usefulness of diffusion-weighted magnetic
resonance imaging in the diagnosis of prostate cancer. Acad Radiol.
19:1215–1224. 2012. View Article : Google Scholar : PubMed/NCBI
|
|
17
|
Issa B: In vivo measurement of the
apparent diffusion coefficient in normal and malignant prostatic
tissues using echo-planar imaging. J Magn Reson Imaging.
16:196–200. 2002. View Article : Google Scholar : PubMed/NCBI
|
|
18
|
Gibbs P, Pickles MD and Turnbull LW:
Diffusion imaging of the prostate at 3.0 tesla. Invest Radiol.
41:185–188. 2006. View Article : Google Scholar : PubMed/NCBI
|
|
19
|
Merrill RM and Wiggins CL: Incidental
detection of population-based prostate cancer incidence rates
through transurethral resection of the prostate. Urol Oncol.
7:213–219. 2002. View Article : Google Scholar : PubMed/NCBI
|
|
20
|
Yang XY, Xia TL, He Q, Li W, Wang JH, Su
JW, Li J and Na YQ: Incidence and pathological features of
incidental prostate cancer and clinical significance thereof.
Zhonghua Yi Xue Za Zhi. 87:2632–2634. 2007.(In Chinese). PubMed/NCBI
|
|
21
|
Melchior S, Hadaschik B, Thüroff S, Thomas
C, Gillitzer R and Thüroff J: Outcome of radical prostatectomy for
incidental carcinoma of the prostate. BJU Int. 103:1478–1481. 2009.
View Article : Google Scholar : PubMed/NCBI
|
|
22
|
Joung JY, Yang SO, Seo HK, Kim TS, Han KS,
Chung J, Park WS, Jeong IG and Lee KH: Incidental prostate cancer
detected by cystoprostatectomy in Korean men. Urology. 73:153–157.
2009. View Article : Google Scholar : PubMed/NCBI
|
|
23
|
Akin O, Sala E, Moskowitz CS, Kuroiwa K,
Ishill NM, Pucar D, Scardino PT and Hricak H: Transition zone
prostate cancers: Features, detection, localization, and staging at
endorectalMR imaging. Radiology. 239:784–792. 2006. View Article : Google Scholar : PubMed/NCBI
|
|
24
|
Wang XZ, Wang B, Gao ZQ, Liu JG, Liu ZQ,
Niu QL, Sun ZK and Yuan YX: 1H-MRSI of prostate cancer: The
relationship between metabolite ratio and tumor proliferation. Eur
J Radiol. 73:345–351. 2010. View Article : Google Scholar : PubMed/NCBI
|
|
25
|
Sato C, Naganawa S, Nakamura T, Kumada H,
Miura S, Takizawa O and Ishigaki T: Differentiation of noncancerous
tissue and cancer lesions by apparent diffusion coefficient values
in transition and peripheral zones of the prostate. J Magn Reson
Imaging. 21:258–262. 2005. View Article : Google Scholar : PubMed/NCBI
|
|
26
|
Gibbs P, Tozer DJ, Liney GP and Turnbull
LW: Comparison of quantitative T2 mapping and diffusion-weighted
imaging in the normal and pathologic prostate. Magn Reson Med.
46:1054–1058. 2001. View
Article : Google Scholar : PubMed/NCBI
|
|
27
|
Pickles MD, Gibbs P, Sreenivas M and
Turnbull LW: Diffusion-weighted imaging of normal and malignant
prostate tissue at 3.0T. J Magn Reson Imaging. 23:130–134. 2006.
View Article : Google Scholar : PubMed/NCBI
|
|
28
|
Montironi R, Mazzucchelli R, Santinelli A,
Scarpelli M, Beltran AL and Bostwick DG: Incidentally detected
prostate cancer in cystoprostatectomies: Pathological and
morphometric comparison with clinically detected cancer in totally
embedded specimens. Hum Pathol. 36:646–654. 2005. View Article : Google Scholar : PubMed/NCBI
|
|
29
|
Montironi R, Mazzucchelli R, Barbisan F,
Stramazzotti D, Santinelli A, Scarpelli M and Lòpez Beltran A: HER2
expression and gene amplification in pT2a Gleason score 6 prostate
cancer incidentally detected in cystoprostatectomies: Comparison
with clinically detected androgen-dependent and
androgen-independent cancer. Hum Pathol. 37:1137–1144. 2006.
View Article : Google Scholar : PubMed/NCBI
|
|
30
|
Noworolski SM, Vigneron DB, Chen AP and
Kurhanewicz J: Dynamic contrast-enhanced MRI and MR diffusion
imaging to distinguish between glandular and stromal prostatic
tissues. Magn Reson Imaging. 26:1071–1080. 2008. View Article : Google Scholar : PubMed/NCBI
|
|
31
|
García-Segura JM, Sánchez-Chapado M,
Ibarburen C, Viaño J, Angulo JC, González J and Rodríguez-Vallejo
JM: In vivo proton magnetic resonance spectroscopy of diseased
prostate: Spectroscopic features of malignant versus benign
pathology. Magn Reson Imaging. 17:755–765. 1999. View Article : Google Scholar : PubMed/NCBI
|