Introduction
Colorectal cancer (CRC) is the second most common
malignant neoplasm in women and the third in men, with 1.2 million
annual incidences worldwide (1). CRC
is responsible for 10% of cases of cancer incidence and mortality,
worldwide (2). The primary cause for
mortality due to colon cancer is liver metastasis, and ~60% of
patients may develop metastases (3).
The 5-year survival rate of CRC patients is 91% if the carcinoma
remains localized at the time of diagnosis; however, this decreases
to 11% if distant metastases have occurred (2). Understanding the underlying mechanisms
behind CRC tumorigenesis and metastasis will improve clinical
treatment. Until recently, CRC has been divided into two
categories: Colon carcinoma (CC) and rectal carcinoma (RC)
(4). Unfortunately, numerous previous
studies have not distinguished between these two distinct forms of
carcinoma (5–8).
MicroRNAs (miRNAs/miRs) are evolutionarily conserved
~22-nt-long, non-coding RNAs that bind to the 3′-untranslated
regions of mRNA to regulate its expression, thereby inhibiting
translation driving the cleavage of target mRNAs (9–11).
Previous studies have investigated the association between miRNA
polymorphisms and CRC incidence and prognosis, and the possibility
of using circulatory or fecal miRNAs as early non-invasive
prognosis biomarkers (5,12–15).
In the present study, samples were collected
exclusively from patients with RC-positive and CC-negative disease.
A next-generation high-throughput sequencing strategy was applied
to identify differentially expressed miRNAs in primary tumor
tissues of RC with heterochrony hepatic metastases (HHM) or without
metastases (non-metastatic, NM). Hsa-let-7e-5p was identified to be
the most significantly upregulated in primary tumor tissues with
HHM. The potential targets of hsa-let-7e-5p, initially derived from
online bioinformatics resources, were additionally verified using
RNA sequencing (RNA-seq) data. The majority of target genes have
already been identified to be directly involved in tumor
metastases. The results of the present study indicate that
hsa-let-7e-5p may be used as a prognosis marker to identify
patients with RC who may be at risk of metastases.
Patients and methods
Patients and samples
Rectal cancer samples were collected from patients
who underwent surgical resection in the Department of Colorectal
Surgery, Peking University School of Oncology, Beijing Institute
for Cancer Research, Beijing Cancer Hospital (Beijing, China)
between February 2007 and November 2010. All patients underwent
complete history and physical examination, laboratory evaluation,
colonoscopy and biopsy of the lesion, and were diagnosed with
rectal carcinoma by pathological diagnosis (hematoxylin-eosin
staining and immunohistochemistry). The pre-operative imaging
examination and intra-operative probe were used to confirm whether
or not synchronous liver metastasis had occurred (16). Briefly, prior to separation and
removal of the cancer tissue, a physical examination was conducted
to determine whether there were any transferred carcinoma nodules
on the surface of the liver or other organs outside of the rectal
tissue. Rectal carcinoma patients with concurrent liver metastasis,
or in whom liver metastasis developed in the 6 months following
surgery, were excluded. According to the guidelines of the National
Comprehensive Cancer Network (NCCN), the American Joint Committee
on Cancer (AJCC) and College of American Pathologists (17), all patients underwent R0 resection and
a minimum of 12 lymph nodes were used to accurately stage the
cancer. Patients who had received chemotherapy or radiotherapy
prior to surgery were excluded, as were those with other primary
malignant tumors, including CC, or those who succumbed to diseases
other than RC, or succumbed to RC within 5 years post-surgery
(18). In the results of the present
study, the accurate postoperative pathological staging information
is provided. The American Joint Committee for Cancer (AJCC) seventh
edition was used for cancer staging (19). According to this staging, the patients
should preoperatively receive chemo- and/or radiotherapy. However,
the preoperative radiological staging is not completely in
accordance with the postoperative pathological staging. Endoscopic
ultrasonography is reported to assess the tumor (T) stage and nodal
involvement with 67–97 and 64–88% accuracy, respectively. A
meta-analysis of 83 studies demonstrated that computed tomography
has 73% accuracy for T stage and 22–73% accuracy for nodal staging.
Additionally, the newly endorectal coil magnetic resonance imaging
has 71–85% accuracy for prediction of the T stage and 63% for nodal
staging of rectal tumors (20,21). Prior
to surgery, only preliminary clinical staging of tumors using
imaging diagnosis is available. As such, the preoperative
evaluation determined that the clinical staging of these patients
had not reached the standard of preoperative neoadjuvant
chemoradiation; therefore, preoperative chemo- and/or radiotherapy
were not administered. Additionally, pathological staging is a key
factor of assessing postoperative survival and recurrence for
patients with rectal cancer. The AJCC postoperative pathological
staging information was summarized to confirm that there were no
differences in the pathological staging between the selected
patients, ensuring consistency between sequencing samples and
comparability between sequencing results (19). HHM was defined as patients who
suffered from liver metastases after 6 months of an initial RC
diagnosis, and was pathologically confirmed (22). Following this, 84 patients consisted
of 51 men (61%) and 33 women (39%) were included and followed up
consecutively for 5 years, or until liver metastases appeared.
Patients were aged between 38 and 77 years (median, 61 years old).
The follow-up and evaluation protocols conformed to the NCCN
guidelines (23). The
Tumor-Node-Metastasis staging for RC was determined according to
the 7th edition of the AJCC Cancer Staging Manual (19). Six cycles of bolus
fluorouracil/leucovorin (400 mg/m2/day for fluorouracil,
intravenous 200 mg/m2/day for leucovorin, intravenous,
1–5 days/week, every four weeks), were started two weeks following
surgery for patients with stage III or stage II disease at high
risk of recurrence (tumor perforation, tunica serosa or adjacent
organs invasion, venous or lymphatic or peri-neural invasion, poor
histopathological differentiation), followed by concurrent
5-FU/radiotherapy (45–50 Gy in 25–28 fractions to the pelvis)
(23).
The primary lesions of RC were collected and
temporarily stored in liquid nitrogen (−196°C) within 30 min of
excision. For long-term storage, the freshly frozen tumor tissues
were then stored in the tissue bank (−80°C) in Peking University
School of Oncology (Beijing, China) until the end of the follow-up
period. The present study was approved by the Medical Ethics
Committee of Peking University School of Oncology. Written informed
consent was obtained from participants for their clinical records
to be used in the present study.
Small RNA isolation and
sequencing
Total RNA was extracted from fresh-frozen tissues of
patients with RC in the HHM and the NM groups using the RNeasy Mini
kit (Qiagen, Inc., Valencia, CA, USA) according to the
manufacturers protocol. RNA quality was assessed by 1% agarose gel
electrophoresis and by spectrophotometry (260 nm). RNA integrity
was assessed using an Agilent Technologies 2100 Bioanalyzer
(Agilent Technologies, Inc., Santa Clara, CA, USA). RNAs 18–30-nt
in length were isolated and purified from total RNA using Noves 15%
TBE-Urea Gel (Invitrogen; Thermo Fisher Scientific, Inc., Waltham,
MA, USA). Next, the 5′ and 3′ adaptors (Beijing Genomics Institute,
Shenzhen, China) for additional sequencing were ligated and the
small RNA were reverse transcribed. Finally, following an
amplification procedure, the products were sequenced using an
Illumina Genome Analyzer (BGI Biotechnology, Cambridge, MA, USA),
as previously described (24).
Identification of differentially
expressed miRNAs
The analysis procedure for differentially expressed
miRNAs has been described previously (25). Firstly, the raw sequencing data were
analyzed using adaptor sequences filtering and base calling using
Phred (http://www.phrap.com/). Secondly, the
overall length of RNAs distribution was calculated and the
sequences were mapped onto the human genome using the program Short
Oligo nucleotide Analysis Package v2.04 (26). Next, the differences in small RNA
sequences between HHM and NM groups were detected. Different types
of RNA (small nuclear RNA, tRNA, rRNA and small nucleolar RNA,
hereafter referred to as rRNAetc) were identified by blasting with
the database of NCBI GenBank (https://www.ncbi.nlm.nih.gov/genbank/) and Rfam
(version 10.1; http://rfam.xfam.org/). Finally, the
small RNAs were compared with the known miRNAs using miRBase 20.0
(http://www.mirbase.org/). The RNAs were marked as
‘unann’ if they were unable to be mapped to any known
databases.
Differential miRNA expression levels between NM and
HHM were analyzed according to a previously described method
(27). In the present study, pairwise
comparisons were conducted to identify the differences in miRNA
expression between the HHM and NM groups. The expression difference
was assessed using the fold change of reads per kilobase of
transcript per million mapped reads, and the P-value according to
the following formulas: Fold change=log2 (HHM/NM)
p(x|y)=(N2N1)y(x+y)!x!y!(1+N2N1)(x+y+1)C(y≤ymin|x)=∑y=0y≤yminp(y|x)D(y≥ymax|x)=∑y≥ymax∞p(y|x)
Where fold change represents the fold change of
miRNA expression in the HHM group relative to the NM group,
x indicates the observed the number of reads for the miRNA
in one library, y represents the observed number of reads
for the miRNA in another library, and N1 and
N2 are the total reads for the two libraries,
respectively. In the present study, a miRNA was considered to be
significantly differentially expressed if the absolute value of the
fold change was ≥1 and P<0.01.
Reverse transcription quantitative
polymerase chain reaction (RT-qPCR)
For RT-qPCR of mRNA, total RNA from rectal carcinoma
tissues were extracted using RNAiso plus (Takara Biotechnology Co.,
Ltd., Dalian, China) according to the manufacturers protocol, and
then subjected to RT with random hexamers using the RevertAid First
Strand cDNA Synthesis System (Thermo Fisher Scientific, Inc.) to
obtain cDNA. qPCR was performed using an UltraSYBR Mixture (with
High ROX) (CW Biotech. Co., Ltd., Beijing, China; http://www.cwbiotech.com/) on the LightCycler 480 II
(Roche Applied Science, Penzberg, Germany). The thermocycling
conditions were as follows: Polymerase activation at 95°C for 10
min, followed by 40 cycles of 95°C for 15 sec, 60°C for 30 sec and
72°C for 30 sec. The 2−ΔΔCq method was used, where the
Cq value of one target gene was compared to the Cq value of GAPDH
internal control gene, in HHM and NM groups (25). Primers are presented in Table I.
 | Table I.Primers used for reverse
transcription-quantitative polymerase chain reaction. |
Table I.
Primers used for reverse
transcription-quantitative polymerase chain reaction.
| Target genes | NCBI Gene ID | Direction | Sequence
(5′-3′) |
|---|
| NKX2-1 | 7080 | Forward |
AGCACACGACTCCGTTCTC |
|
|
| Reverse |
GCCCACTTTCTTGTAGCTTTCC |
| MSTN | 2660 | Forward |
GACGATTATCACGCTACAACGG |
|
|
| Reverse |
TCCATAGTTGGGCCTTTACTACT |
| CCR4 | 1233 | Forward |
AGAAGGCATCAAGGCATTTGG |
|
|
| Reverse |
ACACATCAGTCATGGACCTGAG |
| PRTN3 | 5657 | Forward |
AACTACGACGCGGAGAACAAA |
|
|
| Reverse |
CGAGGGACGAAAGTGCAAATG |
| TREH | 11181 | Forward |
TGGGCTTGCTCATTCAGTCA |
|
|
| Reverse |
TCCCCGTGGCAGTAAATCTC |
| GHR | 2690 | Forward |
CCATTGCCCTCAACTGGACTT |
|
|
| Reverse |
AATATCTGCATTGCGTGGTGC |
| NR1I2 | 8856 | Forward |
GCCCATGCTGAAATTCCACTA |
|
|
| Reverse |
GCCGATTGCATTCAATGTAGGA |
| PROM1 | 8842 | Forward |
AGTCGGAAACTGGCAGATAGC |
|
|
| Reverse |
GGTAGTGTTGTACTGGGCCAAT |
| PPARGC1A | 10891 | Forward |
TGAAGACGGATTGCCCTCATT |
|
|
| Reverse |
GCTGGTGCCAGTAAGAGCTT |
| CD40LG | 959 | Forward |
GAGCAACAACTTGGTAACCCT |
|
|
| Reverse |
GGCTGGCTATAAATGGAGCTTG |
| PI3 | 5266 | Forward |
CACGGGAGTTCCTGTTAAAGG |
|
|
| Reverse |
TCTTTCAAGCAGCGGTTAGGG |
| KIT | 3815 | Forward |
TGCTCTGCTTCTGTACTGCC |
|
|
| Reverse |
GCCTTACATTCAACCGTGCC |
| MYC | 4609 | Forward |
CATCAGCACAACTACGCAGC |
|
|
| Reverse |
GCTGGTGCATTTTCGGTTGT |
| JUN | 3725 | Forward |
GTGCCGAAAAAGGAAGCTGG |
|
|
| Reverse |
CTGCGTTAGCATGAGTTGGC |
| GAPDH | 2597 | Forward |
GGAGCGAGATCCCTCCAAAAT |
|
|
| Reverse |
GGCTGTTGTCATACTTCTCATGG |
| U6 | 26827 | Forward |
AATTGGAACGATACAGAGAAGATT |
|
|
| Reverse |
TATGGAACGCTTCACGAATTTG |
For the miRNA RT-qPCR, a miRNA first-strand cDNA
synthesis kit (cat. no. KR211; Tiangen Biotech Co., Ltd., Beijing,
China) was first used to complete the reverse transcription of
let-7e-5p from total RNA of rectal carcinoma tissues, including
miRNA. Total RNA were extracted using RNAiso plus buffer (Takara
Biotechnology Co., Ltd., Dalian, China) according to the
manufacturer's protocol. Briefly, miRNAs were ligated to poly(A)
and reverse transcribed with a poly(T) adapter primer. The
thermocycling conditions were 42°C for 120 min and 95°C for 3 min.
Next, the let-7e-5p-specific forward and reverse primers were used
to perform qPCR with miRcute miRNA qPCR SYBR Green detection kit
(cat. no. FP411; Tiangen Biotech Co., Ltd.,) according to the
manufacturers protocol. The let-7e-5p-specific forward primer was
purchased from Tiangen Biotech Co., Ltd (cat. no. CD201-0002). The
2−ΔΔCq method was (28),
where the Cq value of miRNA was compared to the Cq value of U6
internal control in HHM and NM groups.
Gene Ontology (GO) and Kyoto
Encyclopedia of Genes and Genomes (KEGG) analysis
GO annotation for let-7e-5p targets was performed by
mapping all of the targets to the GO database (http://www.geneontology.org/). Next, GO functional
classification for annotated targets was processed using WEGO
software (29). Finally, GO
enrichment analysis was conducted using the hypergeometric test to
identify significantly enriched GO terms in targets compared with
the whole genome background. The formula used was as follows:
p=1–∑i=0m–1(Mi)(N–Mn–i)(Nn)
Where N is the number of all genes with GO
annotations, n is the number of targets in N, M is the number of
all genes that are annotated to the certain GO terms, and m is the
number of targets in M. The present study adopted a Bonferroni
corrected P-value of ≤0.05 as a threshold. Those terms fulfilling
this condition are defined as significantly enriched GO terms in
DEGs. The Kyoto Encyclopedia of Genes and Genomes (KEGG) database
is the major public pathway-related database (30). KEGG pathway enrichment analysis
identifies significantly enriched metabolic pathways or signal
transduction pathways in targets compared with the whole genome
background. The calculation formula and analysis procedure were the
same as those used in GO analysis.
In vitro scratch migration assays
Colorectal adenocarcinoma Caco-2 cells were provided
by the Stem Cell Bank, Chinese Academy of Sciences (http://www.cellbank.org.cn/). The base medium for this
cell line was American Type Culture Collection-formulated Eagle's
Minimum Essential Medium (cat. no. 30-2003; American Type Culture
Collection, Manassas, VA, USA). The complete growth medium was
generated by adding fetal bovine serum (TransGen Biotech Co., Ltd,
Beijing, China), giving a final concentration of 20%, to the base
medium. The culture conditions were 95% air, 5% CO2 and
37°C. Pcdna3.1-enhanced green fluorescent protein
(EGFP)-hsa-pre-let-7e-5p and Pcdna3.1-EGFP-hsa-let-7e-5p-sponge
plasmids were constructed by ligating the hsa-pre-let-7e-5p and
hsa-let-7e-5p-sponge (Sangon Biotech Co., Ltd, Shanghai, China)
downstream of Pcdna3.1-EGFP (Miaoling Biotech Co., Ltd, Wuhan,
China) using T4 DNA ligase (Takara Biotechnology Co., Ltd.).
Following transfection with Pcdna3.1-EGFP-hsa-pre-let-7e-5p,
Pcdna3.1-EGFP-hsa-let-7e-5p-sponge or Pcdna3.1-EGFP using
Lipofectamine 3000 (Thermo Fisher Scientific Inc., Waltham, MA,
USA), cells were grown in tissue culture dishes at 37°C for 12 h,
and scratches were made using a 10 µl pipette tip. A total of 10
different areas were marked on the bottom of the chamber, and
images of these spots were captured using a fluorescent microscope
(magnification, ×10) at time intervals (0, 24 and 48 h following
scratching). Migration of the cells was measured using the ImageJ
V1.5 software package (National Institutes of Health, Bethesda, MD,
USA).
Statistical analysis
The differences in mRNA and miRNA levels between
paired samples were determined by the Wilcoxon matched-pairs test
using GraphPad Prism V6.0 (GraphPad Software, Inc., La Jolla, CA
USA). P<0.05 was considered to indicate a statistically
significant difference.
Results
Patient characteristics and samples
grouping
A total of 84 patients with RC were followed from
the day 1 post-surgery, with a median time of 61 months and the
proportion of patients who adhered to follow-up was 98.8% (83/84).
The follow-up data indicated that 64 patients exhibited NM, 6
patients developed local recurrence and 13 exhibited HHM. From the
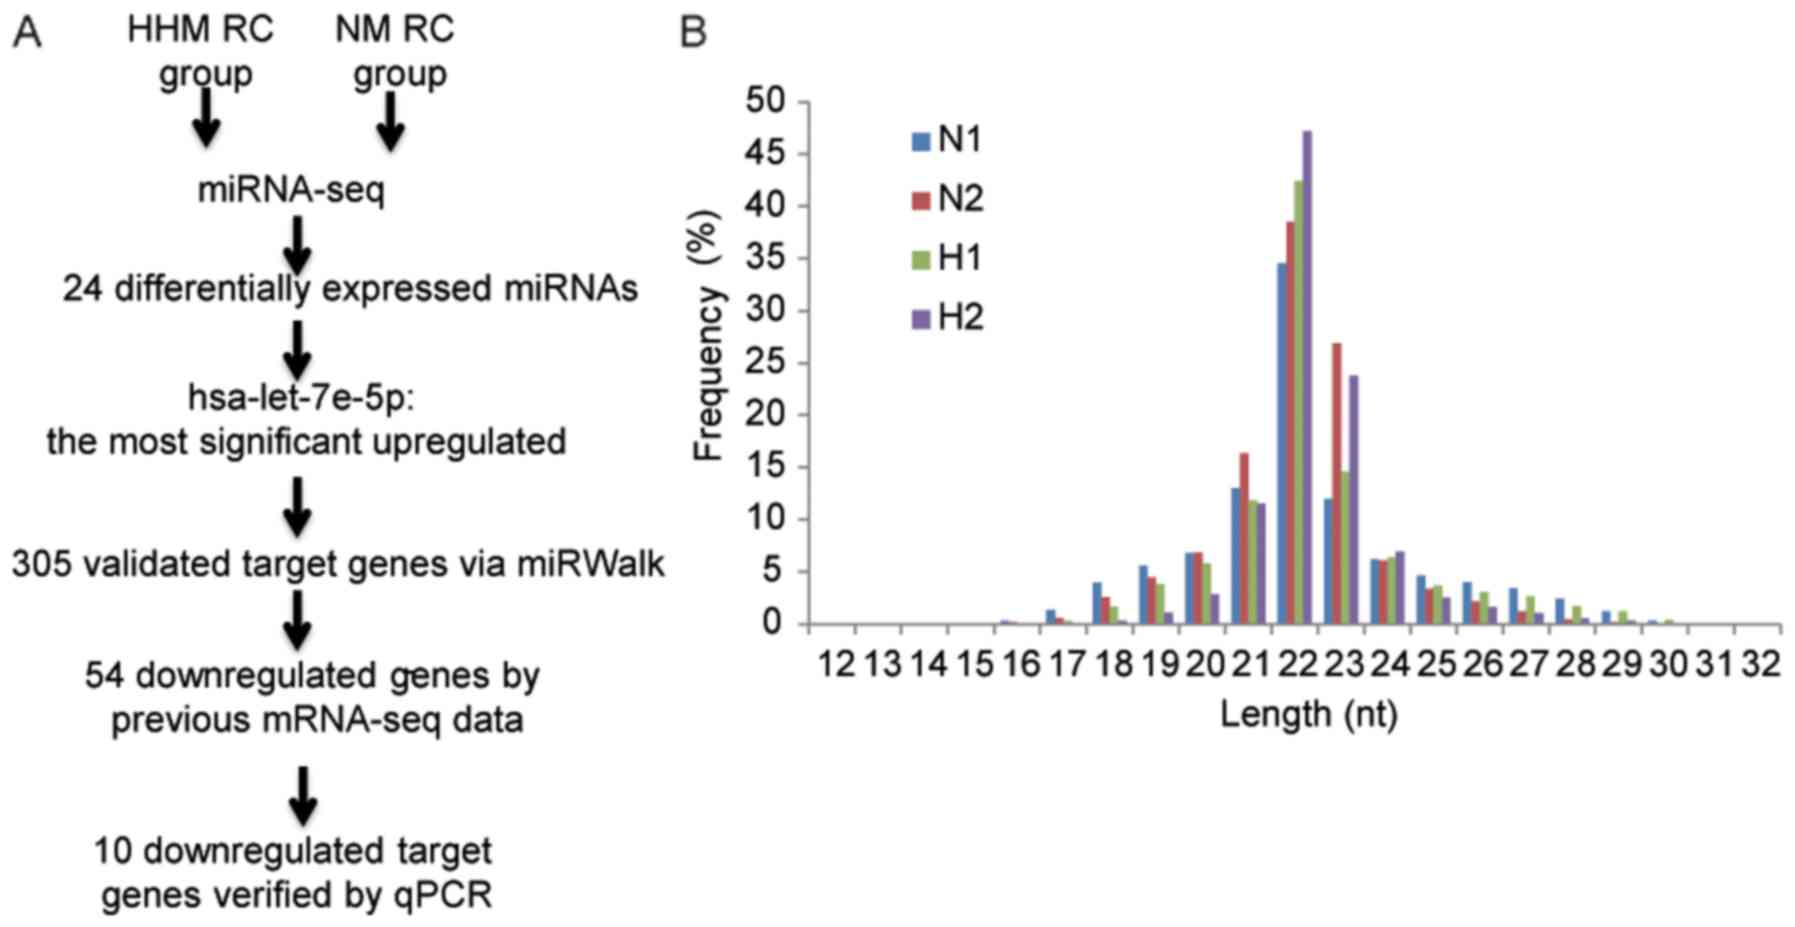
NM and HHM groups, 5 primary RC tumor samples were randomly
selected for RNA extraction. Following RNA quality and integrity
assessment, 2 NM samples and 3 HHM samples were selected for
additional sequencing (Fig. 1A).
Sequencing and analysis of small RNAs
from NM and HHM RC
To investigate the role of miRNAs in rectal
carcinoma with HHM, miRNA expression profiles in primary tumor
tissues of rectal carcinoma with HHM (n=3) and NM (n=2) were
determined by next-generation high-throughput sequencing technology
(Table II). Small RNAs length
distribution in 4 samples was 22 nt, with the exception of one HHM
sample (Fig. 1B). It is possible that
the low quality of miRNA library construction of this HHM sample
resulted in abnormal miRNA length distribution. Therefore, only two
HHM samples were used for subsequent analysis. For each sample,
18.3–23.6 million reads were obtained. Following the elimination of
the adaptor sequence reads and sequences <18 nt, each sample
contained >97% (~17 million) clean reads 18–30 nt in length. In
total, >70% (74.7–79.0%) clean reads from each sample were
mapped to genomic regions, resulting in 676,280 (36.44%), 486,314
(40.94%), 434,966 (31.8%) and 4,251,607 (38.03%) that matched with
the small RNA region for tissues with HHM and NM respectively.
| Table II.Clinical information of the patients
with rectal cancer. |
Table II.
Clinical information of the patients
with rectal cancer.
| A, Sequenced
samples |
|---|
|
|---|
| No. | Metastasis | Sex | Age, years | Tumor location | Tumor size, cm | Pathological
type | Vascular
invasion | pTNM
stagea | Preoperative serum
CEA levels (μg/l) | Ki67,
%c | Postoperative HHM
time, months |
|---|
| N1 | NM | F | 58 | Upper | 5.1 | Ulcer type,
moderately differentiated adenocarcinoma | − | T4aN0M0, IIb | 5.2 | 45–60 | − |
| N2 | NM | M | 66 | Upper | 4.5 | Ulcer type,
moderately or poorly differentiated adenocarcinoma | + | T4aN2bM0, IIIC | 2.8 | <25 | − |
| H1 | HHM | M | 60 | Upper | 6.0 | Ulcer type,
moderately or poorly differentiated adenocarcinoma | + | T4bN1M0, IIIC | 2.9 | 50–75 | 48 |
| H2 | HHM | M | 38 | Upper | 5.0 | Ulcer type,
moderately or poorly differentiated adenocarcinoma, mucinous
partially | + | T4aN1M0, IIIB | 17.0 | 50 | 7 |
| H3b | HHM | F | 77 | Middle | 5.0 | Ulcer type,
moderately differentiated adenocarcinoma | − | T3N0M0, IIa | 5.9 | 60 | 15 |
|
| B, Non-sequenced
samples |
|
| N3 | NM | M | 62 | Middle | 4.3 | Ulcer type,
moderately differentiated adenocarcinoma | − | T3N0M0, IIa | 4.7 | 35 | − |
| N4 | NM | M | 73 | Middle | 5.0 | Ulcer type,
moderately differentiated adenocarcinoma | + | T3N1M0, IIIB | 16.6 | <25 | − |
| H4 | HHM | M | 61 | Middle | 5.0 | Ulcer type,
moderately differentiated adenocarcinoma | + | T4bN2aM0, IIIC | 8.4 | 10 | 10 |
| H5 | HHM | F | 46 | Middle | 5.0 | Ulcer type,
moderately differentiated adenocarcinoma | − | T3N0M0, IIa | 3.7 | 65 | 63 |
Next, the clean small RNA reads were analyzed by
mapping them to the non-coding RNAs in the GenBank, Rfam 10.1 and
miRBase 20.0 databases. All clean reads were divided into known
miRNAs and all other rRNA (Table
III), and the rRNAetc fractions were removed from all the
samples. The number of unann small RNAs was generally high when it
was calculated from the unique reads small RNAs (Table III). However, when it was calculated
from the total small RNAs, the number of unann small RNAs was ~20%
of total reads (Table III),
indicating that the majority of the total small RNAs were miRNAs.
Briefly, 8,771,735 (38.57% of small RNA reads) and 9,081,651
(47.47% of small RNA reads) tags from the patients with NM, and
8,506,675 (47.82% of small RNA reads) and 10,871,492 (63.29% of
small RNA reads) tags from the patients with HHM were matched to
hairpin precursors of known miRNAs. Examination of these reads in
the small RNA libraries indicated the presence of a high percentage
of unann small RNAs, ~20% for all samples (Table III).
| Table III.Composition of sRNAs among different
categories. |
Table III.
Composition of sRNAs among different
categories.
| A, N1 |
|---|
| Category | Total reads | % | Unique reads | % |
|---|
| Total sRNAs | 22,740,286 | 100 | 1,855,776 | 100 |
| sRNAs match
hairpin | 8,771,735 | 38.57 | 5,687 | 0.31 |
| rRNAetc | 9,975,175 | 43.87 | 878,176 | 47.32 |
| Unann | 3,993,376 | 17.56 | 971,913 | 52.37 |
|
| B, N2 |
|
| Total sRNAs | 19,130,301 | 100 | 1,187,729 | 100 |
| sRNAs match
hairpin | 9,081,651 | 47.47 | 4,910 | 0.41 |
| rRNAetc | 6,422,337 | 33.57 | 632,232 | 53.23 |
| Unann | 3,626,313 | 18.96 | 550,587 | 46.36 |
|
| C, H1 |
|
| Total sRNAs | 17,788,876 | 100 | 1,366,299 | 100 |
| sRNAs match
hairpin | 8,506,675 | 47.82 | 4,835 | 0.35 |
| rRNAetc | 5,580,275 | 31.37 | 588,867 | 43.10 |
| Unann | 3,701,926 | 20.81 | 772,597 | 56.55 |
|
| D, H2 |
|
| Total sRNAs | 17,177,276 | 100 | 661,686 | 100 |
| sRNAs match
hairpin | 10,871,492 | 63.29 | 4,583 | 0.69 |
| rRNAetc | 2,466,095 | 14.36 | 313,039 | 47.31 |
| Unann | 3,839,689 | 22.35 | 344,064 | 52.00 |
miRNAs are differentially expressed in
primary tumor tissues of rectal carcinoma with and without HHM
Pair-wise intersection analysis demonstrated that
>90% of small RNAs were commonly expressed among all samples.
Differential expression analysis was performed for the HHM and NM
groups. In total, 24 significantly differentially expressed miRNAs
(P<0.01; the absolute value of log2-fold change
>1) were identified (Table IV).
Among these differentially expressed miRNAs, 9 upregulated miRNAs,
with log2-fold change >1.5 in the HHM samples
compared with the NM samples, were identified. Concurrently, 15
downregulated miRNAs exhibited log2-fold change ~2 in
the HHM samples. Among the upregulated miRNAs, hsa-let-7e-5p
exhibited the highest normalized expression level in the tissues
with (H-std=7,774.26±1,434.92 reads) and without HHM
(N-std=1,201.21±29.95 reads), and exhibited a log2-fold
change of 2.62 in tissues with HHM (Table IV). Expression of hsa-miR-224-5p was
also upregulated, with a high normalized expression level
(H-std=175.01±11.59 reads; N-std=52.21±5.14 reads) (Table IV). Conversely, the normalized
expression levels of all the downregulated miRNAs were low compared
with upregulation miRNAs (all <100 reads; Table IV), with the exception of
hsa-miR-424-5p, with 159.04±26.06 reads for tissues without HHM.
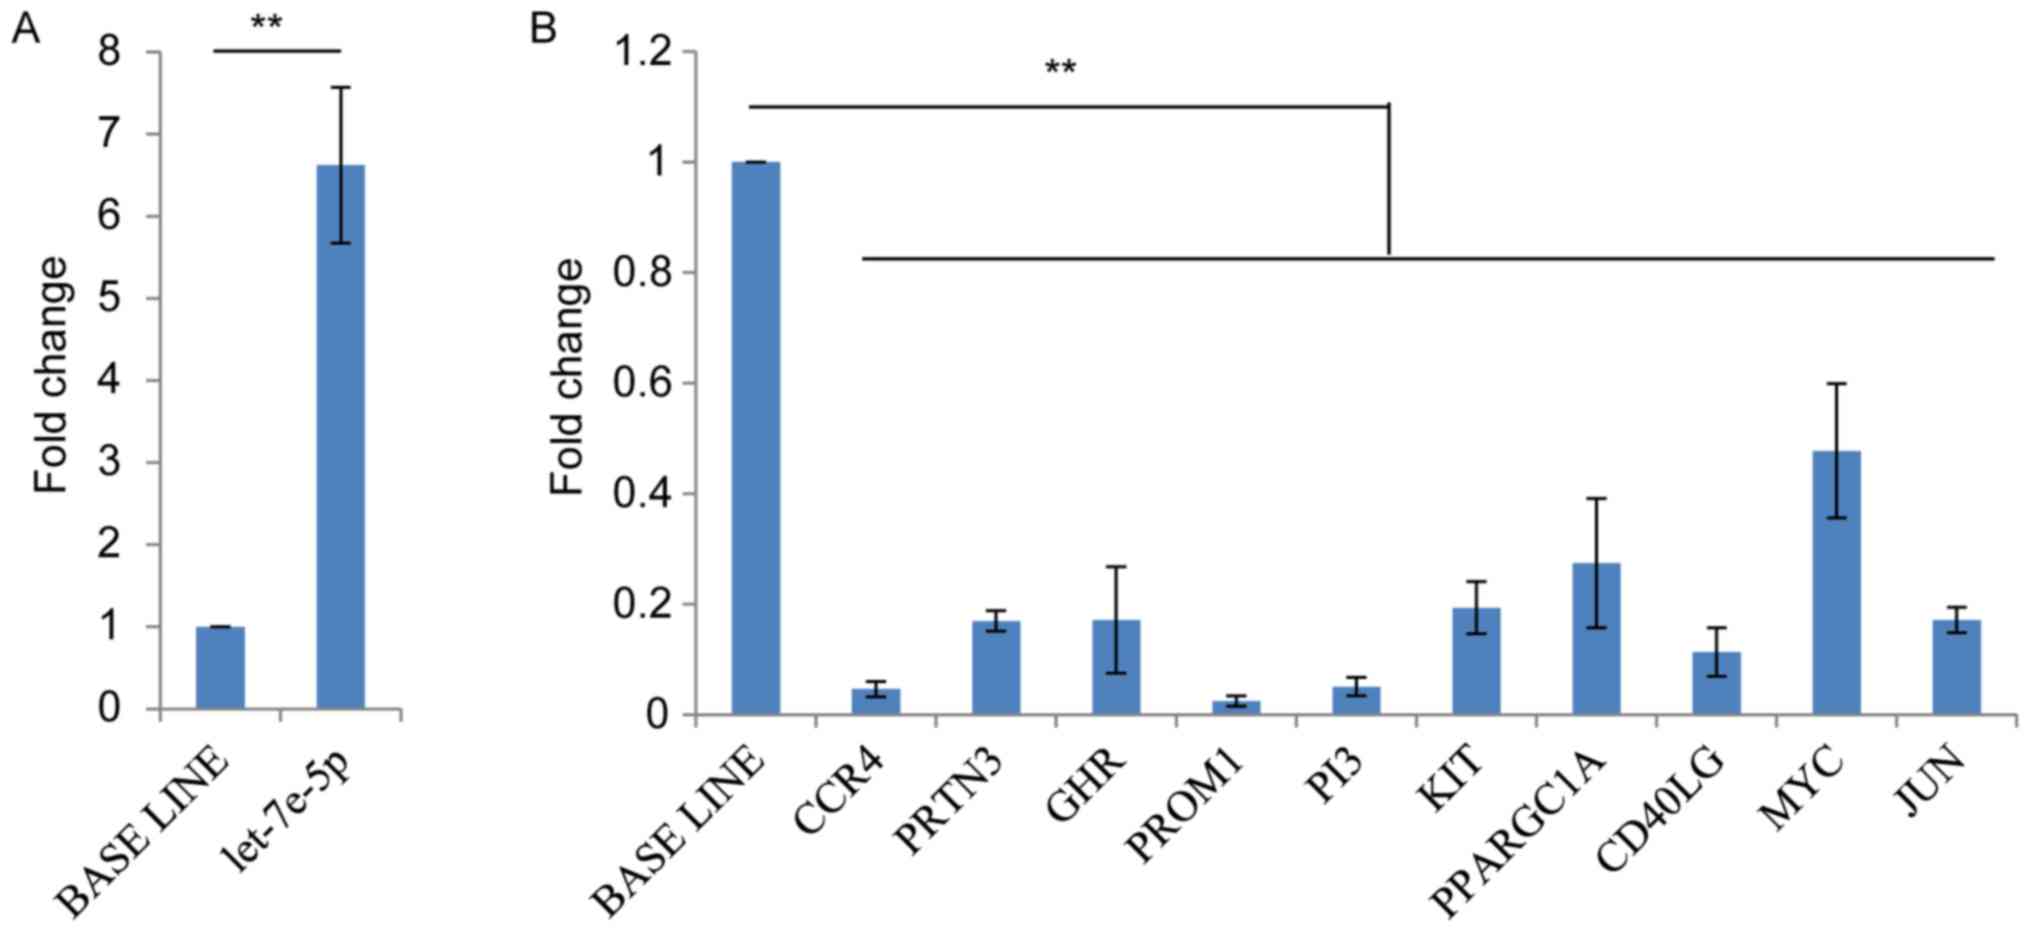
RT-qPCR confirmed that hsa-let-7e-5p was upregulated >5-fold in
the HHM samples (Fig. 2A).
Consequently, all additional analysis focused on hsa-let-7e-5p.
| Table IV.Significantly differentially
expressed microRNAs between RC samples with HHM and without
metastasis. |
Table IV.
Significantly differentially
expressed microRNAs between RC samples with HHM and without
metastasis.
| miRNA | N-stha | H-stha | Fold-change
(log2 H/N) | P-value |
|---|
| hsa-let-7e-5p |
1,201.20±29.95 |
7,774.26±1,434.92 |
2.62±0.28 | <0.01 |
|
hsa-miR-125a-3p |
0.47±0.03 |
1.83±0.15 |
1.94±0.15 | <0.01 |
|
hsa-miR-1307-5p |
70.80±15.95 |
12.90±3.82 |
−2.55±0.58 | <0.01 |
| hsa-miR-188-5p |
3.41±0.97 |
0.45±0.13 |
−2.90±0.63 | <0.01 |
| hsa-miR-224-5p |
52.21±5.14 |
175.01±11.59 |
1.76±0.17 | <0.01 |
| hsa-miR-23a-5p |
3.41±0.70 |
19.01±2.17 |
2.54±0.35 | <0.01 |
| hsa-miR-362-3p |
11.59±0.93 |
2.56±0.34 |
−2.20±0.23 | <0.01 |
| hsa-miR-3648 |
5.36±0.44 |
1.16±0.34 |
−2.40±0.47 | <0.01 |
| hsa-miR-3651 |
2.09±0.06 |
0.48±0.21 |
−2.74±0.83 | <0.01 |
| hsa-miR-3687 |
6.67±0.37 |
1.45±0.33 |
−2.32±0.36 | <0.01 |
| hsa-miR-378d |
2.63±0.46 |
0.51±0.16 |
−2.55±0.57 | <0.01 |
| hsa-miR-424-5p |
159.04±26.06 |
35.56±6.12 |
−2.17±0.35 | <0.01 |
| hsa-miR-432-5p |
16.75±0.02 |
55.15±5.13 |
1.70±0.14 | <0.01 |
| hsa-miR-4426 |
1.16±0.67 |
0.31±0.08 |
−2.04±0.40 | 0.01 |
| hsa-miR-4454 |
11.68±1.76 |
2.39±0.34 |
−2.28±0.31 | <0.01 |
| hsa-miR-449a |
0.34±0.02 |
2.54±0.82 |
2.65±0.53 | <0.01 |
|
hsa-miR-449c-5p |
0.79±0.21 |
5.71±0.34 |
3.00±0.41 | <0.01 |
| hsa-miR-493-5p |
1.81±0.20 |
5.12±0.07 |
1.53±0.16 | <0.01 |
|
hsa-miR-509-3-5p |
3.81±0.76 |
0.52±0.07 |
−2.84±0.36 | <0.01 |
| hsa-miR-509-3p |
2.26±0.39 |
0.23±0.04 |
−3.35±0.23 | <0.01 |
| hsa-miR-556-3p |
3.16±0.53 |
0.97±0.06 |
−1.65±0.26 | <0.01 |
| hsa-miR-652-5p |
4.13±0.30 |
1.24±0.19 |
−1.79±0.26 | <0.01 |
| hsa-miR-7704 |
2.85±0.56 |
0.45±0.23 |
−3.60±1.15 | <0.01 |
| hsa-miR-99b-5p |
22.46±0.68 |
69.46±1.54 |
1.63±0.05 | <0.01 |
Target analysis of hsa-let-7e-5p
To elucidate the potential biological mechanisms of
hsa-let-7e-5p in promoting HHM, its potential targets were
investigated, which had been validated previously using the miRWalk
database (31,32). hsa-let-7e was identified to have 305
validated target genes (data not shown). By examining the mRNA-seq
data of the present study (the transcriptome of 5 HHM and 5 NM RC
samples), it was revealed that the expression of 54 of these
validated target genes was downregulated in tissues with HHM. A
number of these 54 target genes have been demonstrated to be
directly involved in tumor metastases, including MYC
proto-oncogene, bHLH transcription factor (MYC), high-mobility
group AT-Hook 2, peptidase inhibitor 3 (PI3), KIT proto-oncogene
receptor tyrosine kinase (KIT), Jun proto-oncogene, AP-1
transcription factor subunit (JUN) and ribonuclease T2 (33–36), or
have physiological associations with immunity, including C-C motif
chemokine receptor 4 (CCR4) (37),
cluster of differentiation 40 ligand (CD40LG) (38), and cellular metabolism, for example
peroxisome proliferator-activated receptor γ, coactivator 1 α
(PPARGC1A) (39). Among the 54 target
genes, 12 exhibited a log2-fold reduction >2.0 in
gene expression: NK2 homeobox 1; myostatin; CCR4, proteinase 3,
trehalase, growth hormone receptor, nuclear receptor subfamily 1
group I member 2, prominin 1, PPARGC1A, CD40LG, PI3 and KIT
(Table V). Next, the expression
levels of these 12 targets plus MYC (1.8 log2-fold
change) and JUN (1.2 log2-fold change) were compared
between 2 additional pairs of HHM and NM RC samples (non-sequenced)
(Table II). The results of RT-qPCR
indicated that the log2-fold change of 10 out of the 14
target genes were consistent with the results derived from the
sequenced samples (Fig. 2B).
| Table V.Downregulated known validated
hsa-let-7e-5p target genes from RNA sequencing results. |
Table V.
Downregulated known validated
hsa-let-7e-5p target genes from RNA sequencing results.
| Gene name | logN1 vs. H1 | logN1
vs. H2 | logN2 vs. H1 | logN2
vs. H2 | Average |
|---|
| NKX 20.0011 | −12.47 | −12.47 | −16.01 | −16.01 | −14.24 |
| MSTN | −8.21 | −8.21 | −8.01 | −8.01 | −8.11 |
| CCR4 | −8.39 | −1.54 | −9.20 | −2.34 | −5.37 |
| PRTN3 | −8.12 | −0.54 | −7.92 | −0.34 | −4.23 |
| TREH | −3.22 | −2.86 | −4.16 | −3.80 | −3.51 |
| GHR | −3.16 | −4.38 | −1.12 | −2.34 | −2.75 |
| NR1I2 | −0.80 | −3.64 | −1.60 | −4.44 | −2.62 |
| PROM1 | −3.31 | −1.86 | −3.18 | −1.74 | −2.52 |
| PPARGC1A | −2.24 | −4.20 | −0.84 | −2.80 | −2.52 |
| CD40LG | −3.48 | −2.13 | −2.29 | −0.93 | −2.21 |
| PI3 | −3.70 | −2.37 | −1.97 | −0.64 | −2.17 |
| KIT | −3.12 | −2.18 | −2.02 | −1.08 | −2.10 |
| UHRF2 | −1.19 | −2.47 | −1.12 | −2.40 | −1.79 |
| MYC | −1.15 | −2.14 | −1.36 | −2.34 | −1.75 |
| ZNF167 | −2.04 | −0.30 | −2.84 | −1.10 | −1.57 |
| SLC25A10 | −1.69 | −1.79 | −1.24 | −1.34 | −1.51 |
| CSAD | −0.25 | −1.39 | −1.57 | −2.72 | −1.48 |
| TRAT1 | −0.90 | −0.54 | −2.29 | −1.93 | −1.41 |
| HMGA2 | −2.62 | −1.90 | −0.92 | −0.20 | −1.41 |
| NOL3 | −1.09 | −0.39 | −2.32 | −1.62 | −1.35 |
| JUN | −0.59 | −1.26 | −1.08 | −1.75 | −1.17 |
| DNMT3A | −0.82 | −1.10 | −1.24 | −1.52 | −1.17 |
| RPE | −0.72 | −1.61 | −0.66 | −1.54 | −1.13 |
| TUT1 | −1.56 | −0.34 | −1.84 | −0.62 | −1.09 |
| CYCS | −0.78 | −2.04 | −0.13 | −1.39 | −1.09 |
| RNASET2 | −0.50 | −0.58 | −1.58 | −1.66 | −1.08 |
| CCNT2 | −0.26 | −0.95 | −0.95 | −1.64 | −0.95 |
| RABEPK | −1.41 | −1.50 | −0.32 | −0.40 | −0.91 |
| RPIA | −0.20 | −1.44 | −0.37 | −1.60 | −0.90 |
| IFI44 | −1.66 | −1.09 | −0.70 | −0.14 | −0.90 |
| NCALD | −0.46 | −1.13 | −0.58 | −1.24 | −0.85 |
| DICER1 | −0.72 | −0.58 | −1.06 | −0.92 | −0.82 |
| FASN | −1.57 | −1.09 | −0.54 | −0.05 | −0.81 |
| HNF4A | −1.26 | −0.37 | −1.25 | −0.36 | −0.81 |
| TRIM17 | −1.22 | −0.86 | −0.70 | −0.34 | −0.78 |
| POLD3 | −1.12 | −0.85 | −0.67 | −0.39 | −0.76 |
| NCOA3 | −1.25 | −0.31 | −1.19 | −0.25 | −0.75 |
| VDR | −0.50 | −1.22 | −0.28 | −0.99 | −0.75 |
| SOCS4 | −0.73 | −0.75 | −0.69 | −0.71 | −0.72 |
| COX8A | −1.04 | −1.27 | −0.07 | −0.30 | −0.67 |
| CNN3 | −0.53 | −0.52 | −0.80 | −0.80 | −0.66 |
| CD46 | −0.30 | −1.06 | −0.23 | −0.99 | −0.64 |
| AMACR | −0.11 | −0.20 | −1.09 | −1.18 | −0.64 |
| CHEK1 | −0.55 | −0.77 | −0.38 | −0.61 | −0.58 |
| HMGA1 | −0.30 | −1.02 | −0.12 | −0.84 | −0.57 |
| EIF2C4 | −0.22 | −0.26 | −0.85 | −0.88 | −0.55 |
| HNRNPA1 | −0.11 | −0.69 | −0.25 | −0.83 | −0.47 |
| MEST | −0.11 | −0.29 | −0.62 | −0.80 | −0.45 |
| TRIM32 | −0.43 | −0.62 | −0.29 | −0.48 | −0.45 |
| CCNG1 | −0.05 | −0.67 | −0.12 | −0.74 | −0.39 |
| PSMA7 | −0.44 | −0.72 | −0.07 | −0.35 | −0.39 |
| DYRK2 | −0.14 | −0.35 | −0.34 | −0.55 | −0.35 |
| CASP8 | −0.10 | −0.48 | −0.21 | −0.59 | −0.35 |
| NDUFA2 | −0.08 | −0.38 | −0.07 | −0.38 | −0.23 |
Gene Ontology (GO) and KEGG analysis
of target genes
GO analysis was performed on the 54 validated
targets of hsa-let-7e-5p. The target genes were categorized into 18
biological processes, nine cellular components and seven molecular
functions. Subsequent analysis indicated that the identified
hsa-let-7e-5p targets were enriched in 18 KEGG pathways. Notably,
targets were identified to participate in the transforming growth
factor-β signaling pathway, the p53 signaling pathway,
melanogenesis, Human T-lymphotropic virus-I infection, Epstein-Barr
virus infection and pathways in cancer (Table VI), indicating that hsa-let-7e-5p
serves a notable role in tumor metastases.
| Table VI.Kyoto Encyclopedia of Genes and
Genomes pathway analysis of 54 hsa-let-7e-5p target genes. |
Table VI.
Kyoto Encyclopedia of Genes and
Genomes pathway analysis of 54 hsa-let-7e-5p target genes.
| Significant gene
symbols | Pathway ID | Pathway name |
P-valuea |
Q-valueb |
|---|
| MYC | ko04350 | TGF-β signaling
pathway | 0.0002 | 0.0161 |
| CCNG1 | ko04115 | p53 signaling
pathway | 0.0006 | 0.0108 |
| KIT | ko04916 | Melanogenesis | <0.0001 | 0.0035 |
| MYC, JUN,
POLD3 | ko05166 | HTLV–I
infection | <0.0001 | 0.0277 |
| MYC | ko05169 | Epstein-Barr virus
infection | <0.0001 | 0.0342 |
| KIT, MYC, JUN | ko05200 | Pathways in
cancer | <0.0001 | 0.0695 |
Overexpression of hsa-let-7e-5p
promotes tumor cell migration while knockdown of hsa-let-7e-5p
suppresses migration
To investigate the potential mechanism of
hsa-let-7e-5p in promoting RC progression, Caco-2 cells were
transfected with pCDN3.1-EGFP-pre-hsa-let-7e-5p or
pCDN3.1-EGFP-hsa-let-7e-5p-sponge plasmids, to determine the effect
of hsa-let-7e-5p on cell growth in vitro (Fig. 3A). Elevated hsa-let-7e-5p levels
resulted in increased cellular migration in culture, whereas
inhibition of hsa-let-7e-5p expression significantly suppressed
tumor cell mobility (Fig. 3B). Stable
expression of pre-hsa-let-7e-5p or hsa-let-7e-5p-sponge was
confirmed by the presence of a GFP signal (Fig. 3C). These results indicated that
hsa-let-7e-5p stimulated colorectal cancer cell spreading,
indicating that it had a potential role in cancer metastasis.
Discussion
A number of studies have demonstrated that miRNAs
serve notable roles in tumor invasion and metastases (5,13,14,40,41). In
the present study, miRNA profiles of primary focal tumor tissues
from two patients with HHM RC and two patients with NM RC were
compared. Using high-throughput sequencing, a small number of
differentially expressed miRNAs were identified. Expression of
hsa-let-7e-5p was markedly upregulated in HHM RC. Subsequent
assessment of the expression of hsa-let-7e-5p target genes
implicated that it may be a prognostic biomarker for RC with HHM.
However, the small number of sequenced specimens (n=4) is a
limitation, and therefore the present data are largely descriptive
and should be evaluated in a higher number of cases.
Conversely, the role of hsa-let-7 in cancer
development has been controversial. For example, certain studies
have demonstrated that let-7f inhibits tumor invasion and
metastasis in human gastric cancer, whereas let-7a, let7b and
let-7g suppress breast cancer cell migration and invasion (40,42). On
the contrary, a previous study indicated that the let-7 miRNA
family is secreted from a metastatic gastric cancer cell line into
the extracellular environment (43).
In addition, a novel let-7-regulated transcriptional factor,
transcription regulator factor BACH1, induces the expression of
matrix metalloproteinase 1 and promotes metastasis in breast cancer
(44).
In the present study, MYC was identified as a target
of let-7e that may participate in HHM RC. In previous studies,
elevation of MYC has been detected in a variety of human tumors
(45–47). Overexpression of MYC may transform
cells in culture and elicit malignant tumors in experimental
animals (48). However, certain
previous studies provided paradoxical data; that this powerful
oncogene may also act as a suppressor of cell motility,
invasiveness and metastases (33).
MYC may suppress metastasis by directly silencing the transcription
of integrin proteins (33). These
data uncovered an unexpected function of MYC, which provides an
explanation for the current controversy on the role of MYC in
metastasis (33). In the present
study, MYC was downregulated in the HHM RC, indicating a
metastasis-suppressing role for MYC.
c-Kit is an additional notable let-7e target that
may participate in HHM RC. c-Kit expression is suppressed in colon
cancer tissues, contributing to L1-mediated metastases (34). The L1 is a transmembrane neural cell
adhesion receptor in human colorectal cancer and promotes liver
metastases (34). Although c-Kit
upregulation inhibits the metastases of L1-expressing colorectal
cancer cells, it also enhances colorectal cancer cell tumorigenesis
and proliferation, which indicates that c-Kit may mediate separate
pathways in metastases (34).
By contrast, other let-7e candidate targets
identified in the present study were demonstrated to inhibit cancer
metastasis. For example, cyclin-dependent kinase inhibitor 1B
suppresses the growth, migration and metastasis of mouse embryonic
fibroblasts and human bladder cancer cells, processes that are
mediated by Janus kinase/c-Jun inhibition (49). Clinical analysis of invasive human
breast cancer revealed a marked correlation between PPARGC1A
expression in invasive cancer cells and the formation of distant
metastases (50). The silencing of
PPARGC1A in cancer cells suspended their invasive potential and
attenuated metastasis (50). Although
specific data from these previous studies have established that the
increase of certain let-7e candidate targets may be promotion
signals for cancer metastasis, these genes may also have opposite
functions in other contexts.
In summary, it was demonstrated that hsa-let-7e-5p
was differentially expressed in primary tumor tissues of RC with
heterochrony hepatic metastases (HHM). Furthermore, hsa-let-7e-5p
may be used as a prognostic marker to identify patients with RC who
may be at risk of metastases.
Acknowledgements
The authors would like to thank Dr Jin Gu (Peking
University School of Oncology, Beijing, China) for advice and a
critical reading of the manuscript, and the Department of
Colorectal Surgery, Peking University School of Oncology, Beijing
Institute for Cancer Research, Beijing Cancer Hospital (Beijing,
China) for the original sample collection and the use of these
samples in the present study.
Funding
The present study was supported by the National
Nature Science Foundation of China (grant no. 81172380), the
Special Project on the Integration of Industry and Education of
Fujian Province (grant no. 2010Y4006), the National Natural Science
Foundation of China (grant no. 31601894), the Startup Funds from
Fuzhou University (grant no. XRC1463), the Education and Scientific
Research Projects of Young Teachers in Fujian Province (grant no.
JAT160071), the Fujian Natural Science Foundation (grant. no.
2017J0106).
Availability of data and materials
The datasets generated and analyzed in the present
study are included in this published article and are available from
the corresponding author upon request.
Authors' contributions
YZ and YuY conceived the project and supervised the
experiments. WC, GL, HS, XWa, QY, XWe, LS, FC, and SY performed
sample collection, RNA extraction and qPCR. WC, YiY and JC
performed cell studies. WC, GL, YuY and YZ performed data analysis
and wrote the manuscript, with contributions from the other
authors.
Ethics approval and consent to
participate
The present study was approved by the Medical Ethics
Committee of Peking University School of Oncology. Written informed
content was obtained from all patients.
Consent for publication
Written informed content was obtained from all
patients prior to enrollment in the present study.
Competing interests
The authors declare that they have no competing
interests.
References
|
1
|
Siegel R, Naishadham D and Jemal A: Cancer
statistics, 2012. CA Cancer J Clin. 62:10–29. 2012. View Article : Google Scholar : PubMed/NCBI
|
|
2
|
Jemal A, Siegel R, Xu J and Ward E: Cancer
statistics, 2010. CA Cancer J Clin. 60:277–300. 2010. View Article : Google Scholar : PubMed/NCBI
|
|
3
|
Stangl R, Altendorf-Hofmann A, Charnley RM
and Scheele J: Factors influencing the natural history of
colorectal liver metastases. Lancet. 343:1405–1410. 1994.
View Article : Google Scholar : PubMed/NCBI
|
|
4
|
Geramizadeh B and Robertson S: Serrated
polyps of colon and rectum: A clinicopathologic review. J
Gastrointest Cancer. 48:291–298. 2017. View Article : Google Scholar : PubMed/NCBI
|
|
5
|
Ji D, Chen Z, Li M, Zhan T, Yao Y, Zhang
Z, Xi J, Yan L and Gu J: MicroRNA-181a promotes tumor growth and
liver metastasis in colorectal cancer by targeting the tumor
suppressor WIF-1. Mol Cancer. 13:862014. View Article : Google Scholar : PubMed/NCBI
|
|
6
|
Manfredi S, Lepage C, Hatem C, Coatmeur O,
Faivre J and Bouvier AM: Epidemiology and management of liver
metastases from colorectal cancer. Ann Surg. 244:254–259. 2006.
View Article : Google Scholar : PubMed/NCBI
|
|
7
|
Sobhani I, Tap J, Roudot-Thoraval F,
Roperch JP, Letulle S, Langella P, Corthier G, Van Nhieu Tran J and
Furet JP: Microbial dysbiosis in colorectal cancer (CRC) patients.
PLoS One. 6:e163932011. View Article : Google Scholar : PubMed/NCBI
|
|
8
|
Hu T, Weng S, Tang W, Xue R, Chen S, Cai
G, Cai Y, Shen X, Zhang S and Dong L: Overexpression of BIRC6 is a
predictor of prognosis for colorectal cancer. PLoS One.
10:e01252812015. View Article : Google Scholar : PubMed/NCBI
|
|
9
|
Du T and Zamore PD: microPrimer: The
biogenesis and function of microRNA. Development. 132:4645–4652.
2005. View Article : Google Scholar : PubMed/NCBI
|
|
10
|
Shukla GC, Singh J and Barik S: MicroRNAs:
Processing, maturation, target recognition and regulatory
functions. Mol Cell Pharmacol. 3:83–92. 2011.PubMed/NCBI
|
|
11
|
Lai EC: Micro RNAs are complementary to 3′
UTR sequence motifs that mediate negative post-transcriptional
regulation. Nat Genet. 30:363–364. 2002. View Article : Google Scholar : PubMed/NCBI
|
|
12
|
Liu H, Du L, Wen Z, Yang Y, Li J, Wang L,
Zhang X, Liu Y, Dong Z, Li W, et al: Up-regulation of miR-182
expression in colorectal cancer tissues and its prognostic value.
Int J Colorectal Dis. 28:697–703. 2013. View Article : Google Scholar : PubMed/NCBI
|
|
13
|
Shivapurkar N, Mikhail S, Navarro R, Bai
W, Marshall J, Hwang J, Pishvaian M, Wellstein A and He AR:
Decrease in blood miR-296 predicts chemotherapy resistance and poor
clinical outcome in patients receiving systemic chemotherapy for
metastatic colon cancer. Int J Colorectal Dis. 28:8872013.
View Article : Google Scholar : PubMed/NCBI
|
|
14
|
Zhou T, Zhang G, Liu Z, Xia S and Tian H:
Overexpression of miR-92a correlates with tumor metastasis and poor
prognosis in patients with colorectal cancer. Int J Colorectal Dis.
28:19–24. 2013. View Article : Google Scholar : PubMed/NCBI
|
|
15
|
Rotelli MT, Di Lena M, Cavallini A,
Lippolis C, Bonfrate L, Chetta N, Portincasa P and Altomare DF:
Fecal microRNA profile in patients with colorectal carcinoma before
and after curative surgery. Int J Colorectal Dis. 30:891–898. 2015.
View Article : Google Scholar : PubMed/NCBI
|
|
16
|
Jr CMT, Beauchamp RD, Evers BM and Mattox
KL: Sabiston Textbook of Surgery: The Biological Basis of Modern
Surgical Practice. 18th edition. Saunders; 2008
|
|
17
|
Benson AB III, Venook AP, Bekaii-Saab T,
Chan E, Chen YJ, Cooper HS, Engstrom PF, Enzinger PC, Fenton MJ,
Grem JL, et al: Rectal cancer, version 2.2015. J Natl Compr Canc
Netw. 13:719–728. 2015. View Article : Google Scholar : PubMed/NCBI
|
|
18
|
Zhou YJ, Xie YT, Gu J, Yan L, Guan GX and
Liu X: Overexpression of cyclin E isoforms correlates with poor
prognosis in rectal cancer. Eur J Surg Oncol. 37:1078–1084. 2011.
View Article : Google Scholar : PubMed/NCBI
|
|
19
|
Edge SB and Compton CC: The american joint
committee on cancer: The 7th edition of the AJCC cancer staging
manual and the future of TNM. Ann Surg Oncol. 17:1471–1474. 2010.
View Article : Google Scholar : PubMed/NCBI
|
|
20
|
Tapan U, Ozbayrak M and Tatli S: MRI in
local staging of rectal cancer: An update. Diagn Interv Radiol.
20:390–398. 2014. View Article : Google Scholar : PubMed/NCBI
|
|
21
|
Cai X, Liu G, Lu Y and Yin W: Accuracy of
endoscopic ultrasound in the preoperative staging and the guidance
of transanal endoscopic microsurgery for rectal cancer. Zhonghua
Wei Chang Wai Ke Za Zhi. 18:487–490. 2015.(In Chinese). PubMed/NCBI
|
|
22
|
Kwak Y, Lee HE, Kim WH, Kim DW, Kang SB
and Lee HS: The clinical implication of cancer-associated
microvasculature and fibroblast in advanced colorectal cancer
patients with synchronous or metachronous metastases. PLoS One.
9:e918112014. View Article : Google Scholar : PubMed/NCBI
|
|
23
|
Engstrom PF, Arnoletti JP, Benson AB III,
Chen YJ, Choti MA, Cooper HS, Covey A, Dilawari RA, Early DS,
Enzinger PC, et al: NCCN clinical practice guidelines in oncology:
Rectal cancer. J Natl Compr Canc Netw. 7:838–881. 2009. View Article : Google Scholar : PubMed/NCBI
|
|
24
|
Fuchs RT, Sun Z, Zhuang F and Robb GB:
Bias in ligation-based small RNA sequencing library construction is
determined by adaptor and RNA structure. PLoS One. 10:e01260492015.
View Article : Google Scholar : PubMed/NCBI
|
|
25
|
Liu F, Peng W, Li Z, Li W, Li L, Pan J,
Zhang S, Miao Y, Chen S and Su S: Next-generation small RNA
sequencing for microRNAs profiling in Apis mellifera: Comparison
between nurses and foragers. Insect Mol Biol. 21:297–303. 2012.
View Article : Google Scholar : PubMed/NCBI
|
|
26
|
Li R, Yu C, Li Y, Lam TW, Yiu SM,
Kristiansen K and Wang J: SOAP2: An improved ultrafast tool for
short read alignment. Bioinformatics. 25:1966–1967. 2009.
View Article : Google Scholar : PubMed/NCBI
|
|
27
|
Audic S and Claverie JM: The significance
of digital gene expression profiles. Genome Res. 7:986–995. 1997.
View Article : Google Scholar : PubMed/NCBI
|
|
28
|
Livak KJ and Schmittgen TD: Analysis of
relative gene expression data using real-time quantitative PCR and
the 2(-Delta Delta C(T)) method. Methods. 25:402–408. 2001.
View Article : Google Scholar : PubMed/NCBI
|
|
29
|
Ye J, Fang L, Zheng H, Zhang Y, Chen J,
Zhang Z and Wang J, Li S, Li R, Bolund L and Wang J: WEGO: A web
tool for plotting GO annotations. Nucleic Acids Res. 34:(Web Server
Issue). W293–W297. 2006. View Article : Google Scholar : PubMed/NCBI
|
|
30
|
Kanehisa M, Araki M, Goto S, Hattori M,
Hirakawa M, Itoh M, Katayama T, Kawashima S, Okuda S, Tokimatsu T
and Yamanishi Y: KEGG for linking genomes to life and the
environment. Nucleic Acids Res. 36:(Database Issue). D480–D484.
2008. View Article : Google Scholar : PubMed/NCBI
|
|
31
|
Dweep H, Sticht C, Pandey P and Gretz N:
miRWalk-database: Prediction of possible miRNA binding sites by
‘walking‘ the genes of three genomes. J Biomed Inform. 44:839–847.
2011. View Article : Google Scholar : PubMed/NCBI
|
|
32
|
Dweep H, Gretz N and Sticht C: miRWalk
database for miRNA-target interactions. Methods Mol Biol.
1182:289–305. 2014. View Article : Google Scholar : PubMed/NCBI
|
|
33
|
Liu H, Radisky DC, Yang D, Xu R, Radisky
ES, Bissell MJ and Bishop JM: MYC suppresses cancer metastasis by
direct transcriptional silencing of αv and β3 integrin subunits.
Nat Cell Biol. 14:567–574. 2012. View Article : Google Scholar : PubMed/NCBI
|
|
34
|
Gavert N, Shvab A, Sheffer M, Ben-Shmuel
A, Haase G, Bakos E, Domany E and Ben-Ze'ev A: c-Kit is suppressed
in human colon cancer tissue and contributes to L1-mediated
metastasis. Cancer Res. 73:5754–5763. 2013. View Article : Google Scholar : PubMed/NCBI
|
|
35
|
Aytes A, Mitrofanova A, Kinkade CW,
Lefebvre C, Lei M, Phelan V, LeKaye HC, Koutcher JA, Cardiff RD,
Califano A, et al: ETV4 promotes metastasis in response to
activation of PI3-kinase and Ras signaling in a mouse model of
advanced prostate cancer. Proc Natl Acad Sci USA. 110:E3506–E3515.
2013. View Article : Google Scholar : PubMed/NCBI
|
|
36
|
Zhang Y, Pu X, Shi M, Chen L, Song Y, Qian
L, Yuan G, Zhang H, Yu M, Hu M, et al: Critical role of c-Jun
overexpression in liver metastasis of human breast cancer xenograft
model. BMC Cancer. 7:1452007. View Article : Google Scholar : PubMed/NCBI
|
|
37
|
Ness TL, Ewing JL, Hogaboam CM and Kunkel
SL: CCR4 is a key modulator of innate immune responses. J Immunol.
177:7531–7539. 2006. View Article : Google Scholar : PubMed/NCBI
|
|
38
|
Elgueta R, Benson MJ, de Vries VC, Wasiuk
A, Guo Y and Noelle RJ: Molecular mechanism and function of
CD40/CD40L engagement in the immune system. Immunol Rev.
229:152–172. 2009. View Article : Google Scholar : PubMed/NCBI
|
|
39
|
Liang H and Ward WF: PGC-1alpha: A key
regulator of energy metabolism. Adv Physiol Educ. 30:145–151. 2006.
View Article : Google Scholar : PubMed/NCBI
|
|
40
|
Kim SJ, Shin JY, Lee KD, Bae YK, Sung KW,
Nam SJ and Chun KH: MicroRNA let-7a suppresses breast cancer cell
migration and invasion through downregulation of C-C chemokine
receptor type 7. Breast Cancer Res. 14:R142012. View Article : Google Scholar : PubMed/NCBI
|
|
41
|
Liang S, He L, Zhao X, Miao Y, Gu Y, Guo
C, Xue Z, Dou W, Hu F, Wu K, et al: MicroRNA let-7f inhibits tumor
invasion and metastasis by targeting MYH9 in human gastric cancer.
PLoS One. 6:e184092011. View Article : Google Scholar : PubMed/NCBI
|
|
42
|
Hu X, Guo J, Zheng L, Li C, Zheng TM,
Tanyi JL, Liang S, Benedetto C, Mitidieri M, Katsaros D, et al: The
heterochronic microRNA let-7 inhibits cell motility by regulating
the genes in the actin cytoskeleton pathway in breast cancer. Mol
Cancer Res. 11:240–250. 2013. View Article : Google Scholar : PubMed/NCBI
|
|
43
|
Ohshima K, Inoue K, Fujiwara A, Hatakeyama
K, Kanto K, Watanabe Y, Muramatsu K, Fukuda Y, Ogura S, Yamaguchi K
and Mochizuki T: Let-7 microRNA family is selectively secreted into
the extracellular environment via exosomes in a metastatic gastric
cancer cell line. PLoS One. 5:e132472010. View Article : Google Scholar : PubMed/NCBI
|
|
44
|
Yun J, Frankenberger CA, Kuo WL, Boelens
MC, Eves EM, Cheng N, Liang H, Li WH, Ishwaran H, Minn AJ and
Rosner MR: Signalling pathway for RKIP and Let-7 regulates and
predicts metastatic breast cancer. EMBO J. 30:4500–4514. 2011.
View Article : Google Scholar : PubMed/NCBI
|
|
45
|
Meyer N and Penn LZ: Reflecting on 25
years with MYC. Nat Rev Cancer. 8:976–990. 2008. View Article : Google Scholar : PubMed/NCBI
|
|
46
|
Nesbit CE, Tersak JM and Prochownik EV:
MYC oncogenes and human neoplastic disease. Oncogene. 18:3004–3016.
1999. View Article : Google Scholar : PubMed/NCBI
|
|
47
|
Liao DJ and Dickson RB: c-Myc in breast
cancer. Endocr Relat Cancer. 7:143–164. 2000. View Article : Google Scholar : PubMed/NCBI
|
|
48
|
Adhikary S and Eilers M: Transcriptional
regulation and transformation by Myc proteins. Nat Rev Mol Cell
Biol. 6:635–645. 2005. View Article : Google Scholar : PubMed/NCBI
|
|
49
|
Fang Y, Wang Y, Wang Y, Meng Y, Zhu J, Jin
H, Li J, Zhang D, Yu Y, Wu XR and Huang C: A new tumour suppression
mechanism by p27Kip1: EGFR down-regulation mediated by JNK/c-Jun
pathway inhibition. Biochem J. 463:383–392. 2014. View Article : Google Scholar : PubMed/NCBI
|
|
50
|
LeBleu VS, O'Connell JT, Herrera Gonzalez
KN, Wikman H, Pantel K, Haigis MC, de Carvalho FM, Damascena A,
Chinen Domingos LT, Rocha RM, et al: PGC-1α mediates mitochondrial
biogenesis and oxidative phosphorylation in cancer cells to promote
metastasis. Nat Cell Biol. 16(992–1003): 1–15. 2014.
|