Introduction
Thyroid cancer accounts for ~1% of all malignancies
globally in 2003, including papillary thyroid carcinoma (PTC),
follicular thyroid carcinoma, poorly differentiated thyroid
carcinoma, medullary thyroid carcinoma and anaplastic thyroid
carcinoma (1). Of these, PTC is the
most common type of thyroid cancer (2). Furthermore, the Chinese Cancer Registry
reported that the incidence of thyroid carcinoma is 6.6 out of
100,000 individuals in China in 2011 (3). Of all patients with thyroid carcinoma,
80% have PTC, which is named for its papillary histological
architecture in 2011 (4). Thyroid
cancer therapy is based on surgery followed by iodine-131 treatment
to avoid potential tumor remnants and metastases.
Clinicopathological factors including age, sex, tumor size and
lymphadenopathy are risk factors of PTC progression (5). Lymph node metastasis is common in
patients with PTC, and it has been identified in 20–50% of patients
prior to the initial treatment of PTC (6). Therefore, further research into the
pathogenesis of and therapeutic biomarkers for PTC diagnosis and
treatment is worthwhile.
Adaptive immunity, based on its enormous diversity
of BCRs and TCRs, may essentially provide acute and long-term
protection against a limitless array of pathogenic hazards
(7). The immune repertoire is mainly
composed of BCRs and TCRs in the process of the dynamic adaptive
immune system (7).
BCRs and TCRs are composed of two heavy chains and
two light chains. Heavy chains comprise a variable region (V
region), a constant region (C region), a transmembrane region and a
cytoplasmic domain, whilst light chains only have variable regions
and constant regions. V regions are composed of two domains [heavy
chains (VH) and light chains (VL) for BCRs, and primarily α/β and
rarely γ/δ for TCRs], which consists of three complementarity
determining regions (CDR1, CDR2 and CDR3) (7). During B and T lymphocytes development,
variable antigen receptor gene segments [Variable (V), Diversity
(D) and Joining (J)] are rearranged through targeted DNA
recombination events. This method contributes notably to BCR and
TCR specificities which are different in the length of their amino
acid sequences (6,7). In total, the diversity established
through these molecular mechanisms is substantial, with the
estimated theoretical numbers of distinct BCRs and TCRs exceeding
1013 and 1018, respectively (7).
Structural differences between each type of specific
immune protein are minimal in an immune repertoire (7). Whilst there are numerous different
subtypes, this diversity serves a vital function in the maintenance
of health. The more the subtypes of specific immune protein exist,
the more effective a response against any pathogen. Conversely, the
fewer subtypes there are, the more an individual is susceptible to
disease (8). In addition, age,
environment, drug-induced diseases and multiple other factors also
affect the diversity of the immune repertoire (6). The CDR3 region of BCR and TCR is the
major recognition site of tumor antigens (1,7);
therefore, it may recognize a unique clone type, which represents
the disease. Therefore, the clonal diversity of lymphocytes may be
judged by detecting the length of CDR3 (7). Based on this, through the study of
specific BCR and TCR repertoires in patients with PTC by high
throughput sequencing (HTS), degree of cloning and specificity may
help to explore B- and T-cells in the occurrence and development of
PTC.
HTS, which is alternatively called second-generation
sequencing (next generation sequencing), has notably influenced
research potential in immunology (9).
It is a massive parallel sequencing technology. The cost of HTS has
been reduced by producing a large number of short sequences in
order to provide a high-throughput read of multiple orders of
magnitude (8). HTS technology has
revolutionized genomics and genetic research. Illumina released a
lower throughput fast-turnaround instrument in 2011, the MiSeq,
which was aimed at smaller laboratories and the clinical diagnostic
market (9). Sequencing of the whole
immune repertoire has become feasible and affordable (8). The existing sequencing with Illumina
technology allows 2×150 base pairs to be run every 24 h and 2×250
base pairs to be run every 35 h using the MiSeq platform. This
technology is widely used in small and medium-sized genome
research, including influenza virus, human immunodeficiency virus
drug resistance testing, acute myeloid leukemia and inherited
cardiac disease (data from BGI). As HTS accounted for >2/3 of
the market share, and is supported by a majority of third-party
software (10), the widespread
application of HTS technology in cancer genomics research will
provide novel insights into determining the clonal association in
patients with PTC.
Materials and methods
Patients and controls
Samples of PTC tissues and the corresponding
pericarcinoma tissues were collected from 5 patients with PTC from
the Shenzhen People's Hospital (Shenzhen, China) between April and
October in 2015. The 5 patients were diagnosed with PTC; 3 were
males and 2 females, with a mean age of 35.6 years (range, 24–43
years). The 5 pericarcinoma tissues were matched with the 5 PTC
tissues. Immediately following resection, the surgical specimens
were analyzed by a pathologist. Preoperative cytology was combined
with immunohistochemical diagnosis and postoperatively embedded in
paraffin once frozen. The diagnosis of PTC was confirmed by
pathological diagnosis and clinical evidence.
Written informed consent for participation in the
present study was obtained from all subjects. The present study was
approved by the Ethics Committee of Shenzhen People's Hospital and
abided by the Helsinki Declaration for medical research involving
human subjects.
DNA extraction and mix
DNA was extracted by standard methods, as follows.
Dewaxing was performed using xylene and followed by overnight
proteinase K (Sigma-Aldrich; Merck KGaA, Darmstadt, Germany)
digestion at 65°C for pathological paraffin sections. The total
genomic DNA samples were then extracted from pathological sections
of PTC and pericarcinoma tissues from 5 patients using a QIAamp DNA
Mini kit (Qiagen GmbH, Hilden, Germany) according to the
manufacturer's protocol. DNA quality was evaluated using 0.8%
agarose gel electrophoresis (120V) and staining with 0.5 µg/ml
ethidium bromide at 55°C for 20 min (Sigma-Aldrich; Merck KGaA) and
DNA concentration was quantified using a Qubit fluorometer (Thermo
Fisher Scientific, Inc., Waltham, MA, USA). The PTC tissue DNA
samples were mixed into one specimen according to a 1:1:1:1:1
proportion, named as the PTC sample; the pericarcinoma tissue DNA
samples were processed in the same manner, and named the PTC
pericarcinoma sample.
Multiplex-polymerase chain reaction
(PCR) amplification of the immunoglobulin heavy chain (IGH) and
T-cell receptor β chain (TRB) CDR3 region
The human IGH and TRB sequences were downloaded from
IMGT® (http://www.imgt.org/) (11). In general, the initial amount of
genomic DNA for one reaction was 500 ng (the lowest concentration
was not <35 ng/µl), and multiple PCR (30 cycles) were used to
amplify the rearranged IGH and TRB CDR3 region by QIAGEN multiplex
PCR kit (Qiagen GmbH) once specially designed forward and reverse
primers (included in the kit) of V and J region were added. Primers
were combined according to the adaptor sequence and specific gene
sequence. The PCR protocol was performed according to standard
procedure (12). The amplification
protocol was as follows: 15 min at 95°C, 30 cycles of 30 sec at
94°C, 30 sec at 59°C and 1 min at 72°C, followed by a final
extension cycle of 10 min at 72°C on a PCR Express thermal cycler
(Hybaid; Thermo Fisher Scientific, Inc.). The library was separated
on a 0.8% agarose gel, and the target fragments were isolated and
purified by QIAquick Gel Extraction kit (Qiagen GmbH) following the
enrichment of joint modification of DNA fragments.
HTS
DNA insert fragments in the library were tested
using the Agilent 2100 Bioanalyzer (Agilent 1000 Reagents; Agilent
Technologies, Inc., Santa Clara, CA, USA), and the concentration
was quantified using an ABI StepOnePlus Real-Time PCR System
(TaqMan Probe; Applied Biosystems; Thermo Fisher Scientific, Inc.).
The aforementioned library was qualified by NaOH according to the
protocol (Illumina, Inc., San Diego, CA, USA), diluted with
hybridization buffer HT1 (Illumina, Inc.) to a final dilution of 10
pm, then subjected to flowcell hybridization (15 min at 95°C, 30
cycles of 30 sec at 94°C, 30 sec at 59°C and 1 min at 72°C,
followed by a final extension cycle of 10 min at 72°C) and then
combined with TruSeq PE Cluster kit v3-cBot-HS reagent (Illumina,
Inc.) to complete bridge PCR amplification, according to the
manufacturer's protocol. Finally, the prepared flowcell was tested
using the MiSeq sequencing.
Data analysis
The raw data was filtered using adapter
contamination. The threshold average quality score was <15,
based on the Illumina 0–41 quality system (12), and a threshold for the proportion of N
bases was <5%. Bases with a low quality score (<10) were
trimmed; the quality score was expected to be >15 after trimming
and the remaining sequence length was expected to be >60 nt.
Subsequent to the above filtering conditions, the filtered clean
reads were obtained, and then the two sequences were joined into a
complete contig.
The analysis platform introduced by PCR has an
automated adjustment to errors and it may reveal IGH and TRB CDR3
cloning expression and indel distribution by sequencing. According
to the comparison analysis, the IGH and TRB V(D)J junction region,
in addition to the last position of the V gene, the start site of
the D gene, the end site of the D gene and the start site of the J
gene were completely rearranged to identify V(D)J insertion and
deletion bases and the length distribution. In brief, CDR3 region
and sequence length distribution were compared between PTC and
pericarcinous tissues.
According to the comparison analysis, the expression
of each clone, distinct DNA sequence amino acid sequence and the
combination of V-J were calculated. The diversity of the sample
with respect to each distinct clone and the Shannon entropy based
on distinct DNA, amino acids and V-J combination may be calculated
(13). The clone expression level of
each sample was also calculated at different resolutions of
distinct DNA sequence, amino acid sequence and V-J combination.
HECs in the present study refer to the CDR3 sequences whose
expression quantity were >0.5% of the total expression. In
general, if the CDR3 sequences of PTC tissues are higher compared
with corresponding pericarcinous tissues, it indicates the presence
of abnormal amplification CDR3 sequences in patients. Pearson's
correlation coefficient was conducted to assess the relevance of
IGHV-J and TRBV-J usage ratio between PTC and pericarcinoma
groups.
Results
Summary of sequencing
Using HTS, IGH and TRB repertoires sourced from B-
and T-lymphocytes collected from PTC and pericarcinous tissues from
5 patients were sequenced. A total of 486,007 and 745,353 BCR reads
were obtained from PTC and corresponding pericarcinoma tissues,
respectively. A total of 841,591 and 473,761 TCR reads were
additionally obtained from PTC and corresponding pericarcinoma
tissues, respectively. Following filtering, 292,683 and 341,209
total BCR CDR3 sequences were acquired from patients and
corresponding pericarcinoma tissues, respectively, and 561,607 and
335,334 total TCR CDR3 sequences were acquired from patients and
corresponding pericarcinoma tissues, respectively. There were
13,896 and 27,156 unique BCR CDR3 sequences identified at the
nucleotide level, which encoded 10,763 and 21,799 sequences at the
amino acid level from patients and corresponding pericarcinoma
tissues, respectively. Meanwhile, 17,612 and 20,410 unique TCR CDR3
sequences were obtained at the nucleotide level, which encoded
13,669 and 16,789 sequences at the amino acid level from patients
and corresponding pericarcinoma tissue, respectively (Table I).
 | Table I.BCR and TCR statistical data. |
Table I.
BCR and TCR statistical data.
|
| BCR | TCR |
|---|
|
|
|
|
|---|
| Sequence
numbers | PTC | Pericarcinoma | PTC | Pericarcinoma |
|---|
| Total reads
number | 486,007 | 745,353 | 841,591 | 473,761 |
| Immune sequences
number | 455,365 | 714,856 | 822,485 | 462,413 |
| Unknown sequences
number | 30,642 | 30,497 | 19,106 | 11,348 |
| Productive
sequences number | 386,246 | 613,972 | 579,158 | 343,331 |
| Nonproductive
sequences number | 69,119 | 100,884 | 243,327 | 119,082 |
| In-frame sequences
number | 403,093 | 636,692 | 600,620 | 359,473 |
| Out-of-frame
sequences number | 51,364 | 76,997 | 215,049 | 98,430 |
| Total CDR3
sequences number | 292,683 | 341,209 | 561,607 | 335,334 |
| Unique CDR3 nt
sequences number | 13,896 | 27,156 | 17,612 | 20,410 |
| Unique CDR3 aa
sequences number | 10,763 | 21,799 | 13,669 | 16,789 |
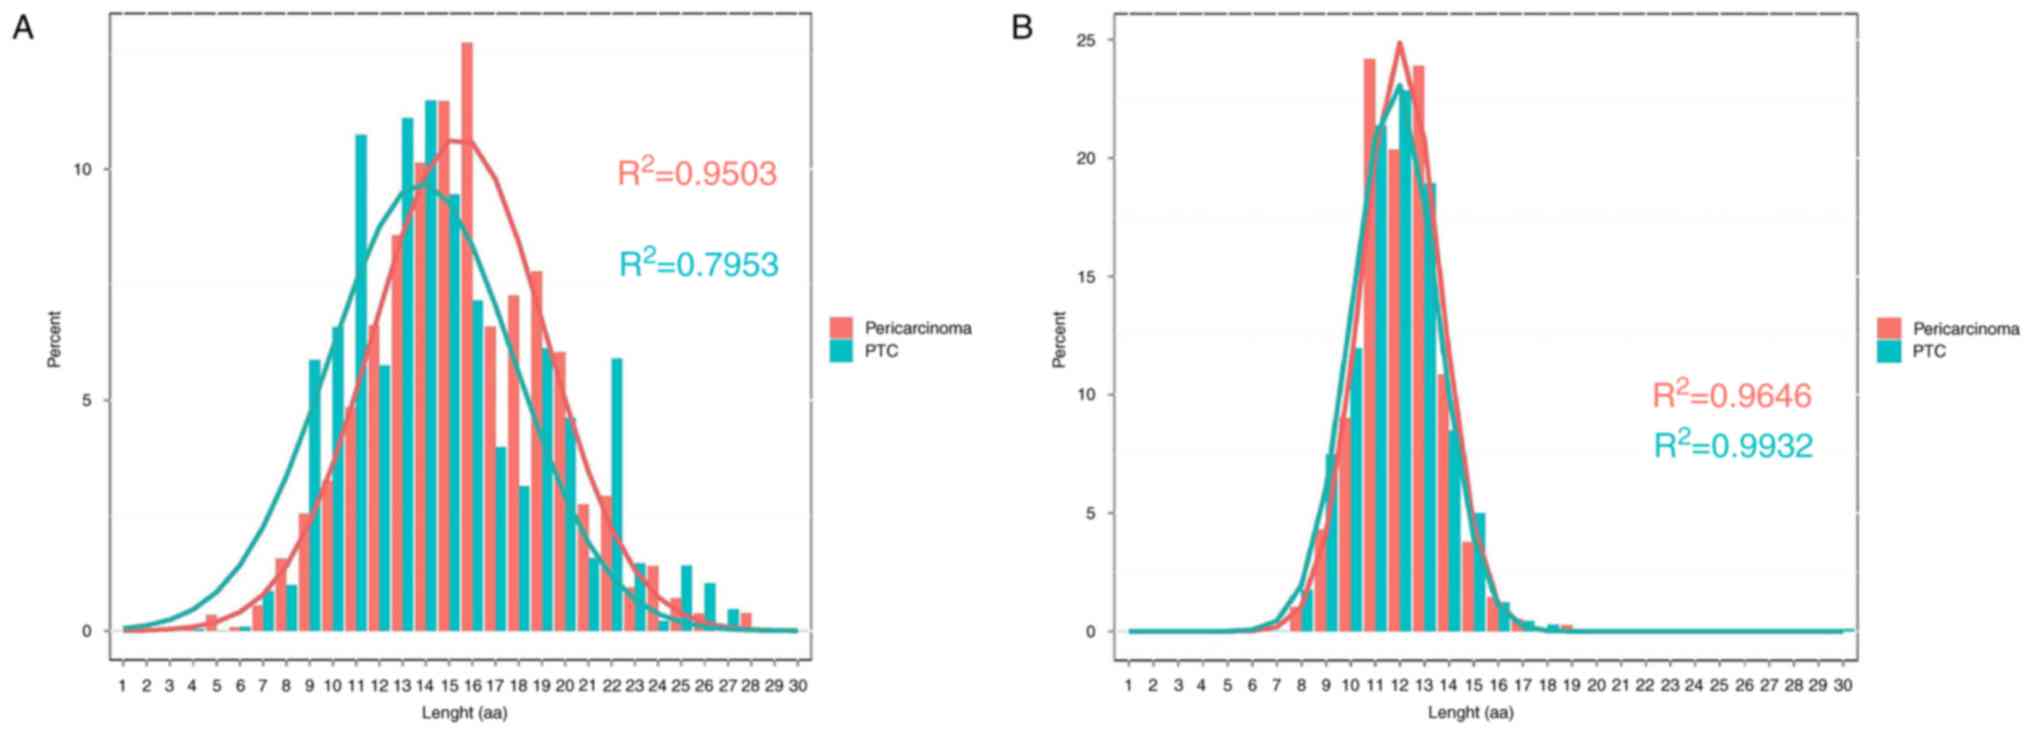
Distribution characteristics of CDR3
length
The length distributions of IGH appear to be
different between PTC (R2=0.7953) and pericarcinoma
(R2=0.9503) groups. In the two groups, the 3 most
frequently observed CDR3 lengths were 13, 14 and 15. The PTC group
has substantially skewed distribution whilst the paired
pericarcinoma group has mainly normal distribution (Fig. 1A). The difference of length
distributions of TRB between PTC (R2=0.9932) and
pericarcinoma (R2=0.9646) groups was minimal (Fig. 1B).
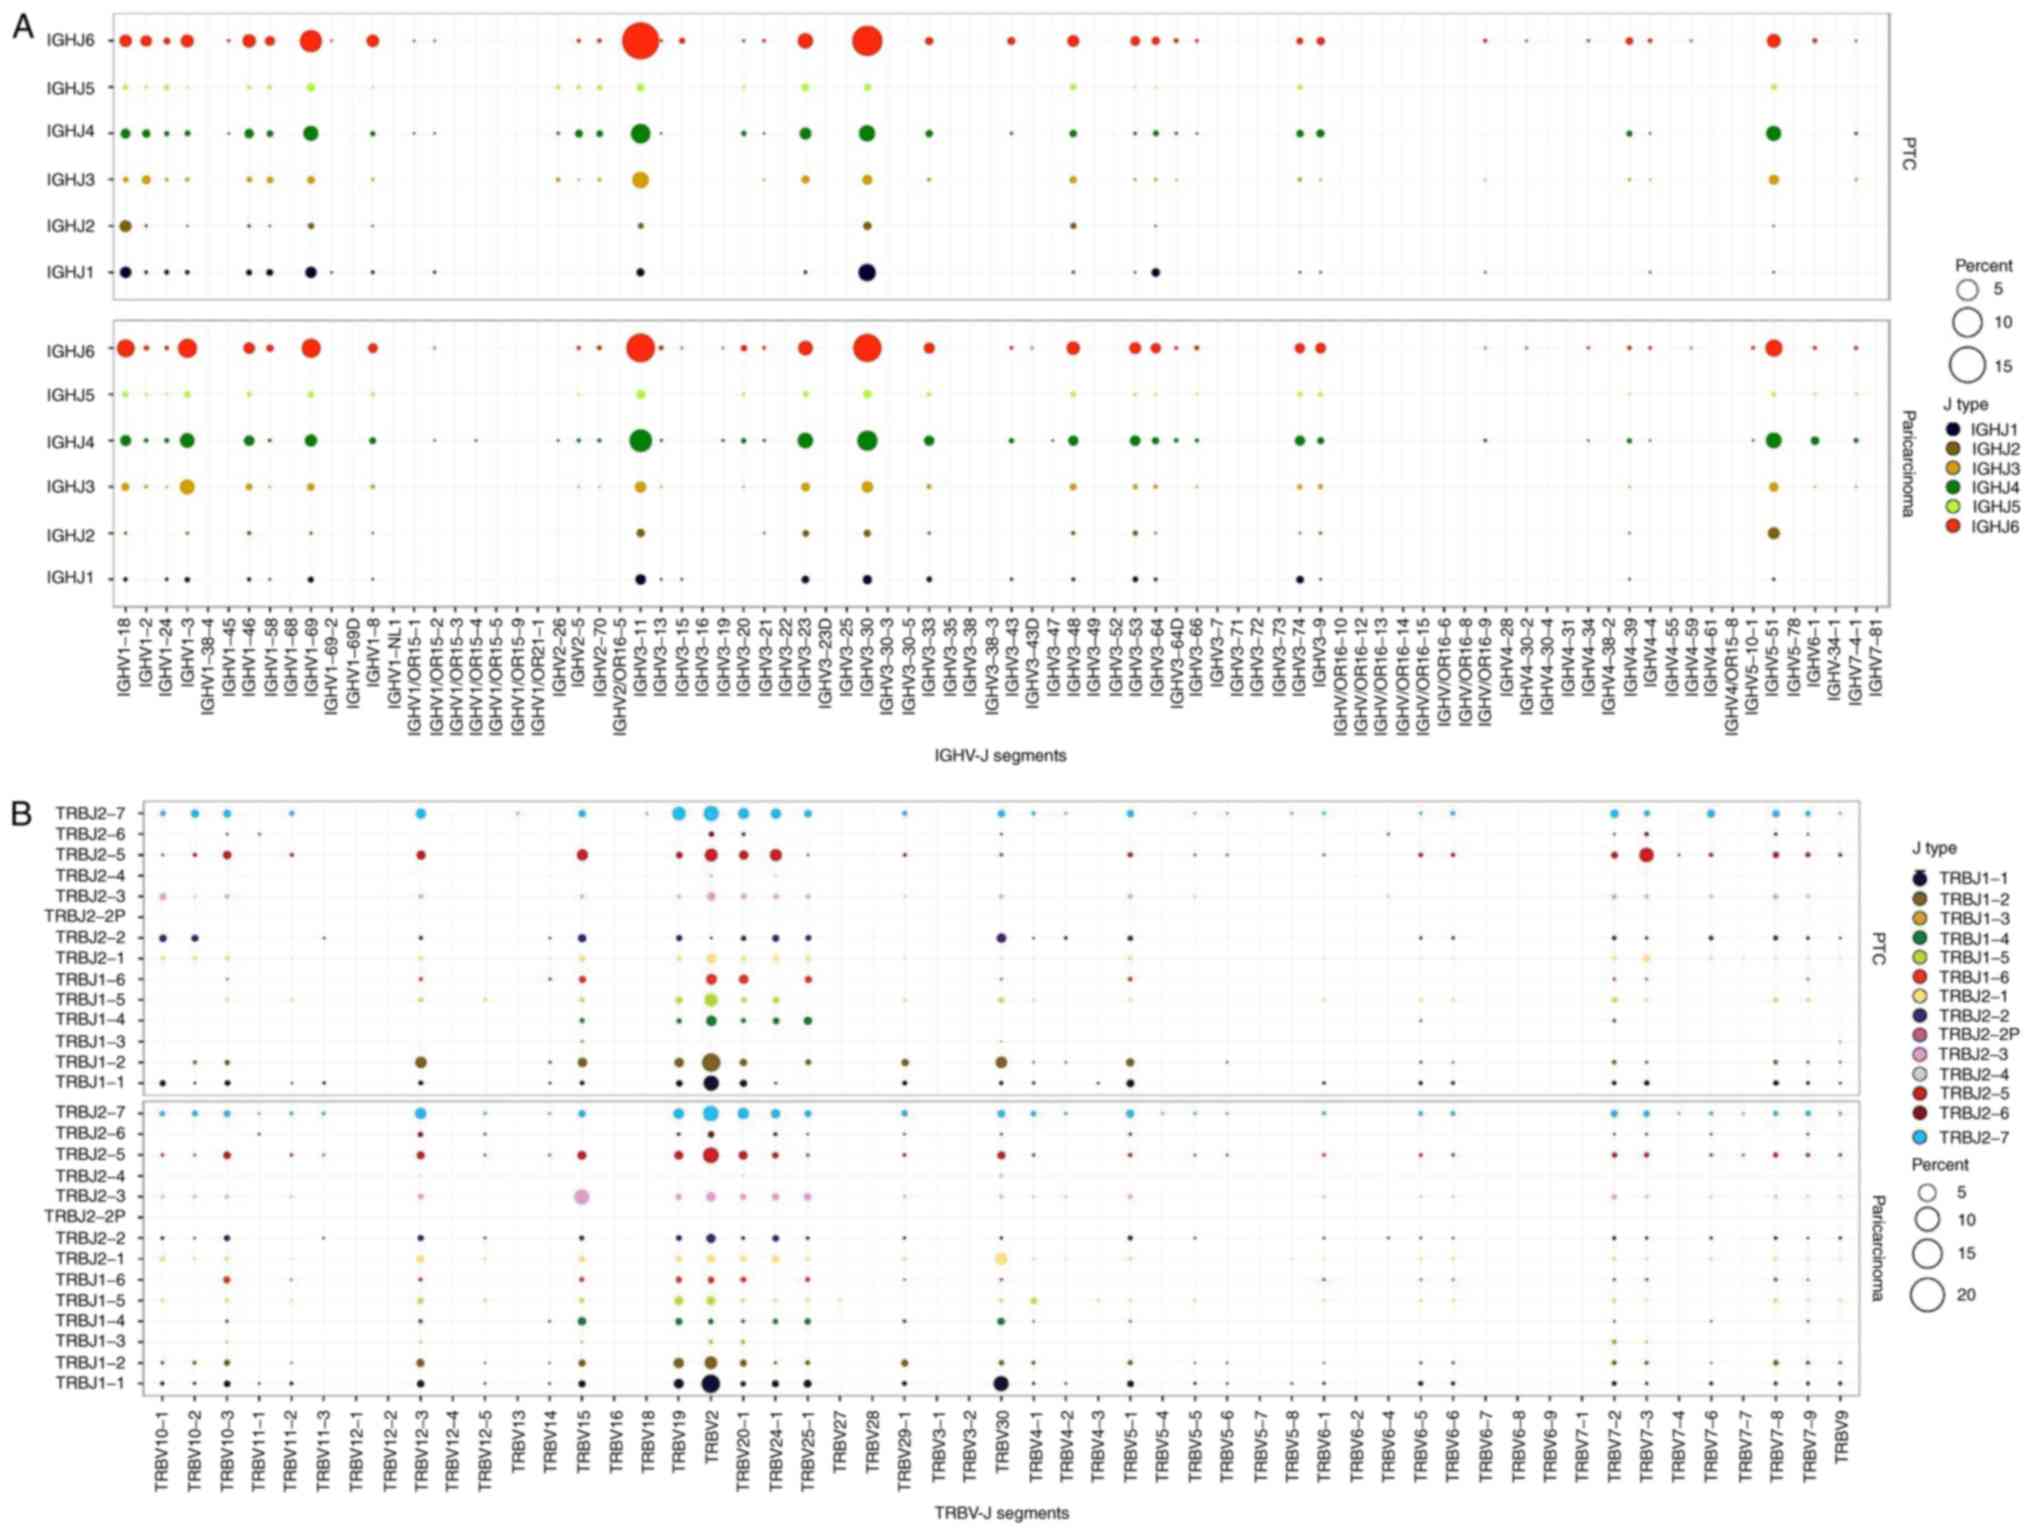
V(D)J region characteristics and V-J region gene
usage of IGH and TRB in patients. To explore the characteristics of
V(D)J region in patients with PTC, data was collected and compared
with the public database IMGT® (http://www.imgt.org/) (10). IGH and TRB CDR3 peptide sequences were
identified according to the characteristics of the V(D)J region.
Using HTS, 83 V genes, 37 D genes and 6 J genes of IGH CDR3
sequences were obtained. A total of 58 V genes, 2 D genes and 14 J
genes of TRB CDR3 sequences were obtained.
V-J gene usage frequency, which accurately reflects
the key features of CDR3 recognition specificity, also reveals
differences between two groups. A total of 275 IGHV-J pairings were
identified in PTC and pericarcinoma groups. The most frequent
pairing in PTC and pericarcinoma was IGHV3-11/IGHJ6 (Fig. 2A), which accounted for 15.51 and 9.12%
of total pairings, respectively. Pearson's correlation coefficient
of pairwise comparison between PTC and pericarcinoma groups of
IGHV-J usage ratio was 0.89 (data not shown). On the other hand,
there were 536 TRB V-J pairings existing in the two groups. The
most frequent pairing among them were TRBV2/TRBJ1-2 and
TRBV2/TRBJ1-1 (Fig. 2B) contributing
to 5.26 and 5.27% of total pairings, respectively. Pearson's
correlation coefficient of pairwise comparison between PTC and
pericarcinoma groups of TRBV-J usage ratio was 0.68 (data not
shown).
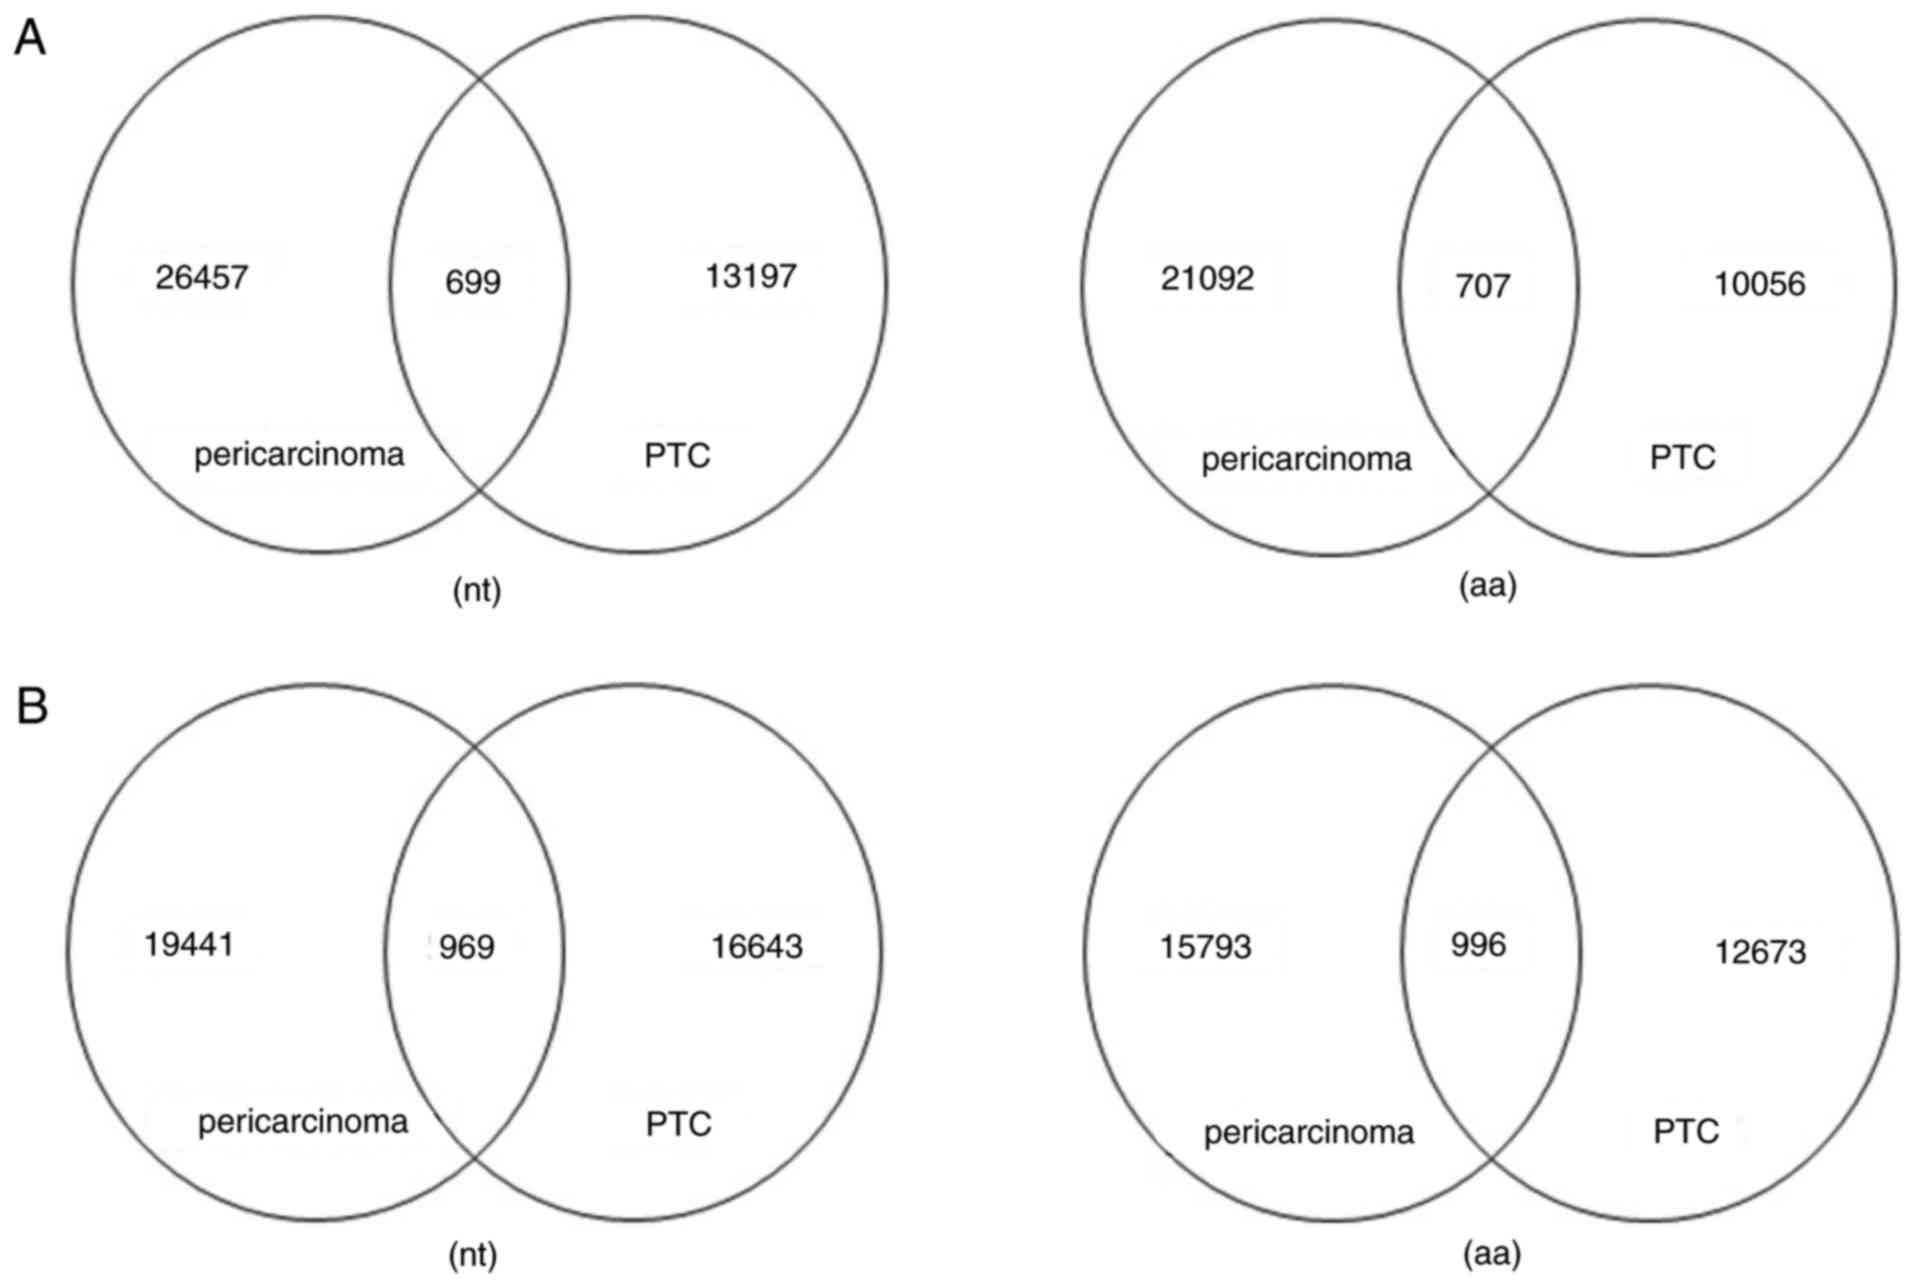
Analysis of shared sequence at the
nucleotide and amino acid level
Amino acid sequences of CDR3, which reveal the
function of the immune repertoire, may more accurately reflect the
specificity of the combination of lymphocyte and antigen compared
with the V(D)J gene. In order to explore the similarity of IGH and
TRB sequence libraries, a number of consensus sequences of each
paired sample between the two groups were identified. Common IGH
CDR3 sequences accounted for 5.03% at the nucleotide level and
6.57% at the amino acid level in PTC (Fig. 3A). The unique TRB nucleotide
clonotypes accounted for 5.50% at the nucleotide level and 7.29% at
the amino acid level in the PTC group (Fig. 3B). Overall, the common sequences of
the PTC group were higher than the matched surrounding tissue, the
extent of the common clonotype expressions of the amino acid was
slightly higher than the nucleotide level.
IGH and TRB CDR3 sequence diversity
and HECs Shannon entropy
Shannon entropy is a measure of immune diversity
that takes richness and evenness into account. The index is between
0.0 and 1.0. The closer to 1 the higher the immune diversity of the
individual, and the closer to zero the worse the immune diversity
of the individual (14). The immune
diversity of PTC tissues demonstrated a reduction compared with
pericarcinoma tissues (Table II).
The reduction of immune repertoire diversity is an important immune
system characteristic of patients with PTC. In the process of tumor
invasion, immune function is in a low state relative to normal
function.
| Table II.Diversity and highly expended clone
statistics. |
Table II.
Diversity and highly expended clone
statistics.
|
| BCR | TCR |
|---|
|
|
|
|
|---|
| Diversity
index | PTC | Pericarcinoma | PTC | Pericarcinoma |
|---|
| Highly expended
clone number all | 42 | 8 | 28 | 8 |
| Highly expended
clone ratio all | 0.499906042 | 0.08306639 | 0.224917068 | 0.138205491 |
| Shannon entropy
all | 0.46214436 | 0.58059448 | 0.492826469 | 0.577329276 |
Here, clones with a frequency of >0.5% of the
analyzed BCR and TCR sequences were defined as HECs. The number of
HECs in PTC was higher compared with that of the corresponding
pericarcinoma group.
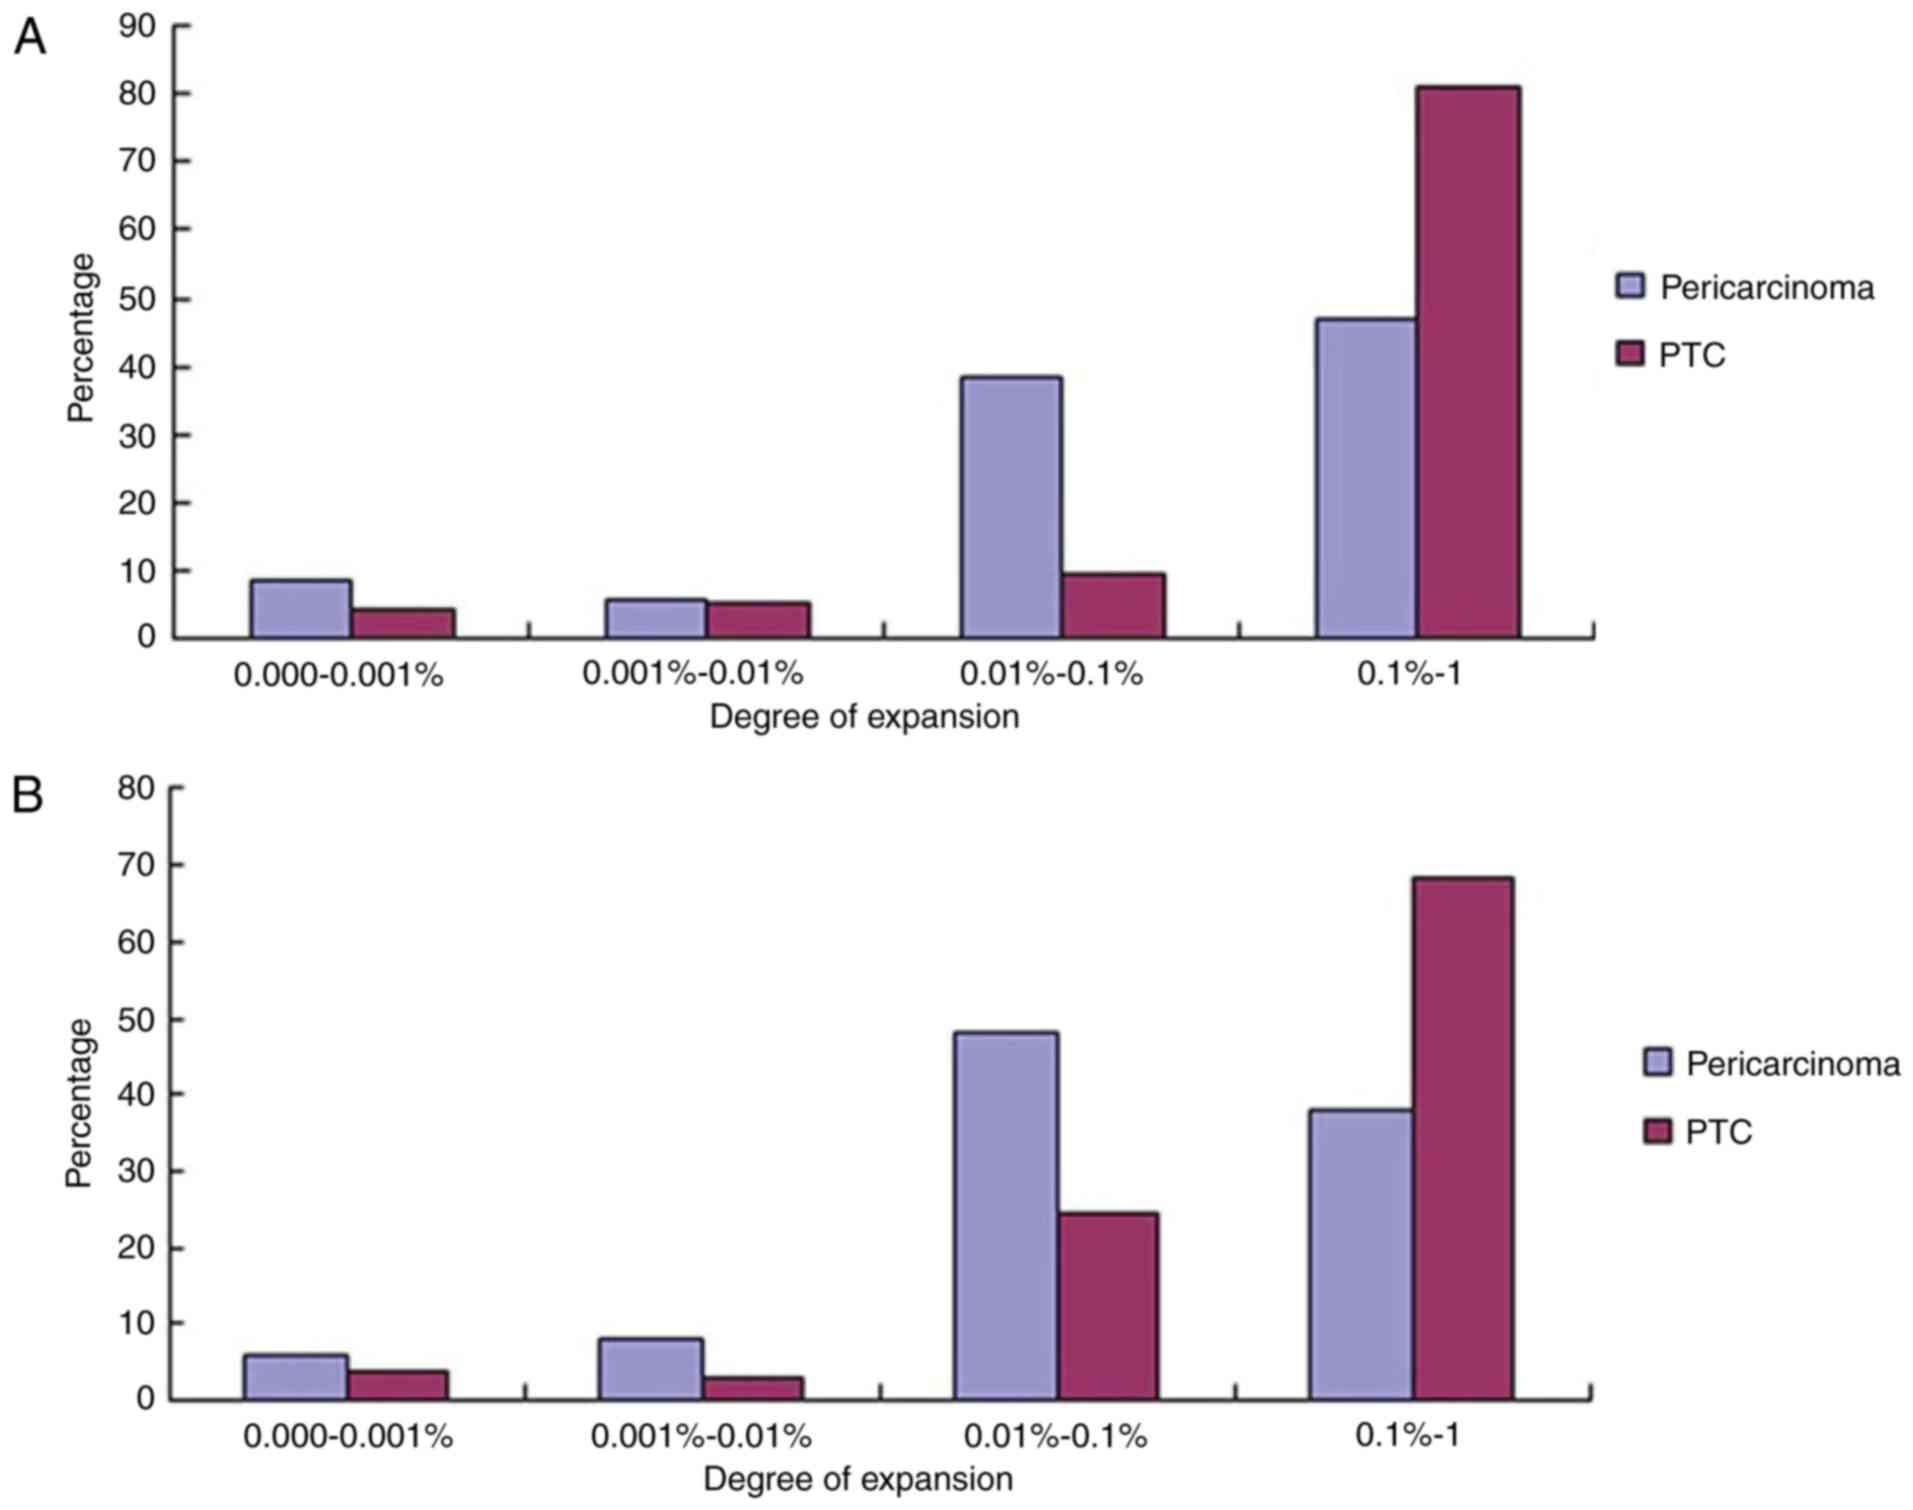
Comparison of the expression levels of
different clones and shared clones between PTC and
pericarcinoma
According to the aforementioned research results,
considering the diminishment of immune repertoire diversity may be
associated with the increase or decrease of a number of clonings,
the unique clonetype frequency distribution was then tested. All
the unique clonetype were divided into four different groups,
0.1–1.0, 0.01–0.10, 0.001–0.010 and 0.000–0.001%. The highest clone
frequency percentage of IGH was at a 0.1–1.0% degree of expansion,
and the unique cloning frequency distribution accounted for 80.92%
in PTC tissues, whilst it only contributed 47.14% in pericarcinoma
tissues (Fig. 4A). A total of 42 HECs
in PTC were obtained, but only 8 in pericarcinoma. The highest
clone frequency percentage of TRB was at a 0.1–1.0% degree of
expansion, and the unique cloning frequency distribution accounted
for 68.43% in PTC (Fig. 4B), whilst
it only contributed 38.00% in pericarcinoma. A total of 28 HECs
were obtained in PTC, but only 8 in pericarcinoma similar to the
HECs in IGH.
Whether in IGH or TRB CDR3 sequences, the numbers of
the expression cloning of HECs in PTC were increased compared with
pericarcinoma. Furthermore, as presented in Fig. 5, there was no shared clone of HECs in
the two groups either at the nucleotide or at the amino acid
expression level. There were 32 and 3 shared HECs of IGH CDR3
nucleotide sequences and 31 and 3 shared HECs of IGH CDR3 amino
acid sequences in PTC and pericarcinoma groups, respectively. There
were additionally 28 and 5 shared HECs of TRB CDR3 nucleotide
sequences and 28 and 5 shared HECs of TRB CDR3 amino acid sequences
in PTC and pericarcinoma groups, respectively.
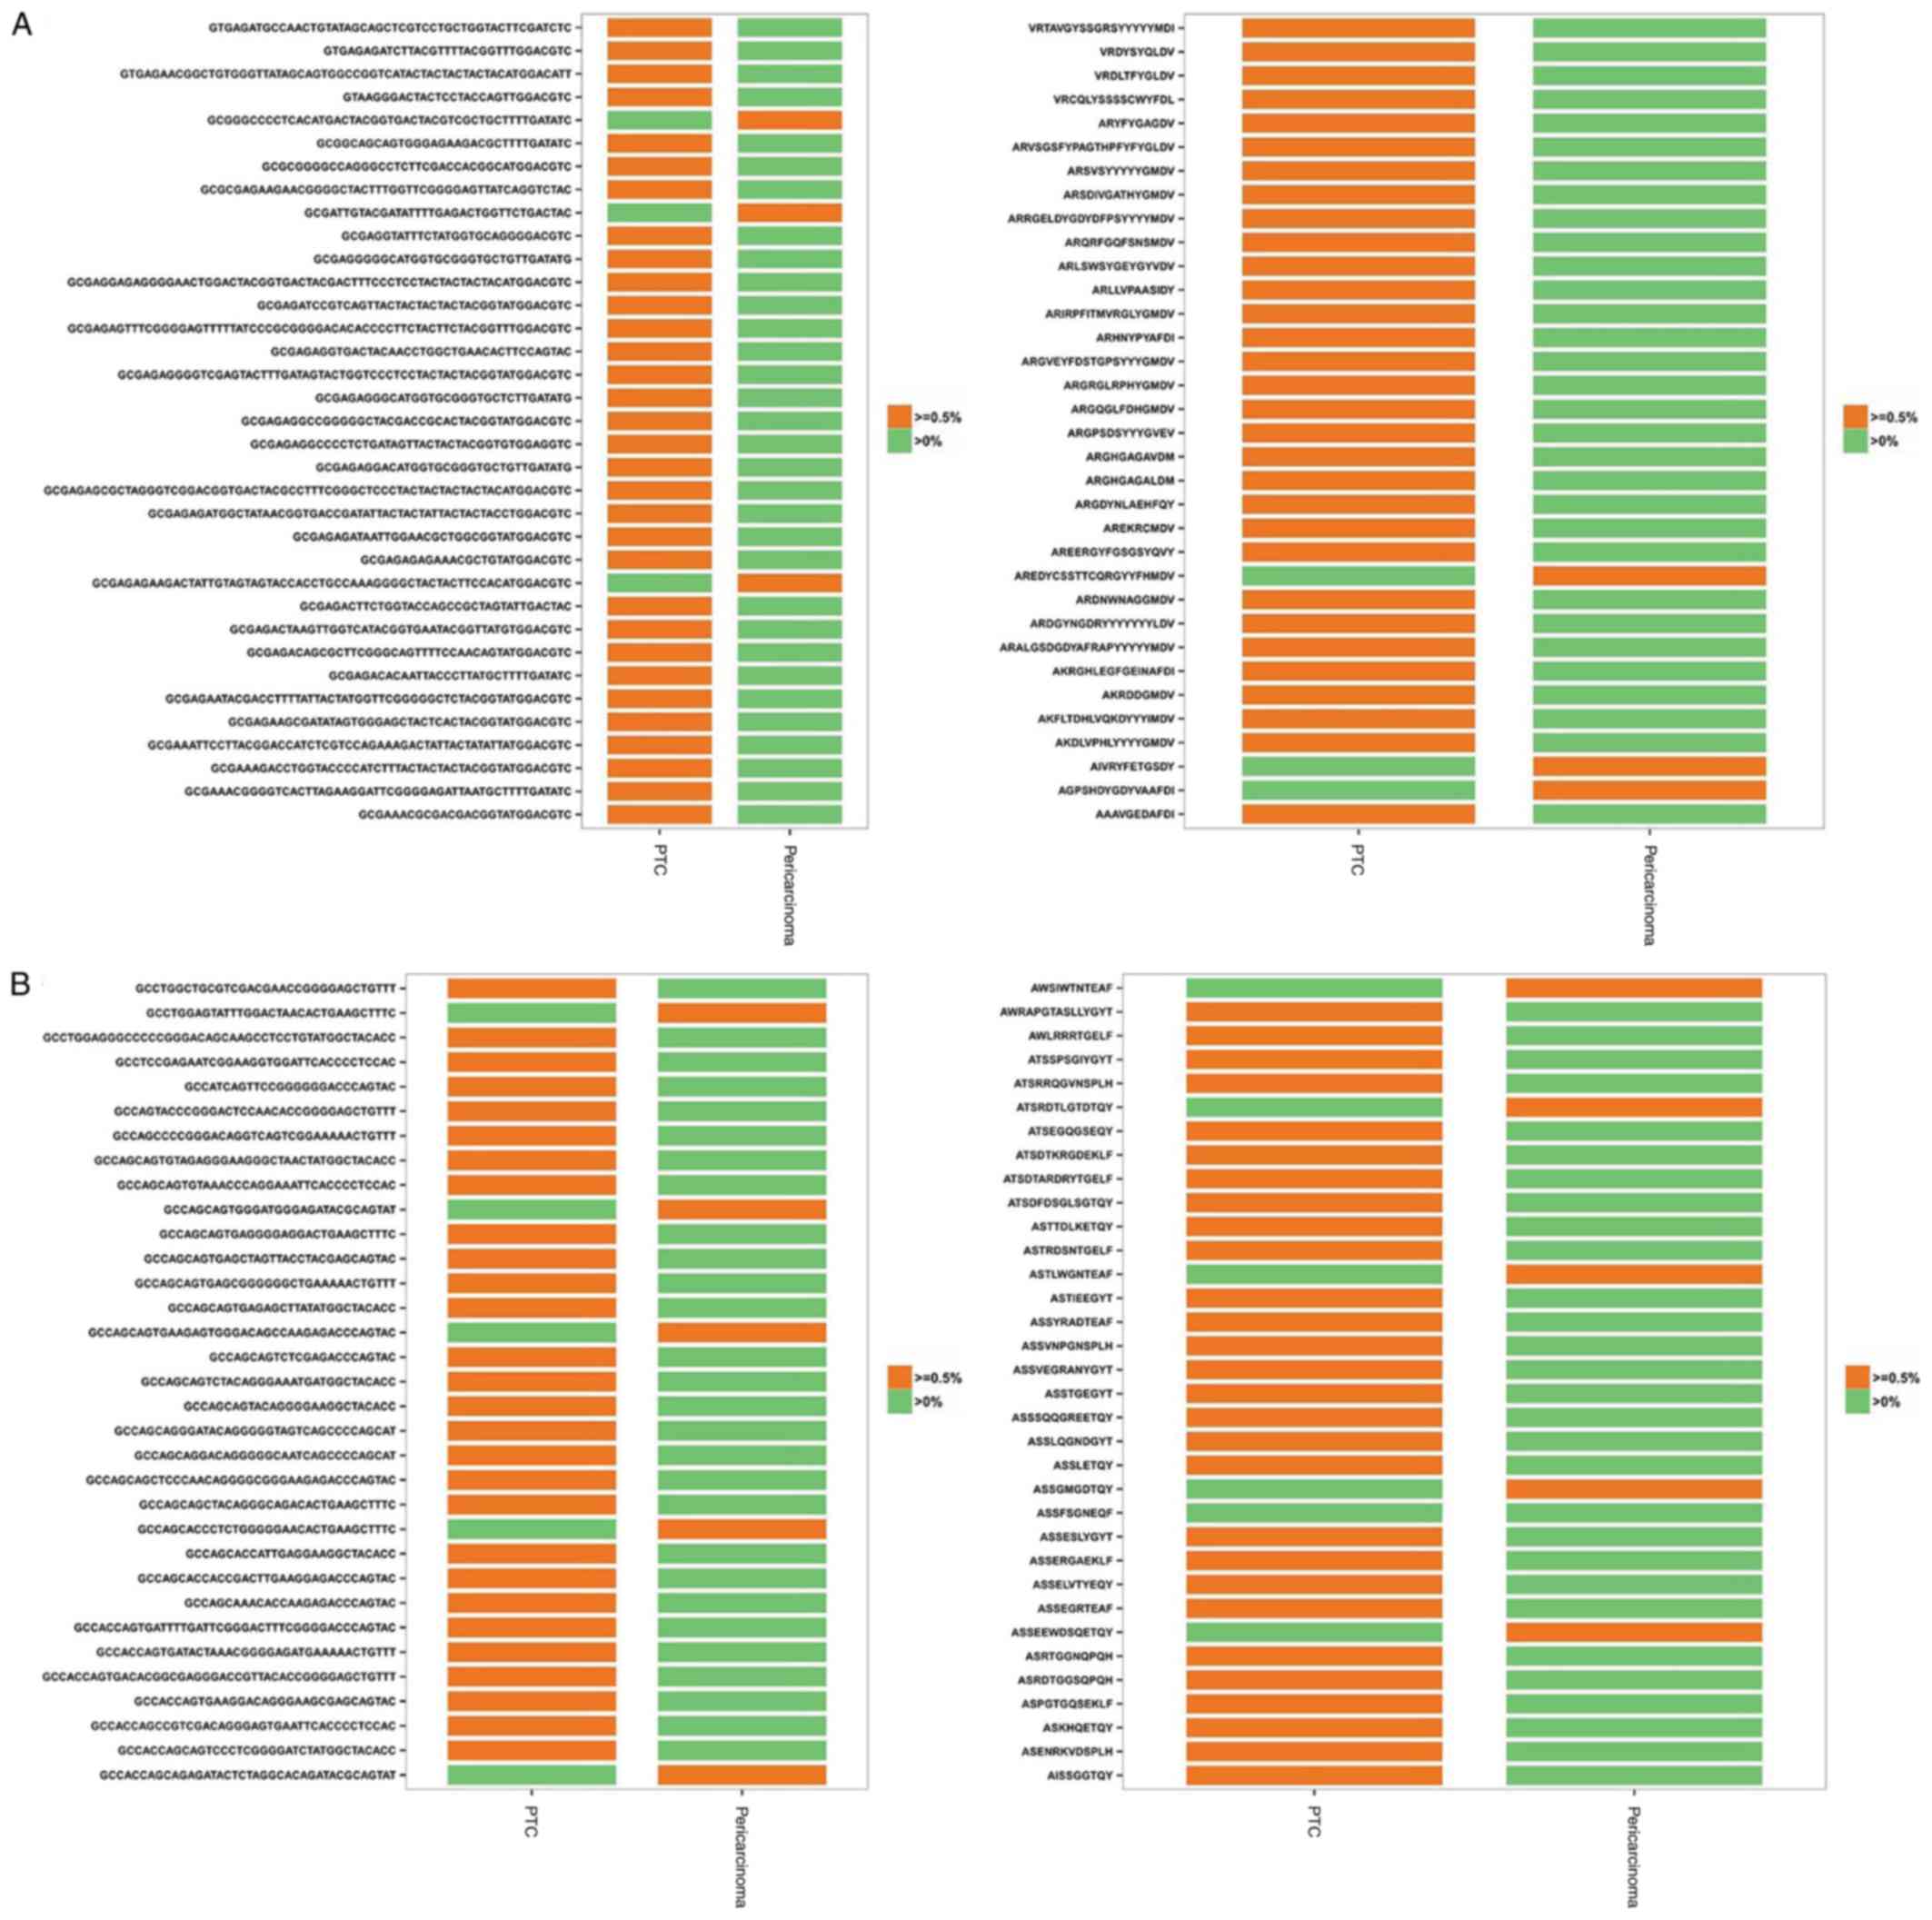 | Figure 5.Shared HECs between PTC and
corresponding pericarcinoma groups at the nt and aa level. (A) A
total of 32 and 3 shared HECs of IGH CDR3 nt sequences from PTC and
corresponding pericarcinoma groups, respectively, were on the left,
and a total of 31 and 3 shared HECs of IGH CDR3 aa sequences from
PTC and corresponding pericarcinoma groups, respectively, were on
the right. (B) A total of 28 and 5 shared HECs of TRB CDR3 nt
sequences from PTC and corresponding pericarcinoma groups,
respectively, were on the left, and a total of 28 and 5 shared HECs
of TRB CDR3 aa sequences from PTC and corresponding pericarcinoma
groups, respectively, were on the right. HEC, highly expended
clones; PTC, papillary thyroid carcinoma; IGH, immunoglobulin heavy
chain; CDR, complementarity-determining region; TRB, T-cell
receptor β chain; nt, nucleotide; aa, amino acid. |
Discussion
The human adaptive immune system is composed of B
and T cell receptors that bind to non-pathogenic or pathogen
derived antigens, which provides protection against an enormous
variety of pathogens and non-pathogens (7). Additionally, the immune repertoire
diversity may be affected by lymphocyte cell clonal expansion
following the occurrence and development of PTC, so that it affects
the immune response of patients to the pathogen (2,8). CDR3 is
the most variable and directly determines the antigen-binding
specificity of the BCR and TCR (15).
In the present study, HTS was used in order to investigate the
characteristics and polymorphisms of the IGH and TRB CDR3 gene from
PTC and corresponding pericarcinoma tissues from 5 patients. The
distributions of CDR3 length among 292,683 and 341,209 total IGH
CDR3 sequences and 561,607 and 335,334 total TRB CDR3 sequences
from PTC and corresponding pericarcinoma, respectively, were
evaluated. The most frequently observed CDR3 lengths were
identified. The difference of IGH CDR3 length distributions between
PTC and pericarcinoma groups was identified. However, the
difference of TRB between the two groups was minimal. It may result
in a delay in the expression of CDR3 length distributions of TRB
region and it was different compared with that of TRBV families
derived from pleural effusion, which exhibited a predominance of a
selected CDR3 length (16). Hou et
al (12) detected that the
specific skewed usage of TRBV segments may be associated with the
susceptibility to unexplained pregnancy loss. The aforementioned
study indicated that the CDR3 length distribution may be associated
with the disease. The goal is to identify, quantify and
statistically assess differences between repertoires so as to offer
a better diagnostic or predictive tool for pathologies involving
the immune system (17).
During B and T lymphocyte development, V, D and J
gene segments are rearranged through targeted DNA recombination.
Through this method, a variable CDR3 region with a highly diversity
may be formed (7,8). The usage frequency of V, D, J and V-J
regions were systematically analyzed. A total of 83 V genes, 37 D
genes and 6 J genes of IGH CDR3 sequences and 58 V genes, 2 D genes
and 14 J genes of TRB CDR3 sequences were obtained. The upregulated
expressions and downregulated expressions of IGH and TRB V genes in
the two groups were identified. The quantity of upregulated
expression was greater compared with that of the downregulated
expression in IGH genes. No differences existed in the D genes of
IGH and TRB CDR3 regions between two groups. Open reading frame
expression was mostly observed in IGHD genes, compared with TRBD
genes. The TRBJ genes usage ratio in two groups presented a similar
pattern as IGHJ genes. These results indicate that the immune
system of patients was active. To better understand the binding
specificity of the immune system, 275 IGHV-J pairings and 536
TRBV-J pairings were identified in PTC and pericarcinoma groups. It
has been revealed that the N-glycosylation of IGHV regions
including IGHV4-34 may confer a selective advantage via
interactions of the glycosylated BCR with mannose binding lectins
in the GC and thus help account for the prevalence of IGHV4-34
usage in follicular lymphoma (18,19). In
the present study, IGHV3-11/IGHJ6, TRBV2/TRBJ1-2 and TRBV2/TRBJ1-1
may be the biomarkers expressed during PTC development.
Amino acid sequences of CDR3, which reveal the
function of the immune repertoire, may reflect the specificity of
the combination of lymphocytes and antigens compared with the V-J
gene. Therefore, it is worth exploring the shared sequences at the
amino acid and nucleotide level. The aforementioned data analysis
revealed that the extent of the common clonotype expressions at the
amino acid level was slightly higher compared with the nucleotide
level.
CDR3 sequences, which determine a unique BCR and TCR
clone, may detect a lymphocyte clone. The index of PTC Shannon
entropy (20) and HECs between the
two groups are different. The diversity demonstrated a reduction in
PTC compared with pericarcinoma groups, and HECs in PTC tissues
were higher compared with that of corresponding pericarcinoma
tissues. Brezinschek et al (21) reported that B cells underwent clonal
expansion in response to chronic stimulation, which may conceivably
be due to pathogens or autoantigens. The identification of the Ag
or Ags against which this selective B cell response occurs may
provide notable insights into the mechanism of blood-brain barrier
disruption, immune-mediated demyelination and atrophy (22). The cellular adaptive immune system
mounts a response to numerous different solid tumor types, mediated
by tumor infiltrating T lymphocytes (23). The findings of a previous study
revealed increased TCR diversity in prostate tumor types following
treatment with Sipuleucel-T, suggesting that active immunotherapies
elicit measurable changes within the tumor microenvironment, and
increasing TCR diversity may be positive (24). Clemente et al (25), studying large granular lymphocyte
leukemia with similar techniques, revealed a low diversity of TCR
species at the baseline, suggesting that growing tumors may be
characterized by a low diversity, and/or non-functional and
infiltrating T cells.
To ensure efficient protection of the organism, the
immune system combines two conflicting needs: A recognition of a
wide array of antigens and an efficient and timely response
(26). The expression levels of
different clones and shared clones between PTC and pericarcinoma
groups were compared. The highest clone frequency percentage of
immune repertoire were at a 0.1–1.0% degree of expansion and the
expression numbers of HECs were higher in PTC compared with the
matched group. However, the amplification extent of HECs was
reduced in the 0.01–0.1% degree of expansion group in PTC. This may
reveal the degree of expansion and the frequency distribution of
the predominant changes of B and T cell clones in the process of
the tumor invasion. Furthermore, there was no shared clone of HECs
in the two groups either at the nucleotide or at the amino acid
expression level. Relevant to this investigation, Emerson et
al (23) revealed a number of
overlaps between tumor and blood, primarily tumor TCRs were
observed only in tumor tissue. This suggests that the intratumoral
microenvironment is characterized by a distinct but internally
homogeneous T cell repertoire that may potentially be manipulated
through the development of immunotherapy.
In conclusion, previous studies in tumor immunology
have highlighted the need for simple, quantitative and reproducible
measures of the host anti-tumor immune response to improve
prognosis (i.e., tumor staging that includes immunological
considerations) and to predict the response of patients to
immunotherapy (27–29). Analysis of immune repertoires by such
an approach may be valuable in a clinical setting, for prognostic
potential analysis and the measurement of clinical responses to
therapy. However, in the present study, there was no significance
identified due to the small sample numbers. The genetic basis of
drug resistance, pathogenesis, persistence and latency may be
identified through analysis with a larger sample size.
As the cost of HTS declines, it is expected that
direct HTS of the immune repertoire may provide more useful
information for assessing the immune repertoire size, diversity,
cloning tracking and find public clone in B-cell and T-cell
populations in the development of PTC.
Acknowledgements
Not applicable.
Funding
The present study was supported by the National
Nature Science Foundation of China (grant nos. 30170050, 81402370
and 81671596), Guangdong Natural Science Foundation (grant no.
2015A030313829), the Scientific and Technology Foundation of
Guangdong (grant nos. 2015B090904007 and 2016A050503009), the
Natural Science Foundation of Guangdong (grant no. 2016A030313029),
the Scientific Plan Program of Guangdong (grant no.
2014A020212038), the Innovation Program of Shenzhen (grant no.
JCYJ20150330102720122), the International Cooperation Foundation of
Shenzhen (grant no. GJHZ20160301163138685) and the Pingshan New
District Incubation Foundation of Shenzhen (grant no. 201501).
Availability of data and materials
The datasets used or analyzed during the current
study are available from the corresponding author on reasonable
request.
Authors' contributions
All authors reviewed and approved the manuscript
prior to the submission. GS and WP conceived and designed the
experiments. PZ and JZ performed the experiments. JQ and SL
analyzed the data. CZ and NX interpreted the patient data regarding
the papillary thyroid carcinoma. ZQ performed the pathological
examination of the papillary thyroid. YD conceived and designed the
experiments, analyzed the data. LQ interpreted the data and drafted
the manuscript. All authors read and approved the final
manuscript.
Ethics approval and consent to
participate
Written informed consent for participation in the
present study was obtained from all participants. The present study
was approved by the Ethics Committee of Shenzhen People's Hospital
and abided by the Helsinki Declaration for medical research
involving human subjects.
Consent for publication
Written informed consent for participation in the
present study was obtained from all subjects. All participants
provided consent for publication of data in research and press
articles, and websites, exclusively for non-profit-making
purposes.
Competing interests
The authors declare that they have no competing
interests.
References
|
1
|
Jung CW, Kong JS, Seol H, Park S, Koh JS,
Lee SS, Kim MJ, Choi IJ and Myung JK: Expression of activated
Notch1 and Hey1 in papillary thyroid carcinoma. Histopathology.
70:301–308. 2017. View Article : Google Scholar : PubMed/NCBI
|
|
2
|
Georgiades F, Vasiliou G, Kyrodimos E and
Thrasyvoulou G: Extensive laryngeal infiltration from a neglected
papillary thyroid carcinoma: A case report. World J Clin Cases.
4:187–190. 2016. View Article : Google Scholar : PubMed/NCBI
|
|
3
|
Chen W, Zheng R, Zeng H, Zhang S and He J:
Annual report on status of cancer in China, 2011. Chin J Cancer
Res. 27:2–12. 2015. View Article : Google Scholar : PubMed/NCBI
|
|
4
|
Zhu H, Lv Z, An C, Shi M, Pan W, Zhou L,
Yang W and Yang M: Onco-lncRNA HOTAIR and its functional genetic
variants in papillary thyroid carcinoma. Sci Rep. 6:319692016.
View Article : Google Scholar : PubMed/NCBI
|
|
5
|
Wang T, Blumer I, Boerner S and Asa SL:
Synchronous papillary carcinoma of thyroid and lung. Endocr Pathol.
27:268–270. 2016. View Article : Google Scholar : PubMed/NCBI
|
|
6
|
Moritani S: Parapharyngeal metastasis of
papillary thyroid carcinoma. World J Surg. 40:350–355. 2016.
View Article : Google Scholar : PubMed/NCBI
|
|
7
|
Calis JJ and Rosenberg BR: Characterizing
immune repertoires by high throughput sequencing: Strategies and
applications. Trends Immunol. 35:581–590. 2014. View Article : Google Scholar : PubMed/NCBI
|
|
8
|
Schanz M, Liechti T, Zagordi O, Miho E,
Reddy ST, Günthard HF, Trkola A and Huber M: High-throughput
sequencing of human immunoglobulin variable regions with subtype
identification. PloS One. 9:e1117262014. View Article : Google Scholar : PubMed/NCBI
|
|
9
|
Quail MA, Smith M, Coupland P, Otto TD,
Harris SR, Connor TR, Bertoni A, Swerdlow HP and Gu Y: A tale of
three next generation sequencing platforms: Comparison of ion
torrent, pacific biosciences and illumina Miseq sequencers. BMC
Genomics. 13:3412012. View Article : Google Scholar : PubMed/NCBI
|
|
10
|
Reuter JA, Spacek DV and Snyder MP:
High-throughput sequencing technologies. Mol Cell. 58:586–597.
2015. View Article : Google Scholar : PubMed/NCBI
|
|
11
|
Lefranc MP, Giudicelli V, Ginestoux C,
Bodmer J, Müller W, Bontrop R, Lemaitre M, Malik A, Barbié V and
Chaume D: IMGT, the international ImMunoGeneTics database. Nucleic
Acids Res. 27:209–212. 1999. View Article : Google Scholar : PubMed/NCBI
|
|
12
|
Hou X, Lu C, Chen S, Xie Q, Cui G, Chen J,
Chen Z, Wu Z, Ding Y, Ye P, et al: High throughput sequencing of T
cell antigen receptors reveals a conserved TCR repertoire. Medicine
(Baltimore). 95:e28392016. View Article : Google Scholar : PubMed/NCBI
|
|
13
|
Sui W, Hou X, Zou G, Che W, Yang M, Zheng
C, Liu F, Chen P, Wei X, Lai L and Dai Y: Composition and variation
analysis of the TCR β-chain CDR3 repertoire in systemic lupus
erythematosus using high-throughput sequencing. Mol Immunol.
67:455–464. 2015. View Article : Google Scholar : PubMed/NCBI
|
|
14
|
Yu X, Almeida JR, Darko S, van der Burg M,
DeRavin SS, Malech H, Gennery A, Chinn I, Markert ML, Douek DC and
Milner JD: Human syndromes of immunodeficiency and dysregulation
are characterized by distinct defects in T-cell receptor repertoire
development. J Allergy Clin Immunol. 133:1109–1115. 2014.
View Article : Google Scholar : PubMed/NCBI
|
|
15
|
Robins H: Immunosequencing: Applications
of immune repertoire deep sequencing. Curr Opin Immunol.
25:646–652. 2013. View Article : Google Scholar : PubMed/NCBI
|
|
16
|
Li D, Gao G, Li Z, Sun W, Li X, Chen N,
Sun J and Yang Y: Profiling the T-cell receptor repertoire of
patient with pleural tuberculosis by high-throughput sequencing.
Immunol Lett. 162:170–180. 2014. View Article : Google Scholar : PubMed/NCBI
|
|
17
|
Miqueu P, Guillet M, Degauque N, Doré JC,
Soulillou JP and Brouard S: Statistical analysis of CDR3 length
distributions for the assessment of T and B cell repertoire biases.
Mol Immunol. 44:1057–1064. 2007. View Article : Google Scholar : PubMed/NCBI
|
|
18
|
Zhu D, McCarthy H, Ottensmeier CH, Johnson
P, Hamblin TJ and Stevenson FK: Acquisition of potential
N-glycosylation sites in the immunoglobulin variable region by
somatic mutation is a distinctive feature of follicular lymphoma.
Blood. 99:2562–2568. 2002. View Article : Google Scholar : PubMed/NCBI
|
|
19
|
Radcliffe CM, Arnold JN, Suter DM, Wormald
MR, Harvey DJ, Royle L, Mimura Y, Kimura Y, Sim RB, Inogès S, et
al: Human follicular lymphoma cells contain oligomannose glycans in
the antigen-binding site of the B-cell receptor. J Biol Chem.
282:7405–7415. 2007. View Article : Google Scholar : PubMed/NCBI
|
|
20
|
Nemzer LR: Shannon information entropy in
the canonical genetic code. J Theor Biol. 415:158–170. 2017.
View Article : Google Scholar : PubMed/NCBI
|
|
21
|
Brezinschek HP, Foster SJ, Brezinschek RI,
Dörner T, Domiati-Saad R and Lipsky PE: Analysis of the human VH
gene repertoire. Differential effects of selection and somatic
hypermutation on human peripheral CD5(+)/IgM+ and CD5(−)/IgM+ B
cells. J Clin Invest. 99:2488–2501. 1997. View Article : Google Scholar : PubMed/NCBI
|
|
22
|
Baranzini SE, Jeong MC, Butunoi C, Murray
RS, Bernard CC and Oksenberg JR: B cell repertoire diversity and
clonal expansion in multiple sclerosis brain lesions. J Immunol.
163:5133–5144. 1999.PubMed/NCBI
|
|
23
|
Emerson RO, Sherwood AM, Rieder MJ,
Guenthoer J, Williamson DW, Carlson CS, Drescher CW, Tewari M,
Bielas JH and Robins HS: High-throughput sequencing of T-cell
receptors reveals a homogeneous repertoire of tumour-infiltrating
lymphocytes in ovarian cancer. J Pathol. 231:433–440. 2013.
View Article : Google Scholar : PubMed/NCBI
|
|
24
|
McNeel DG: TCR diversity-a universal
cancer immunotherapy biomarker? J Immunother Cancer. 4:692016.
View Article : Google Scholar : PubMed/NCBI
|
|
25
|
Clemente MJ, Przychodzen B, Jerez A,
Dienes BE, Afable MG, Husseinzadeh H, Rajala HL, Wlodarski MW,
Mustjoki S and Maciejewski JP: Deep sequencing of the T-cell
receptor repertoire in CD8+ T-large granular lymphocyte leukemia
identifies signature landscapes. Blood. 122:4077–4085. 2013.
View Article : Google Scholar : PubMed/NCBI
|
|
26
|
Arstila TP, Casrouge A, Baron V, Even J,
Kanellopoulos J and Kourilsky P: A direct estimate of the human
alphabeta T cell receptor diversity. Science. 286:958–961. 1999.
View Article : Google Scholar : PubMed/NCBI
|
|
27
|
Ascierto PA, Capone M, Urba WJ, Bifulco
CB, Botti G, Lugli A, Marincola FM, Ciliberto G, Galon J and Fox
BA: The additional facet of immunoscore: Immunoprofiling as a
possible predictive tool for cancer treatment. J Transl Med.
11:542013. View Article : Google Scholar : PubMed/NCBI
|
|
28
|
Galon J, Pagès F, Marincola FM, Thurin M,
Trinchieri G, Fox BA, Gajewski TF and Ascierto PA: The immune score
as a new possible approach for the classification of cancer. J
Transl Med. 10:12012. View Article : Google Scholar : PubMed/NCBI
|
|
29
|
Galon J, Angell HK, Bedognetti D and
Marincola FM: The continuum of cancer immunosurveillance:
Prognostic, predictive, and mechanistic signatures. Immunity.
39:11–26. 2013. View Article : Google Scholar : PubMed/NCBI
|