Introduction
Fatty acid synthase (FASN) synthesizes fatty acids
from malonyl-CoA and acetyl-CoA substrates, using nicotinamide
adenine dinucleotide phosphate
(NADPH,H+/NADP+) as a cofactor, mainly
leading to the synthesis of 16-carbon palmitate (1). FASN is also involved in other
functions such as energy storage, protein adhesion to membrane,
cell signaling, intracellular trafficking, cell migration and cell
proliferation (2). In
non-cancerous human tissues or cells, FASN, which is under
the transcriptional control of sterol responsive element binding
protein (SREBP), is downregulated due to a sufficient level of
fatty acids in the diet. Accelerated fatty acid synthesis due to
increased FASN level has been observed in many types of cancer,
including breast, colon or prostate cancer, and is positively
correlated with a poor prognosis (3).
O-GlcNAcylation is a dynamic
post-translational modification consisting in the addition of a
single N-acetylglucosamine (GlcNAc) monosaccharide to
serine/threonine residues of target proteins via O-GlcNAc
transferase (OGT). Removal of the GlcNAc residue is catalyzed by
the O-GlcNAcase (OGA) (4).
As a nutrient sensor, O-GlcNAcylation can relay the effects
of excessive nutritional intake, which is an important risk factor
of cancer. It has been reported that O-GlcNAcylation and OGT
levels are increased in various types of cancers such as colon and
breast cancer (5). We previously
demonstrated in two independent studies the following: i) FASN is
O-GlcNAcylated in a nutrition-dependent manner (hepatic
lipogenesis) and O-GlcNAcylation promotes its activity by
preventing its proteasomal degradation (6); and ii) FASN expression is dependent
of the catalytic activity of OGT and activation of mTOR in
proliferating liver cancer cells (7).
mTOR pathway is another signaling pathway that
senses nutrient availability and growth factors or hormones to
enable cell growth (8). Our
previous study and another study reported that
O-GlcNAcylation and mTOR pathway are closely linked in
breast and colon cancer cells, and a reciprocal control between the
two has been demonstrated (9,10).
Furthermore, it has been reported that the mTOR pathway is
associated with tumorigenesis (11,12).
However, such investigation in human liver tissues has not been
performed.
In a previous study, we focused on the expression of
FASN in the HepG2 cell line (7);
however, further investigation is needed in patients with liver
cancer. By combining the evaluation of transcriptome databases and
experimental approach using western blotting, immunohistochemistry
(IHC) and reverse transcription quantitative (RT-q)PCR, the present
study investigated the expression of FASN and OGT and the
activation of mTOR in liver-derived cell lines and tissues from
patients with liver cancer. The objective of the present study was
to extend the research of our previous study on cell lines
(7) and to tentatively fill a gap
in the literature concerning the concomitant expression level of
FASN and OGT, and mTOR pathway activation, in hepatic cancer.
Materials and methods
Expression data retrieval and
analysis
The OGT and FASN gene expression in
tissues was graphed independently of sex and along a logarithmic
y-axis [log10(TPM+1)] using Genotype-Tissue Expression (GTEx;
http://gtexportal.org/home/) database.
The web server GEPIA 2 (cancer-pku.cn; gepia2.cancer-pku.cn) was
used to analyze the Cancer Genome Atlas (TCGA) database. GTEx and
TCGA together allowed the examination of 60,498 genes and 198,619
isoforms (dataset sources). Expression analyses generated by GEPIA2
were represented as box plots with a cutoff P-value of 0.01. Log
scale was chosen for data representation.
Human tumor tissues
A series of 10 liver tumor and tumor-adjacent
tissues from 6 men and 4 women were obtained from the Tumor Bank of
Lille-Regional Reference Center in Cancer (Centre Hospitalier
Régional Universitaire de Lille, Lille, France; agreement no.
#CSTMT276 obtained on December 2, 2020). Samples were immediately
frozen in liquid nitrogen and stored at −80°C. Patient data are
presented in Table I.
 | Table I.Clinicopathological characteristics
of the patients included in the present study. |
Table I.
Clinicopathological characteristics
of the patients included in the present study.
| Patient, ref.
no. | Tumor tissue | Adjacent
non-tumoral tissue | Sex | Age, years | Height, cm | Weight, kg | BMI,
kg/m2 | Metabolic
co-morbidities | Alcohol | Other |
|---|
| 1 (C1718883) | Moderately
differentiated hepatocellular carcinoma | Portal
fibrosis | M | 76 | 170 | 81 | 28 | HBP,
dyslipidemia | Yes | - |
| 2 (C1711290) | Well differentiated
hepatocellular carcinoma | Normal | F | 66 | 155 | 60 | 25 | HBP,
insulin-requiring type II diabetes | No | - |
| 3 (C1710611) | Moderately
differentiated hepatocellular carcinoma | Cirrhosis | M | 70 | 167 | 83 | 30 | HBP, NIDD | Yes | Macronodular
cirrhosis |
| 4 (C1708887) | Moderately
differentiated hepatocellular carcinoma | Cirrhosis | M | 62 | 177 | 91 | 29 | HBP, NIDD | Yes | - |
| 5 (C1700573) | Moderately
differentiated hepatocellular carcinoma | Portal
fibrosis | M | 73 | 168 | 80 | 28 | HBP | Yes | - |
| 6 (C1638582) | Well differentiated
hepatocellular carcinoma | Cirrhosis | F | 61 | 165 | 67 | 25 | HBP | Yes | - |
| 7 (C1633369) | Well differentiated
hepatocellular carcinoma | Normal | F | 46 | 167 | 67 | 25 | - | No | - |
| 8 (C1620576) | Well differentiated
hepatocellular carcinoma | Normal | M | 69 | 175 | 84 | 27 | - | Yes | - |
| 9 (C1616311) | Moderately
differentiated hepatocellular carcinoma | Cirrhosis | M | 61 | 177 | 96 | 31 | NIDD | Yes | - |
| 10 (C1629916) | Moderately
differentiated hepatocellular carcinoma | Cirrhosis | F | 81 | 160 | 59 | 23 | IDD | Yes | - |
Tissue disruption
Liver tissues were lysed in 600 µl of lysis buffer
[10 mM Tris-HCl, 150 mM NaCl, 0.1% (m/v) sodium dodecyl sulfate
(SDS), 1% (v/v) Triton-X100 and 0.5% (m/v) sodium deoxycholate
(NaDOC); pH 7.5] containing protease inhibitors (protease cocktail
inhibitors; Sigma-Aldrich; Merck KGaA), 50 mM sodium fluoride
(Sigma-Aldrich; Merck KGaA) and 1 mM sodium orthovanadate
(Sigma-Aldrich; Merck KGaA) at 4°C for protein extraction or 500 µl
of RA1 buffer (Machery-Nagel GmbH) containing chaotropic salt
[30-60% (m/v) guanidinium thiocyanate] at room temperature for mRNA
extraction using a MP Biomedicals Instrument FastPrep and Lysing
Matrix tubes (MP Biomedicals). Three cycles of 40 sec at 4
msec−1, 40 sec at 4 msec−1 and 20 sec at 4
msec−1 were needed. The soluble fractions were obtained
following two centrifugations at 13,000 × g for 10 min at 4°C for
proteins and at room temperature for mRNA.
Cell culture
All cell lines were obtained from the American Type
Culture Collection apart from the immortalized human hepatocytes
IHH cell line that was provided by the European Genomic Institute
for Diabetes (Lille). The human liver cancer HepG2 cell line was
cultured in Dulbecco's Modified Eagle's Medium (DMEM; Lonza Group
Ltd.) supplemented with 25 mM glucose. The human hepatocarcinoma
Hep3B cell line was cultured in Minimal Essential Medium (MEM;
Biowest SAS) supplemented with 5 mM glucose. The immortalized human
hepatocyte IHH cell line was cultured in William's E Medium (Lonza
Group Ltd.) supplemented with 10 mM glucose. All cells were
maintained in medium supplemented with 10% (v/v) fetal calf serum
(Dominique Dutscher SAS) and 2 mM L-glutamine and incubated at 37°C
in a 5% (v/v)CO2-enriched humidified atmosphere. To
maintain optimal growth conditions, cells were divided before
confluence was reached and fresh medium was added. The day before
cell were used, the cells were divided to retain their ability to
proliferate.
Western blotting
Cells were first washed twice with ice-cold
phosphate-buffered saline (Sigma-Aldrich; Merck KGaA) and then
incubated for 20 min with lysis buffer (composition as
aforementioned). The cell lysates were then centrifuged at 20,000 ×
g for 15 min at 4°C. The supernatants were collected and protein
concentration from cultured cells and human liver lysates was
evaluated using the micro-BCA assay kit (Thermo Fisher Scientific,
Inc.) according to the manufacturer's instructions. Proteins (30 µg
per lane) were separated by 6 or 8% SDS-PAGE in electrophoresis
buffer [25 mM Tris-HCl, 192 mM glycine, 0.1% (m/v) SDS, pH 8.8] and
transferred onto nitrocellulose membranes (Hybond™-C EXTRA; GE
Healthcare) in transfer buffer [25 mM Tris-HCl, 192 mM glycine, 20%
(v/v) methanol, pH 8,8]. Membranes were stained with Ponceau red
[5% (v/v) acetic acid and 0,1% (w/v) Ponceau red] to confirm equal
loading. Membranes were destained with Tris-Buffered Saline (TBS)
containing Tween-20 [20 mM Tris-HCl, 150 mM NaCl, 0,05% (v/v)
Tween-20; Sigma-Aldrich; Merck KGaA; pH 7,5; TBS-T]. Membranes were
subsequently blocked in 5% (w/v) nonfat dry milk or 3% (w/v) bovine
serum albumin (Sigma-Aldrich; Merck KGaA) in TBS-T for 45 min and
incubated overnight at 4°C with primary antibodies against
O-GlcNAc [mouse monoclonal (RL2); cat. no. MA1-072; Thermo
Fisher Scientific, Inc. 1:2,000], OGT [rabbit polyclonal (TI-14);
cat. no. O6014; Sigma-Aldrich; Merck KGaA; 1:2,000], FASN (rabbit
polyclonal; cat. no. ab99359, Abcam, 1:1,000), mTOR [rabbit
polyclonal (7C10); cat. no. #2983; Cell Signaling Technology, Inc.;
1:1,000], phosphorylated (p)-mTOR [rabbit polyclonal (D9C2); cat.
no. #5536; Cell Signaling Technology, Inc; 1:1,000] and GAPDH
(mouse monoclonal; cat. no. 71548; Covalab; 1:4,000). After three
washes with TBS-T, membranes were incubated with the appropriate
horseradish peroxidase-conjugated secondary antibody (polyclonal
donkey anti-rabbit IgG/HRP conjugated and polyclonal sheep
anti-mouse IgG/HRP conjugated; GE Healthcare; 1:10,000) for 1 h at
room temperature. After three washes with TBS-T, bands were
detected using enhanced chemiluminescence substrate (West Pico
Plus; Thermo Fisher Scientific, Inc.). The images were acquired
using a CCD camera (Fusion Solo; Vilbert Lourmat). For additional
probing, membranes were stripped with the Antibody Stripping Buffer
(Gene Bio-Application L.T.D.) for 15 min at room temperature,
washed in TBS-T and re-probed with antibodies. Relative expression
levels of proteins were normalized to endogenous control GAPDH
using ImageJ software 1.52v (National Institutes of Health).
Immunohistochemistry (IHC)
Tissue sections (5 µm) were stained with hematoxylin
and eosin. Automatic IHC was performed with an automated
immunostainer apparatus (BenchMark GX; Roche Diagnostics) using
iVIEW DAB detection kit (Ventana) and primary antibodies specific
for OGT (Sigma-Aldrich; Merck KGaA; cat. no. DM17; rabbit; 1:200),
FASN (Abcam; cat. no. ab99359; rabbit; 1:100) and O-GlcNAc
(Novus Biologicals RL2; mouse; 1:200). Antigen retrieval was
performed using CC1 antigen retrieval buffer (Ventana Medical
Systems) for 30 min at 95°C. Specificity was checked by control
staining performed in the absence of primary antibody. Images of
whole tissue sections were obtained using an Axioscan Z1 microscope
slide scanner (Zeiss AG). Immunostaining score was established by
the expert pathologist Dr Rybarczyk. Staining intensity was
analyzed using the percentages of stained hepatocytes (tumoral or
not) multiplied by the intensity score as follows: 0 (no staining),
1+ (weak staining), 2+ (moderate staining) and 3+ (strong
staining). We obtained a final score for each tissue ranging from 0
to 3.
mRNA extraction and RT-qPCR
analysis
mRNA extraction was performed using the Nucleospin
‘DNA, RNA and protein purification’ kit (Macherey Nagel) according
to the manufacturer's instructions. Quantification of RNA levels
and reverse transcription were performed as previously described
(7). The FASN, OGT and SREBP
transcripts were analyzed by RT-qPCR using Mx4000 Multiplex
Quantitative PCR system (Stratagene). Each PCR reaction contains
12.5 µl of SyberGreen, 300 nM of each primer and 2 µl of cDNA for a
total volume of 25 µl. The following program was followed: Segment
1 (1 cycle), 10 min at 95°C; segment 2 (40 cycles), 30 sec at 95°C,
30 sec at 56°C for OGT and SREBP, and at 60°C for FASN, and 30 sec
at 72°C; segment 3 (1 cycle), 1 min at 95°C, 30 sec at 56°C for OGT
and SREBP, and at 60°C for FASN, and 30 sec at 95°C. Data were
normalized and expressed using the 2−ΔΔCT method
(13). The sequences of the
primers are presented in Table
II.
| Table II.Sequences of the primers used for
reverse transcription quantitative PCR. |
Table II.
Sequences of the primers used for
reverse transcription quantitative PCR.
| Genes | Forward sequence,
5′-3′ | Reverse sequence,
5′-3′ | Hybridization
temperature, °C |
|---|
| OGT |
TGGCTTCAGGAAGGCTATTG |
CAAGTCTTTTGGATGTTCATATGG | 56 |
| FASN |
TTCTTCGGAGTCCACCCCA |
TCCTCGGAGTGAATCTGGGT | 60 |
| SREBP |
GGAGCCATGGATTGCACTTT |
TCAAATAGGCCAGGGAAGTCA | 56 |
| RPLP0 |
GATGACCAGCCCAAAGGAGA |
GTGATGTGCAGCTGATCAAGACT | 60 |
Statistical analysis
Data were presented are the means ± standard error
of the man of at least three independent experiments. Data were
compared using one-way ANOVA and Student's t-test. Correlation
analysis was done using Pearson correlation test (with the
calculation of correlation coefficient r, coefficient of
determination R2 and P-value). Statistical analyses were
performed using Excel 2019 (Microsoft Corporation) and Graph-Pad
Prism 8.0 (GraphPad Software, Inc.) software.
Results
Exploration of transcriptome databases
revealed that FASN and OGT gene expression are higher in cancers,
including liver cancer
It is considered that FASN and OGT are
expressed in all human tissues but at various levels. To highlight
the importance of FASN and OGT in physiological processes, we first
checked gene expression levels of both enzymes in 54 healthy
tissues (from ~1,000 people) using GTExPORTAL (Fig. 1A). FASN and OGT were widely
expressed over numerous tissues and organs. FASN content was higher
in adipose tissue (due to visceral fat accumulation) and in mammary
tissue, especially during lactation. Regarding OGT, the expression
levels were more homogenous over tissues, although a stronger
expression was observed in cerebellum, lung, spleen, thyroid,
tibial nerve and female tissues and organs (cervix, fallopian tube,
ovary, uterus and vagina; Fig.
1A). Since both enzymes are thought to be drivers of
carcinogenesis, we next explored the GEPIA 2 web server to analyze
their mRNA levels expressed as RNA-Seq by Expectation-Maximization
(log2) in a wide variety of tumors (TCGA normal) compared with
healthy tissues (TCGA normal and GTEx datasets; Fig. 1B). The results demonstrated that
mRNA encoding FASN was increased in the following tumor tissues:
BLCA, CESC, COAD, DLBC, LIHC, OV, PAAD, PRAD, READ, TGCT, THYM,
UCEC and UCS. Conversely, it was significantly decreased in LAML
and THCA (Fig. 1B). Significant
increase in OGT expression was observed in CHOL, DLBC and LAML, and
decrease in ACC, BRCA, CESC, COAD, LUAD, LUSC, OV, PAAD, PRAD,
READ, SKCM, THCA, THYM, UCEC and UCS. A non-significant decrease in
OGT expression was also visible in LIHC, which was consistent with
a previous study (7). Taken
together, these findings demonstrated a significant decrease in OGT
mRNA level in tumor tissues while FASN mRNA content tended to
increase in tumor tissues.
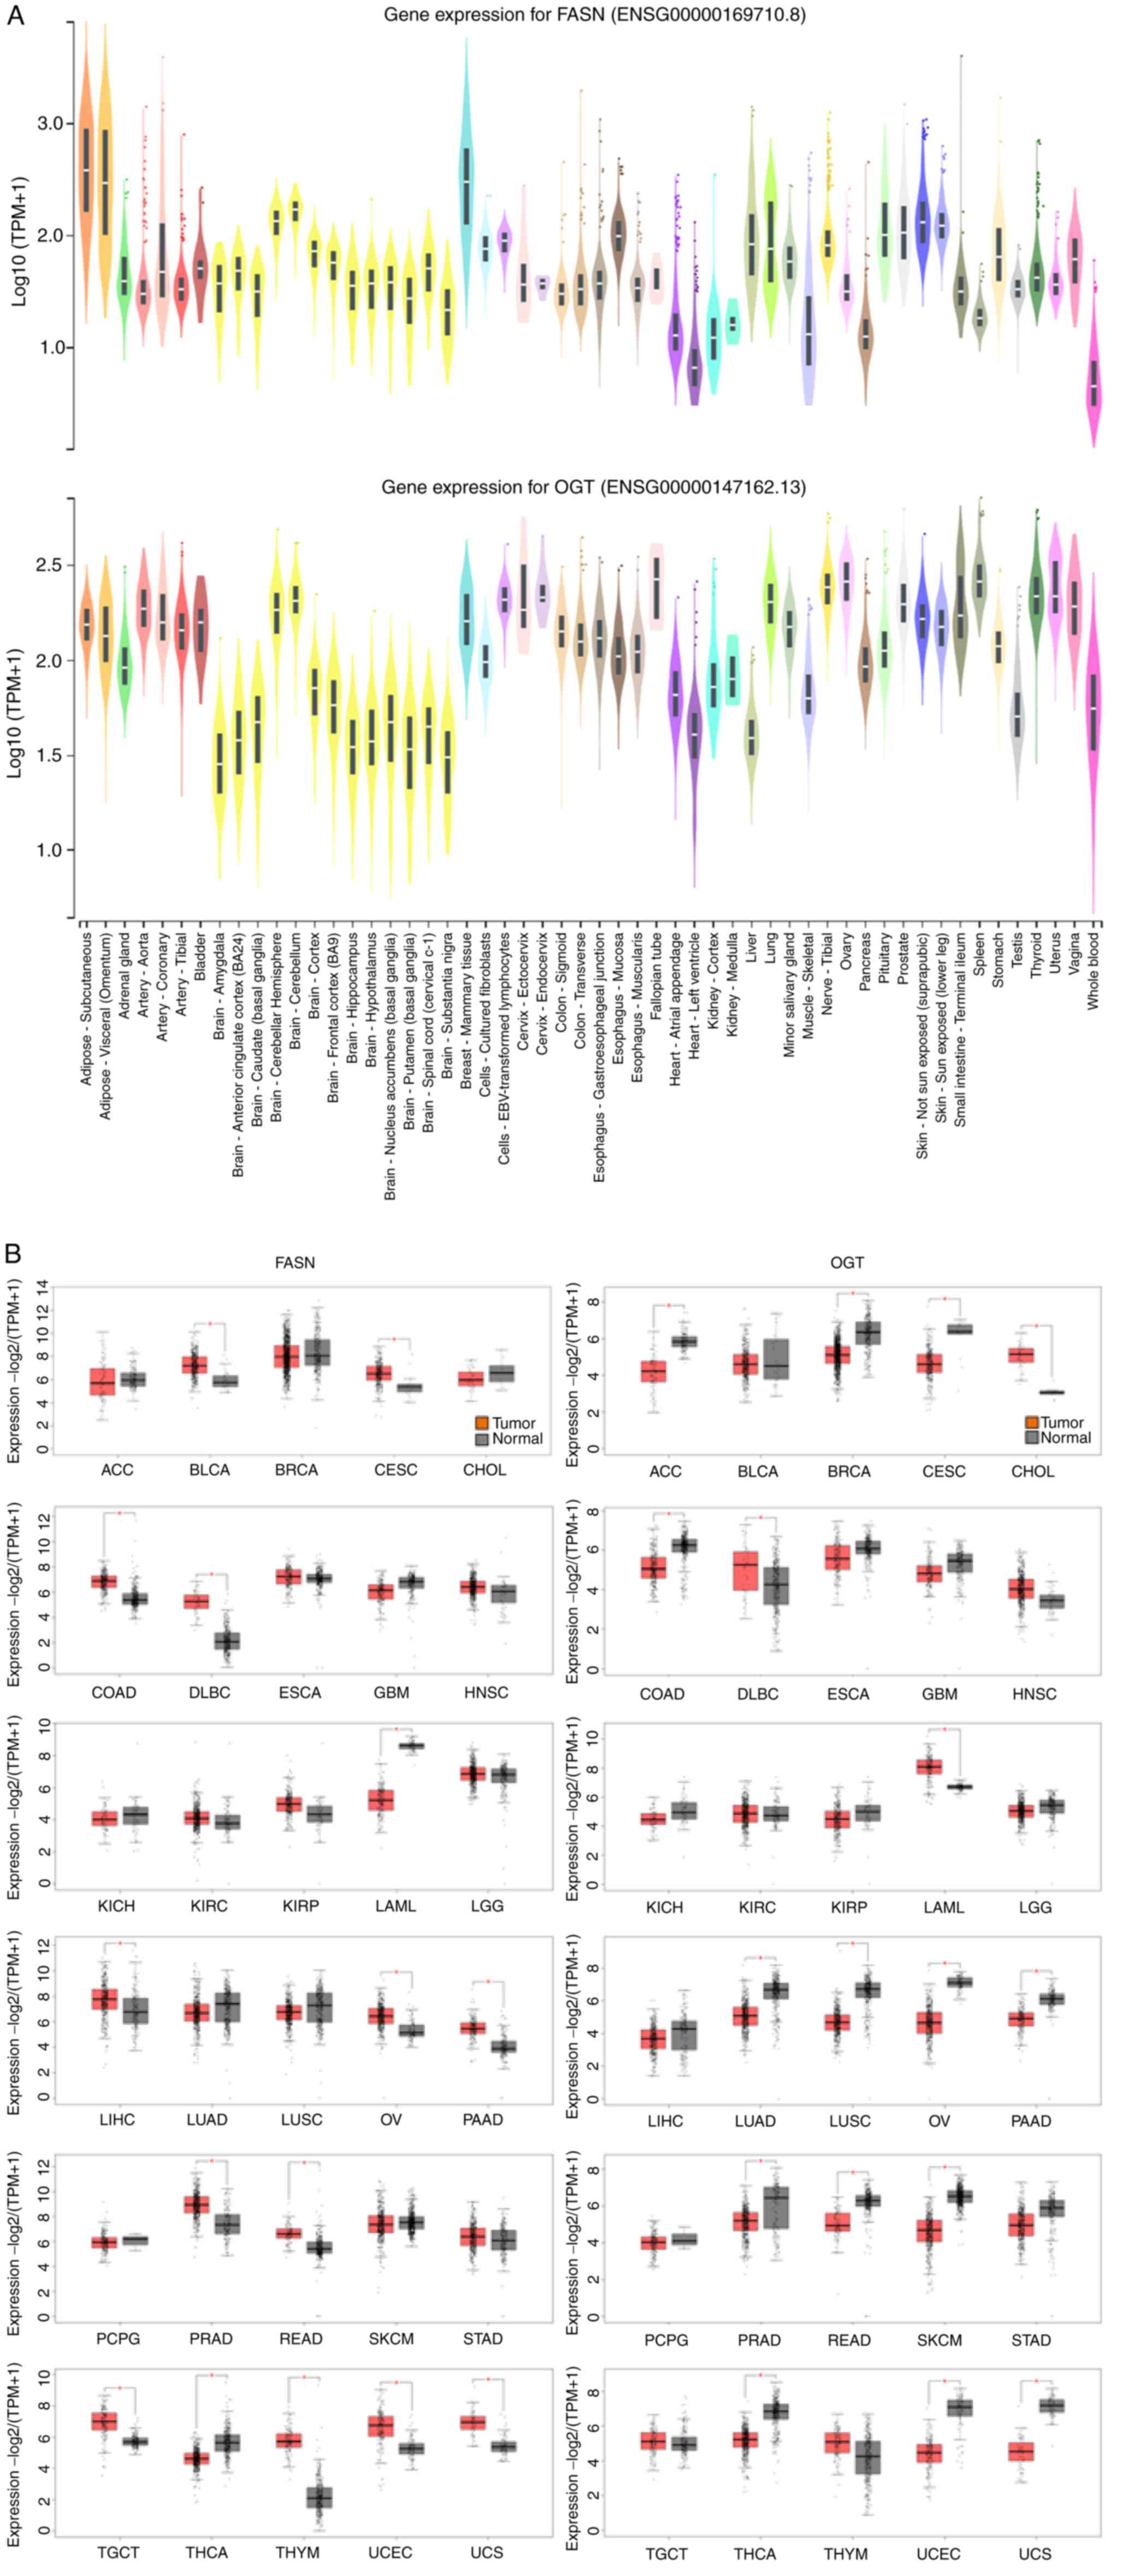 | Figure 1.Evaluation of FASN and OGT gene
expressions in (A) normal and (B) cancer human tissues using GTEx
Portal and GEPIA2 respectively. Sample sizes (number of patients)
were as follows in (A): AS, 663; AV, 541; AG, 258; AA, 432; AC,
240; AT, 663; B, 21; BA, 152; BACC, 176; BCBG, 246; BCH, 215; BCe,
241; BCo, 255; BFC, 209; BHi, 197; BHy, 202; BNABG, 246; BTBG, 205;
BSCC, 159; BSN, 139; BMT, 459; CCF, 504; CEBVTL, 174; CEc, 9; CEn,
10; CS, 373; CT, 406; EGJ, 375; EMuc, 555; EMus, 515; FT, 9; HAA,
429; HLV, 432; KC, 85; KM, 4; Li, 226; Lu, 578; MSG, 162; MS, 803;
NT, 619; O, 180; Pa, 328; Pi, 283; Pr, 245; SNSE, 604; SSE, 701;
SITI, 187; Sp, 241; St, 359; Te, 361; Th, 653; U, 142; V, 156; WB,
755. ACC, adrenocortical carcinoma; BLCA, bladder urothelial
carcinoma; BRCA, breast invasive carcinoma; CESC, cervical squamous
cell carcinoma and endocervical adenocarcinoma; CHOL,
cholangiocarcinoma; COAD, colon carcinoma; DLBC, lymphoid neoplasm
diffuse large-B cell lymphoma; ESCA, esophageal carcinoma; GBM,
glioblastoma multiforme; HNSC, head and neck squamous cell
carcinoma; KICH, kidney chromophobe; KIRC, kidney renal clear cell
carcinoma; KIRP, kidney renal papillary cell carcinoma; LAML, acute
myeloid leukemia; LGG, brain lower grade glioma; LIHC, liver
hepatocellular carcinoma; LUAD, lung adenocarcinoma; LUSC, lung
squamous cell carcinoma; OV, ovarian serous cystadenocarcinoma;
PAAD, pancreatic adenocarcinoma; PCPG, pheochromocytoma and
paraganglioma; PRAD, prostate adenocarcinoma; READ, rectum
adenocarcioma; SKCM, skin cutaneous melanoma; STAD, stomach
adenocarcinoma; TGCT, testicular germ cell tumors; THCA, thyroid
carcinoma; THYM, thymoma; UCEC, uterine corpus endometrial
carcinoma; UCS, uterine carcinosarcoma. *P<0.05. |
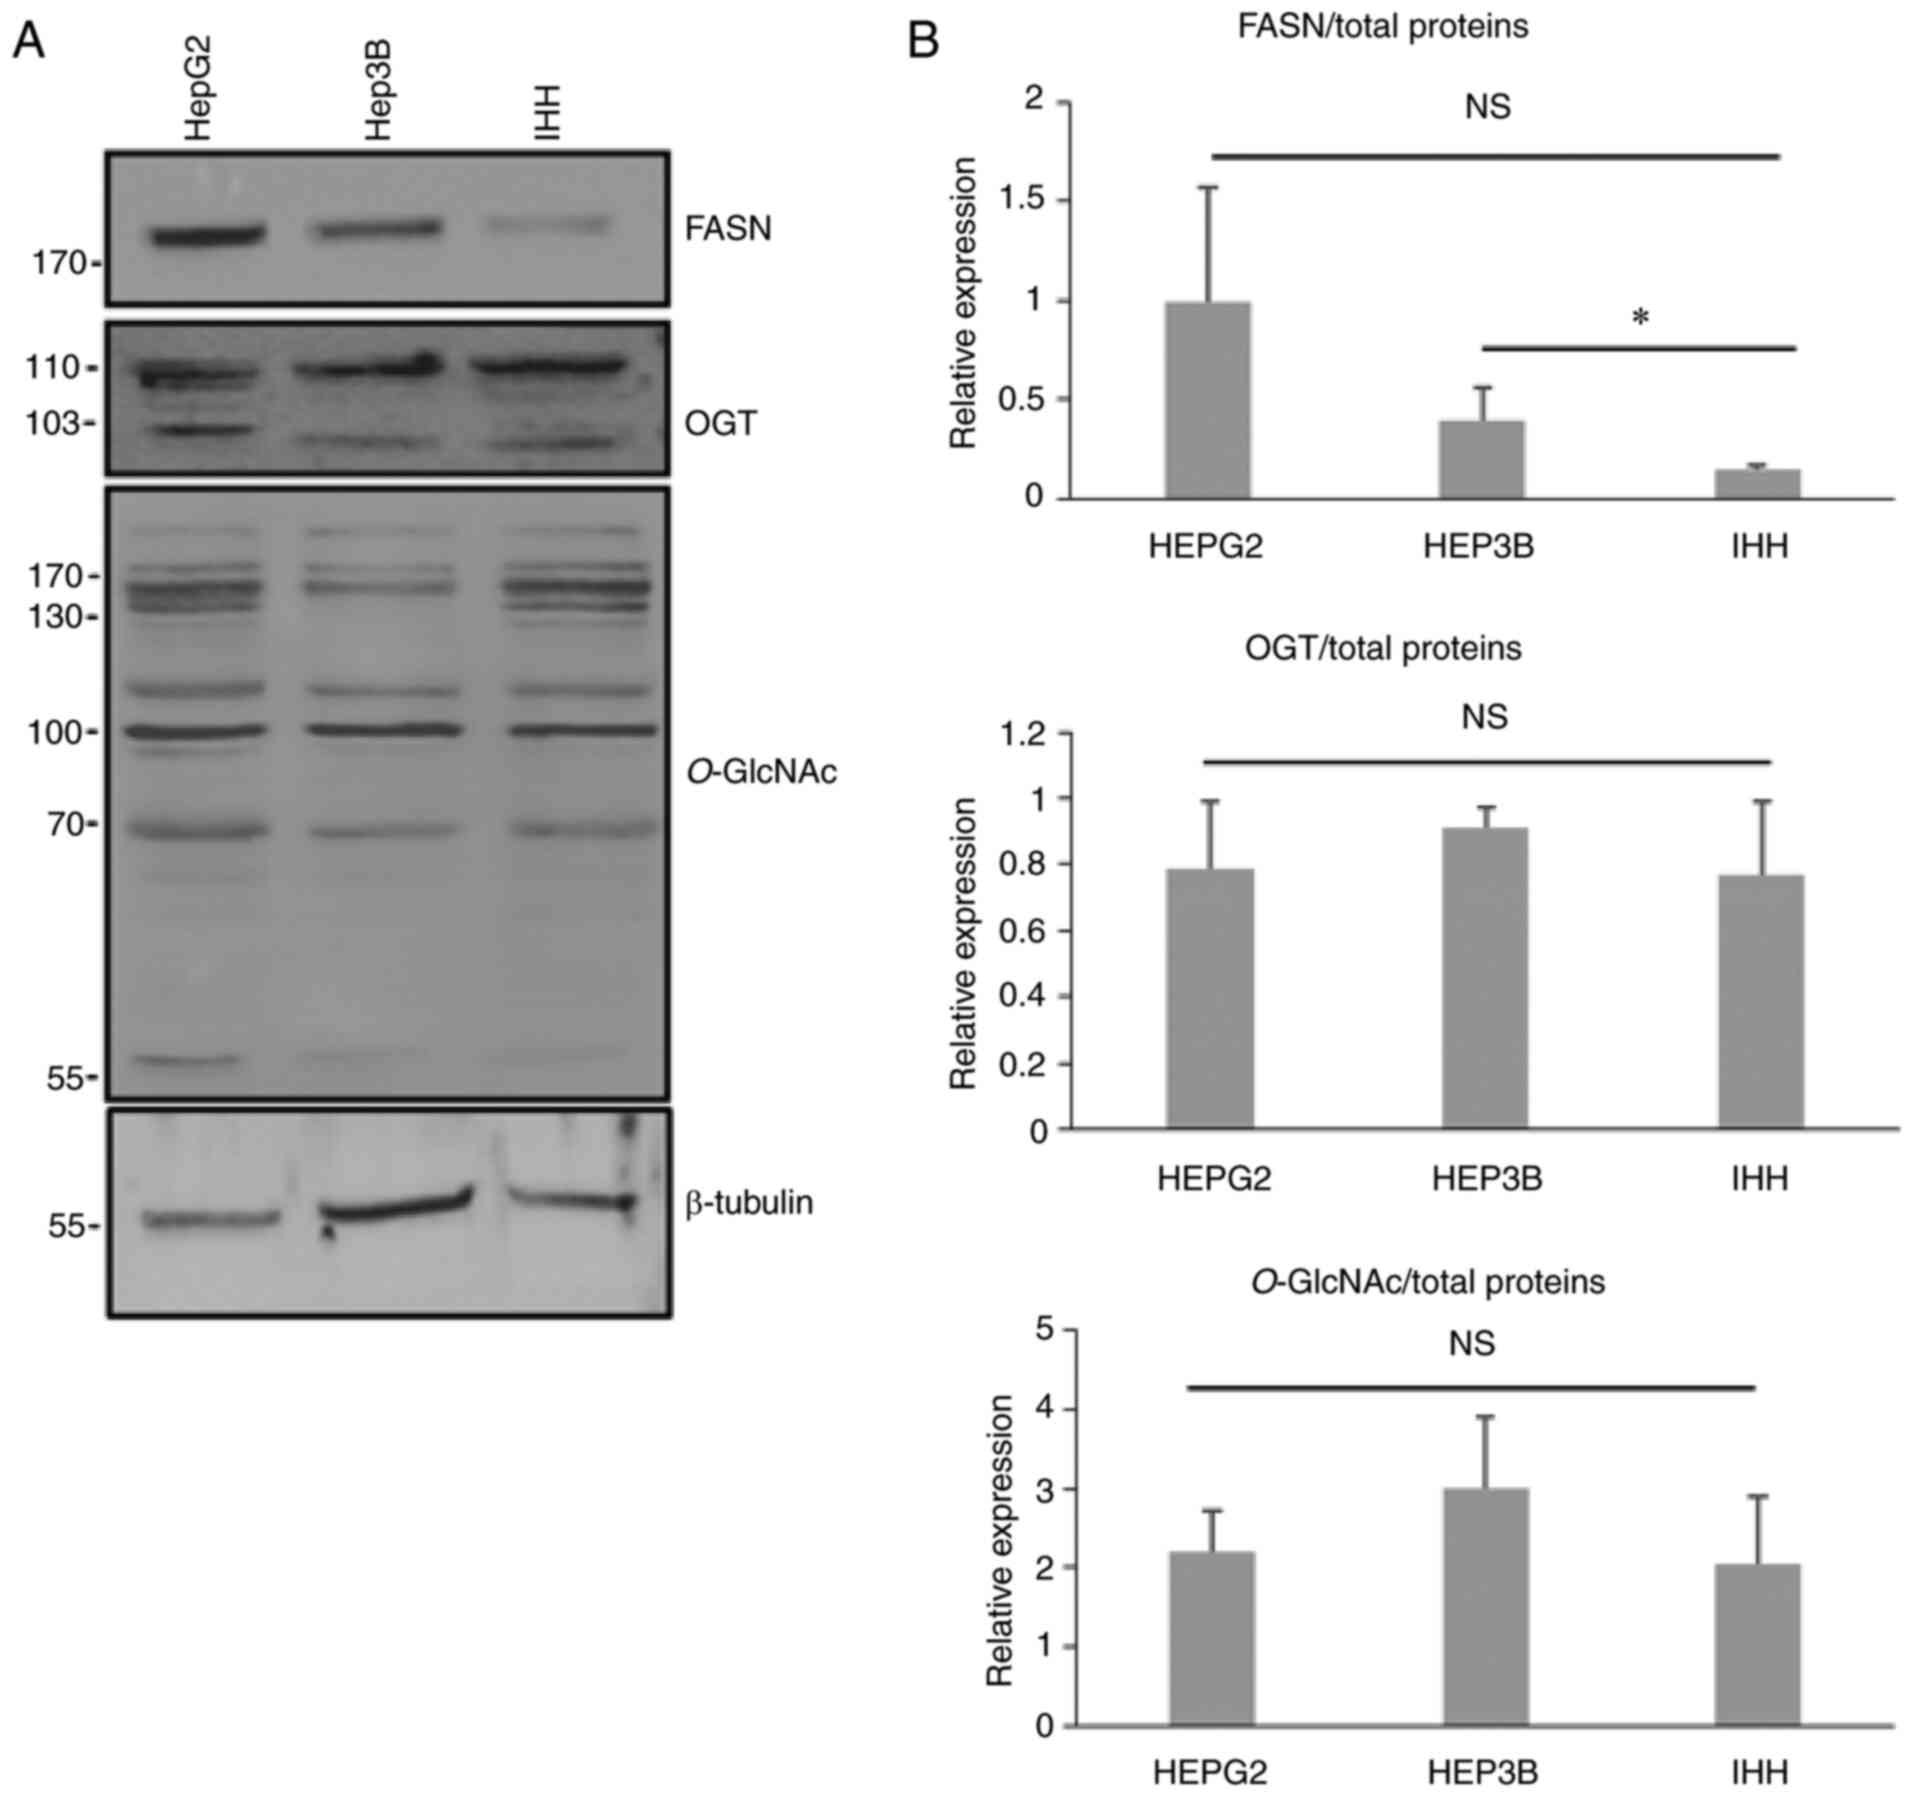
FASN is highly expressed in
cancer-derived cell lines compared with non-cancerous cell
lines
We analyzed the expression of FASN and OGT in the
three different cell lines derived from liver HepG2, Hep3B and IHH
by western blotting (Fig. 2). The
expression of FASN was more elevated in liver cancer cells compared
with IHH hepatocytes. While not significant for the HepG2 cells,
the P-value was equal to 0.06 when data were compared with the
non-cancerous cell line. No differences were found for
O-GlcNAcylation and OGT expression (Fig. 2).
FASN, OGT and O-GlcNAcylation
expression is higher in human liver cancer tissues and FASN
expression is correlated with activation of mTOR pathway
We analyzed the expression of FASN, OGT and
O-GlcNAcylation in liver cancerous and non-cancerous tissues
from 10 patients with moderately or well differentiated
hepatocellular carcinoma (6 men and 4 women; Table I). We observed that FASN protein
expression was more highly expressed in 6/10 tumor tissues when
compared with non-tumor-adjacent tissues (Fig. 3A). Despite this increasing trend,
there was no significant difference between tumor and non-tumoral
tissues due to the high variability of FASN expression between
patients (Fig. 3A and B). We
previously reported that FASN expression is partly dependent upon
the activation of the PI3K/AKT/mTOR pathway in hepatic cell lines
and in livers from two different mice models, obese mice (ob/ob)
and Phosphatase and tensin homolog-null mice (7). Like for FASN expression, we observed
a higher activation of mTOR in liver tumors, although it was not
significant due to the great inter-patient variability (Fig. 3A and B). Furthermore, FASN protein
expression was positively correlated with mTOR activation in
non-tumoral samples and corresponding cancer liver tissues as
presented by the correlation analysis (r=0.8387;
R2=0.7034; P-value=0.0024; Fig. 3C). However, the diversity of
non-cancerous tissues damaged by different lesions (portal
fibrosis, cirrhosis or normal phenotype) could explain at least
partly the great inter-patient variability observed (Fig. 3A and B). An increase in OGT
expression and a slight but significant increase in the
O-GlcNAc expression were observed in human liver cancer
tissues compared with non-cancerous tissues (Fig. 3A and B). The results from RT-qPCR
demonstrated a slight increase in FASN and SREBP mRNA expression.
Similar to the results from our previous study (7), OGT mRNA level tended to decrease in
liver cancer tissues compared with non-cancerous tissues (Fig. 3D). The level of transcripts
encoding FASN and OGT evolved in the same way as those found
following exploration of GEPIA2 (Fig.
1B).
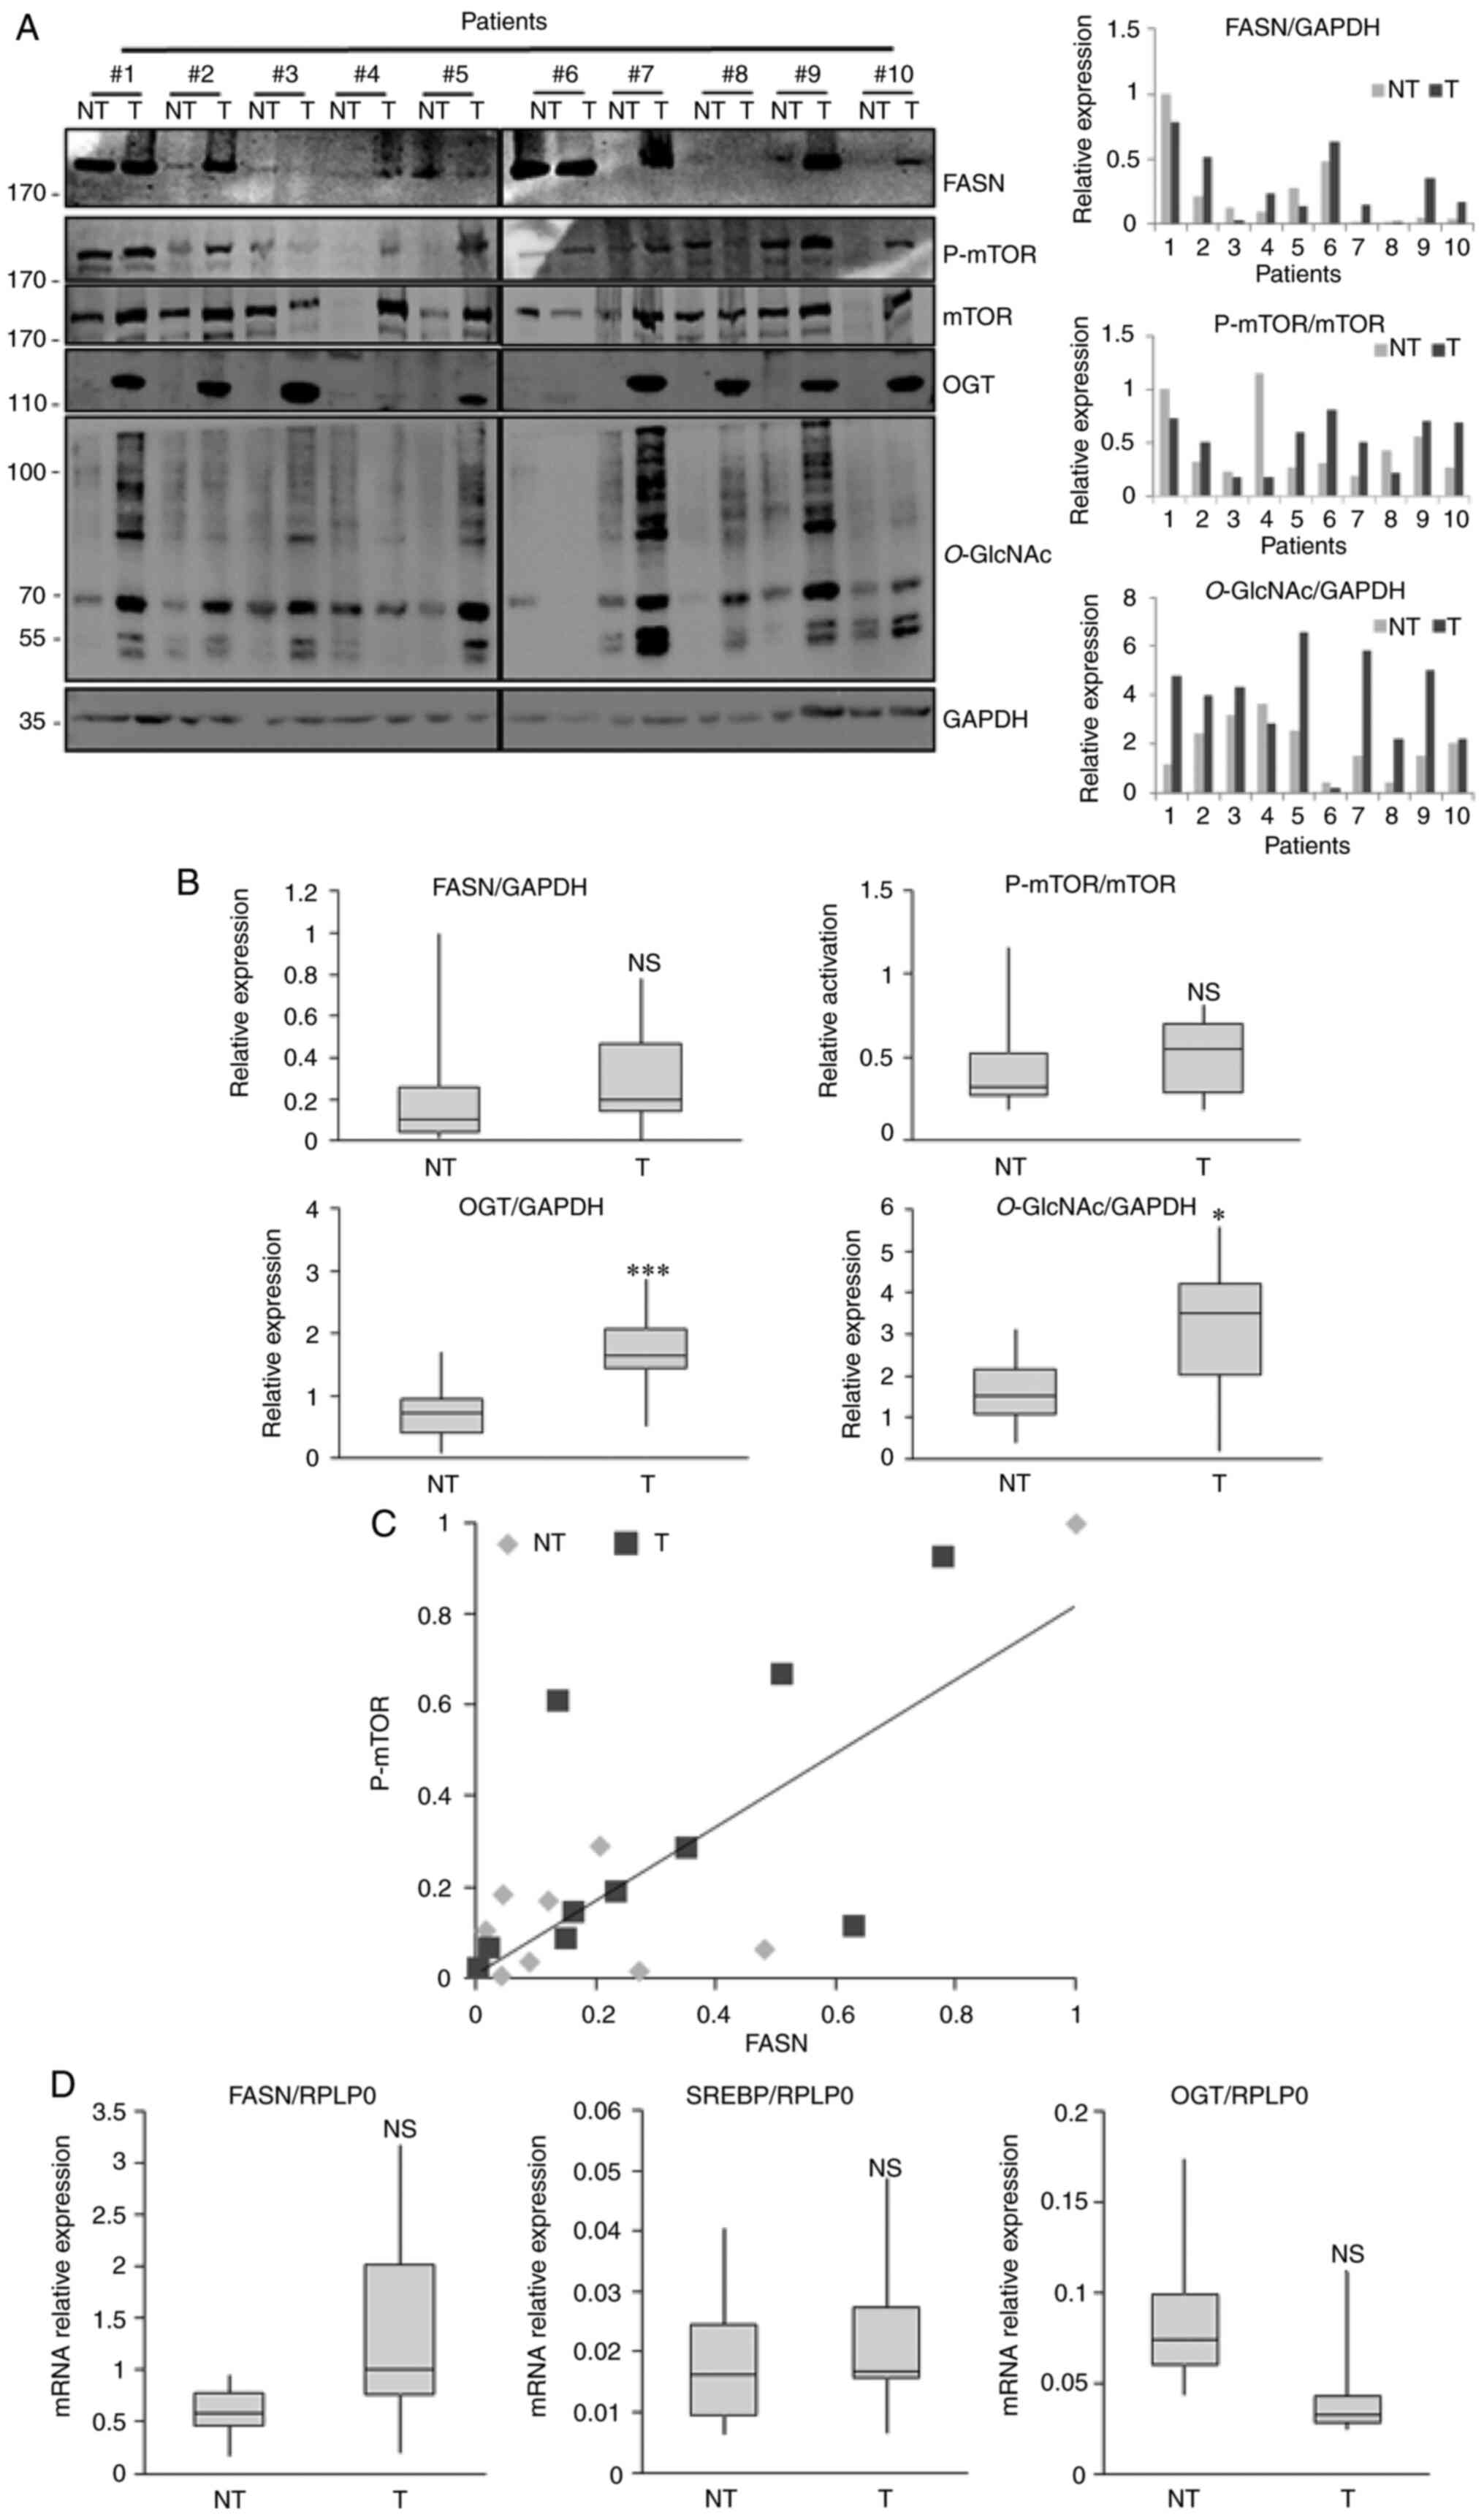 | Figure 3.Analysis of FASN, OGT and
O-GlcNAcylation expression and mTOR activation in human
liver cancer tissues by western blot and RT-qPCR. (A) Liver
explants from 10 patients with hepatocellular carcinoma vs.
non-tumoral adjacent tissues harboring various liver lesions were
analyzed for FASN, OGT, O-GlcNAc, p-mTOR and mTOR expression
by western blotting (left panel). Quantification of three
independent experiments from (A) left panel (right panel). (B)
Relative expression of FASN, OGT, O-GlcNAcylation and
activation of mTOR pathway from 10 human liver tumor tissues and
tumor-adjacent normal tissues. (C) Pearson correlation analysis
between FASN expression and mTOR activation. (D) mRNA expression of
OGT, FASN and SREBP measured by RT-qPCR. Values were normalized to
RPLP0. *P<0.05 and ***P<0.001. NT, non-tumoral; T, tumoral;
NS, non-significant; RT-qPCR, reverse transcription quantitative
PCR; FASN, fatty acid synthase; OGT, O-GlcNAc transferase;
mTOR, mechanistic/mammalian target of rapamycin; p, phosphorylated;
SREBP, sterol responsive element binding protein; RLP0, ribosomal
protein lateral stalk subunit P0. |
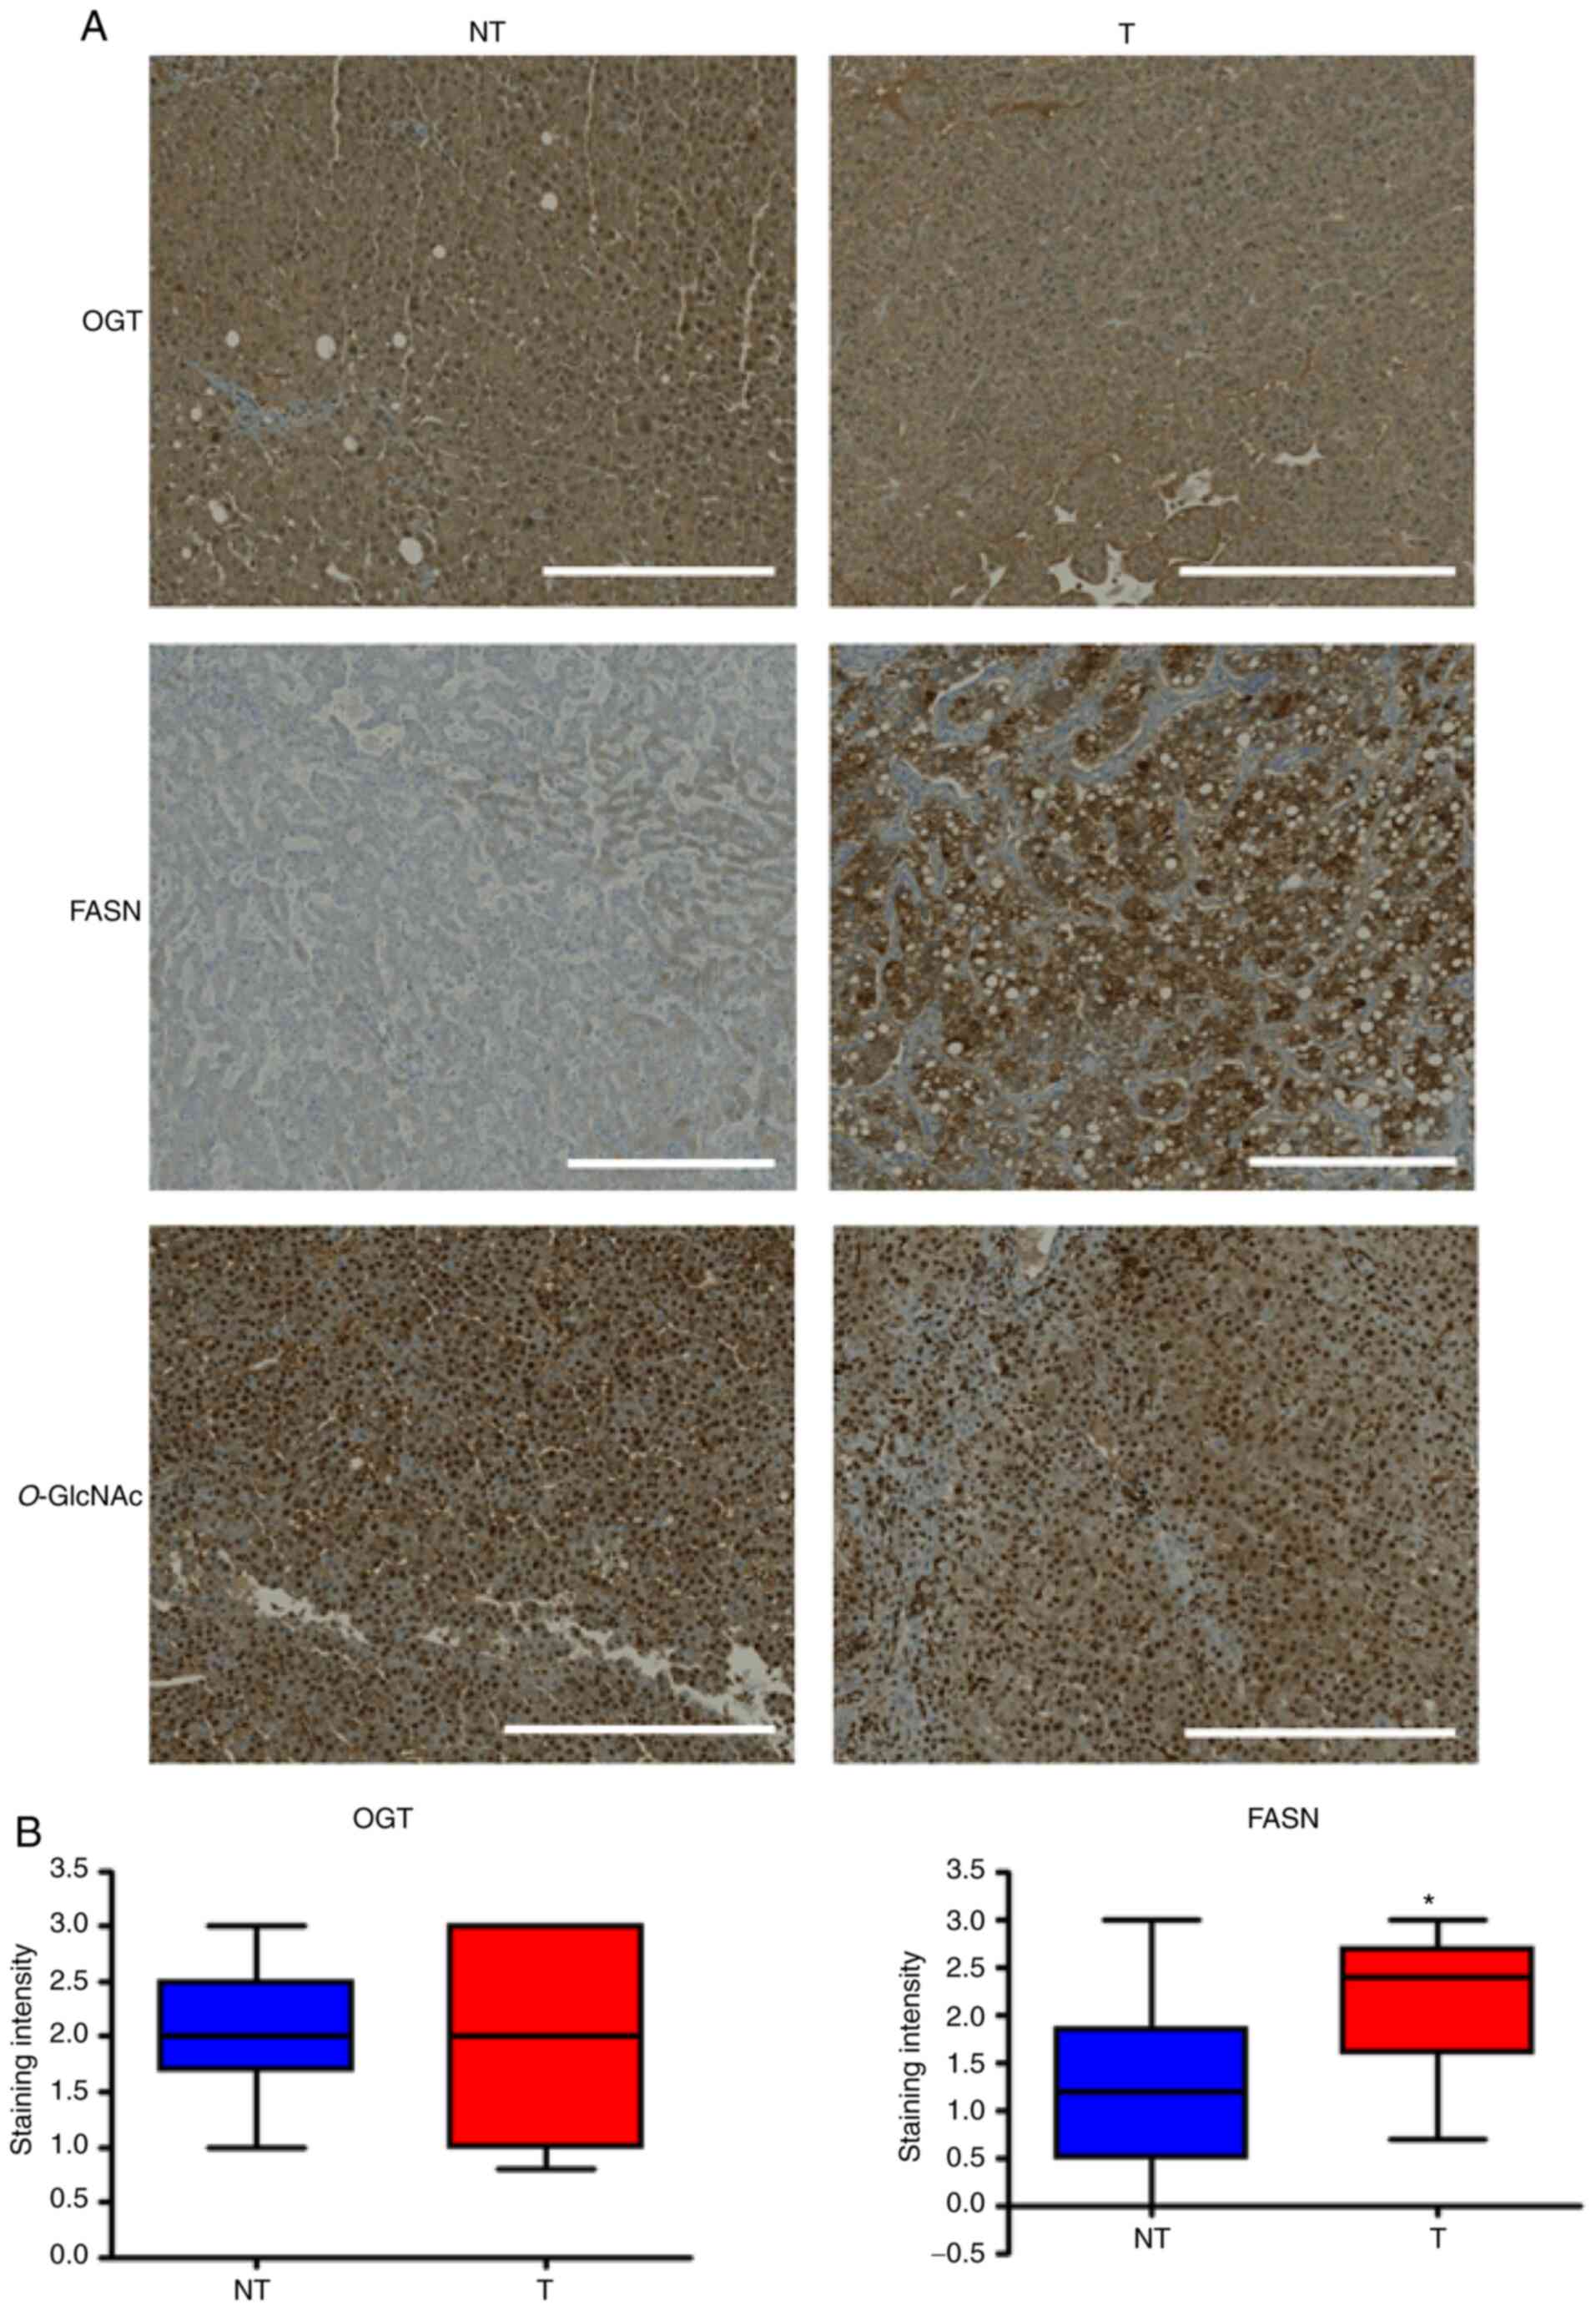
The expression of OGT, FASN and level of
O-GlcNAcylation in human HCC tissues were evaluated using
IHC. In the 10 patients with HCC, a strongest FASN staining was
observed in tumoral tissues compared with non-tumoral tissues
(2.2±0/21 in tumor tissues vs. 1.24±0.26 in normal tissues; P=0,02;
Fig. 4). FASN staining was mainly
localized in the cytoplasm of tumoral cells with a little
centrolobular increment of the intensity. No significative
difference was observed for OGT expression between tumoral and
non-tumoral tissues (2.06±0.27 in tumor tissues vs. 2.03±0.17 in
normal tissues; P=0,86). In both cases, the OGT strong staining was
localized both in the nucleus and cytoplasm of the hepatocytes and
was homogenous. Anti-O-GlcNAc staining was mainly nuclear.
Similar strong intensity was observed in the tumor and normal
tissues of the 10 patients with HCC (Fig. 4).
Discussion
Cancer is one of the leading causes of morbidity and
mortality worldwide. A growing body of evidence suggests that
abnormalities in cell metabolism are closely related to the
emergence and development of tumors. One of the aberrant metabolic
pathways of tumor cells is the synthesis of fatty acids. FASN is
the key enzyme involved in this process that provides energy for
sustained proliferation of tumor cells (14). Therefore, an increased level of
FASN has been observed in numerous cancers (3). FASN is also positively correlated
with the aggressive stage of cancer and the poor prognosis. This
increased lipogenesis provides cancer cells with some advantages in
terms of proliferation, metastasis, survival and resistance to
chemotherapy (15,16).
In a previous study from our laboratory on hepatic
lipogenesis, we reported that FASN is O-GlcNAcylated in a
nutrition-dependent manner (6).
The O-GlcNAcylation prevents the proteasomal degradation of
FASN and increases therefore its expression and subsequent
activity. In addition, we demonstrated in two independent studies
that FASN expression is dependent on the catalytic activity of OGT
and activation of mTOR in proliferating liver cancer cells, which
is believed to promote hepatic carcinogenesis (7), and that mTOR and
O-GlcNAcylation regulate each other (10) as previously described (9).
The present study demonstrated that FASN was more
strongly expressed in the human HCC cell lines HepG2 and Hep3B
compared with the immortalized human hepatocyte IHH cell line,
which was not the case for OGT. This observation contrasts with
what we previously observed in colon cell lines in which the
glycosyltransferase is higher for cancer cell lines (17), and with Reginato's group for breast
cancer cells (18). Thus,
generalizing the elevation of OGT and O-GlcNAcylation in all
cell types should not be done and a case-by-case study is
essential. Furthermore, the use of a normal liver cell line such as
THLE-3 would be helpful in a near future to push forward our
investigations on this topic.
The present study also focused on the evaluation of
FASN, OGT and O-GlcNAc expression and the activation of mTOR
in 10 human HCC and non-tumoral adjacent tissues from 6 men and 4
women. By using western blotting, we demonstrated that, conversely
to hepatic cell lines, the expression of OGT and
O-GlcNAcylation was strongly elevated in liver cancer
tissues compared with non-tumoral tissues, as previously
demonstrated in colon tissues (19). It was previously reported by IHC
that O-GlcNAcylation is significantly elevated in HCC
tissues from patients treated with liver transplantation compared
with health liver tissues (20),
and that OGT and O-GlcNAcylation levels are higher in colon
tumor tissues compared with tumor-adjacent normal tissues (19). In the liver cancer and adjacent
non-tumoral tissues form the present study, no correlation between
OGT mRNA and protein levels was reported; however, a decreasing
trend was observed in OGT mRNA level. Regarding FASN protein
expression, the results demonstrated that FASN was more highly
expressed in 6 out of the 10 liver tumor tissues compared with
non-tumor-adjacent tissues. Although the tendency to increase was
the same, a high variability on FASN expression between patients
was observed, which was probably due to the different types of
liver lesion in the tissues (portal fibrosis or cirrhosis vs.
normal phenotype). Thus, while non-significant, there was an
increase in FASN expression between liver cancer tissues and
non-tumoral tissues, these differences being highly heterogeneous
from one patient to another. The mRNA encoding SREBP was also
evaluated, which is the master transcription factor driving FASN
expression. While transcripts level tended to increase, no
significant changes was noticed, which was in accordance with our
previous study (7). Overall, no
sex differences regarding FASN, OGT and O-GlcNAc expression
or activation of the mTOR pathway were observed in the present
study. Furthermore, no difference was observed between the
non-tumor tissues either, regardless of the lesion (portal fibrosis
or cirrhosis vs. normal phenotype). However, a larger number of
patients would help reinforcing these observations.
At the molecular level, we previously demonstrated
that FASN depends on both catalytic activities of OGT and mTOR in
liver proliferative cancer cells (7). Although the total level of mTOR can
vary between patients, the present study demonstrated that FASN
expression was correlated with the activation of mTOR pathway
rather than with O-GlcNAcylation, conversely with what we
formerly reported in cultured cells (7). These findings were in accordance with
a previous study claiming that mTOR activation is highly variable
in human liver tissues (21). In
addition, we showed in a precedent paper that blocking FASN with
the small-molecule inhibitor C75 can inhibit mTOR activation as
well as OGT level and activity in HepG2 liver cancer cells, thus
reducing cancer cell proliferation (7). These findings suggested that
tumor-associated FASN, by conferring growth and survival advantages
rather than functioning as an anabolic energy-storage pathway, may
necessarily be associated with the history of human cancers.
By using IHC, increase in FASN expression in tumoral
tissues compared with non-tumoral tissues was correlated with the
non-significant increase of mRNA level in tumoral tissues. However,
the lack of OGT significant difference in contrast with the western
blotting results could have been attributed to a default of protein
extraction during western blot or/and a resistance to antibodies
penetrance in IHC. It would be of particular interest to confront
these results to a staining of FASN and OGT in fibrotic or
cirrhotic but non-cancerous liver samples, in order to focus only
on the impact of these lesions on the expression of the two
enzymes.
In summary, the present study demonstrated that
increased FASN expression was associated with tumorigenesis,
although the low number of tumor samples used was a limitation. The
use of a larger cohort of patients will therefore be one of our
priorities in future investigation. The expression of this
key-metabolic enzyme was also correlated with mTOR pathway
activation and more partially with OGT activity, both being known
to be increased in human cancers. The results from the present
study also highlighted that the analysis of identical samples by
different experimental strategies could result in notable
differences in interpretation, thus reinforcing the need to use
different methods of analysis when studying tissues that are more
complex than cell lines in culture.
Acknowledgements
The authors would like to thank Dr. Amélie
Decourcelle (Université de Lille, CNRS, Inserm, CHU Lille,
UMR9020-U1277-CANTHER-Cancer Heterogeneity, Plasticity and
Resistance to Therapies, F-59000 Lille, France) for her help
preparing liver lysates from patients. The authors would also like
to thank Dr. Sylvie Janas, Dr. Laurence Wicquart and Professor
Emmanuelle Leteurtre, scientific manager of the tumorotheque
ALLIANCE-CANCER (Centre de Biologie-Pathologie, Lille) for
providing the patient tissues.
Funding
This research was supported by the University of Lille, the
‘Centre National de la Recherche Scientifique (CNRS)’ and the Ligue
Nationale Contre le Cancer (grant nos. 215348 and 215586 for comité
du Nord). SR is a recipient of a fellowship from the ‘Ministère de
l'Enseignement Supérieur et de la Recherche’ and from the ‘Région
Hauts-de-France’.
Availability of data and materials
All data generated or analyzed during this study are
included in this published article.
Authors' contributions
NJ, IEYB and TL conceptualized the study. SR, NV and
BD designed the methodology. SR, NV and BD performed the
experiments. SR, PR, NJ and TL analyzed the data. SR and TL wrote
the manuscript. All authors reviewed, read and approved the final
manuscript. TL supervised the study. NJ, IEYB and TL confirm the
authenticity of all the raw data.
Ethics approval and consent to
participate
This study (approval no. CSTMT276) was approved by
the relevant ethics committee (ALLIANCE-CANCER Tumorotheque-DC
2008–620) on December 2, 2020. Patients provided writing informed
consent for the use of their samples in scientific research.
Patient consent for publication
Not applicable.
Competing interests
The authors declare that they have no competing
interests.
Glossary
Abbreviations
Abbreviations:
|
FASN
|
fatty acid synthase
|
|
GlcNAc
|
N-acetylglucosamine
|
|
HCC
|
hepatocellular carcinoma
|
|
IHH
|
immortalized human hepatocytes
|
|
mTOR
|
mechanistic/mammalian target of
rapamycin
|
|
OGA
|
O-GlcNAcase
|
|
OGT
|
O-GlcNAc transferase
|
|
SREBP
|
sterol responsive element binding
protein
|
References
|
1
|
Smith S, Witkowski A and Joshi AK:
Structural and functional organization of the animal fatty acid
synthase. Prog Lipid Res. 42:289–317. 2003. View Article : Google Scholar : PubMed/NCBI
|
|
2
|
Swinnen JV, Van Veldhoven PP, Timmermans
L, De Schrijver E, Brusselmans K, Vanderhoydonc F, Van de Sande T,
Heemers H, Heyns W and Verhoeven G: Fatty acid synthase drives the
synthesis of phospholipids partitioning into detergent-resistant
membrane microdomains. Biochem Biophys Res Commun. 302:898–903.
2003. View Article : Google Scholar : PubMed/NCBI
|
|
3
|
Menendez JA and Lupu R: Fatty acid
synthase and the lipogenic phenotype in cancer pathogenesis. Nat
Rev Cancer. 7:763–777. 2007. View
Article : Google Scholar : PubMed/NCBI
|
|
4
|
Hanover JA, Yu S, Lubas WB, Shin SH,
Ragano-Caracciola M, Kochran J and Love D: Mitochondrial and
nucleocytoplasmic isoforms of O-linked GlcNAc transferase encoded
by a single mammalian gene. Arch Biochem Biophys. 409:287–297.
2003. View Article : Google Scholar : PubMed/NCBI
|
|
5
|
Fardini Y, Dehennaut V, Lefebvre T and
Issad T: O-GlcNAcylation: A New cancer hallmark? Front Endocrinol
(Lausanne). 4:992013. View Article : Google Scholar : PubMed/NCBI
|
|
6
|
Baldini SF, Wavelet C, Hainault I, Guinez
C and Lefebvre T: The nutrient-dependent O-GlcNAc modification
controls the expression of liver fatty acid synthase. J Mol Biol.
428:3295–3304. 2016. View Article : Google Scholar : PubMed/NCBI
|
|
7
|
Raab S, Gadault A, Very N, Decourcelle A,
Baldini S, Schulz C, Mortuaire M, Lemaire Q, Hardivillé S,
Dehennaut V, et al: Dual regulation of fatty acid synthase (FASN)
expression by O-GlcNAc transferase (OGT) and mTOR pathway in
proliferating liver cancer cells. Cell Mol Life Sci. 78:5397–5413.
2021. View Article : Google Scholar : PubMed/NCBI
|
|
8
|
Bar-Peled L and Sabatini DM: Regulation of
mTORC1 by amino acids. Trends Cell Biol. 24:400–406. 2014.
View Article : Google Scholar : PubMed/NCBI
|
|
9
|
Sodi VL, Khaku S, Krutilina R, Schwab LP,
Vocadlo DJ, Seagroves TN and Reginato M: mTOR/MYC axis regulates
O-GlcNAc transferase expression and O-GlcNAcylation in breast
cancer. Mol Cancer Res. 13:923–933. 2015. View Article : Google Scholar : PubMed/NCBI
|
|
10
|
Very N, Steenackers A, Dubuquoy C, Vermuse
J, Dubuquoy L, Lefebvre T and El Yazidi-Belkoura I: Cross
regulation between mTOR signaling and O-GlcNAcylation. J Bioenerg
Biomembr. 50:213–222. 2018. View Article : Google Scholar : PubMed/NCBI
|
|
11
|
Magaway C, Kim E and Jacinto E: Targeting
mTOR and metabolism in cancer. Lessons and innovations. Cells.
8:15842019. View Article : Google Scholar : PubMed/NCBI
|
|
12
|
Hua H, Kong Q, Zhang H, Wang J, Luo T and
Jiang Y: Targeting mTOR for cancer therapy. J Hematol Oncol.
12:712019. View Article : Google Scholar : PubMed/NCBI
|
|
13
|
Livak KJ and Schmittgen TD: Analysis of
relative gene expression data using real-time quantitative PCR and
the 2(−Delta Delta C(T)) method. Methods. 25:402–408. 2001.
View Article : Google Scholar : PubMed/NCBI
|
|
14
|
Baldini SF and Lefebvre T: O-GlcNAcylation
and the metabolic shift in high-proliferating cells: All the
evidence suggests that sugars dictate the flux of lipid biogenesis
in tumor processes. Front Oncol. 6:62016. View Article : Google Scholar : PubMed/NCBI
|
|
15
|
Huang C and Freter C: Lipid metabolism,
apoptosis and cancer therapy. Int J Mol Sci. 16:924–949. 2015.
View Article : Google Scholar : PubMed/NCBI
|
|
16
|
Menendez J and Lupu R: Fatty acid synthase
(FASN) as a therapeutic target in breast cancer. Expert Opin Ther
Targets. 21:1001–1016. 2017. View Article : Google Scholar : PubMed/NCBI
|
|
17
|
Steenackers A, Olivier-Van Stichelen S,
Baldini SF, Dehennaut V, Toillon RA, Le Bourhis X, El
Yazidi-Belkoura I and Lefebvre T: Silencing the nucleocytoplasmic
O-GlcNAc transferase reduces proliferation, adhesion, and migration
of cancer and fetal human colon cell lines. Front Endocrinol
(Lausanne). 7:462016. View Article : Google Scholar : PubMed/NCBI
|
|
18
|
Caldwell SA, Jackson SR, Shahriari KS,
Lynch TP, Sethi G, Walker S, Vosseller K and Reginato MJ: Nutrient
sensor O-GlcNAc transferase regulates breast cancer tumorigenesis
through targeting of the oncogenic transcription factor FoxM1.
Oncogene. 29:2831–2842. 2010. View Article : Google Scholar : PubMed/NCBI
|
|
19
|
Olivier-Van Stichelen S, Dehennaut V, Buzy
A, Zachayus JL, Guinez C, Mir AM, El Yazidi-Belkoura I, Copin MC,
Boureme D, Loyaux D, et al: O-GlcNAcylation stabilizes β-catenin
through direct competition with phosphorylation at threonine 41.
FASEB. 28:3325–3338. 2014. View Article : Google Scholar : PubMed/NCBI
|
|
20
|
Zhu Q, Zhou L, Yang Z, Lai M, Xie H, Wu L,
Xing C, Zhang F and Zheng S: O-GlcNAcylation plays a role in tumor
recurrence of hepatocellular carcinoma following liver
transplantation. Med Oncol. 29:985–993. 2012. View Article : Google Scholar : PubMed/NCBI
|
|
21
|
Meng Z, Li T, Ma X, Wang X, Van Ness C,
Gan Y, Zhou H, Tang J, Lou G, Wang Y, et al: Berbamine inhibits the
growth of liver cancer cells and cancer-initiating cells by
targeting Ca2+/calmodulin-dependent protein kinase II.
Mol Cancer Ther. 12:2067–2077. 2013. View Article : Google Scholar : PubMed/NCBI
|