Introduction
Glioblastoma (GB) is widely known as the most
frequent and lethal primary brain tumor affecting adults. The
overall survival rate of patients with GB does not exceed 15
months. The prevalence of GB is significantly higher among males
than females at a ratio of 1.6/1 (1); this sex-dependent difference may
indicate a role of sex hormones in the incidence and progression of
GB, in particular as regards 17 β-estradiol (E2), which is the most
potent estrogen, and which has been most frequently studied in this
context (2). E2 promotes cell
proliferation, migration and invasion in human GB (2–4).
However, E2 has been reported to exert diverse effects on GB,
depending on the concentration (3,5) and
the predominant signaling of the intracellular receptor subtype
[estrogen receptor α (ERα) and β (ERβ)]. In general, the prevalence
of ERα signaling has been found to be associated with GB
progression, while E2 signaling by ERβ has been shown to be
associated with anti-neoplastic effects (3,6,7),
González-Arenas et al (3)
demonstrated that ERα and not ERβ activation increased the
proliferation of human astrocytoma-derived cells. More recently,
Hernández-Vega et al (6)
described that ERα activity, in contrast to ERβ activity, promoted
epithelial-mesenchymal transition (EMT) in human GB cells.
Signaling pathways of E2 can also proceed through G-protein coupled
estrogen receptor (GPER), a seven-transmembrane domain protein that
leads to rapid effects, independently of gene transcription. In
1996, the orphan GPCR30 was discovered (GPR30) (8). In a subsequent study, estrogen
binding to GPR30 was reported; therefore, it was renamed as GPER
(9). Following ligand binding,
GPER signaling proceeds through various non-genomic pathways
(10). The protective effects of
GPER against brain injury have been reported. In primary cortical
neuron cultures, GPER activation has been shown to exert
neuroprotective effects against excitotoxic stimuli (11). Notably, there is evidence of
cross-regulation between intracellular and membrane E2 receptors
(ERα, ERβ and GPER) (12). In
zebrafish, the process of vitellogenesis is regulated by ERα and
its interaction with ERβ and GPER (13). In human renal tubule epithelial
cells, E2 increases proliferation through the co-operative actions
between ERα and GPER (14). This
phenomenon extends to the context of cancer, where the interplay
between GPER and ERα in promoting tumor progression has also been
observed (15).
The role of GPER in cancer has been studied in
various malignancies. In ovarian cancer, the high expression of
GPER has been found to be associated with a poor survival rate
(16). In triple-negative breast
cancer, GPER/ERK signaling has been shown to promote tumor
progression (11,17). In human lung cancer cells, the
GPER/EGFR/ERK1/2 pathway induces the upregulation of matrix
metalloproteinases, proteins essential in invasion and metastasis
(18). Avino et al
(19) reported that insulin-like
growth factor-I (IGF-I)/IGF-I receptor (IGF-IR) and GPER functioned
together to promote migration in mesothelioma and lung cancer.
However, in the context of GB development, evidence of the
regulation and functions of GPER is limited. Recently, Hirtz et
al (20) reported GPER protein
expression in the human GB-derived cell lines, U251 and LN229. In
the present study, the expression of GPER in U251, U87, LN229 and
T98 human GB-derived cell lines was evaluated at the mRNA and
protein levels and GPER subcellular localization was determined. It
was also examined whether E2 could regulate GPER expression by
identifying two estrogen response elements (EREs) in the GPER
promoter through an in silico analysis, and the regulation
of GPER expression by E2 in GB-derived cell lines was determined.
Furthermore, potential GPER structure models for molecular docking
of the predicting binding sites for E2 and the synthetic GPER
ligand, G1, were obtained by an in silico analysis.
Materials and methods
Cell culture and treatments
The U251 astrocytoma cell line, the LN229 (CRL-2611)
and T98G (CRL-1690) glioblastoma cell lines, and the U87 cell line
(HTB-14, glioblastoma of unknown origin) were purchased from the
American Type Culture Collection (ATCC). The U251 and U87 cell
lines were previously authenticated by the authors using STR
profiling. All cells were cultured up to 25–30 passages, evaluating
morphological characteristics maintenance and monitoring routinely
for mycoplasma contamination (data not shown) by microscopic
examination. In addition, all cell lines were cultured in
Dulbecco's modified Eagle's medium (DMEM) with phenol red (Biowest)
supplemented with 10% fetal bovine serum (FBS), 1 mM sodium
pyruvate (Biowest), 0.1 mM non-essential amino acids (Invitrogen;
Thermo Fisher Scientific, Inc.), and 1 mM antibiotic (streptomycin
10 g/l; penicillin G 6.028 g/l; and amphotericin B 0.025 g/l,
Biowest, cat. no. L0010). Cells were incubated under standardized
conditions of 37°C, 95% air, 5% CO2 and 95% humidity.
Cells were cultured until a confluence of 70–80%. Afterwards, the
medium was changed to phenol red-free DMEM (Invitrogen; Thermo
Fisher Scientific, Inc.), supplemented with 10% hormone-free FBS,
0.1 mM non-essential amino acids (Invitrogen; Thermo Fisher
Scientific, Inc.), and 1 mM antibiotic, used for a 24-h cell
incubation. Subsequently, E2 (E4389, MilliporeSigma) or vehicle
(cyclodextrin; MilliporeSigma) were added at 1, 10, 100 nM and 1 µM
for 24 h, and total RNA or total protein extraction was
performed.
RNA extraction and reverse
transcription-quantitative polymerase chain reaction (RT-qPCR)
RNA extraction from U251, U87, LN229 and T98 cell
lines was performed using TRIzol® reagent (Invitrogen;
Thermo Fisher Scientific, Inc.) following the manufacturer's
instructions. Total RNA of healthy human astrocytes (HA) obtained
from ScienCell Research Laboratories, Inc. was used to compare GPER
mRNA levels. A total of one µg of total RNA was used to synthesize
the first-strand cDNA in a reaction with M-MLV reverse
transcriptase (Thermo Fisher Scientific, Inc. cat. no. 28025013)
following the manufacturer's protocol. GPER relative expression to
the 18S ribosomal RNA (rRNA) was determined using RT-qPCR with
standardized primers for GPER (21) as follows: Forward,
5′-TCACGGGCCACATTGTCAACCTC-3′ and reverse,
5′-GCTGAACCTCACATCCGACTGCTC-3′; 18S forward,
5′-AGTGAAACTGCAATGGCTC-3′ and reverse, 5′-CTGACCGGGTTGGTTTTGAT-3′.
For RT-qPCR, the FastStart D.N.A. Master SYBR-Green I kit (Roche
Diagnostics GmbH) was used to perform amplification in the Light
Cycler 2.0 (Roche Diagnostics). The following thermocycling
conditions were applied for RT-qPCR: 95°C for 10 min, followed by
35 amplification cycles of 95°C for 10 min, 62°C for 10 sec, and
72°C for 10 sec. The relative expression of the GPER gene was
calculated, considering the 18S rRNA gene as an endogenous
expression control reference. Relative expression was quantified
using the comparative method of 2−ΔΔCq (22,23).
Protein extraction and western blot
analysis
The content of GPER protein was determined using
western blot analysis in U251, U87, LN229 and T98 cell lines.
Following the treatments (E2 1, 10, 100 nM and 1 µM), cells were
homogenized in RIPA buffer with a cocktail of protease inhibitors
(MilliporeSigma). Proteins were obtained by centrifugation at
16,500 × g at 4°C for 5 min and quantified using the NanoDrop 2000
spectrophotometer (Thermo Fisher Scientific, Inc.). Also, a total
HA protein extract from ScienCell Research Laboratories, Inc. (cat.
no. 1806) was used. A total protein quantity of 30 µg per lane was
loaded on a 12% polyacrylamide gel under denaturing conditions for
protein separation. Proteins were transferred to a nitrocellulose
membrane (Bio-Rad, cat. no. 1620115) under semi-dry conditions for
45 min at 25 V. Blocking was completed with 5% bovine serum albumin
(BSA; Gold Biotechnology) at 37°C for 2 h. Membranes were incubated
with the primary antibody against GPER (1:400; cat. no. ab39742;
Abcam) at 4°C for 48 h. As a loading control, the α-tubulin protein
content (1:1,000, at 4°C for 24; sc-398103, Santa Cruz
Biotechnology, Inc.) was determined. Subsequently, all membranes
were incubated with the anti-rabbit IgG (1:10,000; cat. no.
1858415; Thermo Fisher Scientific, Inc.) or anti-mouse IgGMκ
(1:10,000; cat. no. sc-516102; Santa Cruz Biotechnology, Inc.)
secondary antibodies at room temperature for 45 min, with shaking.
The secondary antibodies were removed, and the membranes were
washed (TBS with 0.1% Tween). Finally the signal was detected with
Super Signal West Femto Maximum Sensitivity Substrate (Thermo
Fisher Scientific, Inc.) and quantified. Densitometric analysis of
the western blot bands was performed with Image J 1.45S software
(National Institutes of Health, USA). The content of GPER was
normalized concerning the α-tubulin.
Immunofluorescence
A total number of 15×103 U87 cells per
well were seeded on coverslips in DMEM medium (Invitrogen, Thermo
Fisher Scientific, Inc.) supplemented with 10% FBS, 1 mM pyruvate,
2 mM glutamine, and 0.1 mM non-essential amino acids (Gibco; Thermo
Fisher Scientific, Inc.) and with 1% penicillin/streptomycin at
37°C with 5% CO2. Following a 24-h incubation, the
medium was changed with DMEM medium without phenol red, FBS and
antibiotics. Afterwards, following a further 24-h incubation in
this medium, the cells were incubated in a blocking solution (PBS
with 1% BSA, MilliporeSigma) at 37°C for 20 min. Some experiments
were performed in permeabilized conditions by adding 0.2% Triton
(MilliporeSigma). Subsequently, the cells were incubated with a
polyclonal rabbit anti-GPER (1:350; cat. no. ab39742; Abcam) in a
PBS solution with 1% glycine (MilliporeSigma) and 1% BSA
(MilliporeSigma) for 24 h. Upon the removal of the primary
antibody, the cells were washed with PBS and incubated with
568-conjugated goat anti-rabbit IgG (1:400; Thermo Fisher
Scientific, Inc.) at room temperature for 60 min. The cells were
then washed and incubated with Hoechst (1 mg/ml; 33342, Thermo
Scientific, USA) at room temperature for 7 min. Finally, the cells
were washed and mounted in Aqua-Poly/Mount medium (cat. no. 18606;
Polysciences, Inc.). Slides were observed under a Nikon A1R
confocal microscope. Four different arbitrary fields were captured
for all experimental conditions, and a Z-reconstruction with an
orthogonal and 3D projection was obtained at a total magnification
of ×600. Fluorescence intensity analysis of the images was
performed with ImageJ® 1.45S software (National
Institutes of Health). At least three cells per field were
analyzed. To calculate the fluorescence intensity, the formula of
corrected total cell fluorescence (CTCF)was used: CTCF=integrated
density-(area of selected cell × average background fluorescence)
(24). The percentage of the GPER
positive area included the regions of interest (ROIs) in each cell
analyzed. Negative control with the use of secondary antibody only
was also performed.
Prediction of EREs
The GPER gene sequence was obtained from the
National Center for Biotechnology Information (NCBI) database,
entry NC_000007.14: 1085755-1094865, by using the entire promoter
region for analysis. Probability matrices for EREs were obtained
from the JASPAR (25), HOMER
(26) and HOCOMOCO (27) platforms. Data were analyzed using
the TFBSTools package (28) for R
v4.0.2 on windows. Sites with a score ≥0.9 and predicted by at
least two matrices were considered as possible EREs. The generated
bed files were visualized using Integrative Genomics Viewer v2.8.7
software (Broad Institute) (29).
Molecular modeling of GPER and
docking
The amino acid sequence of GPER was obtained from
the UniProtKB database (Q99527, GPER1_HUMAN). A non-redundant
alignment was performed using the Protein Data Bank (PDB) database
on the Blast-P platform (NCBI), determining three templates in
total. Two templates belonged to bovine Rhodopsin crystallographic
structures with PDB (entries 1F88 and 1HZX, respectively), with an
identity percentage of 23.4%, and one template belonged to a human
GPCR PDB (entry 6LFL) with 36.6% identity after alignment. These
three structures obtained from PDB were prepared for further use in
Chimera (30). For molecular
modeling by homology, Modeller software (31,32)
was used with a base script. A total of 50 models were obtained for
each one of the three obtained templates. Model validation was
carried out using the Hammer program (Rd. Hmmr) (33) in Linux and the Prosa-web server
(34), selecting the models with
the best score. The selected models were visualized with Visual
Molecular Dynamics (VMD) (35),
and representations of each model were obtained, indicating the
regions of interest in each structure. These models were prepared
in the Auto-Dock Tools (36) for
Linux distribution ubuntu 20.04 to obtain the pdbqt files with
rigid residues for subsequent use in docking analysis. E2 (ID:5757)
and
1-((3aS,4R,9bR)-4-(6-bromo-1,3-benzodioxol-5-yl)-3a,4,5,9b-tetrahydro-3H-cyclopenta
(c) quinolin-8-yl) ethanone, G1 (ID: 5322399) ligands were obtained
in sdf format from the PubChem (NCBI). The pdb files for these
ligands were obtained using the Open Babel v.2.3.1 (37). Subsequently, the structures of the
ligands were prepared using Chimera and Autodock Tools, acquiring
the pdbqt files for each ligand. At this point, blind docking was
performed by defining the Grid box for the entire extracellular
region using AutoDock 4 (38). The
parameter search was performed using a Lamarckian genetic algorithm
(LGA), and mean completeness (250,000) and 100 run poses were
determined. Finally, the data resulting from the clusters for the
conformations of each ligand in each model were evaluated, taking
as the best binding energy those values that presented the highest
number of conformations.
Statistical analysis
Data were analyzed using one-way ANOVA followed by
Tukey's multiple comparisons test. GraphPad Prism 5.0 software
(GraphPad Software, Inc.) was used to perform the statistical
analyses. Results are expressed as mean ± SEM (n=5). P<0.05 was
considered to indicate a statistically significant difference.
Results
Characterization of mRNA levels and
protein content of GPER in human astrocytoma and GB tumor cell
lines
To characterize the expression of GPER in four
GB-derived cell lines (U251, U87, LN229 and T98), mRNA levels and
protein content were measured using RT-qPCR and western blot
analysis, respectively. GPER mRNA and protein expression was
detected in all cell lines under common culture conditions
(Fig. 1A and B). The GPER mRNA
levels in HA were significantly higher than those in GB-derived
cell lines (Fig. 1A). At the
protein level, two bands corresponding to the reported molecular
weights of GPER (70 and 55 kDa) were detected (Fig. 1B). The presence of different GPER
isoforms has been shown to be related to receptor maturation
through N-glycosylation (39–41).
Densitometric analysis indicated that the U87 cells showed the
highest protein content of GPER in 55 kDa band) (Fig. 1B and C).
Subcellular localization of GPER in a
human GB-derived cell line
To further elucidate the subcellular localization of
GPER in GB cells, the U87 cells were evaluated (since these cells
demonstrated the highest GPER content according to Fig. 1B-D) by immunofluorescence and
confocal microscopy. In non-permeabilized cells, GPER was localized
in the plasma membrane and at the edge of the cell (Fig. 2A). By contrast, GPER was also
observed in the nucleus of permeabilized cells, as it colocalized
with Hoechst dye, as shown in (Fig.
2C). The CTCF indicated a higher fluorescence intensity in the
nucleus than in the cytoplasm of permeabilized cells (Fig. 2D). On the other hand, the analysis
of the GPER-positive area demonstrated a decreased distribution
percentage in the cell nucleus compared with the cytoplasm
(Fig. 2E).
 | Figure 2.Subcellular localization of GPER in
non-permeabilized and permeabilized U87 cells. (A) In
non-permeabilized cells, GPER aggregates (red) were mainly observed
at the edge of the cell and on the rest of the cell surface. In the
merged image, there was no presence of GPER in the nucleus (green);
likewise, in the orthogonal projection, in which the intersections
of the yellow lines corresponded to the point in the XZ, YZ. plane,
which confirmed that in the position of the nucleus there was no
presence of GPER (white arrows indicate the nucleus or cytoplasm).
(B) Total CTCF analysis of the positive and negative GPER areas in
the analyzed images. (C) GPER aggregates (red) were observed in the
nucleus and cytoplasm of permeabilized cells (white arrows indicate
the nucleus or cytoplasm). (D) CTFC analysis demonstrated a higher
fluorescence intensity of GPER was the nucleus than in the
cytoplasm. (E) Analysis of the subcellular distribution of the
GPER-positive area indicated a lower distribution percentage in the
nucleus than in the cytoplasm. Scale bar, 10 µM. Results are
expressed as the mean ± SEM, n=3 (***P<0.001 vs. negative GPER
or cytoplasm). GPER, G-protein coupled estrogen receptor; CTCF,
corrected total cell fluorescence. |
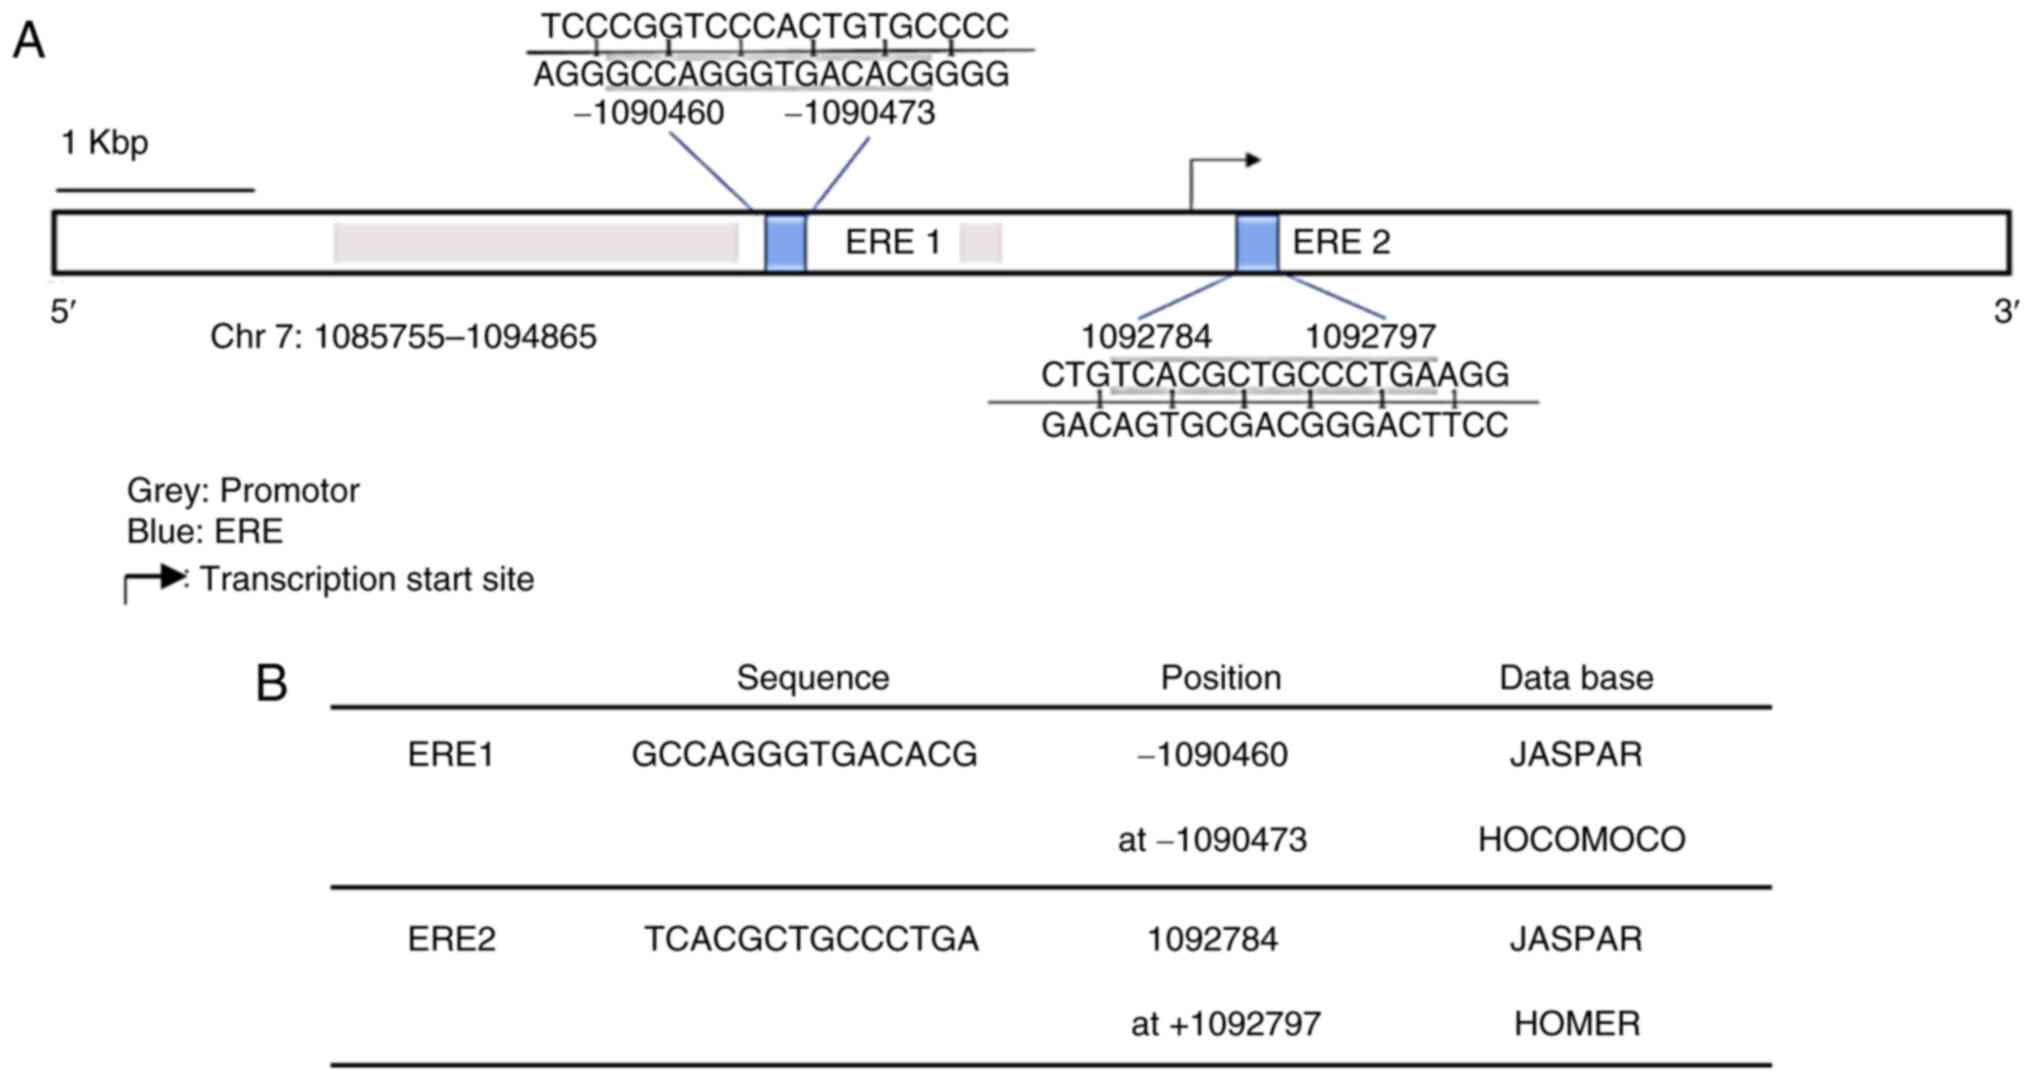
GPER promoter region contains two ERE
sequences
In order to investigate the potential effect of E2
on GPER expression in human GB cell lines, an in silico
analysis with TFBSTools was performed to identify EREs (28). The analysis indicated two potential
EREs with a score equal to or greater than 0.9 and whose sequences
were predicted in at least two of the three used matrices (JASPAR,
HOMER and HOCOMOCO). The sequences and position of these putative
binding sites are presented in Fig. 3A
and B.
E2 increases GPER expression in human
GB-derived cell lines
In order to evaluate whether E2 regulates GPER
expression in brain tumor cells, the U251, U87, LN229 and T98 cell
lines were treated with various E2 concentrations (1, 10 and 100
nM, and 1 µM). It is worth mentioning that in all experimental
conditions, including E2 treatments (under culture conditions with
phenol red-free DMEM and hormone-free FBS), the band corresponding
to the 70-kDa molecular weight was the most consistently detected
(Fig. S1). Therefore, it was used
for the analysis of GPER content following E2 treatments. The GPER
content (70 kDa) increased in the U251 and U87 cell lines treated
with E2 (10 nM) compared to the vehicle (Fig. 4A and B), while in the LN229 cell
line, GPER expression (70 kDa) increased following treatment with 1
µM E2 (Fig. 4C). In the T98G cell
line, E2 treatments did not induce any significant change in the
GPER content (Fig. 4D). These
results suggest that E2 differentially regulates the expression of
GPER in human brain tumor cell lines.
Molecular modeling of GPER
At present, there is no crystallographic structural
resolution of GPER, to the best of our knowledge. In order to
analyze the molecular characteristics of GPER in its
three-dimensional conformation in silico and suggest in
vivo receptor behavior, molecular modeling by homology of GPER
was performed, using the Modeller program, visualizing the
seven-transmembrane domains of GPER protein and the extracellular
and intracellular structural regions. The structural conformation
of the transmembrane region was conserved in the three templates
used for modeling (1F88, 1HZX and 6LFL). However, the structural
conformation of the first 50 amino acids was different, depending
on the template used. The asparagine residues 25, 32 and 44 in the
N-terminal region were defined as glycosylation targets (Fig. 5).
Molecular docking of GPER-ligand
interaction
The binding site and affinity of E2 and G1 molecules
for GPER have not, to the best of our knowledge, been previously
defined. In the present study, a molecular docking and recognition
of both ligands were conducted, based on the three templates
generated for GPER bovine rhodopsin crystallographic structures
(PDB entry numbers 1F88 and 1HZX) and one structure of a human GPCR
(PDB entry 6LFL). GPER-ligand interaction analysis revealed that in
templates 1F88 and 1HZX, E2 and G1 binding occurred in an
extracellular domain, while according to the 6LFL template, this
binding occurred in the transmembrane region (Fig. 6A). By using the Auto Dock 4 program
and Auto Dock Tools, ligand conformations (E2 or G1) with different
affinities for each of the receptor models were observed. The
highest binding energy for E2 and G1 was observed in the 6LFL
template (Fig. 6B). An analysis of
the interaction sites of each GPER model (1F88, 1HZX, and 6LFL)
with both ligands (E2 and G1) was also performed (Fig. 6C and D). In the 1F88 model, E2 and
G1 interacted with ALA22, ALA23, SER28, PRO36, GLY39, and THR40
residues. The cluster plot indicated that the most favorable
binding energy was −8.1 for E2 and −7.8 for G1. For the 1HZX model,
E2 and G1 demonstrated a shared interaction with HIS300, HIS302,
and PRO303 residues. Moreover, their favorable binding energies
were lower in comparison with a value of −6 for E2 and −6.7 for G1.
According to 1F88 and 1HZX models, the binding sites for both
ligands are similar. Finally, the 6LFL model revealed that E2 and
G1 appear to interact in different regions of GPER. This analysis
indicated favorable binding energies, −10.7 for E2, and −10.1 for
G1. The highest binding energy of E2 and G1 in the highest number
of conformations was obtained with the 6LFL model (Fig. 6D). According to the 6LFL model, E2
and G1 (in the largest number of conformations) presented the
highest binding energy of the three models.
 | Figure 6.Docking of three GPER models. Docking
was obtained with 1F88, 1HZX, and 6LFL in the presence of E2 and G1
ligands. (A) Binding sites for E2 and G1 of each GPER molecular
model. A graph is shown for each of the templates used in the
analysis. (B) Graphs represent the binding energy values of the
corresponding ligand (E2 or G1) according to the three templates
used vs. the number of conformations of the corresponding ligand.
One graph is included for each group of ligand conformations, E2 or
G1. (C) Amino acids involved in the interaction of GPER with E2 or
G1 in each one of the templates (1F88, 1HZX, and 6LFL) used. In
models 1F88 and 1HZX, the predicted amino acids interacting with E2
and G1 overlap; however, according to 6LFL model, E2 and G1 appear
to interact in different regions of GPER. (D) Comparison of the
binding energy of the E2 or G1 ligands vs. the number of ligand
conformations for each GPER template. GPER, G-protein coupled
estrogen receptor; E2, 17 β-estradiol. |
Discussion
The present study characterized GPER expression at
the mRNA and protein level in three human GB-derived cell lines
(U87, T98G and LN229) and one astrocytoma cell line (U251).
Moreover, it was explored whether E2 may regulate GPER expression
through a genomic mechanism via EREs, and the three-dimensional
conformation of GPER and the potential interaction sites with their
ligands, E2 and G1, were predicted.
Firstly, GPER expression in the U251, U87, LN229 and
T98G human brain tumor cell lines and HA cell line was determined
at the mRNA level, the highest expression of GPER was detected in
HA, while U87 cells demonstrated the highest expression at the
protein level. These results could be related to the cellular
heterogeneity of GBs (42–44). However, the functional significance
of the increased GPER expression in U87 cells required further
evaluation. In ovarian cancer, the higher expression of GPER has
been associated with MMP-9 expression, which participates in
invasion and migration processes (45). The two bands detected for GPER
correspond to the reported molecular weights of GPER (70 and 55
kDa). Gonzalez de Valdivia et al (46) described that the GPER reaches a
molecular mass of 70-kDa due to glycosylation of the asparagine 44
residue and identified receptor species at a molecular mass of 40
and 110 kDa, as a result of deglycosylation. Other authors have
also identified the receptor at 55-kDa molecular weight, suggesting
that different GPER species are related to receptor maturation
through N-glycosylation (39,40).
It would be of interest to evaluate the functional significance of
GPER glycosylation in future studies.
The subcellular localization of GPER were also
characterized in the U87 cell line. In permeabilized and
non-permeabilized preparations, orthogonal projections and 3-D
reconstructions indicated that GPER was located in the cytoplasm
and the nucleus. In another study the presence of GPER in these
compartments has also been reported (47). The results of the present study
revealed that in non-permeabilized cells, GPER could only be
observed in the plasma membrane, particularly in the prolongations
of border cells. Furthermore, according to a previous study on
breast cancer cells and in breast cancer-associated fibroblasts,
GPER subcellular localization was shown to be related to different
tumor properties, with the cytoplasmic expression of GPER
associated with a low tumor stage and a better histological
differentiation (47–50).
The intracellular trafficking pathway of GPER is
highly unusual, as these types of receptors are typically recycled
to the plasma membrane or degraded in lysosomes (46,47,51).
It has also been described that GPER endocytoses from the plasma
membrane through clathrin-coated vesicles, entering early
endosomes, and accumulating in a perinuclear compartment; it has
also been observed that GPER internalization may occur in the
absence of ligand, indicating that the GPER undergoes a
constitutive endocytosis (46,47,51–53).
The presence of GPER in the nucleus may also be
related to an active transcriptional role of GPER, similar to that
first reported by Madeo and Maggiolin (49), who suggested that the localization
of GPER and EGFR in the nucleus of breast cancer-associated
fibroblasts (CAFs) was necessary for their recruitment to the
cyclin D1 promoter sequence. They demonstrated that the functional
role of the nuclear interaction between GPER and EGFR was induced
by E2. In another study on breast CAFs, it was reported that GPER
translocated to the nucleus through an importin-dependent
mechanism, where GPER regulated its target genes (c-Fos and
connective tissue growth factor gene) and the estrogen-induced
migration of CAFs (50). In
ovarian cancer, nuclear localization of GPER has been associated
with poor survival (54). Nuclear
GPER expression has also been associated with poorly differentiated
carcinomas and the triple-negative subtype (47). Thus, in the present study, the
significance of nuclear GPER in GB required an in-depth
experimental approach.
The regulation of GPER expression in GB is currently
unknown, to the best of our knowledge. Previous studies have
determined that E2 not only increases the expression of GPER mRNA,
but also the protein content in different cell types, including
endometrial carcinoma cells, chondrocytes, colorectal cells and
triple-negative breast cancer cells (55–58).
An in silico analysis was used to investigate EREs in the
GPER gene. This analysis predicted the presence of two EREs in the
GPER promoter; however, additional experimental strategies
including ChIP or site direct mutagenesis tools are required to
confirm the presence of the EREs predicted in this study.
Subsequently, to determine the role of E2 in GPER expression, U251,
U87, LN229, and T98G cells were treated with various concentrations
(1, 10 and 100 nM, and 1 µM). E2 increased GPER content in the
U251, U87 and LN229 cells. Of note, in a cell line derived from
endometrial adenocarcinoma, E2 increased GPER mRNA levels.
Furthermore, the ERα agonist, PPT, induced the same response as E2;
this effect was not observed with the ERβ-specific agonist, DPN
(55), suggesting that the
regulation of GPER expression by E2 is ERα-dependent. The role of
E2 in the progression of GBs has been previously reported by the
authors. In 2012, González-Arenas et al revealed (3) that E2 treatment increased the
proliferation of human glioblastoma-derived cell lines.
Interestingly, when specific agonists were used for both ER
subtypes, only the ERα agonist (PP2) increased proliferation. More
recently, Hernández-Vega et al (6) reported that E2 promoted
epithelial-mesenchymal transition through changes in cell
morphology and expression of EMT markers (vimentin and N-cadherin).
When the ERα agonist was used, the same effects were observed as
those induced by the E2 treatment. However, the ERβ agonist did not
promote any events associated with EMT. Notably, in ovarian cancer
cells (BG-1), GPER and ERα have been reported to co-operate in
order to induce proliferation (15). A possible interaction of these
receptors to mediate pro-oncogenic actions of E2 in GB could also
occur.
As regards the regulation of GPER expression, Fan
et al determined that E2 at a concentration of 10 and 100 nM
increased the GPER content in chondrocyte-derived cells (56) and different colorectal (HCT116,
HT-29 and Caco2) and breast cancer cell lines (triple-negative
breast cancer: HCC1806, HCC1937, MDA-MB-231), E2 10 nM increased
GPER content (57,58). Subsequently, this condition was
evaluated and a wider range of E2 concentrations was analyzed.
Aside from this, E2 has diverse effects on the GB depending on its
concentration (3,5). It is worth noting that in the
experiments performed during the present study, E2 100 nM, did not
increase GPER protein content. Our model presents a different
cellular context than the one reported by Fan et al; it has
been previously observed that the activity of GPER, as an atypical
GPCR, can vary depending on the species, tissue, and cellular
context (59,60). Thus, further studies are required
for the definition of the exact E2 range concentrations that may
affect GPER content. Moreover, the activation or inhibition of
endocytosis after ligand binding and activation to avoid excess
cell signaling (52), interaction
with other membrane proteins such as clathrin or arrestin (61), or possible receptor dimerization as
a desensitization mechanism (62,63),
may have an impact on GPER content. Whether E2 may induce some of
these cellular processes affecting GPER expression in GB cells,
excluding the transcriptional regulation suggested by the presence
of the EREs in the GPER promoter, remains to be fully
elucidated.
Finally, a GPER-ligand interaction through molecular
docking was performed. Three models of the GPER structure were
obtained based on two bovine rhodopsin templates (1F88 and 1HZX)
and one human GPCR template (6LFL). The analysis predicted that E2
or G1 binding occurs in an extracellular region in 1F88 and 1HZX
models and in a transmembrane region in the 6LFL model. According
to the1F88 model, E2 and G1 binding sites share ALA22, ALA23,
SER28, PRO36, GLY39 and THR40 residues, suggesting that both
ligands may have the same binding site. Similarly, model 1HZX
suggested that the binding site for the ligands shares the region
comprising HIS300, HIS302, and PRO303 residues. In the human
GPCR-based model, there was no overlap in the amino acids involved
in E2 or G1 binding, suggesting that E2 and G1 exert different
functions when interacting with this receptor. In addition, the
highest binding energies for E2 and G1 were detected in the human
GPCR-based model (6LFL), suggesting that this is the most realistic
model. In this regard, Grande et al (64) reported that the interaction of G1
and E2 with GPER occurs in an intracellular region. However, a
molecular docking for deciphering the GPER agonist interactions
reported that a ligand could be recognized at different binding
sites depending on the used structural GPER conformation (65). Variations in structural templates
have repercussions on the docking modeling, especially on the first
50 residues of the N-terminal present in the extracellular region
and are prone to acquire disordered conformations when modeled by
computational methods. Thus, in order to obtain definitive and
consistent results of molecular docking of GPER and its ligands,
further refinement of the GPER modeling and the resolution of the
GPER crystallographic structure is required.
In conclusion, in the present study, the expression
of GPER in human astrocytoma (U251) and glioblastoma tumor cell
lines (U87, LN229 and T98) at the mRNA and protein level was
reported, which was localized in the plasma membrane, cytoplasm,
and nucleus. In addition, by performing in silico analysis,
the presence of two EREs in the promoter region of the GPER gene
was described. Interestingly, it was revealed that E2 increased the
expression of this receptor at the protein level in human
GB-derived cells. Furthermore, by molecular modeling studies,
potential three-dimensional structures of GPER were obtained, and
by docking analysis, the potential binding sites for their ligands,
E2, and its specific agonist G1, were identified. The present study
provides the basis for further investigating the role of E2 actions
mediated by GPER in GB, which will outline the integrative view of
E2 broad actions in GB. Studying the GPER-mediated E2 signaling
consequences in GB could contribute to the design of new
pharmacological therapies that target specific pro-oncogenic
actions modulated by specific E2 subtype receptors.
Supplementary Material
Supporting Data
Acknowledgements
The authors would like to thank Mrs. Aylin del
Moral-Morales [Departamento de Ciencias Naturales, Universidad
Autónoma Metropolitana-Cuajimalpa (UAM-C), Mexico City, Mexico] for
helping to develop the script for the searching of ERES in
silico.
Funding
The present study was supported by Programa de Apoyo a Proyectos
de Investigación e Innovación Tecnológica (PAPIIT) (grant no.
PAPIIT IN217120). Funding was also received from CONACYT (grant no.
CVU 1007089).
Availability of data and materials
The datasets used and/or analyzed during the current
study are available from the corresponding author on reasonable
request.
Authors' contributions
KMPG, KHO, CBA and ICA designed the experiments.
KMPG and KHO performed the experiments. KMPG, KHO and CBA confirm
the authenticity of all the raw data. KMPG and CBA wrote the first
draft preparation; KHO, CBA and ICA contributed to the revision and
editing of the manuscript. ICA obtained the funding support. All
authors have read and approved the final manuscript.
Ethics approval and consent to
participants
Not applicable.
Patient consent for publication
Not applicable.
Competing interests
The authors declare that they have no competing
interests.
Glossary
Abbreviations
Abbreviations:
|
GPER
|
G protein-coupled estrogen
receptor
|
|
E2
|
17 β-estradiol
|
|
EREs
|
estrogen response elements
|
|
ERα
|
estrogen receptor α
|
|
ERβ
|
estrogen receptor β
|
References
|
1
|
Ostrom QT, Cioffi G, Gittleman H, Patil N,
Waite K, Kruchko C and Barnholtz-Sloan JS: CBTRUS statistical
report: Primary brain and other central nervous system tumors
diagnosed in the United States in 2012–2016. Neuro Oncol. 21 (Suppl
5):V1–V100. 2019. View Article : Google Scholar : PubMed/NCBI
|
|
2
|
Bello-Alvarez C and Camacho-Arroyo I:
Impact of sex in the prevalence and progression of glioblastomas:
The role of gonadal steroid hormones. Biol Sex Differ. 12:282021.
View Article : Google Scholar : PubMed/NCBI
|
|
3
|
González-Arenas A, Hansberg-Pastor V,
Hernández-Hernández OT, González-García TK, Henderson-Villalpando
J, Lemus-Hernández D, Cruz-Barrios A, Rivas-Suárez M and
Camacho-Arroyo I: Estradiol increases cell growth in human
astrocytoma cell lines through ERα activation and its interaction
with SRC-1 and SRC-3 coactivators. Biochim Biophys Acta.
1823:379–386. 2012. View Article : Google Scholar : PubMed/NCBI
|
|
4
|
Wan S, Jiang J, Zheng C, Wang N, Zhai X,
Fei X, Wu R and Jiang X: Estrogen nuclear receptors affect cell
migration by altering sublocalization of AQP2 in glioma cell lines.
Cell Death Discov. 4:492018. View Article : Google Scholar : PubMed/NCBI
|
|
5
|
Altiok N, Ersoz M and Koyuturk M:
Estradiol induces JNK-dependent apoptosis in glioblastoma cells.
Oncol Lett. 2:1281–1285. 2011. View Article : Google Scholar : PubMed/NCBI
|
|
6
|
Hernández-Vega AM, Del Moral-Morales A,
Zamora-Sánchez CJ, Piña-Medina AG, González-Arenas A and
Camacho-Arroyo I: Estradiol induces epithelial to mesenchymal
transition of human glioblastoma cells. Cells. 9:19302020.
View Article : Google Scholar : PubMed/NCBI
|
|
7
|
Sareddy GR, Nair BC, Gonugunta VK, Zhang
QG, Brenner A, Brann DW, Tekmal RR and Vadlamudi RK: Therapeutic
significance of estrogen receptor β agonists in gliomas. Mol Cancer
Ther. 11:1174–1182. 2012. View Article : Google Scholar : PubMed/NCBI
|
|
8
|
Owman C, Blay P, Nilsson C and Lolait SJ:
Cloning of human cDNA encoding a novel heptahelix receptor
expressed in Burkitt' s lymphoma and widely distributed in brain
and peripheral tissues. Biochem Biophys Res Commun. 228:285–292.
1996. View Article : Google Scholar : PubMed/NCBI
|
|
9
|
Revankar CM, Cimino DF, Sklar LA,
Arterburn JB and Prossnitz ER: A transmembrane intracellular
estrogen receptor mediates rapid cell signaling. Science.
307:1625–1630. 2005. View Article : Google Scholar : PubMed/NCBI
|
|
10
|
Yue J, Wang XS, Feng B, Hu LN, Yang LK, Lu
L, Zhang K, Wang YT and Liu SB: Activation of G - protein-coupled
receptor 30 protects neurons against excitotoxicity through
inhibiting excessive autophagy induced by glutamate. ACS. Chem
Neurosci. 10:4227–4236. 2019. View Article : Google Scholar : PubMed/NCBI
|
|
11
|
Yu T, Liu M, Luo H, Wu C, Tang X, Tang S,
Hu P, Yan Y, Wang Z and Tu G: GPER mediates enhanced cell viability
and motility via non-genomic signaling induced by 17β-estradiol in
triple-negative breast cancer cells. J Steroid Biochem Mol Biol.
143:392–403. 2014. View Article : Google Scholar : PubMed/NCBI
|
|
12
|
Liu Y, Ma H and Yao J: ERα, A key target
for cancer therapy: A review. Onco Targets Ther. 13:2183–2191.
2020. View Article : Google Scholar : PubMed/NCBI
|
|
13
|
Chen Y, Tang H, He J, Wu X, Wang L, Liu X
and Lin H: Interaction of nuclear ERs and GPER in vitellogenesis in
zebrafish. J Steroid Biochem Mol Biol. 189:10–18. 2019. View Article : Google Scholar : PubMed/NCBI
|
|
14
|
Sánchez DS, Fischer Sigel LK, Azurmendi
PJ, Vlachovsky SG, Oddo EM, Armando I, Ibarra FR and Silberstein C:
Estradiol stimulates cell proliferation via classic estrogen
receptor-alpha and G protein-coupled estrogen receptor-1 in human
renal tubular epithelial cell primary cultures. Biochem Biophys Res
Commun. 512:170–175. 2019. View Article : Google Scholar : PubMed/NCBI
|
|
15
|
Vivacqua A, Lappano R, De Marco P, Sisci
D, Aquila S, De Amicis F, Fuqua SA, Andò S and Maggiolini M: G
protein-coupled receptor 30 expression is upregulated by EGF and
TGF alpha in estrogen receptor alpha-positive cancer cells. Mol
Endocrinol. 23:1815–1826. 2009. View Article : Google Scholar : PubMed/NCBI
|
|
16
|
Smith HO, Arias-Pulido H, Kuo DY, Howard
T, Qualls CR, Lee SJ, Verschraegen CF, Hathaway HJ, Joste NE and
Prossnitz ER: GPR30 predicts poor survival for ovarian cancer.
Gynecol Oncol. 114:465–471. 2009. View Article : Google Scholar : PubMed/NCBI
|
|
17
|
Molina L, Figueroa CD, Bhoola KD and
Ehrenfeld P: GPER-1/GPR30 a novel estrogen receptor sited in the
cell membrane: Therapeutic coupling to breast cancer. Expert Opin
Ther Targets. 21:755–766. 2017. View Article : Google Scholar : PubMed/NCBI
|
|
18
|
Zhang KS, Chen HQ, Chen YS, Qiu KF, Zheng
XB, Li GC, Yang HD and Wen CJ: Bisphenol A stimulates human lung
cancer cell migration via upregulation of matrix metalloproteinases
by GPER/EGFR/ERK1/2 signal pathway. Biomed Pharmacother.
68:1037–1043. 2014. View Article : Google Scholar : PubMed/NCBI
|
|
19
|
Avino S, De Marco P, Cirillo F, Santolla
MF, De Francesco EM, Perri MG, Rigiracciolo D, Dolce V, Belfiore A,
Maggiolini M, et al: Stimulatory actions of IGF-I are mediated by
IGF-IR cross-talk with GPER and DDR1 in mesothelioma and lung
cancer cells. Oncotarget. 7:52710–52728. 2016. View Article : Google Scholar : PubMed/NCBI
|
|
20
|
Hirtz A, Lebourdais N, Rech F, Bailly Y,
Vaginay A, Smaïl-Tabbone M, Dubois-Pot-Schneider H and Dumond H:
GPER Agonist G-1 disrupts tubulin dynamics and potentiates
temozolomide to impair glioblastoma cell proliferation. Cells.
10:34382021. View Article : Google Scholar : PubMed/NCBI
|
|
21
|
Deng J, Wang W, Yu G and Ma X:
MicroRNA-195 inhibits epithelial-mesenchymal transition by
targeting G protein-coupled estrogen receptor 1 in endometrial
carcinoma. Mol Med Rep. 20:4023–4032. 2019.PubMed/NCBI
|
|
22
|
Pfaffl MW: A new mathematical model for
relative quantification in real-time RT-PCR. Nucleic Acids Res.
29:e452001. View Article : Google Scholar : PubMed/NCBI
|
|
23
|
Schmittgen TD and Livak KJ: Analyzing
real-time PCR data by the comparative C(T) method. Nat Protoc.
3:1101–1108. 2008. View Article : Google Scholar : PubMed/NCBI
|
|
24
|
Measuring cell fluorescence using ImageJ,
. https://theolb.readthedocs.io/en/latest/imaging/measuring-cell-fluorescence-using-imagej.htmlSeptember
20–2021
|
|
25
|
Khan A, Fornes O, Stigliani A, Gheorghe M,
Castro-Mondragon JA, Van Der Lee R, Bessy A, Chèneby J, Kulkarni
SR, Tan G, et al: JASPAR 2018: Update of the open-access database
of transcription factor binding profiles and its web framework.
Nucleic Acids Res. 46(D1):D260–D266. 2018. View Article : Google Scholar : PubMed/NCBI
|
|
26
|
Heinz S, Benner C, Spann N, Bertolino E,
Lin YC, Laslo P, Cheng JX, Murre C, Singh H and Glass CK: Simple
combinations of lineage-determining transcription factors prime
cis-regulatory elements required for macrophage and B cell
identities. Mol Cell. 38:576–589. 2010. View Article : Google Scholar : PubMed/NCBI
|
|
27
|
Kulakovskiy IV, Vorontsov IE, Yevshin IS,
Sharipov RN, Fedorova AD, Rumynskiy EI, Medvedeva YA, Magana-Mora
A, Bajic VB, Papatsenko DA, et al: HOCOMOCO: Towards a complete
collection of transcription factor binding models for human and
mouse via large-scale ChIP-Seq analysis. Nucleic Acids Res.
46(D1):D252–D259. 2018. View Article : Google Scholar : PubMed/NCBI
|
|
28
|
Tan G and Lenhard B: TFBSTools: An
R/bioconductor package for transcription factor binding site
analysis. Bioinformatics. 32:1555–1556. 2016. View Article : Google Scholar : PubMed/NCBI
|
|
29
|
Thorvaldsdóttir H, Robinson JT and Mesirov
JP: Integrative genomics viewer (IGV): High-performance genomics
data visualization and exploration. Brief Bioinform. 14:178–192.
2013. View Article : Google Scholar : PubMed/NCBI
|
|
30
|
Pettersen EF, Goddard TD, Huang CC, Couch
GS, Greenblatt DM, Meng EC and Ferrin TE: UCSF Chimera-A
visualization system for exploratory research and analysis. J
Comput Chem. 25:1605–1612. 2004. View Article : Google Scholar : PubMed/NCBI
|
|
31
|
Webb B and Sali A: Comparative protein
structure modeling using MODELLER. Curr Protoc Bioinformatics.
54:5.6.1–5.6.37. 2017.PubMed/NCBI
|
|
32
|
Sánchez R and Šali A: Comparative Protein
Structure Modeling in Genomics. Methods in Molecular Biology.
Sánchez R and Sali A: Vol. 143. Humana Press Inc.; Totowa, NJ: pp.
97–127. 1999, PubMed/NCBI
|
|
33
|
Finn RD, Clements J and Eddy SR: HMMER web
server: Interactive sequence similarity searching. Nucleic Acids
Res. 39((Web Server Issue)): W29–W37. 2011. View Article : Google Scholar : PubMed/NCBI
|
|
34
|
Wiederstein M and Sippl MJ: ProSA-web:
Interactive web service for the recognition of errors in
three-dimensional structures of proteins. Nucleic Acids Res.
35((Web Server Issue)): W407–W410. 2007. View Article : Google Scholar : PubMed/NCBI
|
|
35
|
Humphrey W, Dalke A and Schulten K: VMD:
Visual molecular dynamics. J Mol Graph. 14:33–8. 27–8. 1996.
View Article : Google Scholar : PubMed/NCBI
|
|
36
|
Goodsell DS, Sanner MF, Olson AJ and Forli
S: The AutoDock suite at 30. Protein Sci. 30:31–43. 2021.
View Article : Google Scholar : PubMed/NCBI
|
|
37
|
O'Boyle NM, Banck M, James CA, Morley C,
Vandermeersch T and Hutchison GR: Open Babel: An open chemical
toolbox. J Cheminform. 3:332011. View Article : Google Scholar : PubMed/NCBI
|
|
38
|
Bitencourt-Ferreira G, Pintro VO and de
Azevedo WF Jr: Docking with AutoDock4. Methods Mol Biol.
2053:125–148. 2019. View Article : Google Scholar : PubMed/NCBI
|
|
39
|
Azizian H, Khaksari M, Asadi karam G,
Esmailidehaj M and Farhadi Z: Cardioprotective and
anti-inflammatory effects of G-protein coupled receptor 30 (GPR30)
on postmenopausal type 2 diabetic rats. Biomed Pharmacother.
108:153–164. 2018. View Article : Google Scholar : PubMed/NCBI
|
|
40
|
Pupo M, Bodmer A, Berto M, Maggiolini M,
Dietrich PY and Picard D: A genetic polymorphism repurposes the
G-protein coupled and membrane-associated estrogen receptor GPER to
a transcription factor-like molecule promoting paracrine signaling
between stroma and breast carcinoma cells. Oncotarget.
8:46728–46744. 2017. View Article : Google Scholar : PubMed/NCBI
|
|
41
|
Gonzalez de Valdivia E, Sandén C, Kahn R,
Olde B and Leeb-Lundberg LMF: Human G protein-coupled receptor 30
is N-glycosylated and N-terminal domain asparagine 44 is required
for receptor structure and activity. Biosci Rep.
39:BSR201824362019. View Article : Google Scholar : PubMed/NCBI
|
|
42
|
Buruiană A, Florian ȘI, Florian AI, Timiș
TL, Mihu CM, Miclăuș M, Oșan S, Hrapșa I, Cataniciu RC, Farcaș M
and Șușman S: The roles of miRNA in glioblastoma tumor cell
communication: Diplomatic and aggressive negotiations. Int J Mol
Sci. 21:19502020. View Article : Google Scholar : PubMed/NCBI
|
|
43
|
Robertson FL, Marqués-Torrejón MA,
Morrison GM and Pollard SM: Experimental models and tools to tackle
glioblastoma. Dis Model Mech. 12:dmm0403862019. View Article : Google Scholar : PubMed/NCBI
|
|
44
|
Brennan CW, Verhaak RG, McKenna A, Campos
B, Noushmehr H, Salama SR, Zheng S, Chakravarty D, Sanborn JZ,
Berman SH, et al: The somatic genomic landscape of glioblastoma.
Cell. 155:462–477. 2013. View Article : Google Scholar : PubMed/NCBI
|
|
45
|
Yan Y, Liu H, Wen H, Jiang X, Cao X, Zhang
G and Liu G: The novel estrogen receptor GPER regulates the
migration and invasion of ovarian cancer cells. Mol Cell Biochem.
378:1–7. 2013. View Article : Google Scholar : PubMed/NCBI
|
|
46
|
Gonzalez de Valdivia E, Broselid S, Kahn R
and Leeb-lundberg LMF: G protein-coupled estrogen receptor 1
(GPER1)/GPR30 increases ERK1/2 activity through PDZ motif-dependent
and -independent mechanisms. J Biol Chem. 292:9932–9943. 2017.
View Article : Google Scholar : PubMed/NCBI
|
|
47
|
Samartzis EP, Noske A, Meisel A, Varga Z,
Fink D and Imesch P: The G protein-coupled estrogen receptor (GPER)
is expressed in two different subcellular localizations reflecting
distinct tumor properties in breast cancer. PLoS One. 9:e832962014.
View Article : Google Scholar : PubMed/NCBI
|
|
48
|
Sjöström M, Hartman L, Grabau D, Fornander
T, Malmström P, Nordenskjöld B, Sgroi DC, Skoog L, Stål O,
Leeb-Lundberg LM and Fernö M: Lack of G protein-coupled estrogen
receptor (GPER) in the plasma membrane is associated with excellent
long-term prognosis in breast cancer. Breast Cancer Res Treat.
145:61–71. 2014. View Article : Google Scholar : PubMed/NCBI
|
|
49
|
Madeo A and Maggiolini M: Nuclear
alternate estrogen receptor Gpr30 mediates 17beta-estradiol-induced
gene expression and migration in breast cancer-associated
fibroblasts. Cancer Res. 70:6036–6046. 2010. View Article : Google Scholar : PubMed/NCBI
|
|
50
|
Pupo M, Vivacqua A, Perrotta I, Pisano A,
Aquila S, Abonante S, Gasperi-Campani A, Pezzi V and Maggiolini M:
The nuclear localization signal is required for nuclear GPER
translocation and function in breast cancer-associated fibroblasts
(CAFs). Mol Cell Endocrinol. 376:23–32. 2013. View Article : Google Scholar : PubMed/NCBI
|
|
51
|
Cheng SB, Quinn JA, Graeber CT and Filardo
EJ: Down-modulation of the G-protein-coupled estrogen receptor,
GPER, from the cell surface occurs via a trans-Golgi-proteasome
pathway. J Biol Chem. 286:22441–22455. 2011. View Article : Google Scholar : PubMed/NCBI
|
|
52
|
Figueira MI, Cardoso HJ and Socorro S: The
role of GPER signaling in carcinogenesis: A focus on prostate
cancer. Recent Trends in Cancer Biology: Spotlight on Signaling
Cascades and microRNAs. Fayyaz S and Farooqi A: Springer; Cham: pp.
59–117. 2018
|
|
53
|
Innamorati G, Le Gouill C, Balamotis M and
Birnbaumer M: The long and the short cycle. Alternative
intracellular routes for trafficking of G-protein-coupled
receptors. J Biol Chem. 276:13096–13103. 2001. View Article : Google Scholar : PubMed/NCBI
|
|
54
|
Zhu CX, Xiong W, Wang ML, Yang J, Shi HJ,
Chen HQ and Niu G: Nuclear G protein-coupled oestrogen receptor
(GPR30) predicts poor survival in patients with ovarian cancer. J
Int Med Res. 46:723–731. 2018. View Article : Google Scholar : PubMed/NCBI
|
|
55
|
Plante BJ, Lessey BA, Taylor RN, Wang W,
Bagchi MK, Yuan L, Scotchie J, Fritz MA and Young SL: G
protein-coupled estrogen receptor (GPER) expression in normal and
abnormal endometrium. Reprod Sci. 19:684–693. 2012. View Article : Google Scholar : PubMed/NCBI
|
|
56
|
Fan DX, Yang XH, Li YN and Guo L:
17β-estradiol on the expression of G-Protein coupled estrogen
receptor (GPER/GPR30) mitophagy, and the PI3K/Akt signaling pathway
in ATDC5 chondrocytes in vitro. Med Sci Monit. 24:1936–1947. 2018.
View Article : Google Scholar : PubMed/NCBI
|
|
57
|
Gilligan LC, Rahman HP, Hewitt AM, Sitch
AJ, Gondal A, Arvaniti A, Taylor AE, Read ML, Morton DG and Foster
PA: Estrogen activation by steroid sulfatase increases colorectal
cancer proliferation via GPER. J Clin Endocrinol Metab.
102:4435–4447. 2017. View Article : Google Scholar : PubMed/NCBI
|
|
58
|
Huang R, Li J, Pan F, Zhang B and Yao Y:
The activation of GPER inhibits cells proliferation, invasion and
EMT of triple-negative breast cancer via CD151/miR-199a-3p
bio-axis. Am J Transl Res. 12:32–44. 2020.PubMed/NCBI
|
|
59
|
Prossnitz ER and Arterburn JB:
International union of basic and clinical pharmacology. XCVII. G
protein-coupled estrogen receptor and its pharmacologic modulators.
Pharmacol Rev. 67:505–540. 2015. View Article : Google Scholar : PubMed/NCBI
|
|
60
|
Luo J and Liu D: Does GPER really function
as a G protein-coupled estrogen receptor in vivo? Front Endocrinol
(Lausanne). 11:1482020. View Article : Google Scholar : PubMed/NCBI
|
|
61
|
Jala VR, Radde BN, Haribabu B and Klinge
C: Enhanced expression of G-protein coupled estrogen receptor
(GPER/GPR30) in lung cancer. BMC Cancer. 12:6242012. View Article : Google Scholar : PubMed/NCBI
|
|
62
|
Milligan G, Canals M, Pediani JD, Ellis J
and Lopez-Gimenez JF: The role of GPCR Dimerisation/Oligomerisation
in receptor signalling. Ernst Schering Found Symp Proc. 2:145–161.
2006.PubMed/NCBI
|
|
63
|
Gurevich VV and Gurevich EV: How and why
do GPCRs dimerize? Trends Pharmacol Sci. 29:234–240. 2008.
View Article : Google Scholar : PubMed/NCBI
|
|
64
|
Grande F, Occhiuzzi MA, Lappano R, Cirillo
F, Guzzi R, Garofalo A, Jacquot Y, Maggiolini M and Rizzuti B:
Computational approaches for the discovery of GPER targeting
compounds. Front Endocrinol (Lausanne). 11:5172020. View Article : Google Scholar : PubMed/NCBI
|
|
65
|
Méndez-Luna D, Martínez-Archundia M,
Maroun RC, Ceballos-Reyes G, Fragoso-Vázquez MJ, González-Juárez DE
and Correa-Basurto J: Deciphering the GPER/GPR30-agonist and
antagonists interactions using molecular modeling studies,
molecular dynamics, and docking simulations. J Biomol Struct Dyn.
33:2161–2172. 2015. View Article : Google Scholar : PubMed/NCBI
|