Introduction
Hepatocellular carcinoma (HCC) is the most prevalent
primary malignant tumor of the liver in Northern and Western Africa
and Eastern and South-Eastern Asia, according to statistical data
from 2018 (1). Primary curative
treatments for HCC include liver resection, radiofrequency ablation
and liver transplantation (2).
Symptoms of HCC often go unnoticed and early-stage detection
remains challenging, leading to missed opportunities for timely
surgical intervention upon diagnosis. Furthermore, HCC presents
with complex and diverse clinical characteristics (3). Even when small tumors are resected
early, long-term survival remains unsatisfactory due to frequent
recurrences and metastases (4).
Numerous studies have assessed the risk factors associated with
early recurrence after surgical resection in patients with HCC.
Factors such as large tumor size, elevated serum a-fetoprotein
(AFP) levels, microvascular invasion (MVI), poor histological
differentiation and Ki-67 expression have been associated with
early recurrence in HCC (5–8).
MVI is a histopathological feature that indicates
the aggressive behavior of HCC (9).
MVI is not detectable through preoperative imaging and its
diagnosis relies on the pathology results of tissue specimens
obtained during surgery under a microscope (10). MVI involves the infiltration of
tumor cells into numerous microvascular structures. Its presence
signals the potential for tumor spread and metastasis within the
liver, resulting in the formation of a portal vein tumor thrombus
or distant metastasis (11). MVI is
a risk factor associated with postoperative recurrence and overall
survival in patients (12–14), serving as an indicator of a poor
prognosis (15). Accurate
preoperative evaluation of MVI is required for doctors to determine
appropriate treatment strategies for patients (16). In high-risk patients with MVI, a
wide margin of surgical resection is preferred, as it has the
potential to improve the prognosis (17).
According to the three-tiered MVI grading system
(18), MVI can be classified into
three grades: M0, no MVI; M1, 1–5 MVI sites located ≤1 cm away from
the tumor surface; or M2, MVI of >5 sites or MVI at >1 cm
away from the tumor surface. A recent study identified histological
risk classification based on MVI as a valuable prognostic indicator
for patients with HCC, revealing an association between grade M2
and a decreased overall survival rate (19). Although previous research has
explored MVI prediction, studies on the prediction of MVI grading
in patients with HCC with MVI are still limited (5,14,17,19).
Chen et al (19) assessed
MVI classification based on clinical and pathological
characteristics as well as CT variables. However, due to the
inclusion of pathological factors in this research model,
prediction of MVI grading before surgery was not feasible.
Therefore, the present study aimed to predict the MVI
classification based on preoperative MRI features and clinical
parameters, establishing corresponding nomograms to offer guidance
for clinicians.
Materials and methods
Ethical approval
The present study was performed according to the
ethical standards in the 1964 Declaration of Helsinki. Approval was
granted by the Ethics Committee of Shengli Oilfield Central
Hospital (approval no. YXLL202400701; Dongying, China) and the
requirement for informed consent of patients was waived.
Patients
Two experienced radiologists continuously
retrospectively collected data from patients with HCC who underwent
liver MRI from the picture archiving and communication system
(PACS) of the Shengli Oilfield Central Hospital (Dongying, China).
Data from patients between February 2018 and April 2021 were
included in the training set. Data from patients between May 2021
and April 2023 were selected for the validation set. The inclusion
criteria were as follows: i) Confirmed histopathological diagnosis
of HCC with clear grading of MVI; ii) liver MRI examination was
performed within 2 weeks before surgical treatment; and iii)
presence of single tumors, without invasion of large vessels and
distant metastasis. The exclusion criteria were as follows: i)
Incomplete MR images or MRI scans with significant artifacts; ii)
previous treatment for HCC prior to the latest MRI examination,
including hepatectomy, chemotherapy, ablation, immunotherapy,
radiofrequency ablation, neoadjuvant chemotherapy, radiotherapy or
transcatheter arterial chemoembolization; iii) a history of other
malignant tumors; and iv) incomplete clinical or pathological
information.
MRI examination
All participants in the present study underwent
abdominal MRI using a 3.0 T scanner (MAGNETOM Skyra; Siemens
Healthineers) equipped with a phased-array body coil. Before the
examination, all patients fasted for 6 h. The sequences of MRI
scanning protocol included: i) Fat-suppressed axial T2-weighted
imaging; ii) in-phase and out-of-phase axial T1-weighted imaging;
iii) diffusion-weighted imaging with b-values of 50 and 800
s/mm2 with corresponding apparent diffusion coefficient
(ADC) maps automatically calculated by the MR system; iv)
T1-weighted pre-contrast imaging; and v) dynamic contrast-enhanced
imaging. A dose of 0.1 mmol/kg gadoteric acid meglumine (Jiangsu
Hengrui Medicine Co., Ltd.) was injected at a rate of 2 ml/sec,
followed immediately by a 20-ml physiological saline flush. Hepatic
arterial phase, portal venous phase (PVP) and delayed phase images
were obtained at 20–30, 70–80 and 180 sec following contrast
material injection, respectively.
Clinical, pathological and imaging
data analysis
Basic characteristics and clinical laboratory data
of patients with HCC were collected from Shengli Oilfield Central
Hospital, including age, sex, levels of AFP, Lens culinaris
agglutinin-reactive fraction of AFP (AFP-L3), protein induced by
vitamin K absence-II (PIVKA-II), alanine aminotransferase,
aspartate aminotransferase and galactosyl glucosyltransferase, and
the presence of cirrhosis and hepatitis B. The pathological report
also included additional features such as tumor size on final
pathology, histological differentiation and Edmondson-Steiner
grades (20).
Two experienced radiologists independently and
retrospectively extracted and assessed numerous features from the
MR images using the local PACS of the hospital. The radiologists
were blinded to clinical and pathological information, and
disagreements during image evaluation were resolved through joint
consultation and consensus. The evaluated characteristics of the
lesions (Fig. S1) included: i)
Tumor boundary, clear or unclear; ii) tumor margin, smooth or
non-smooth; iii) tumor shape, round, defined as a long
diameter/short diameter ratio ≤1.2, or non-round (21); iv) tumor size on MRI, recorded as
the maximum diameter of the tumor that was measured in the
transverse view on the equilibrium phase (delayed phase) of MRI; v)
peritumoral enhancement, defined as presence of enhancement in the
peritumoral region during the arterial phase; vi) peritumoral
hypointensity, defined as hypointensity in the peritumoral region
during the PVP or delayed phase; and vii) ADC value, calculated
using regions of interest (30–500 mm2) placed at the
level of the maximum diameter of the lesion and inside the visually
perceived lowest portions of the tumors on the ADC maps. Notably,
areas characterized by hemorrhagic, cystic, necrotic and
calcification features were excluded. The final ADC value was
computed as the mean of measurements independently obtained by two
radiologists.
Statistical analysis
Statistical analysis was performed using SPSS
software (v. 17.0; SPSS, Inc.) and R 4.3.0 (https://www.r-project.org.org/). P<0.05 was
considered to indicate a statistically significant difference. The
accordance of quantitative measurements of observers was evaluated
using Intraclass Correlation Coefficient (ICC) analysis, and
Cohen's κ analysis was used to assess agreement on MRI features
between observers. The defined outcomes for accordance were as
follows: Substantial agreement >0.60 and almost perfect
agreement >0.80. Continuous variables are presented as either
the mean ± standard deviation or median (interquartile range) and
were analyzed using the unpaired Student's t-test or the
Mann-Whitney U test, depending on the data distribution.
Categorical variables are presented as numbers (percentages) and
were analyzed using the χ2 or Fisher's exact test. To
identify potential variables significantly associated with
MVI-positive HCC or the M2 classification, an initial univariate
analysis was conducted to screen for relevant factors. Variables
with P<0.05 in the univariate analysis were considered as
candidates and included in the multivariate analysis. The
multivariate analysis aimed to determine independent predictors of
MVI or the M2 classification.
Nomograms were developed using the predictors that
were determined by multivariate logistic regression analysis. These
nomograms functioned as graphical aids for predicting MVI-positive
HCC or the M2 classification. The predictive performances of the
models were assessed in the training cohort and then validated in
the validation cohort. Receiver operating characteristic (ROC)
curves were generated and the area under the curve (AUC) was
calculated with a 95% CI. Internal validation of the models was
performed using 1,000 bootstrap samples to decrease the overfit
bias. The agreement between the predicted MVI-positive and
M2-classified samples based on the model and actual observed
frequencies was assessed using the Hosmer-Lemeshow (H-L) test and
calibration curve analyses. These evaluations were instrumental in
gauging how well the predictions of the model aligned with the
observed outcomes. Furthermore, the clinical application values of
the nomograms were evaluated using decision curve analysis (DCA)
and clinical impact curve (CIC) analysis. DCA involved calculating
the net benefits at varying threshold probabilities, providing
insights into the potential clinical use of the nomogram.
Simultaneously, the CIC was evaluated to understand the overall
impact of implementing the nomogram in clinical practice.
Results
Patient characteristics
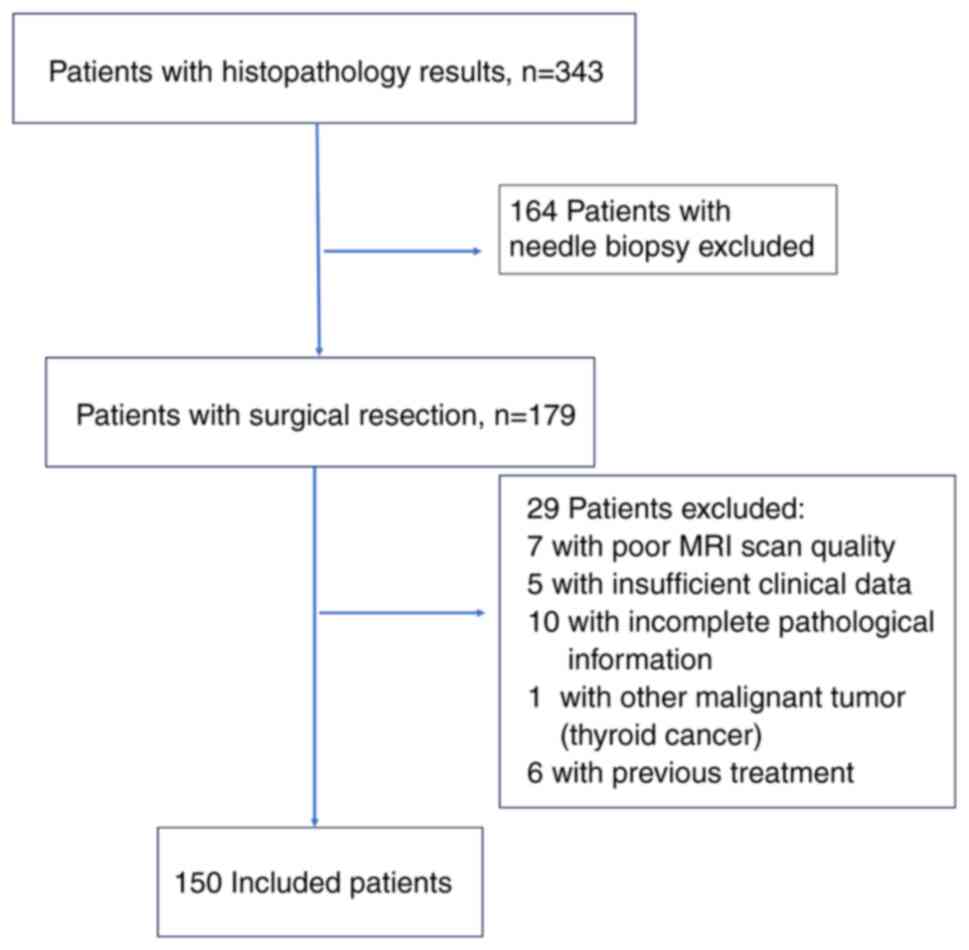
A total of 150 patients were ultimately selected for
analysis, and divided into the training cohort (n=108, age,
63.30±9.81 years) and the validation cohort (n=42, age, 62.69±9.48
years) (Fig. 1). The training
cohort included 85 male patients and 23 female patients, with a
mean age of 63.30±9.81 years. Of the included patients, 75 (69.4%)
presented with MVI-positive HCC and 33 (30.6%) presented with
MVI-negative HCC (M0). Among the MVI-positive cases, 25 (33.3%)
were classified as M2 grade, signifying a higher degree of
invasion, and 50 (66.7%) were classified as M1 grade. The
validation cohort included 35 male patients and 7 female patients,
with a mean age of 62.69±9.48 years. In this cohort, 30 patients
(71.4%) were MVI-positive and 12 patients (28.6%) were MVI-negative
(M0). Among the MVI-positive patients, 11 (36.7%) were classified
as M2 grade, indicating a higher degree of invasion, whereas 19
(63.3%) were classified as M1 grade. No significant differences
were observed between the training and validation cohorts for any
variables listed in Table SI (all
P>0.05).
The inter-observer reproducibility levels for all
MRI parameters were deemed almost perfect and in substantial
agreement, with an ICC >0.8 and Cohen's κ >0.70 (Tables SII and SIII). These results indicated a lack of
notable systematic differences between observers in the assessment
of the MRI parameters. Detailed baseline characteristics,
pathological data and MRI variables of the patients in the training
cohort are shown in Table I.
 | Table I.Baseline characteristics of patients
with HCC in the training cohort. |
Table I.
Baseline characteristics of patients
with HCC in the training cohort.
|
| All patients with
HCC | Patients with
MVI-positive HCC |
|---|
|
|
|
|
|---|
|
Characteristics | MVI-positive
(n=75) | MVI-negative
(n=33) | P-value | M2 grade
(n=25) | M1 grade
(n=50) | P-value |
|---|
| Sexb |
|
| 0.600 |
|
| 0.697 |
|
Male | 58 (77.3) | 27 (81.8) |
| 20 (80.0) | 38 (76.0) |
|
|
Female | 17 (22.7) | 6 (18.2) |
| 5 (20.0) | 12 (24.0) |
|
|
Agea, years | 62.88±9.57 | 64.24±10.43 | 0.509 | 62.24±9.14 | 63.20±9.85 | 0.685 |
| AFPb, ng/ml |
|
| 0.417 |
|
| 0.348 |
|
≤400 | 56 (74.7) | 27 (81.8) |
| 17 (68.0) | 39 (78.0) |
|
|
>400 | 19 (25.3) | 6 (18.2) |
| 8 (32.0) | 11 (22.0) |
|
| AFP-L3b, % |
|
| <0.001 |
|
| 0.126 |
|
≤10 | 27 (36.0) | 26 (78.8) |
| 6 (24.0) | 21 (42.0) |
|
|
>10 | 48 (64.0) | 7 (21.2) |
| 19 (76.0) | 29 (58.0) |
|
|
PIVKA-IIb, mAU/ml |
|
| <0.001 |
|
| >0.999 |
|
≤40 | 10 (13.3) | 17 (51.5) |
| 3 (12.0) | 7 (14.0) |
|
|
>40 | 65 (86.7) | 16 (48.5) |
| 22 (88.0) | 43 (86.0) |
|
| Hepatitis
Bb |
|
| 0.101 |
|
| 0.356 |
|
Yes | 64 (85.3) | 32 (97.0) |
| 20 (80.0) | 44 (88.0) |
|
| No | 11 (14.7) | 1 (3.0) |
| 5 (20.0) | 6 (12.0) |
|
|
Cirrhosisb |
|
| 0.576 |
|
| 0.834 |
|
Yes | 61 (81.3) | 29 (87.9) |
| 20 (80.0) | 41 (82.0) |
|
| No | 14 (18.7) | 4 (12.1) |
| 5 (20.0) | 9 (18.0) |
|
| ALTa, U/l | 29.0 (19.0) | 26.0 (21.5) | 0.237 | 34.0 (24.0) | 28.0 (16.0) | 0.125 |
| ASTa, U/l | 27.0 (23.0) | 25.0 (22.0) | 0.371 | 27.0 (24.5) | 27.0 (23.5) | 0.589 |
| GGTa, U/l | 40.0 (67.0) | 50.0 (70.0) | 0.535 | 62.0 (82.5) | 39.0 (40.25) | 0.132 |
| Tumor
boundaryb |
|
| 0.053 |
|
| 0.172 |
|
Clear | 58 (77.3) | 31 (93.9) |
| 17 (68.0) | 41 (82.0) |
|
|
Unclear | 17 (22.7) | 2 (6.1) |
| 8 (32.0) | 9 (18.0) |
|
| Tumor
shapeb |
|
| 0.090 |
|
| 0.215 |
|
Round | 52 (69.3) | 28 (84.8) |
| 15 (60.0) | 37 (74.0) |
|
|
Non-round | 23 (30.7) | 5 (15.2) |
| 10 (40.0) | 13 (26.0) |
|
| Tumor
marginb |
|
| <0.001 |
|
| 0.071 |
|
Smooth | 41 (54.7) | 31 (93.9) |
| 10 (40.0) | 31 (62.0) |
|
|
Non-smooth | 34 (45.3) | 2 (6.1) |
| 15 (60.0) | 19 (38.0) |
|
| ADCa, mm2/sec | 0.9 (0.2) | 1.0 (0.3) | 0.027 | 0.9 (0.2) | 0.9 (0.3) | 0.774 |
| Tumor size on
MRIa, cm | 4.6 (5.5) | 2.6 (2.6) | <0.001 | 6.2 (7.05) | 4.1 (3.05) | 0.008 |
| Peritumoral
enhancementb |
|
| <0.001 |
|
| 0.198 |
|
Yes | 40 (53.3) | 5 (15.2) |
| 16 (64.0) | 24 (48.0) |
|
| No | 35 (46.7) | 28 (84.8) |
| 9 (36.0) | 26 (52.0) |
|
| Peritumoral
hypointensityb |
|
| 0.017 |
|
| 0.005 |
|
Yes | 11 (14.7) | 0 (0.0) |
| 8 (32.0) | 3 (6.0) |
|
| No | 64 (85.3) | 33 (100.0) |
| 17 (68.0) | 47 (94.0) |
|
| Tumor size measured
by pathologya, cm | 5.0 (5.0) | 3.0 (2.8) | <0.001 | 6.0 (7.0) | 4.6 (3.5) | 0.049 |
| Histological
differentiationb |
|
| <0.001 |
|
| >0.999 |
|
Low/middle | 74 (98.7) | 22 (66.7) |
| 25 (100.0) | 49 (98.0) |
|
|
High | 1 (1.3) | 11 (33.3) |
| 0 (0.0) | 1 (2.0) |
|
| Edmondson-Steiner
gradeb |
|
| 0.009 |
|
| 0.624 |
|
I–II | 39 (52.0) | 26 (78.8) |
| 14 (56.0) | 25 (50.0) |
|
|
III–IV | 36 (48.0) | 7 (21.2) |
| 11 (44.0) | 25 (50.0) |
|
In the training cohort, when compared with
MVI-negative patients, MVI-positive patients were demonstrated to
have significantly higher serum AFP-L3 levels, increased PIVKA-II
levels, a higher number of samples with a non-smooth tumor margin,
lower ADC values, larger tumor size on MRI, higher levels of
peritumoral enhancement and peritumoral hypointensity, larger tumor
size on final pathology, lower histological differentiation, and
higher Edmondson grades (P<0.05). Furthermore, in the training
cohort, patients with M2 grade MVI, when compared with patients
with M1 grade MVI, had significantly larger tumor size on MRI,
higher levels of peritumoral hypointensity and a larger tumor size
on final pathology (P<0.05).
Predictor selection
In the training cohort, several significant
independent predictors of MVI-positivity were identified, including
AFP-L3 levels [odds ratio (OR), 0.21; 95% CI, 0.07–0.64; P=0.006],
PIVKA-II levels (OR, 0.33; 95% CI, 0.11–0.99; P=0.047) and tumor
margin (OR, 0.17; 95% CI, 0.03–0.97; P=0.046). Furthermore, larger
tumor size on MRI (OR, 2.70; 95% CI, 0.75–9.77; P=0.085) and
peritumoral enhancement (OR, 1.30; 95% CI, 0.97–1.75; P=0.129) were
notable predictors (Tables II and
III). These variables were used
to construct corresponding nomograms.
| Table II.Univariate logistic regression
analysis for the prediction of MVI-positivity and the M2
classification in the training cohort. |
Table II.
Univariate logistic regression
analysis for the prediction of MVI-positivity and the M2
classification in the training cohort.
|
| MVI-positive | M2
classification |
|---|
|
|
|
|
|---|
| Variable | OR (95% CI) | P-value | OR (95% CI) | P-value |
|---|
| Sex | 0.76
(0.27–2.14) | 0.601 | 1.26
(0.39–4.09) | 0.697 |
| Age, years | 0.99
(0.95–1.03) | 0.505 | 0.99
(0.94–1.04) | 0.680 |
| AFP, ng/ml | 0.66
(0.24–1.83) | 0.419 | 0.60
(0.21–1.76) | 0.350 |
| AFP-L3, % | 0.15
(0.06–0.40) | <0.001 | 0.44
(0.15–1.28) | 0.131 |
| PIVKA-II,
mAU/ml | 0.15
(0.06–0.38) | <0.001 | 0.84
(0.20–3.56) | 0.810 |
| Hepatitis | 0.18
(0.02–1.47) | 0.110 | 0.55
(0.15–2.00) | 0.360 |
| Cirrhosis | 0.60
(0.18–1.99) | 0.404 | 0.88
(0.26–2.97) | 0.834 |
| ALT, U/l | 1.00
(0.99–1.00) | 0.381 | 1.00
(0.99–1.02) | 0.629 |
| AST, U/l | 1.00
(0.99–1.00) | 0.340 | 1.00
(0.99–1.02) | 0.964 |
| GGT, U/l | 1.00
(0.99–1.00) | 0.984 | 1.00
(0.99–1.01) | 0.178 |
| Tumor boundary | 0.22
(0.05–1.02) | 0.052 | 0.47
(0.15–1.41) | 0.177 |
| Tumor shape | 0.40
(0.14–1.18) | 0.097 | 0.53
(0.19–1.46) | 0.218 |
| Tumor margin | 0.08
(0.02–0.35) | 0.001 | 0.41
(0.15–1.09) | 0.074 |
| ADC,
mm2/sec | 0.11
(0.01–0.09) | 0.059 | 0.47
(0.02–8.74) | 0.613 |
| Tumor size on
MRI | 1.48
(1.17–1.88) | 0.001 | 1.20
(1.04–1.38) | 0.010 |
| Peritumoral
enhancement | 6.40
(2.23–18.37) | 0.001 | 1.93
(0.72–5.17) | 0.193 |
| Peritumoral
hypointensity | 8.33×10⁸
(0.00-Infinity) | 0.999 | 7.37
(1.75–31.06) | 0.006 |
| Table III.Multivariate logistic regression
analysis for the prediction of MVI-positivity and the M2
classification in the training cohort. |
Table III.
Multivariate logistic regression
analysis for the prediction of MVI-positivity and the M2
classification in the training cohort.
|
| MVI-positive | M2
classification |
|---|
|
|
|
|
|---|
| Variable | OR (95% CI) | P-value | OR (95% CI) | P-value |
|---|
| AFP-L3, % | 0.21
(0.07–0.64) | 0.006 | - | - |
| PIVKA-II,
mAU/ml | 0.33
(0.11–0.99) | 0.047 | - | - |
| Tumor margin | 0.17
(0.03–0.97) | 0.046 | - | - |
| Tumor size on
MRI | 2.70
(0.75–9.77) | 0.085 | 1.16
(1.00–1.34) | 0.048 |
| Peritumoral
enhancement | 1.30
(0.97–1.75) | 0.129 | - | - |
| Peritumoral
hypointensity | - | - | 5.38
(1.21–23.96) | 0.027 |
Among patients with MVI-positive HCC in the training
cohort, only peritumoral hypointensity (OR, 5.38; 95% CI,
1.21–23.96; P=0.027) and larger tumor size on MRI (OR, 1.16; 95%
CI, 1.00–1.34; P=0.048) were significant independent predictors of
the M2 classification (Tables II
and III). Notably, the present
study aimed to predict MVI or the M2 classification in a
non-invasive manner. Therefore, risk factors related to
pathological indicators associated with MVI or the M2
classification were not analyzed.
Development and validation of
nomograms
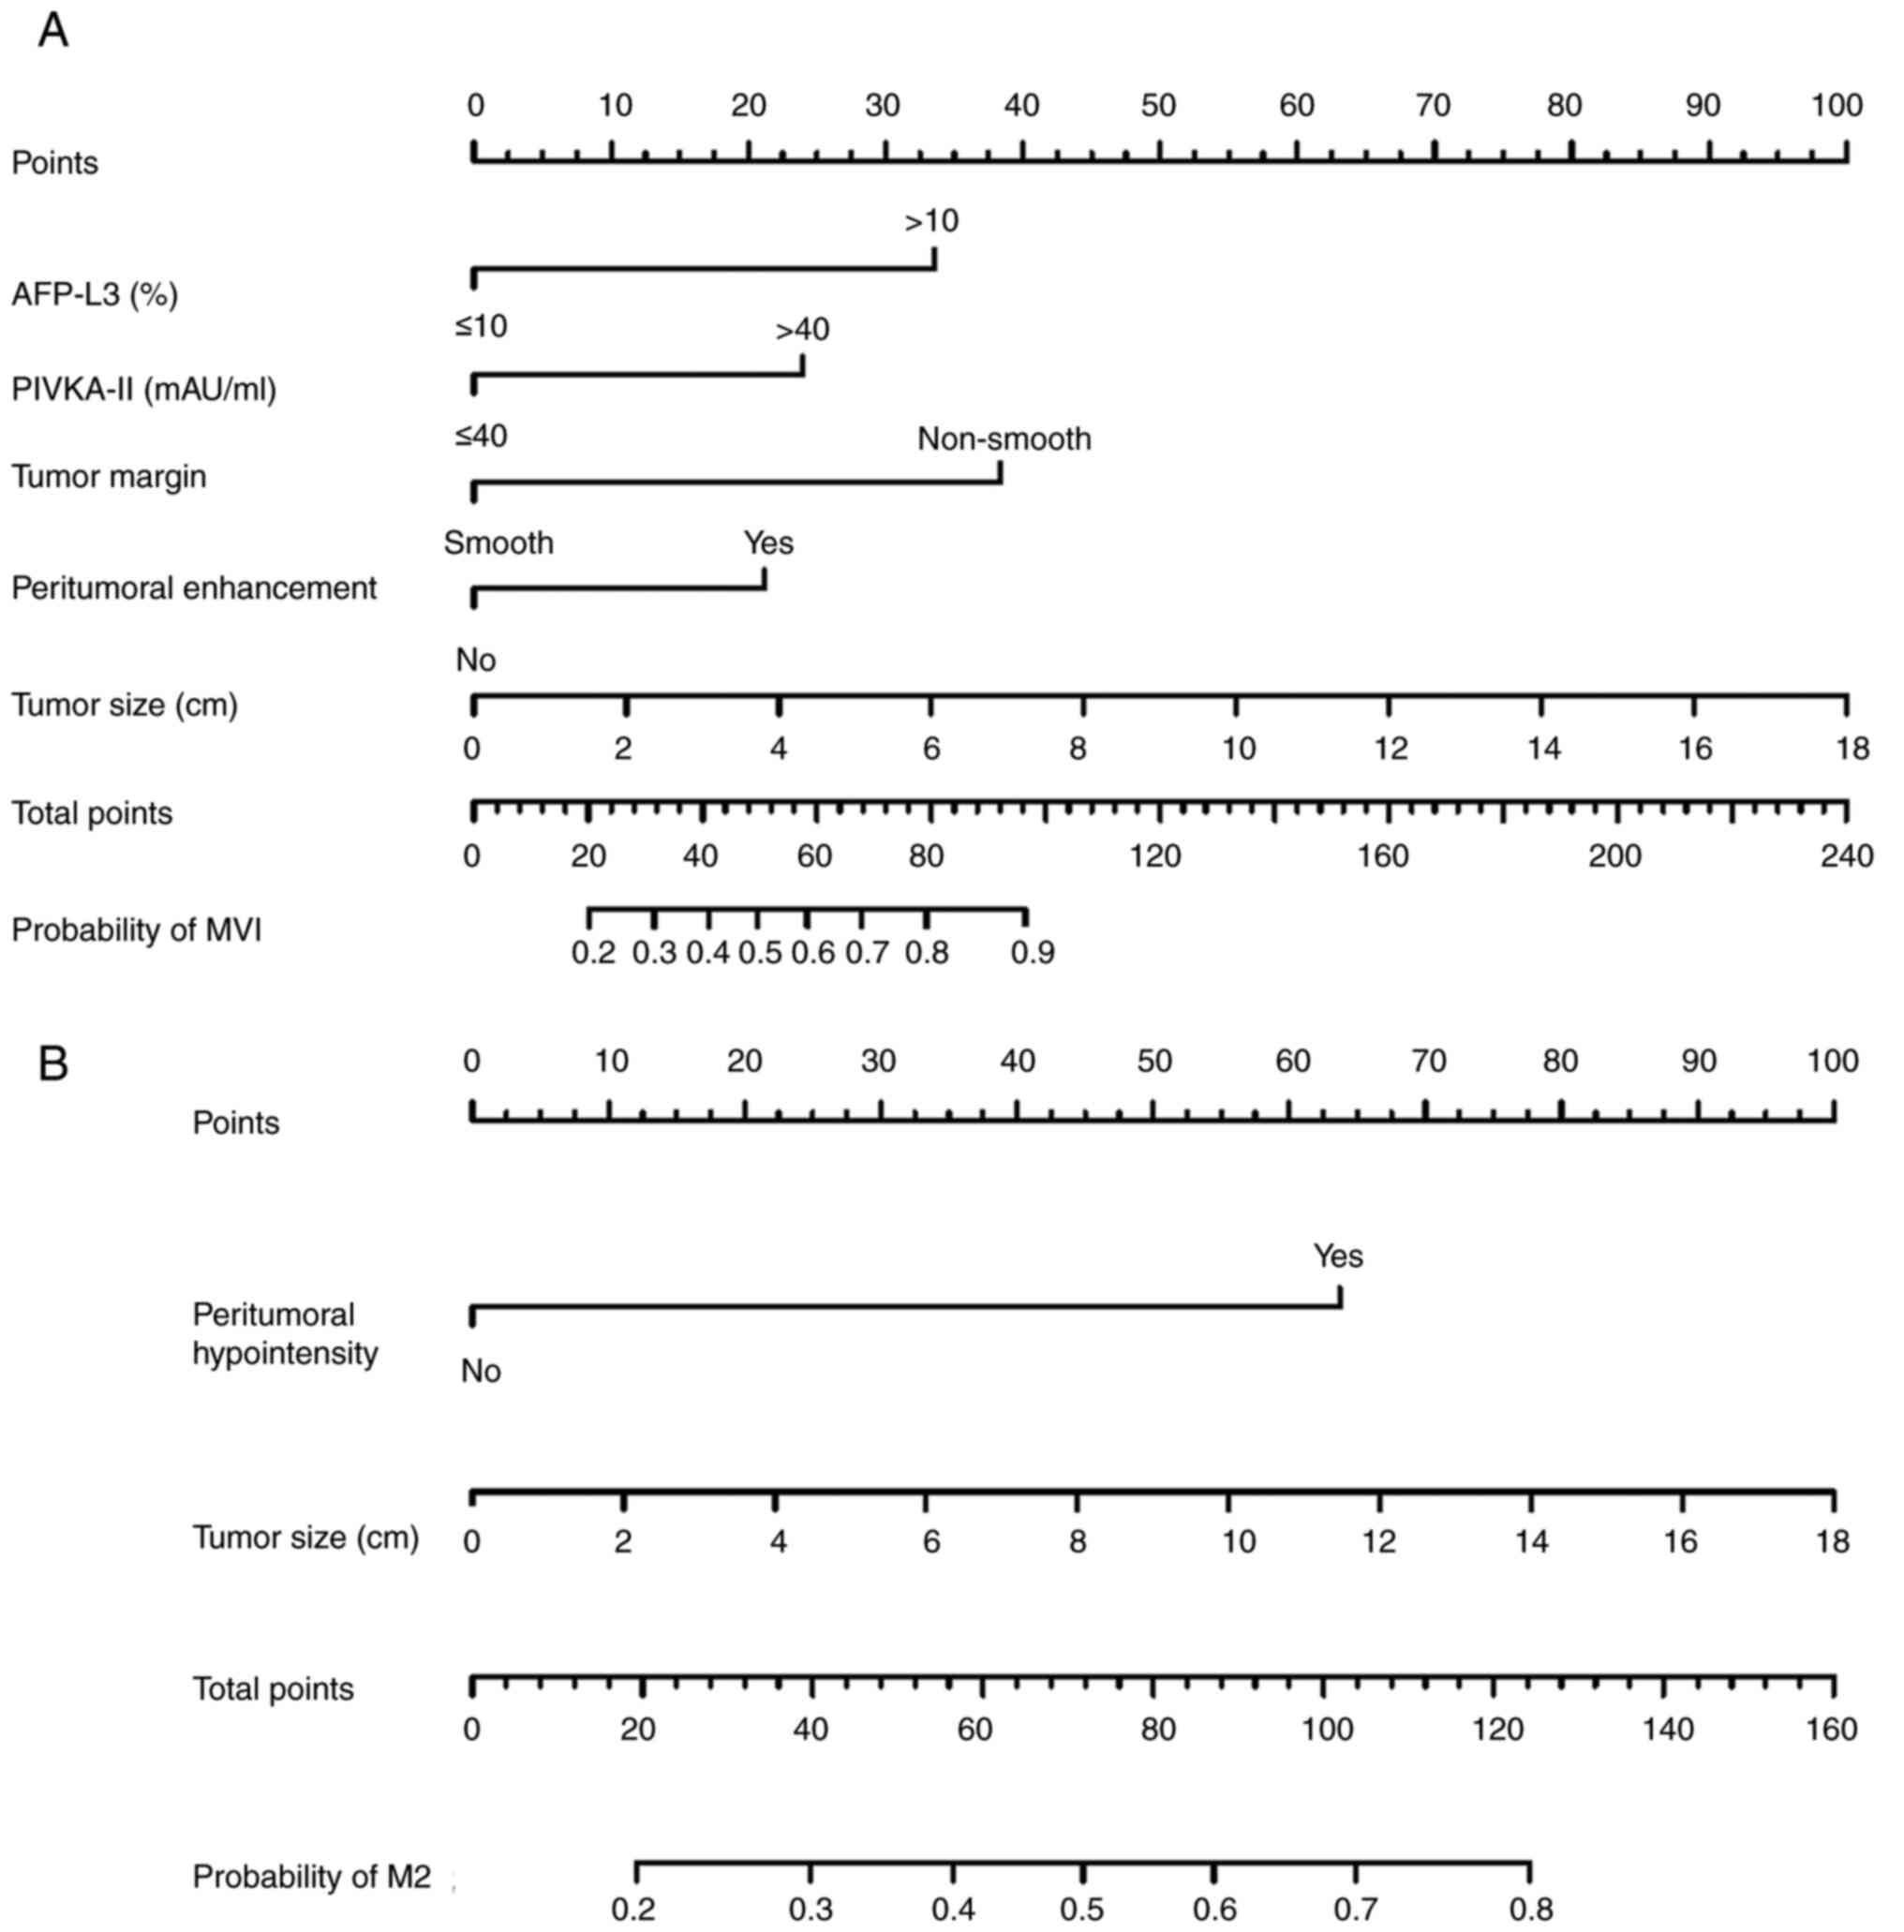
The MVI-positive nomogram incorporated five
features: AFP-L3, PIVKA-II, tumor margin, tumor size on MRI and
peritumoral enhancement (Fig. 2A).
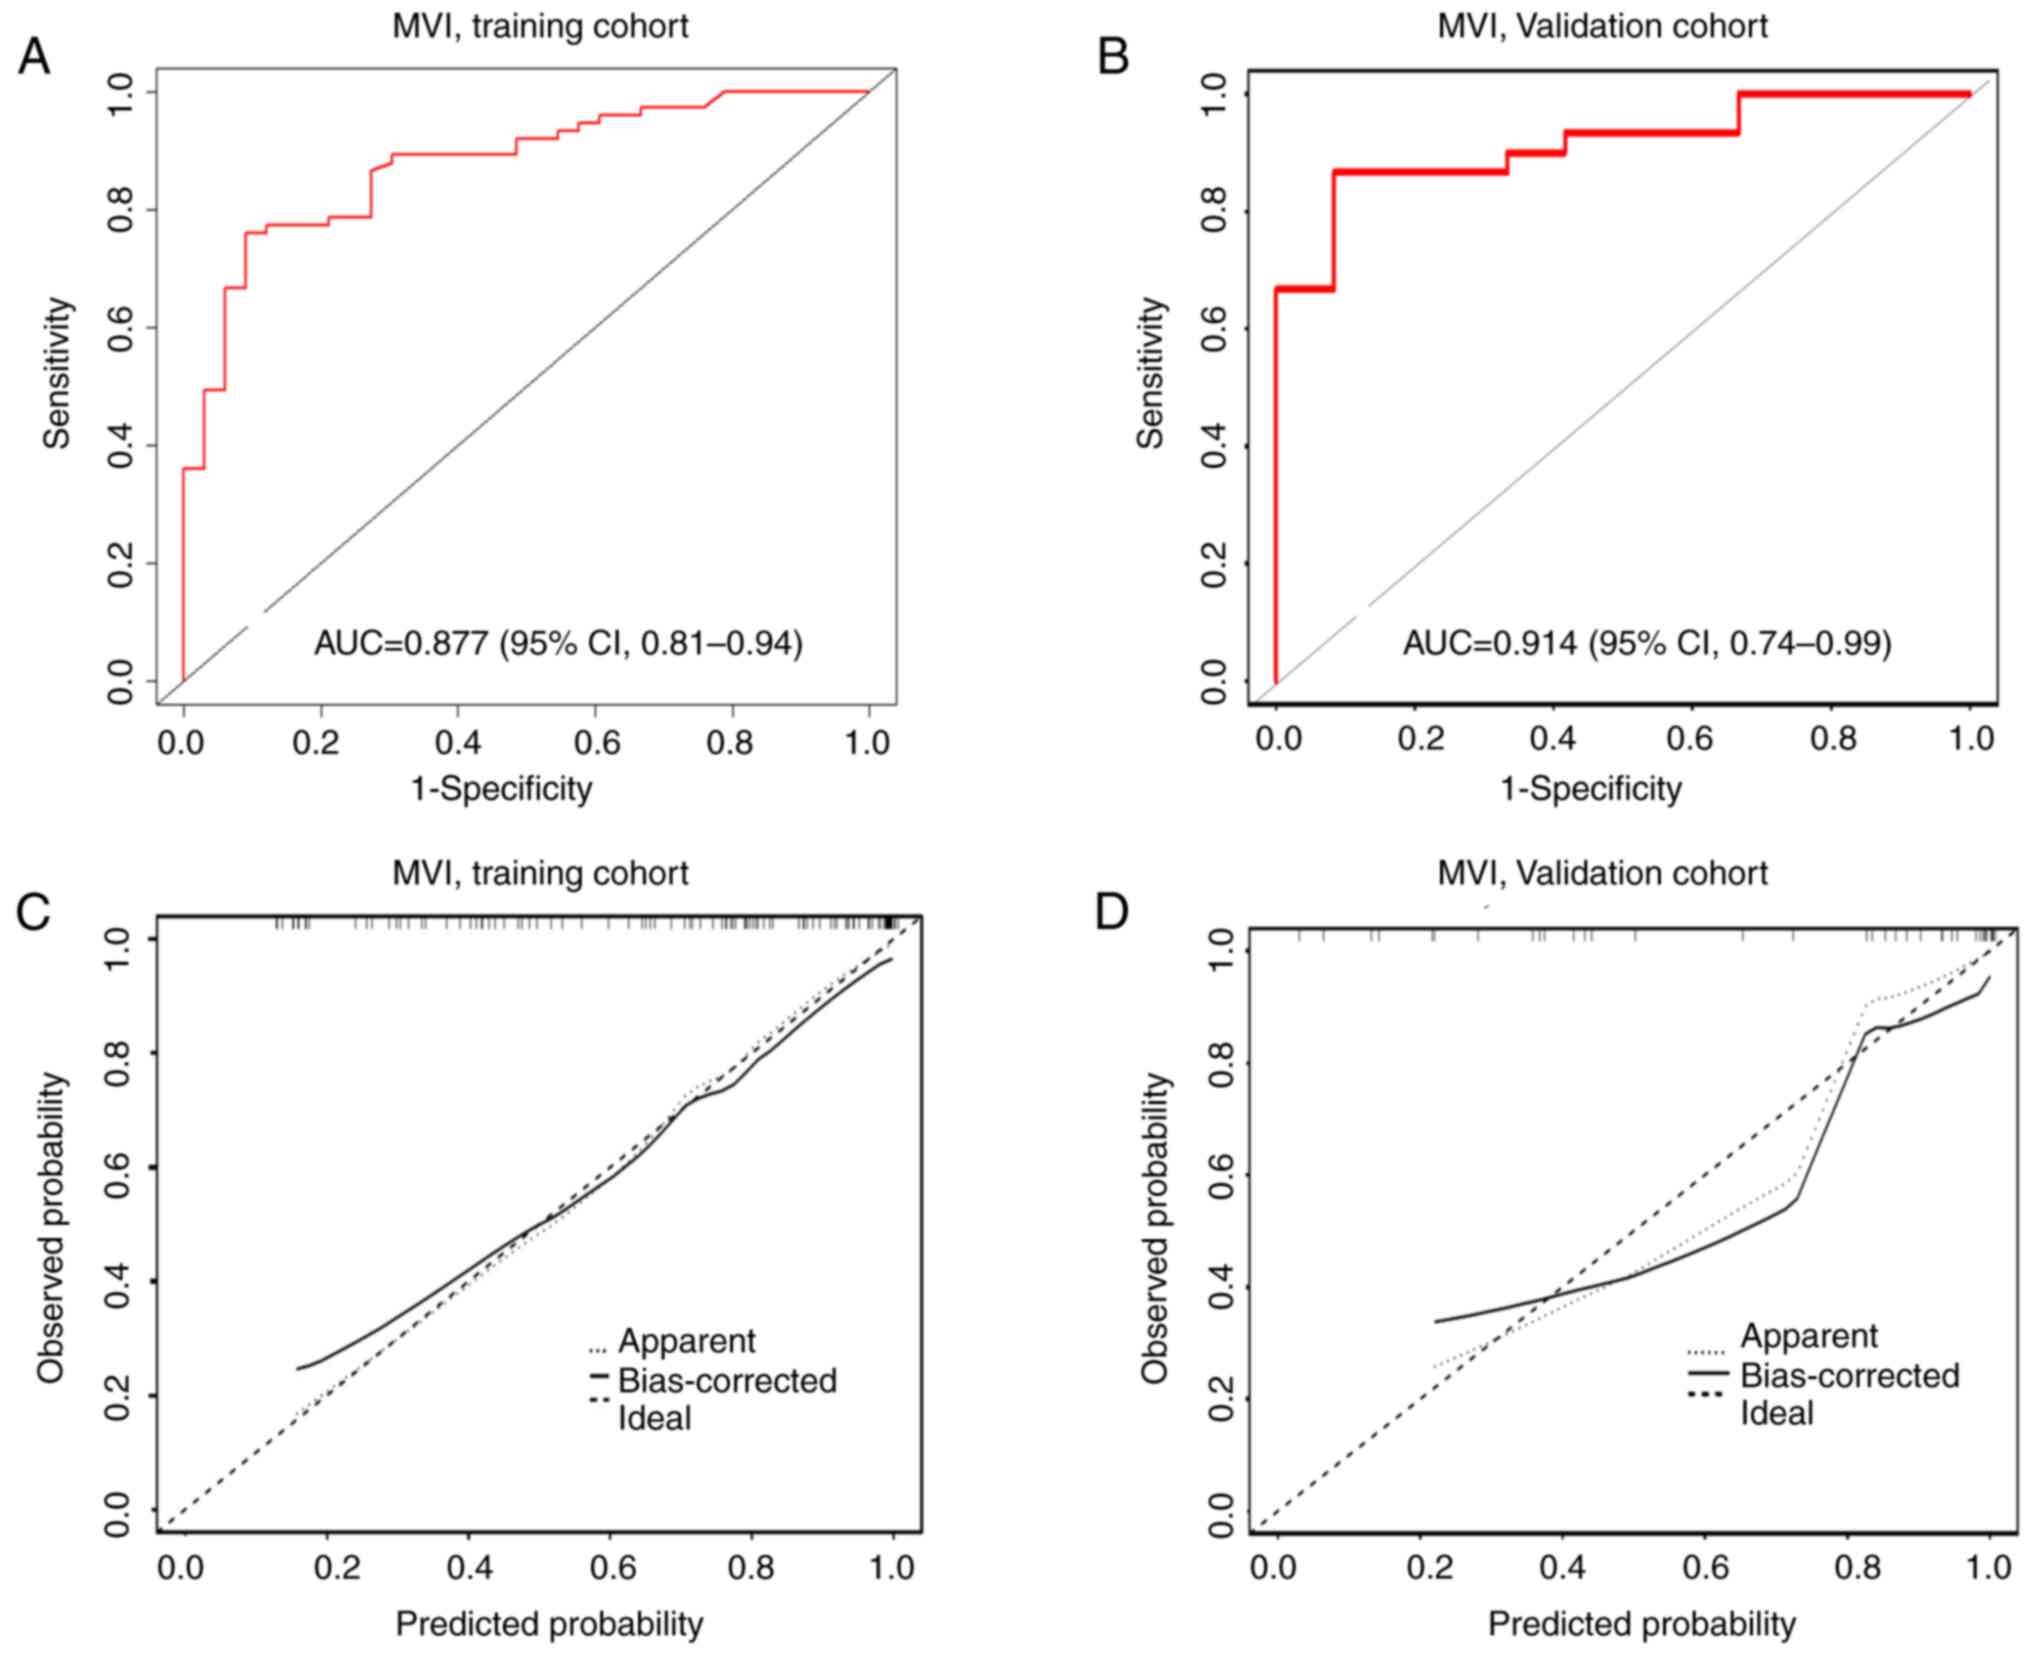
ROC analysis was performed to assess the discriminative capability
of the nomograms. The AUC for the MVI-positive nomogram was 0.877
(95% CI, 0.81–0.94) in the training cohort and 0.914 (95% CI,
0.74–0.99) in the validation cohort (Fig. 3A and B). Furthermore, the
bootstrapped calibration curves, which evaluated the consistency
between the predicted probability and the actual observed results
of the model, were produced for the training cohort and the
validation cohort. The calibration curves also demonstrated good
consistency in the training and validation cohorts, as indicated by
the H-L test (P=0.693 and P=0.703, respectively) with a mean
absolute error of 0.026 for the training cohort (Fig. 3C) and 0.05 for the validation cohort
(Fig. 3D).
DCA results indicated that, for almost all threshold
probabilities, both nomogram models provided a consistently greater
overall net benefit compared with intervening in all or none of the
patients (Fig. S2A and B). This
suggested that the nomograms had practical value in guiding
clinical decision-making. The CIC results demonstrated that, at
different threshold probabilities within a given population, the
predicted number of patients at high risk matched well with the
actual number of patients who were indeed at high risk (as
indicated by the proximity of the red solid line to the blue dashed
line). This indicated that the nomogram models exhibited notable
predictive power, effectively identifying patients at a high risk
for the MVI classification (Fig. S2C
and D).
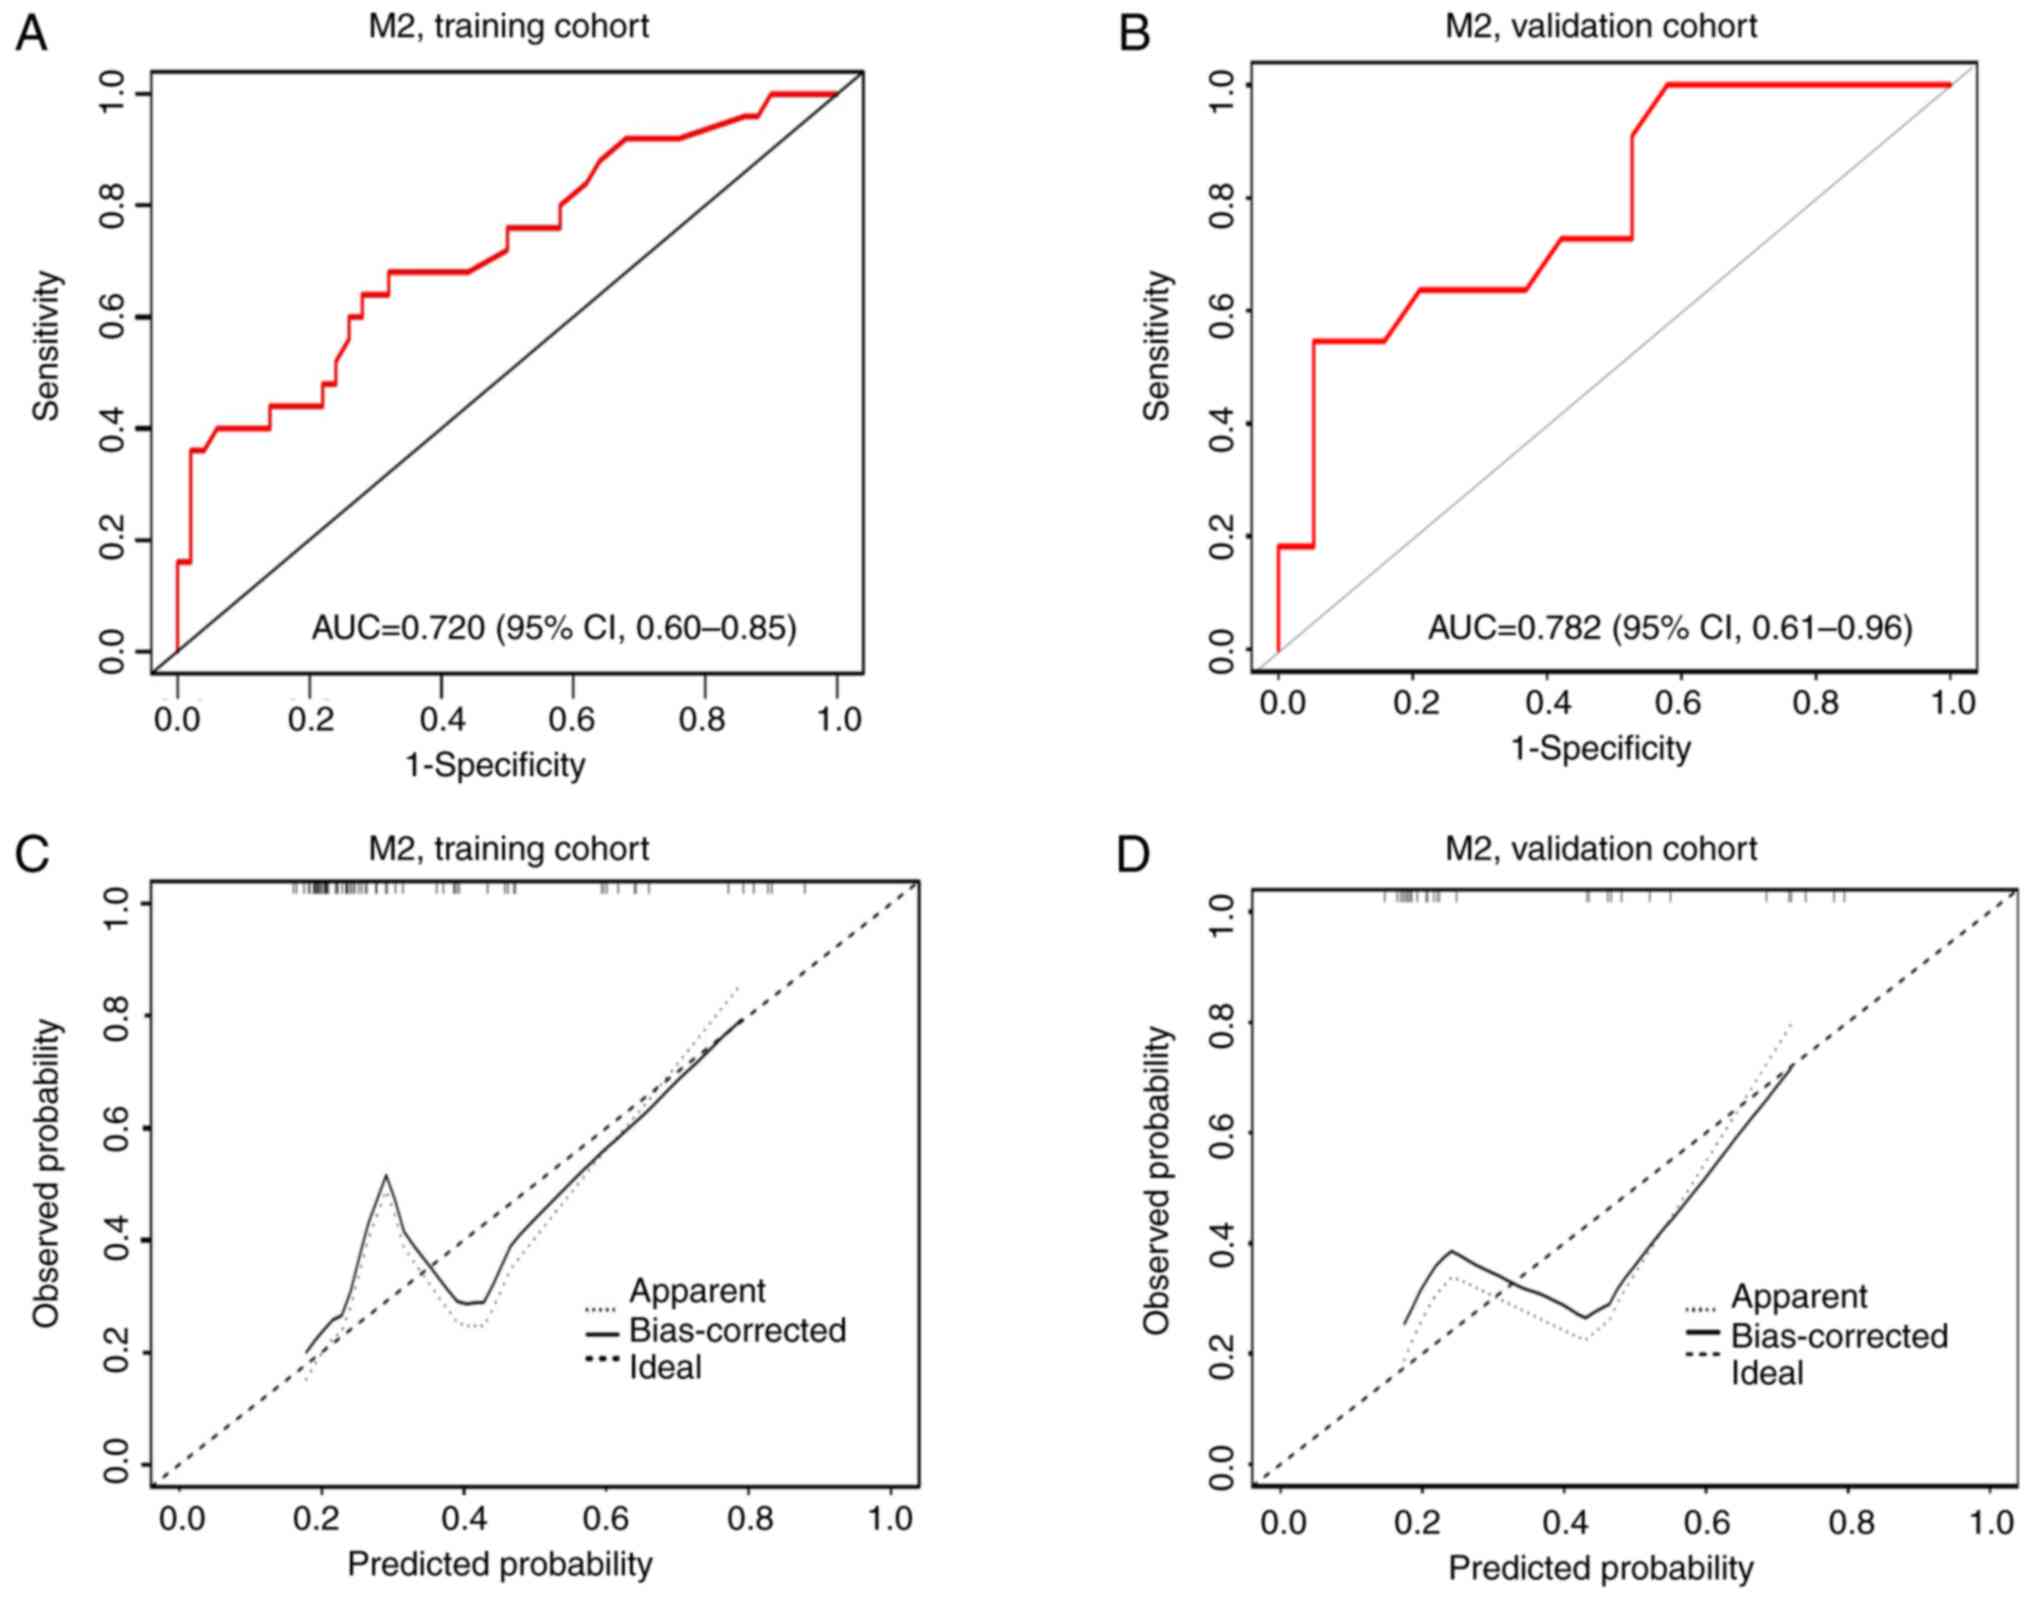
The M2 classification nomogram integrated two
variables, peritumoral hypointensity and tumor size on MRI
(Fig. 2B). The AUC for the M2
classification nomogram was 0.720 (95% CI, 0.60–0.85) in the
training cohort (Fig. 4A) and 0.782
(95% CI, 0.61–0.96) in the validation cohort (Fig. 4B). The calibration curves
demonstrated good consistency in both cohorts, confirmed by the H-L
test (P=0.747 and P=0.406, respectively) with a mean absolute error
of 0.065 for the training cohort (Fig.
4C) and 0.115 for the validation cohort (Fig. 4D). DCA results indicated that, for
almost all threshold probabilities, both nomogram models provided a
consistently greater overall net benefit compared with intervening
in all or none of the patients (Fig.
S3A and B). The CIC results demonstrated that, at different
threshold probabilities within a given population, the predicted
number of patients at high risk matched well with the actual number
of patients who were indeed at high risk (as indicated by the
proximity of the red solid line to the blue dashed line) (Fig. S3C and D). DCA and CIC results
indicated that the nomogram models possessed notable predictive
power and could effectively identify patients at high risk for the
M2 classification (Fig. S3).
Discussion
In the present study, nomogram models capable of
preoperatively predicting MVI-positivity and its M2 classification
in patients with HCC were developed. These models incorporated both
clinical variables and preoperative MRI features, and demonstrated
strong performance in predicting MVI status, with AUC values
ranging between 0.700 and 0.920, consistent with previous findings
(19,21,22). A
notable advantage of the present nomogram model is its reliance on
relatively simple and easily obtainable clinical parameters and MRI
features. Relying on neither complex software nor post-processing
techniques, these tools are convenient for doctors to use in their
practice. The inclusion of accessible variables enhances the
practicality and feasibility of integrating these models into the
routine clinical workflow. Overall, the present study provided
promising tools for the preoperative prediction of MVI-positive
status and the M2 classification in patients with HCC, offering
clinicians information for treatment planning and
decision-making.
MVI is a marker for assessing the invasive behavior,
recurrence and metastasis of HCC (22,23).
Its presence affects the prognosis of patients (24). Grading the risk of MVI through
preoperative assessment can aid doctors in making more informed
treatment decisions. Previous studies have highlighted that severe
MVI classification or M2 grade is a valuable predictor of prognosis
in patients (19,24). Furthermore, Hwang et al
(24) reported that severe MVI is
associated with lower survival rates and more aggressive tumor
behavior. By contrast, there was no significant difference in
survival rates between patients with mild MVI and patients with no
MVI. Xu et al (25) reported
no notable disparity in early recurrence after curative resection
between patients with M0 HCC and patients with M1 HCC; however, the
M2 grade was potentially associated with a poorer prognosis in
patients with HCC. Although numerous studies (6,7,19,21,22,26–28)
have focused on predicting MVI status in patients with HCC, few
have explored the preoperative grading of M2. To the best of our
knowledge, no previous attempts have been made to use clinical and
MRI features for preoperative prediction of the M2 classification
in patients with HCC. Most studies have primarily concentrated
solely on predicting the occurrence of MVI (6,7,21,26–28)
or establishing classification models using enhanced CT radiomics
features and pathological characteristics (19,22).
To the best of our knowledge, there have been no previous studies
using MRI features to non-invasively predict M2 classification in
patients with HCC. Therefore, the present study represents
advancement by developing reliable nomograms based on MRI features
for the preoperative prediction of the M2 grade in patients with
MVI-positive HCC.
Previous studies have compared the predictive
abilities of CT and MRI for MVI in HCC, indicating that they have a
comparable predictive performance (29,30),
with the MRI model exhibiting a slightly higher AUC compared with
the CT model (29). Currently, to
the best of our knowledge, no studies have directly compared the
uses of CT and MRI in predicting the MVI classification. Notably,
the MRI variables (peritumoral hypointensity and tumor size) used
for MVI classification in the present study differed from the CT
variable (tumor margin) mentioned in the Chen et al
(19) study but are consistent with
the Zheng et al (22) study.
These disparities may be attributed to differences in the study
samples. Therefore, future research should use the same samples to
more accurately compare the predictive performance of the two
imaging modalities for MVI classification.
Previous studies have reported associations between
clinical and imaging variables, such as AFP-L3, PIVKA-II, tumor
size, peritumoral enhancement, non-smooth tumor margin and
peritumoral hypointensity, and MVI in patients with HCC (5,19,22,24,31–33).
The present study also demonstrated that high levels of AFP-L3,
PIVKA-II and non-smooth tumor margin were significant risk factors
for MVI. Furthermore, peritumoral hypointensity and tumor size were
significantly associated with the M2 classification, which is
consistent with previous research findings (22). Furthermore, AFP-L3 is a specific
subtype of AFP that is produced by malignant hepatocytes (34) and has rarely been included in
previous models. Nevertheless, several studies have identified
AFP-L3 as an independent risk factor for predicting early
recurrence of HCC (35,36). Furthermore, AFP-L3 has been reported
to reflect poor histological differentiation and unfavorable tumor
behavior, such as early vascular invasion, rapid growth, and
intrahepatic and early distant metastasis (32,36). A
previous imaging study indicated that AFP-L3-positive HCCs are
highly vascularized (37).
PIVKA-II, a novel serum marker for HCC widely used in clinical
practice, has exhibited higher diagnostic sensitivity and
specificity for HCC vascular invasion compared with AFP (38). Wang et al (39) reported an association between
PIVKA-II (>40 mAU/ml) and early recurrence after HCC resection,
identifying it as an independent risk factor for MVI. PIVKA-II has
also been demonstrated to be a reliable predictor of MVI and
survival in patients with HCC (5).
However, in the present study, univariate analysis did not find an
association between AFP-L3 levels or PIVKA-II and M2 grade MVI, and
there was no significant difference between these two variables in
M1 and M2 grading. The distinction between the M1 and M2 grades is
defined by the number of MVIs and the distance from the tumor. This
implies that the levels of AFP-L3 or PIVKA-II may not directly
reflect the number of MVIs or the distance from the tumor, and
thus, they may not be directly associated with the M2
classification.
A meta-analysis has highlighted that the non-smooth
margin of the tumor imaged preoperatively is an indicator of MVI,
suggesting its inclusion in future rating systems (39). Consistently, in the present study, a
non-smooth tumor margin was also demonstrated to be a significant
risk factor for MVI. This observation can be explained by the fact
that MVI typically occurs in extra-tumoral extension areas, and
irregular tumor margins can indicate the invasive biological
behavior of HCC, where infiltration extends from the tumor surface
into the hepatic parenchyma (40).
Notably, tumor size on MRI and peritumoral enhancement were
considered risk factors, as determined by univariate analysis;
however, they were not significant independent predictors of MVI in
the multivariate analysis. This lack of significance might change
with a larger sample size. Despite this, given their association
with MVI in previous studies (5,14,17,19,41,42),
these factors were included in the nomogram to establish a more
comprehensive model. Tumor size was treated as a continuous
variable to capture the full range of sizes and minimize
information loss, aiming for a comprehensive understanding of its
impact on predicting MVI status. A significant difference in tumor
size on MRI was observed between patients with M1 grade MVI and
patients with M2 grade MVI, consistent with previous research
associating larger tumor size with severe MVI (22,39).
We hypothesized that tumor size not only affects the ability of
tumor cells to invade microvessels but is also linked to the number
of MVI sites. However, this association was not identified in a
study by Chen et al (19),
which may be partially due to methodological differences and
potential biases in cohort selection. Future studies with larger
sample sizes and more comprehensive data analysis methods could
provide further insights into the relationship between tumor size
and the number of MVI sites.
The results of the multivariate analysis of M2 grade
risk factors revealed a significant association between peritumoral
hypointensity and the M2 grade. Peritumoral hypointensity may be
associated with the invasion of surrounding structures, reflecting
hemodynamic perfusion changes in HCC with MVI. Specifically,
peritumoral hypointensity is linked to the presence of microscopic
tumor thrombi around the tumor, potentially causing small portal
vein occlusion (43,44). This occlusion can lead to a decrease
or absence of portal vein blood flow, subsequently resulting in
hemodynamic changes (43). Although
Lee et al (43) used a
hepatobiliary contrast agent (HBA), a recent study has shown
non-HBA specific MRI features, including peritumoral hypointensity
in the PVP, may reveal similar pathological changes as the
hypointensity of HBA around the tumor (44). However, previous studies have
reported inconsistent findings regarding the relationship between
MVI and peritumoral hypointensity (14,22,24,33,43).
One reason for this may be variations in imaging examination
methods and contrast agents used. Another factor may be differences
in sample size. Although An et al (32) and Lee et al (14) reported that the presence of
peritumoral hypointensity on hepatobiliary phase images was
specific for the diagnosis of MVI in HCC, their studies did not
classify MVI into different grades, and thus, the relationship
between MVI grading and peritumoral hypointensity remains
unconfirmed. As grading of MVI is defined by the number of MVIs and
their distance from the tumor, and peritumoral hypointensity is
associated with MVI grading, the results of the present study
suggested that peritumoral hypointensity affects the number of MVI
sites and the distance of MVI from the tumor. However, further
large-scale studies using consistent methodologies are required to
confirm this association.
The present study had some limitations. Firstly,
this was a single-center and relatively small sample size study,
and it would be beneficial to conduct larger-scale studies
involving multiple centers to validate and further assess the
relationships identified. Secondly, the retrospective nature of the
present study introduced the possibility of selection bias in case
selection. To mitigate this, a continuous case collection approach
was used to minimize potential bias. Thirdly, although the present
study evaluated the relationship between imaging features and tumor
biological behavior, acknowledging that these imaging features may
not comprehensively explain the complex underlying mechanisms is
crucial. Furthermore, additional research is warranted to further
elucidate the underlying biological processes and their association
with the demonstrated imaging findings.
In conclusion, the present study developed and
validated nomograms that integrate clinical parameters and
preoperative MRI features for the prediction of MVI-positivity and
the M2 classification in patients with HCC. These nomograms offer
noninvasive, straightforward and practical tools to allow
clinicians to formulate rational treatment strategies.
Supplementary Material
Supporting Data
Supporting Data
Acknowledgements
Not applicable.
Funding
Funding: No funding was received.
Availability of data and materials
The data generated in the present study are not
publicly available due to use in further studies but may be
requested from the corresponding author.
Authors' contributions
HLL designed the study. HLL, YNZ, YYH and LL
acquired the patient data. MGL, YYH and HLL analyzed and
interpreted the data. MGL and HLL wrote, reviewed and revised the
manuscript. HLL and YNZ confirm the authenticity of all the raw
data. All authors read and approved the final version of the
manuscript.
Ethics approval and consent to
participate
The present retrospective study was approved by the
Institutional Ethics Committee of the Shengli Oilfield Central
Hospital (approval no. YXLL202400701; Dongying, China), which
waived the requirement for written informed consent.
Patient consent for publication
Not applicable.
Competing interests
The authors declare that they have no competing
interests.
References
|
1
|
Bray F, Ferlay J, Soerjomataram I, Siegel
RL, Torre LA and Jemal A: Global cancer statistics 2018: GLOBOCAN
estimates of incidence and mortality worldwide for 36 cancers in
185 countries. CA Cancer J Clin. 68:394–424. 2018. View Article : Google Scholar : PubMed/NCBI
|
|
2
|
Earl TM and Chapman WC: Hepatocellular
carcinoma: Resection versus transplantation. Semin Liver Dis.
33:282–292. 2013. View Article : Google Scholar : PubMed/NCBI
|
|
3
|
Chidambaranathan-Reghupaty S, Fisher PB
and Sarkar D: Hepatocellular carcinoma (HCC): Epidemiology,
etiology and molecular classification. Adv Cancer Res. 149:1–61.
2021. View Article : Google Scholar : PubMed/NCBI
|
|
4
|
Heimbach JK, Kulik LM, Finn RS, Sirlin CB,
Abecassis MM, Roberts LR, Zhu AX, Murad MH and Marrero JA: AASLD
guidelines for the treatment of hepatocellular carcinoma.
Hepatology. 67:358–380. 2018. View Article : Google Scholar : PubMed/NCBI
|
|
5
|
Kaibori M, Ishizaki M, Matsui K and Kwon
AH: Predictors of microvascular invasion before hepatectomy for
hepatocellular carcinoma. J Surg Oncol. 102:462–468. 2010.
View Article : Google Scholar : PubMed/NCBI
|
|
6
|
Wang H, Liu R, Mo H, Li R, Lian J, Liu Q
and Han S: A novel nomogram predicting the early recurrence of
hepatocellular carcinoma patients after R0 resection. Front Oncol.
13:11338072023. View Article : Google Scholar : PubMed/NCBI
|
|
7
|
Chen YD, Zhang L, Zhou ZP, Lin B, Jiang
ZJ, Tang C, Dang YW, Xia YW, Song B and Long LL: Radiomics and
nomogram of magnetic resonance imaging for preoperative prediction
of microvascular invasion in small hepatocellular carcinoma. World
J Gastroenterol. 28:4399–4416. 2022. View Article : Google Scholar : PubMed/NCBI
|
|
8
|
Cao Y, Ke R, Wang S, Zhu X, Chen J, Huang
C, Jiang Y and Lv L: DNA topoisomerase IIα and Ki67 are prognostic
factors in patients with hepatocellular carcinoma. Oncol Lett.
13:4109–4116. 2017. View Article : Google Scholar : PubMed/NCBI
|
|
9
|
Wang H, Qian YW, Wu MC and Cong WM: Liver
resection is justified in patients with BCLC intermediate stage
hepatocellular carcinoma without microvascular invasion. J
Gastrointest Surg. 24:2737–2747. 2020. View Article : Google Scholar : PubMed/NCBI
|
|
10
|
Sumie S, Nakashima O, Okuda K, Kuromatsu
R, Kawaguchi A, Nakano M, Satani M, Yamada S, Okamura S, Hori M, et
al: The significance of classifying microvascular invasion in
patients with hepatocellular carcinoma. Ann Surg Oncol.
21:1002–1009. 2014. View Article : Google Scholar : PubMed/NCBI
|
|
11
|
Wang L, Jin YX, Ji YZ, Mu Y, Zhang SC and
Pan SY: Development and validation of a prediction model for
microvascular invasion in hepatocellular carcinoma. World J
Gastroenterol. 26:1647–1659. 2020. View Article : Google Scholar : PubMed/NCBI
|
|
12
|
Lim KC, Chow PK, Allen JC, Chia GS, Lim M,
Cheow PC, Chung AY, Ooi LL and Tan SB: Microvascular invasion is a
better predictor of tumor recurrence and overall survival following
surgical resection for hepatocellular carcinoma compared to the
Milan criteria. Ann Surg. 254:108–113. 2011. View Article : Google Scholar : PubMed/NCBI
|
|
13
|
Xu X, Zhang HL, Liu QP, Sun SW, Zhang J,
Zhu FP, Yang G, Yan X, Zhang YD and Liu XS: Radiomic analysis of
contrast-enhanced CT predicts microvascular invasion and outcome in
hepatocellular carcinoma. J Hepatol. 70:1133–1144. 2019. View Article : Google Scholar : PubMed/NCBI
|
|
14
|
Lee S, Kim SH, Lee JE, Sinn DH and Park
CK: Preoperative gadoxetic acid-enhanced MRI for predicting
microvascular invasion in patients with single hepatocellular
carcinoma. J Hepatol. 67:526–534. 2017. View Article : Google Scholar : PubMed/NCBI
|
|
15
|
Lei Z, Li J, Wu D, Xia Y, Wang Q, Si A,
Wang K, Wan X, Lau WY, Wu M and Shen F: Nomogram for preoperative
estimation of microvascular invasion risk in hepatitis B
virus-related hepatocellular carcinoma within the Milan Criteria.
JAMA Surg. 151:356–363. 2016. View Article : Google Scholar : PubMed/NCBI
|
|
16
|
Ma X, Wei J, Gu D, Zhu Y, Feng B, Liang M,
Wang S, Zhao X and Tian J: Preoperative radiomics nomogram for
microvascular invasion prediction in hepatocellular carcinoma using
contrast-enhanced CT. Eur Radiol. 29:3595–3605. 2019. View Article : Google Scholar : PubMed/NCBI
|
|
17
|
Chong HH, Yang L, Sheng RF, Yu YL, Wu DJ,
Rao SX, Yang C and Zeng MS: Multi-scale and multi-parametric
radiomics of gadoxetate disodium-enhanced MRI predicts
microvascular invasion and outcome in patients with solitary
hepatocellular carcinoma ≤5 cm. Eur Radiol. 31:4824–4838. 2021.
View Article : Google Scholar : PubMed/NCBI
|
|
18
|
Cong WM, Bu H and Chen J, Dong H, Zhu YY,
Feng LH and Chen J; Guideline Committee, : Practice guidelines for
the pathological diagnosis of primary liver cancer: 2015 Update.
World J Gastroenterol. 22:9279–9287. 2016. View Article : Google Scholar : PubMed/NCBI
|
|
19
|
Chen S, Wang C, Gu Y, Ruan R, Yu J and
Wang S: Prediction of microvascular invasion and its M2
classification in hepatocellular carcinoma based on nomogram
analyses. Front Oncol. 11:7748002022. View Article : Google Scholar : PubMed/NCBI
|
|
20
|
Edmondson HA and Steiner PE: Primary
CARCINOMA OF THE LIver: A study of 100 cases among 48,900
necropsies. Cancer. 7:462–503. 1954. View Article : Google Scholar : PubMed/NCBI
|
|
21
|
Zhang S, Duan C, Zhou X, Liu F, Wang X,
Shao Q, Gao Y, Duan F, Zhao R and Wang G: Radiomics nomogram for
prediction of microvascular invasion in hepatocellular carcinoma
based on MR imaging with Gd-EOB-DTPA. Front Oncol. 12:10345192022.
View Article : Google Scholar : PubMed/NCBI
|
|
22
|
Zheng X, Xu YJ, Huang J, Cai S and Wang W:
Predictive value of radiomics analysis of enhanced CT for
three-tiered microvascular invasion grading in hepatocellular
carcinoma. Med Phys. 50:6079–6095. 2023. View Article : Google Scholar : PubMed/NCBI
|
|
23
|
Roayaie S, Blume IN, Thung SN, Guido M,
Fiel MI, Hiotis S, Labow DM, Llovet JM and Schwartz ME: A system of
classifying microvascular invasion to predict outcome after
resection in patients with hepatocellular carcinoma.
Gastroenterology. 137:850–855. 2009. View Article : Google Scholar : PubMed/NCBI
|
|
24
|
Hwang YJ, Bae JS, Lee Y, Hur BY, Lee DH
and Kim H: Classification of microvascular invasion of
hepatocellular carcinoma: Correlation with prognosis and magnetic
resonance imaging. Clin Mol Hepatol. 29:733–746. 2023. View Article : Google Scholar : PubMed/NCBI
|
|
25
|
Xu W, Li R and Liu F: Novel prognostic
nomograms for predicting early and late recurrence of
hepatocellular carcinoma after curative hepatectomy. Cancer Manag
Res. 12:1693–1712. 2020. View Article : Google Scholar : PubMed/NCBI
|
|
26
|
Yang L, Gu D, Wei J, Yang C, Rao S, Wang
W, Chen C, Ding Y, Tian J and Zeng M: A radiomics nomogram for
preoperative prediction of microvascular invasion in hepatocellular
carcinoma. Liver Cancer. 8:373–386. 2019. View Article : Google Scholar : PubMed/NCBI
|
|
27
|
Liu J, Cheng D, Liao Y, Luo C, Lei Q,
Zhang X, Wang L, Wen Z and Gao M: Development of a magnetic
resonance imaging-derived radiomics model to predict microvascular
invasion in patients with hepatocellular carcinoma. Quant Imaging
Med Surg. 13:3948–3961. 2023. View Article : Google Scholar : PubMed/NCBI
|
|
28
|
Zhang X, Ruan S, Xiao W, Shao J, Tian W,
Liu W, Zhang Z, Wan D, Huang J, Huang Q, et al: Contrast-enhanced
CT radiomics for preoperative evaluation of microvascular invasion
in hepatocellular carcinoma: A two-center study. Clin Transl Med.
10:e1112020. View Article : Google Scholar : PubMed/NCBI
|
|
29
|
Meng XP, Wang YC, Zhou JY, Yu Q, Lu CQ,
Xia C, Tang TY, Xu J, Sun K, Xiao W and Ju S: Comparison of MRI and
CT for the prediction of microvascular invasion in solitary
hepatocellular carcinoma based on a non-radiomics and radiomics
method: Which imaging modality is better? J Magn Reson Imaging.
54:526–536. 2021. View Article : Google Scholar : PubMed/NCBI
|
|
30
|
Wei JW, Jiang HY, Zeng MS, Wang MY, Niu M,
Gu DS, Chong H, Zhang Y, Fu F, Zhou M, et al: Prediction of
microvascular invasion in hepatocellular carcinoma via deep
learning: A multi-center and prospective validation study. Cancers
(Basel). 13:23682021. View Article : Google Scholar : PubMed/NCBI
|
|
31
|
Hirokawa F, Hayashi M, Miyamoto Y, Asakuma
M, Shimizu T, Komeda K, Inoue Y and Uchiyama K: Outcomes and
predictors of microvascular invasion of solitary hepatocellular
carcinoma. Hepatol Res. 44:846–853. 2014. View Article : Google Scholar : PubMed/NCBI
|
|
32
|
An C, Rhee H, Han K, Choi JY, Park YN,
Park MS, Kim MJ and Park S: Added value of smooth hypointense rim
in the hepatobiliary phase of gadoxetic acid-enhanced MRI in
identifying tumour capsule and diagnosing hepatocellular carcinoma.
Eur Radiol. 27:2610–2618. 2017. View Article : Google Scholar : PubMed/NCBI
|
|
33
|
Kim KA, Kim MJ, Jeon HM, Kim KS, Choi JS,
Ahn SH, Cha SJ and Chung YE: Prediction of microvascular invasion
of hepatocellular carcinoma: Usefulness of peritumoral
hypointensity seen on gadoxetate disodium-enhanced hepatobiliary
phase images. J Magn Reson Imaging. 35:629–634. 2012. View Article : Google Scholar : PubMed/NCBI
|
|
34
|
Force M, Park G, Chalikonda D, Roth C,
Cohen M, Halegoua-DeMarzio D and Hann HW: Alpha-fetoprotein (AFP)
and AFP-L3 is most useful in detection of recurrence of
hepatocellular carcinoma in patients after tumor ablation and with
low AFP level. Viruses. 14:7752022. View Article : Google Scholar : PubMed/NCBI
|
|
35
|
Imura S, Teraoku H, Yoshikawa M, Ishikawa
D, Yamada S, Saito Y, Iwahashi S, Ikemoto T, Morine Y and Shimada
M: Potential predictive factors for microvascular invasion in
hepatocellular carcinoma classified within the Milan criteria. Int
J Clin Oncol. 23:98–103. 2018. View Article : Google Scholar : PubMed/NCBI
|
|
36
|
Liu W, Song K, Zheng W, Huo L, Zhang S, Xu
X, Wang P and Jia N: Hepatobiliary phase features of preoperative
gadobenate-enhanced mr can predict early recurrence of
hepatocellular carcinoma in patients who underwent anatomical
hepatectomy. Front Oncol. 12:8629672022. View Article : Google Scholar : PubMed/NCBI
|
|
37
|
Kumada T, Nakano S, Takeda I, Kiriyama S,
Sone Y, Hayashi K, Katoh H, Endoh T, Sassa T and Satomura S:
Clinical utility of Lens culinaris agglutinin-reactive
alpha-fetoprotein in small hepatocellular carcinoma: Special
reference to imaging diagnosis. J Hepatol. 30:125–130. 1999.
View Article : Google Scholar : PubMed/NCBI
|
|
38
|
Miyaaki H, Nakashima O, Kurogi M, Eguchi K
and Kojiro M: Lens culinaris agglutinin-reactive
alpha-fetoprotein and protein induced by vitamin K absence II are
potential indicators of a poor prognosis: A histopathological study
of surgically resected hepatocellular carcinoma. J Gastroenterol.
42:962–968. 2007. View Article : Google Scholar : PubMed/NCBI
|
|
39
|
Wang MD, Sun LY, Qian GJ, Li C, Gu LH, Yao
LQ, Diao YK, Pawlik TM, Lau WY, Huang DS, et al: Prothrombin
induced by vitamin K Absence-II versus alpha-fetoprotein in
detection of both resectable hepatocellular carcinoma and early
recurrence after curative liver resection: A retrospective cohort
study. Int J Surg. 105:1068432022. View Article : Google Scholar : PubMed/NCBI
|
|
40
|
Hu H, Zheng Q, Huang Y, Huang XW, Lai ZC,
Liu J, Xie X, Feng ST, Wang W and Lu M: A non-smooth tumor margin
on preoperative imaging assesses microvascular invasion of
hepatocellular carcinoma: A systematic review and meta-analysis.
Sci Rep. 7:153752017. View Article : Google Scholar : PubMed/NCBI
|
|
41
|
Xu W, Wang Y, Yang Z, Li J, Li R and Liu
F: New insights into a classification-based microvascular invasion
prediction model in hepatocellular carcinoma: A multicenter study.
Front Oncol. 12:7963112022. View Article : Google Scholar : PubMed/NCBI
|
|
42
|
Wang L, Feng B, Li D, Liang M, Wang S,
Wang S, Ma X and Zhao X: Risk stratification of solitary
hepatocellular carcinoma ≤5 cm without microvascular invasion:
Prognostic values of MR imaging features based on LI-RADS and
clinical parameters. Eur Radiol. 33:3592–3603. 2023. View Article : Google Scholar : PubMed/NCBI
|
|
43
|
Lee S, Kang TW, Song KD, Lee MW, Rhim H,
Lim HK, Kim SY, Sinn DH, Kim JM, Kim K and Ha SY: Effect of
microvascular invasion risk on early recurrence of hepatocellular
carcinoma after surgery and radiofrequency ablation. Ann Surg.
273:564–571. 2021. View Article : Google Scholar : PubMed/NCBI
|
|
44
|
Jiang H, Wei H, Yang T, Qin Y, Wu Y, Chen
W, Shi Y, Ronot M, Bashir MR and Song B: VICT2 trait: Prognostic
alternative to peritumoral hepatobiliary phase hypointensity in
HCC. Radiology. 307:e2218352023. View Article : Google Scholar : PubMed/NCBI
|