Introduction
Adrenal incidentalomas (AIs) are frequently observed
during clinical investigation and the detection rate is increasing
with the increasing role of CT, MRI and PET in diagnosing, staging,
and follow-up of malignancies (1,2). Among
AIs, 70–80% are adenomas and only ~5% are metastases, but the risk
of metastases increases substantially in patients with a history of
lung cancer. Numerous patients with lung cancer at the time of
diagnosis present with distant metastases, with the adrenal gland
the frequent site of metastatic spread (3,4). In a
number of cases, a specific diagnosis of AIs can be established
through a combination of endocrine function tests, clinical symptom
assessment and radiological analysis. However, in patients with a
history of lung cancer and non-functioning AIs, radiologic
characteristics play an important role in evaluating those patients
(5,6). Furthermore, when a small AI [long
diameter (LD) ≤4 cm] with pre-enhanced CT value (CTpre)
≥10 Hounsfield units (HU) is detected at the initial chest or
abdominal plain CT scan, immediate differentiation between
metastases and lipid-poor adenomas (LPAs) can be challenging due to
overlapping imaging features (7–9). As a
result, additional confirmatory steps, such as adrenal washout CT,
chemical-shift MRI, PET/CT scans or biopsies, may be required for
an accurate diagnosis (10–14).
Although the use of adrenal washout CT for
characterizing LPAs has demonstrated relatively high sensitivity
and specificity (15), several
drawbacks warrant consideration, such as radiation hazards,
additional cost and the potential risks associated with contrast
media, including potential renal damage and allergic reactions. In
addition, in vulnerable populations such as patients with diabetes
or renal insufficiency, and the elderly and paediatric populations,
the potential risks may be further exacerbated. Chemical-shift MRI,
which is the most sensitive examination method, still leaves a
portion of LPAs (~10–20%) as indeterminate. Additionally, not all
patients have high-quality MRI images, and some patients have
contraindications for MRI examination (16,17).
As for PET/CT scans, there is a certain overlap in
fluorodeoxyglucose uptake between metastases and adenomas (18). Moreover, PET/CT is not commonly
available in a number of medical institutions, and thus results in
greater financial and time costs for the patient. Adrenal biopsy,
as an invasive test, may lead to some complications (19).
Therefore, it would be of great significance if the
images could provide more valuable information to help identify
LPAs from metastases in patients with lung cancer on the initial
discovery examination, which is usually a chest or abdominal plain
CT scan, especially for patients with diabetes or renal
insufficiency.
Radiomics can extract larger numbers of objective
and quantitative image-related features from CT images. These
features encompass texture, geometry and intensity, offering
insights into tumor heterogeneity and enabling the exploration of
potential correlations between pathophysiology and biomedical
images (20,21). A combined radiomic model
incorporating radiomic features with relevant clinical and imaging
features, as a complex bioinformatics mining tool, may improve the
accuracy of differential diagnosis, classification and prediction
(22,23). However, the specific effectiveness
of the Radscore and the combined radiomic model based on unenhanced
CT in differentiating LPAs from metastases in patients with lung
cancer is not known.
Thus, the present retrospective study attempts to
develop and validate a clinical-imaging-radiomic nomogram combining
the Radscore with significant clinical-imaging features based on
initial unenhanced CT to differentiate LPAs from metastases in
patients with lung cancer with small hyperattenuating AIs.
Materials and methods
Patients
The present study received approval (approval no.
RMYY-LLKS-2023202) from Tangshan People's Hospital Institutional
Ethics Committee (Tangshan, China). Written informed consent was
obtained from all patients regarding the use and publication of
their existing clinical-pathological-CT data. Patients with a
history of histopathological verification of lung cancer before or
after undergoing chest or abdominal plain CT scan with diagnostic
indications such as ‘adrenal metastasis’ or ‘adrenal adenoma’ or
‘adrenal nodule or mass’ from January 2014 to March 2022 were
included at Tangshan People's hospital (Tangshan, China). Inclusion
criteria were as follows: i) CTpre ≥10 HU and small
unilateral lesions; ii) non-functioning adrenal tumor; and iii)
availability of complete imaging and clinical data. The eligibility
criteria for diagnosing adrenal metastases were as follows: i)
Histological confirmation through needle biopsy or resection
specimen (n=2); ii) interval development of an adrenal mass
compared with a previous CT scan showing a normal adrenal gland
(n=63); and iii) short-term interval growth [a 20% reduce or
increase in the total sum of the disease within six months
(24)] in the same patient (n=29).
The eligibility criteria for diagnosing LPAs were as follows: i)
Surgical excision with subsequent histopathological assessment
(n=81); and ii) stability in size after at least 1-year interval
(mean follow-up time, 738±601 days; n=21) (25).
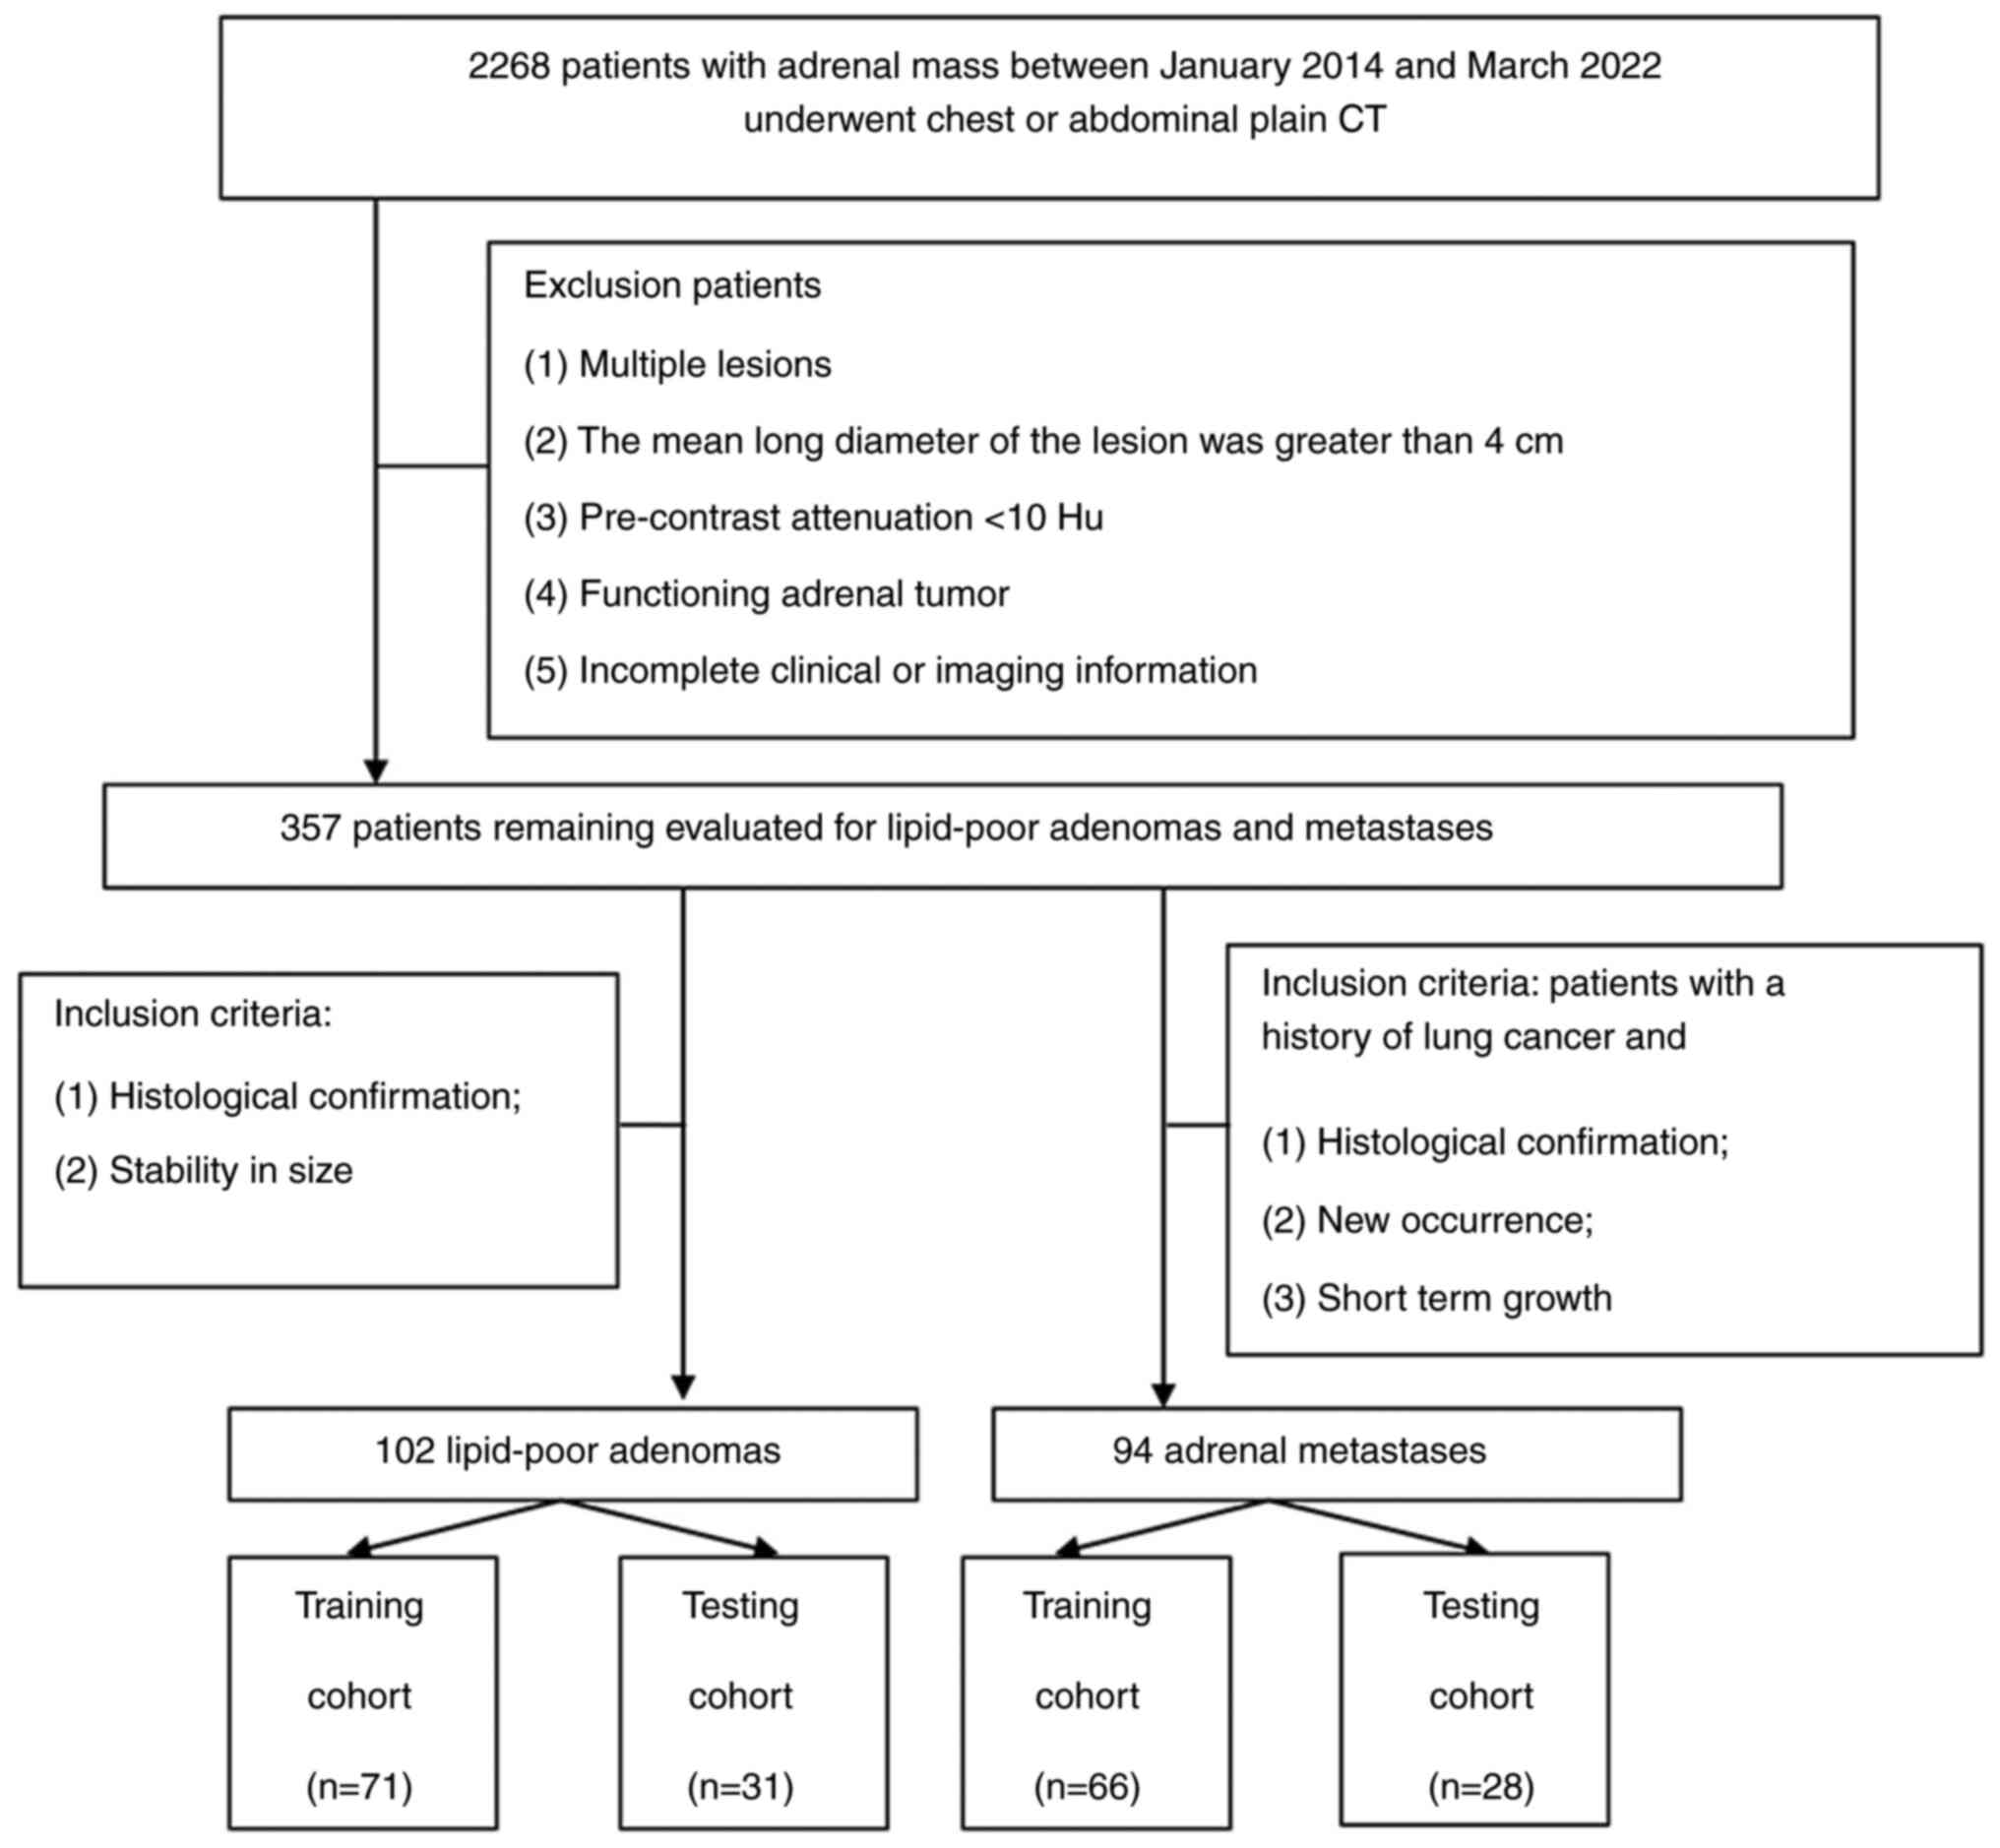
The present study included a total of 196 patients
with adrenal lesions, consisting of 94 metastases and 102 LPAs. The
patients were randomly divided into a training cohort (n=137,
comprising 66 metastases and 71 LPAs) and a testing cohort (n=59,
comprising 28 metastases and 31 LPAs) using a random seed method at
a ratio of 7:3 (Fig. 1).
Images protocol
Given the retrospective nature of the present study,
multiple CT scanners were employed, including the Brilliance 16 and
Ingenuity core 64 (Philips Healthcare) and the GE Discovery CT 750
HD (Cytiva). All patients underwent chest or abdominal plain CT
scans, with the following scanning parameters: 120 Kv, automatic
tube current of 200–300 mA, 2 or 5-mm slice thickness, and then 5
mm images were reconstructed with a section thickness of 1.25 or 2
mm.
Imaging features
The LD, short diameter (SD), shape, laterality
(right or left), border, homogeneity, CTpre and
calcification of AIs were independently measured and assessed by
two radiologists who possessed 6 and 10 years of experience in
diagnosing abdominal CT images using thin-sliced plain CT scans.
The LD and SD measurements were taken at the maximum cross-section
of the AIs. A region of interest covering two-thirds of the maximum
axial area of the nodule was delineated, ensuring exclusion of
adjacent fat. In some cases, their results were consistent and
their results were directly used in subsequent analyses; When there
was a disagreement, a consensus was reached through discussion
(26).
Radiomics feature extraction,
selection and Radscore building
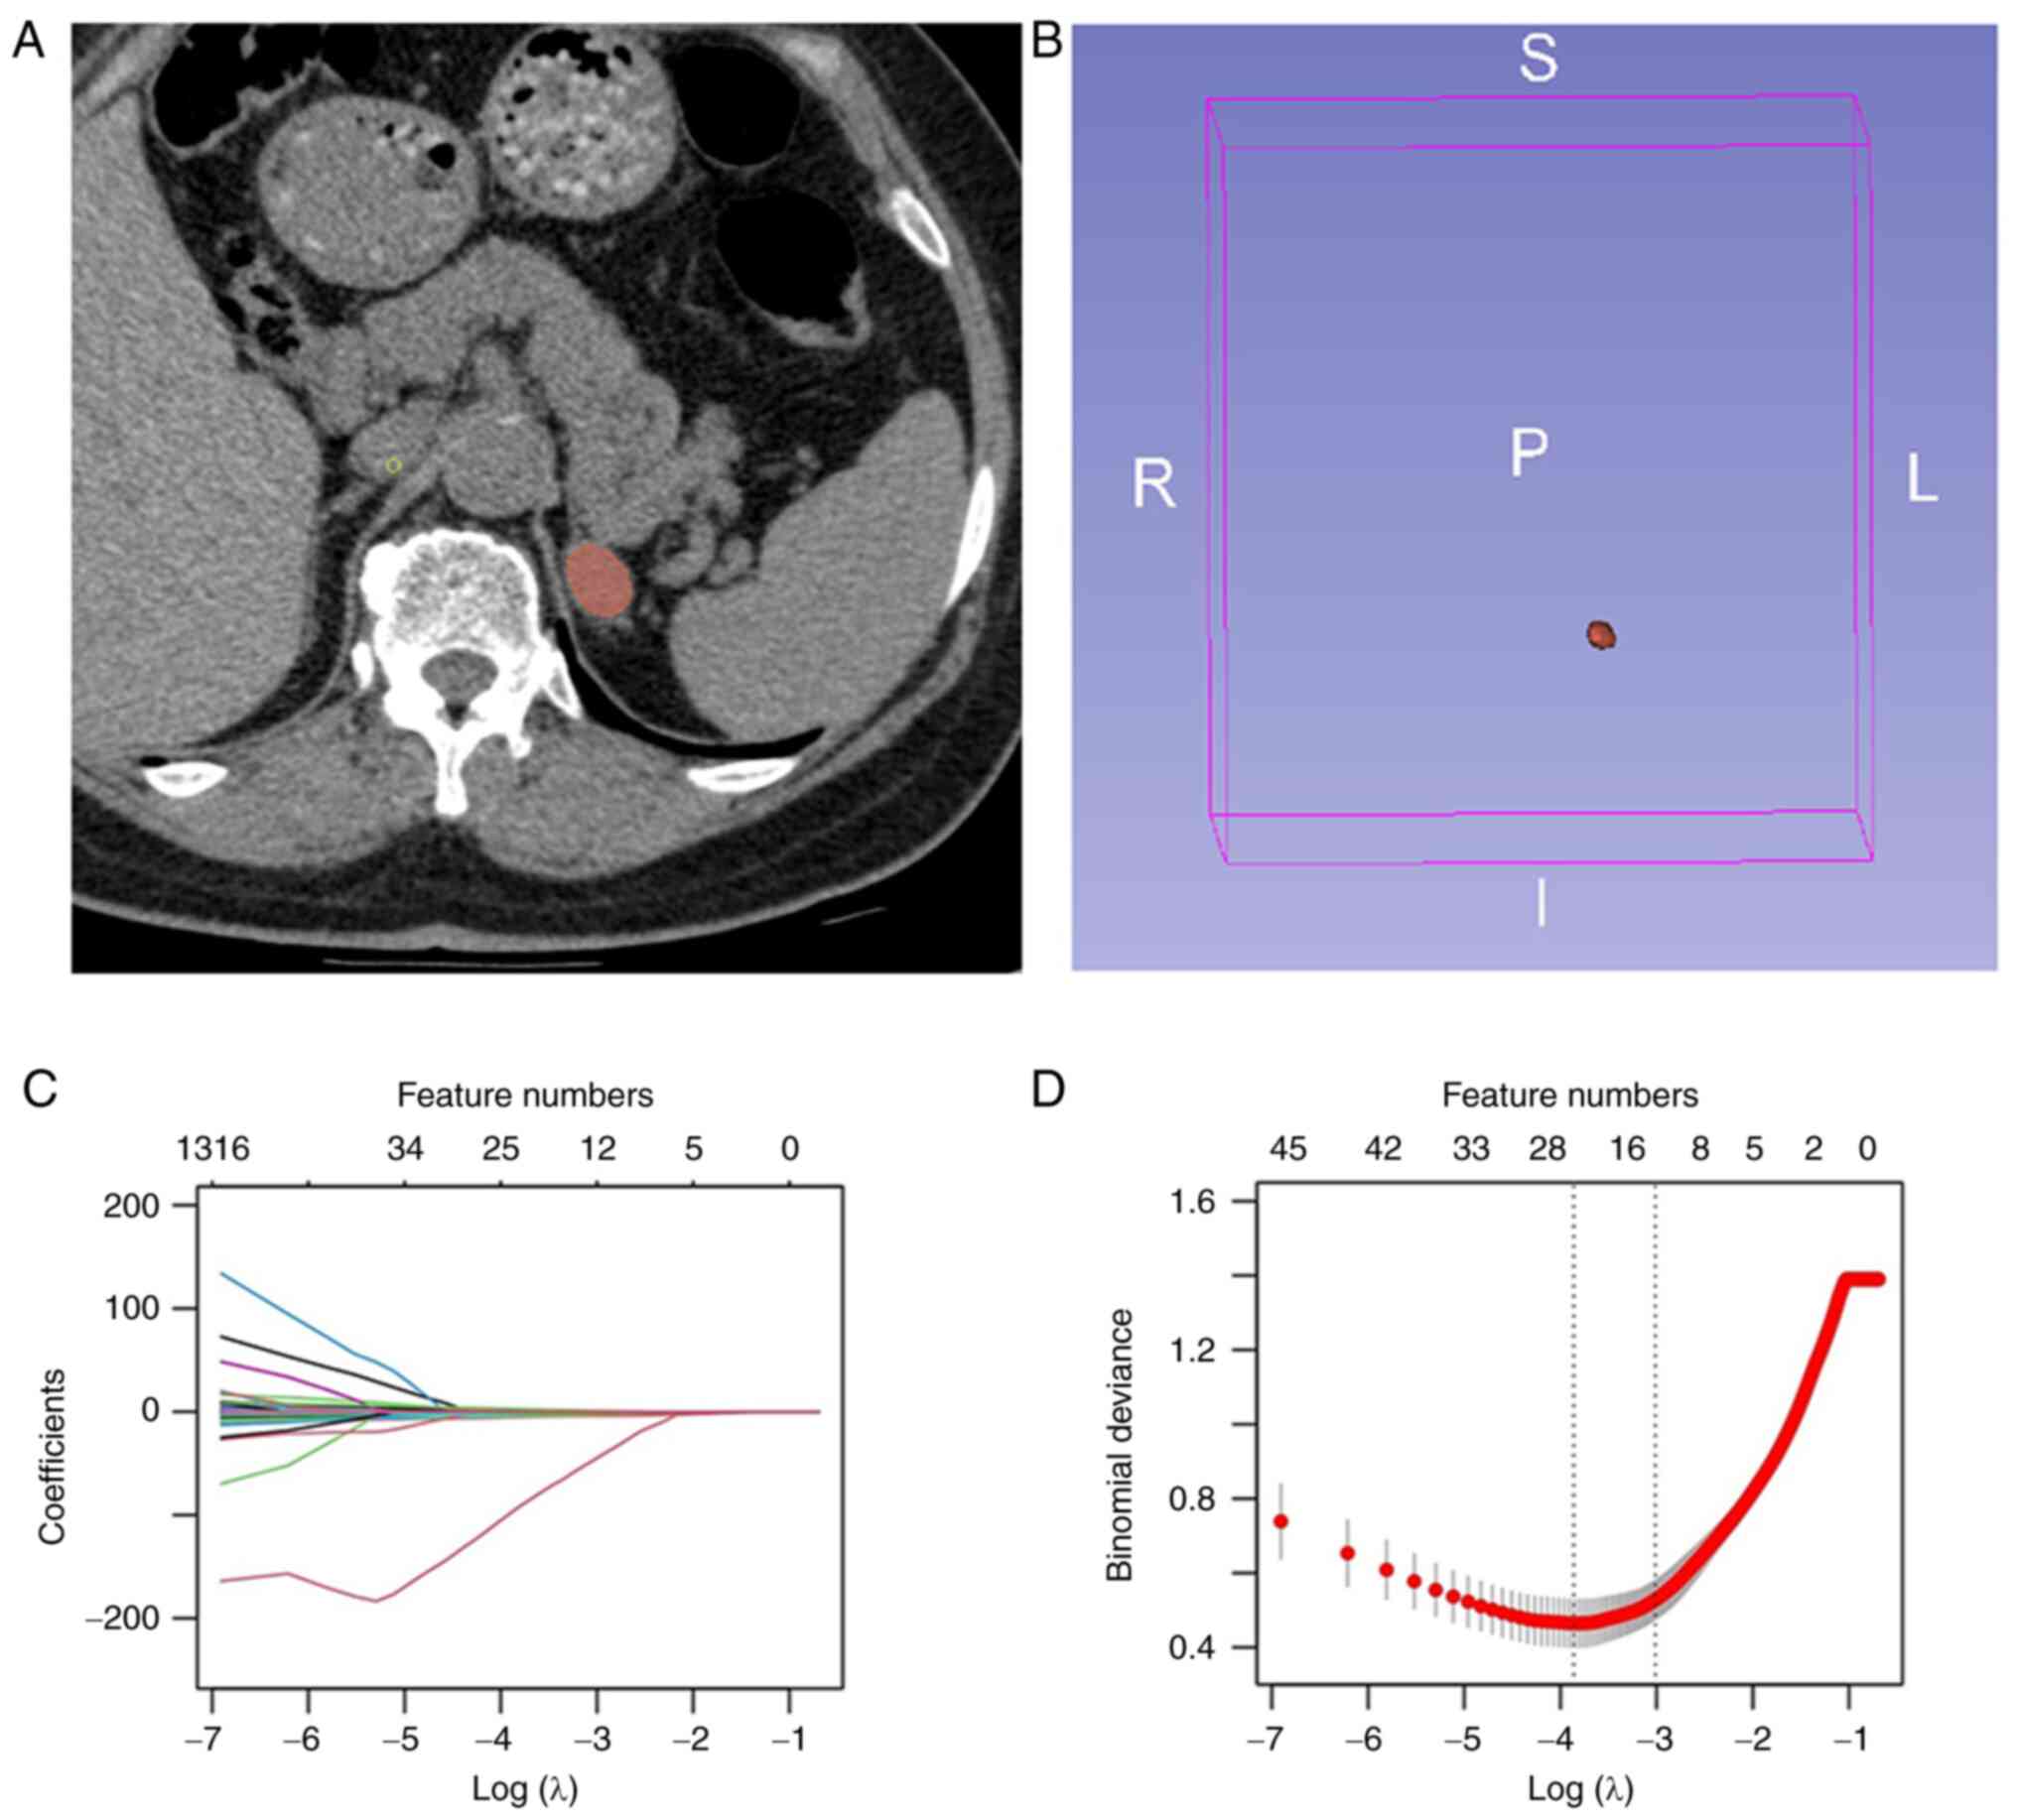
A total of two abdominal radiologists, each with 4
and 6 years of experience using the 3D Slicer software (version
4.13.0; National Institutes of Health), manually delineated volumes
of interest (VOIs) for the AIs. Great care was taken to encompass
as much of the lesion as possible while meticulously avoiding the
inclusion of external structures (Fig.
2A) (27). The reproducibility
of VOIs delineated by both radiologists was evaluated, and those
delineated by the radiologist with 6 years of experience were
chosen for subsequent radiomics analysis (Fig. 2B). Radiomics' features were
extracted using Slicer Radiomics (version 1.0.0; Artificial
Intelligence in Medicine Program), an extension that utilized
SuperBuild to create a separate library, pyradiomics (version 3.0;
Artificial Intelligence in Medicine Program) and a dependent
scripted Module. These features were computed on both original or
pre-processed images, employing Laplacian of Gaussian filters with
varying σ values (1.0, 2.0, 3.0, 4.0, 5.0) and wavelets. The
calculation was performed with an intensity bin width of 25 and
resampled voxel dimensions of 1×1×1 mm3. The extracted
radiomics features included first-order statistics, shape
characteristics and texture features. Texture features encompassed
gray level dependence matrix, gray level co-occurrence matrix,
neighbouring gray tone difference matrix, gray level size zone
matrix and gray level run length matrix. The least absolute
shrinkage and selection operator (LASSO) method, renowned for its
capability to reduce dimensionality and redundancy, was employed
for feature selection in the training dataset (Fig. 2C). The optimal value of the
penalization parameter λ was identified through a five-fold
cross-validation process. Subsequently, the optimal features were
determined by adjusting λ to correspond to one standard error of
the minimum loss (Fig. 2D). After
deleting the high correlation coefficient (>0.7), the remaining
useful features were employed in constructing the Radscore using a
multivariable logistic regression formula:
Radscore=1/[1+eʌ(−β0-β1×X1-β2×X2-…-βmxXm)].
Diagnostic validation of Radscore and
significant clinical and imaging features
The potential diagnostic performance of the
Radscore, and the significant clinical and imaging features for
differentiating metastases from LPAs were assessed using the area
under the receiver operating characteristic (ROC) curves (AUCs),
and the optimal cut-off values for maximum specificity and
sensitivity were determined using the Youden index.
Development and validation of the
clinical-imaging-radiomic model and nomogram
The risk factors for diagnosis of metastases were
selected by stepwise binary logistic regression based on a
likelihood test. Subsequently, the final risk factors were
introduced in the multiple logistic regression to establish the
clinical-imaging-radiomic model in the training cohort. The
performance of this model was evaluated by AUC in both the training
and testing datasets. To further evaluate the diagnostic ability of
the nomogram developed from the clinical-imaging-radiomic model, a
decision curve analysis (DCA) and calibration curve were
employed.
Development and validation of the
clinical-imaging model
Sex, age, CTpre and shape were
significant differences in the training and testing datasets
between LPAs and metastases by the chi-square test or
independent-sample t-test. Three variables including sex, age and
CTpre selected by multivariate logistic regression were
independent factors for differentiating metastases from LPAs in
patients with lung cancer. Then, the final risk factors were
incorporated in the multivariate logistic regression to construct
the clinical-imaging model in the training cohort. AUC analysis was
used to quantify the predictive performance of clinical-imaging
model in the training dataset and test the predictive performance
in the testing dataset, respectively (Fig. S1).
Statistical analysis
R software (version 4.1.2; The R Foundation) and IBM
SPSS Statistics software (version 21; IBM Corp.) were used for
statistical analyses. Quantitative parameters and categorical
variables were compared using the Mann-Whitney U test or
independent-sample t-test and chi-square test, respectively. The
inter-observer reproducibility of feature extraction was evaluated
using the intra-class correlation coefficient (ICC). An ICC value
<0.5 indicated low consistency, while values between 0.5 and
0.79 were considered medium, and values ≥0.8 indicated high
consistency.
The LASSO regression was implemented using the
‘glmnet’ package in R software, the ‘corrplot’ package was used to
calculate the correlation between variables, logistic regression
and nomogram were implemented by the ‘rms’ package, and DCA was
implemented by the ‘rmda’ package. P<0.05 was considered to
indicate a statistically significant difference.
Results
Clinical and imaging
characteristics
Patient characteristics, including sex, age, LD, SD,
location, CTpre, shape, border, homogeneity,
calcification and Radscore, showed no significant differences
between the training and testing datasets (Table I; P>0.05), indicating that it was
reasonable to randomly partition the complete dataset by random
seeds. However, sex, age, CTpre and shape were
significant differences between metastases and LPAs in both the
training and testing datasets (Table
I; P<0.05).
 | Table I.Clinical-imaging characteristics and
rad-score of patients in the training and testing cohorts. |
Table I.
Clinical-imaging characteristics and
rad-score of patients in the training and testing cohorts.
|
| Training cohort
(n=137) | Testing cohort
(n=59) |
|---|
|
|
|
|
|---|
| Characteristic | Total (n=137) | LPAs (n=71) | Metastases
(n=66) | P value | Total (n=59) | LPAs (n=31) | Metastases
(n=28) | P-value |
PΔvalue |
|---|
| Sex |
|
|
|
<0.0001a |
|
|
| 0.001a | 0.448 |
|
Male | 80 (58.39%) | 30 (42.25%) | 50 (75.76%) |
| 31 (52.54%) | 10 (32.26%) | 21 (75%) |
|
|
|
Female | 57 (41.61%) | 41 (57.75%) | 16 (24.24%) |
| 28 (47.46%) | 21 (67.74%) | 7 (25%) |
|
|
| Age, (years) | 58.96±9.87 | 56.10±11.08 | 62.05±7.27 |
<0.0001a | 58.73±11.65 | 55.42±12.94 | 62.39±8.88 | 0.020a | 0.885 |
| Long diameter
(mm) | 19.86±7.52 | 19.92±7.01 | 19.81±8.09 | 0.934 | 20.10±8.79 | 20.61±9.32 | 20.17±8.35 | 0.849 | 0.662 |
| Short diameter
(mm) | 15.84±5.99 | 15.93±5.49 | 15.74±6.52 | 0.852 | 16.63±7.32 | 17.39±7.87 | 15.78±6.69 | 0.405 | 0.431 |
| Lesion
location |
|
|
| 0.117 |
|
|
| 0.098 | 0.629 |
|
Right | 53 (38.69%) | 23 (32.39%) | 30 (45.45%) |
| 25 (42.37%) | 10 (32.26%) | 15 (53.57%) |
|
|
|
Left | 84 (61.31%) | 48 (67.61%) | 36 (54.55%) |
| 34 (57.63%) | 21 (67.74%) | 13 (46.43%) |
|
|
| CTpre
(Hu) | 32.72±10.72 | 26.30±8.48 | 39.62±8.35 |
<0.001a | 32.86±10.72 | 29.35±11.91 | 36.75±7.71 | 0.006a | 0.929 |
| Shape |
|
|
| 0.003a |
|
|
| 0.024a | 0.187 |
|
Regular | 123 (89.78%) | 69 (97.18%) | 54 (81.82%) |
| 49 (83.05%) | 29 (93.55%) | 20 (71.43%) |
|
|
|
Irregular | 14 (10.21%) | 2 (2.82%) | 12 (18.18%) |
| 10 (16.95%) | 2 (6.45%) | 8 (28.57%) |
|
|
| Homogeneity |
|
|
| 0.773 |
|
|
| 0.338 | 0.268 |
|
Homogenous | 130 (94.89%) | 67 (64.37%) | 63 (95.45%) |
| 58 (98.31%) | 30 (96.77%) | 28 (100%) |
|
|
|
Heterogenous | 7 (5.11%) | 4 (5.63%) | 3 (4.55%) |
| 1 (1.69%) | 1 (3.23%) | 0 (0%) |
|
|
| Border |
|
|
| 0.140 |
|
|
| 0.289 | 0.902 |
|
Sharp | 135 (98.54%) | 71 (100%) | 64 (96.97%) |
| 58 (98.31%) | 31 (100%) | 27 (96.43%) |
|
|
|
Blotted | 2 (1.46%) | 0 (0%) | 2 (3.03%%) |
| 1 (1.69%) | 0 (0%) | 1 (3.57%) |
|
|
| Calcification |
|
|
| 0.517 |
|
|
| 0.130 | 0.625 |
|
Yes | 3 (2.19%) | 1 (1.41%) | 2 (3.03%) |
| 2 (3.39%) | 0(0%) | 2 (7.14%) |
|
|
| No | 134 (97.81%) | 70 (98.59%) | 64 (96.97%) |
| 57 (96.61%) | 31 (100%) | 26 (92.86%) |
|
|
| Radscore | 0.48±0.37 | 0.22±0.24 | 0.76±0.27 |
<0.0001a | 0.45±0.36 | 0.23±0.24 | 0.70±0.30 | 0.0001a | 0.593 |
Radiomics feature extraction,
selection and Radscore construction
A total of 1,316 quantitative features were
extracted from the plain CT images. The inter-observer ICC of the
radiomics features was <0.5, 0.5–0.79 and ≥ 0.8 for 2, 6 and
92%, respectively, indicating that the reproducibility of feature
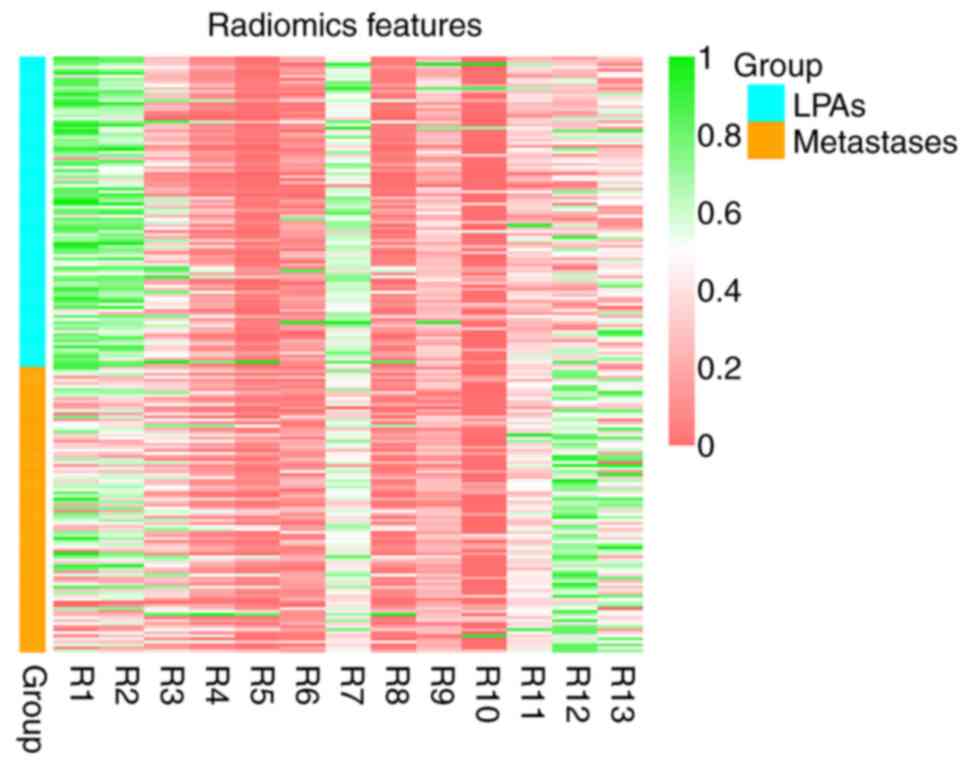
extraction was deemed satisfactory. Based on the training dataset,
13 meaningful features were selected by LASSO (Fig. 3). Next, 9 features with high
collinearity were deleted and 4 potential predictors remained to
calculate the Radscore for each patient using the following
formula: Radscore =1/[1+eʌ(-82.3458+13.8774×
origial_shape_Flatness+87.0981×waveletLLH_glcm_Idn-0.0015×waveletLLH_gldm_DependenceNonUniformity-0.0301×waveletLLL_firstorder_Maximum)].
Patients with LPAs had relatively lower Radscores in both the
training and testing datasets (Table
I; P<0.05).
Validation of Radscore and the
performance of significant clinical and imaging features
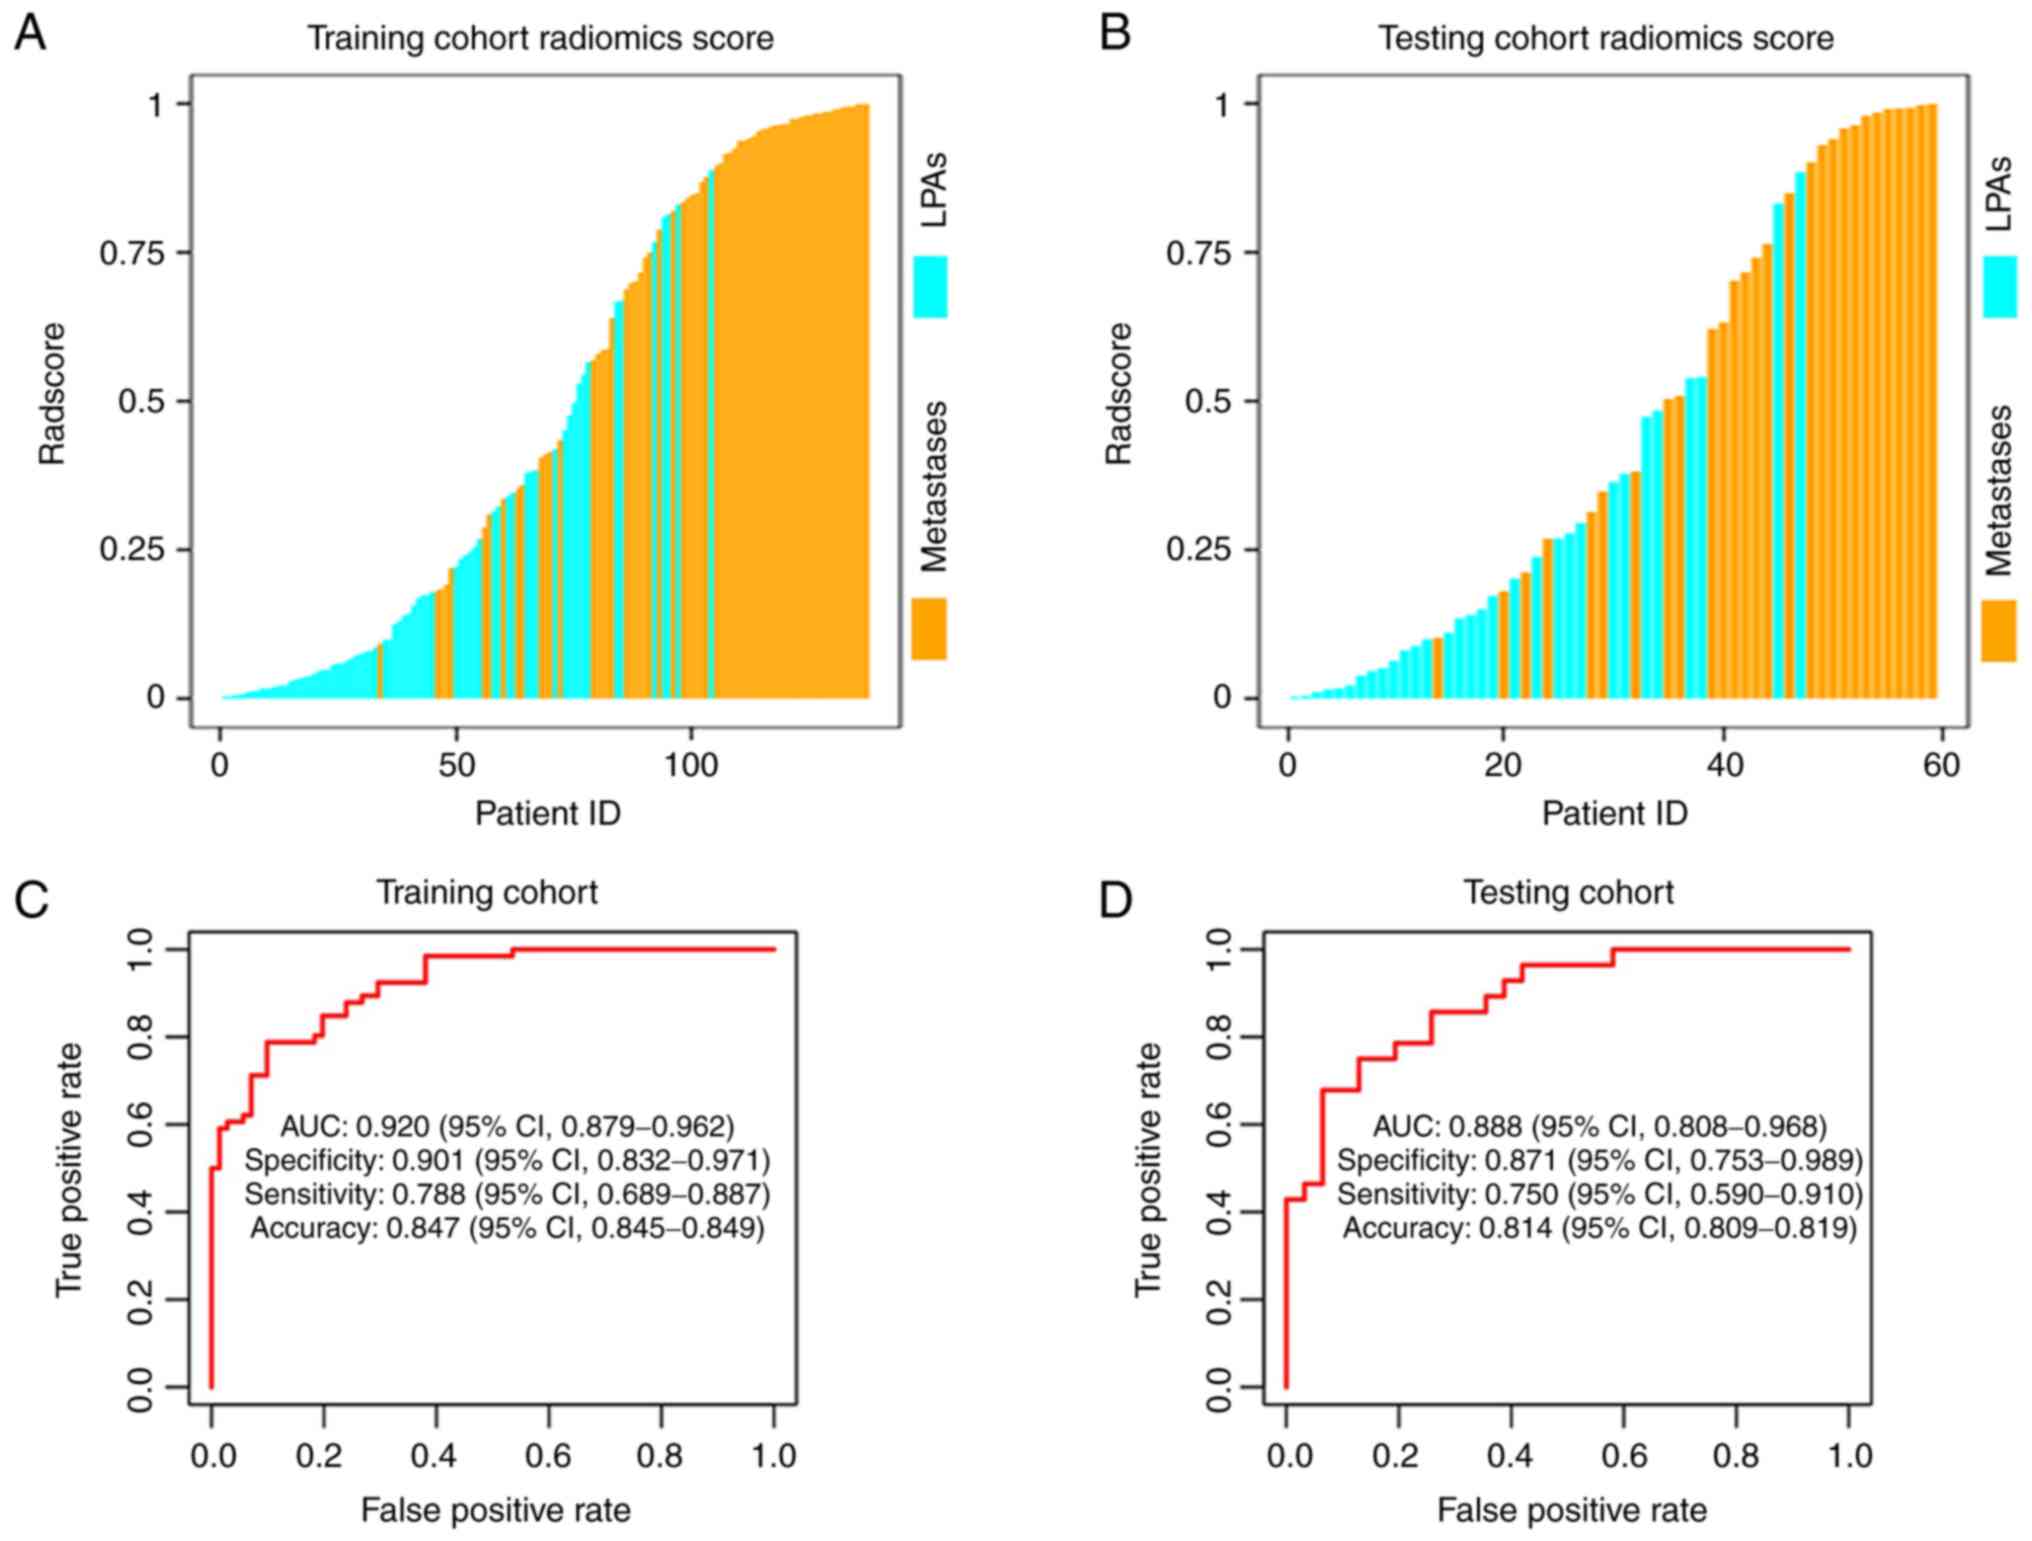
The Radscores for patients in the two cohorts were
shown in Fig. 4A and B. The
Radscore yielded an AUC of 0.920 [95% confidence interval (CI),
0.879–0.962] with a sensitivity, specificity and accuracy of 0.788
(95% CI, 0.689–0.887), 0.901 (95% CI, 0.832–0.971) and 0.847 (95%
CI, 0.845–0.849) in the training dataset, respectively. An AUC of
0.888 (95% CI, 0.808–0.968) with a sensitivity, specificity and
accuracy of 0.750 (95% CI, 0.590–0.910), 0.871 (95% CI,
0.753–0.989) and 0.814 (95% CI, 0.809–0.819) was achieved in the
testing dataset, respectively (Fig. 4C
and D). The Radscore showed the highest differential diagnostic
performance compared with significant clinical-imaging features.
The cut-off values for age, CTpre and Rad-score were
60.5 years, 28.5 HU and 0.567, respectively (Table II).
| Table II.The optimal cut-off values of
individual variables in the training cohort by receiver operating
characteristic analysis. |
Table II.
The optimal cut-off values of
individual variables in the training cohort by receiver operating
characteristic analysis.
| Variables | Cut-off | Area under the
curve | Sensitivity | Specificity | PPV | NPV |
|---|
| Sex | - | 0.668
(0.590–0.745) | 79.8% | 57.8% | 62.5% | 71.9% |
| Age | 60.5 | 0.655
(0.563–0.747) | 65.2% | 67.6% | 65.2% | 67.6% |
| CT-pre | 28.5 | 0.864
(0.805–0.924) | 93.9% | 67.6% | 72.9% | 92.3% |
| Shape | - | 0.577
(0.526–0.628) | 18.2% | 97.2% | 85.7% | 56.1% |
| Rad-score | 0.567 | 0.920
(0.879–0.962) | 78.8% | 90.1% | 88.1% | 82.0% |
Validation of the
clinical-imaging-radiomic model and nomogram
A total of four variables including sex, age,
CTpre and Radscore selected by multivariate logistic
regression were independent factors for distinguishing between
metastases and LPAs in patients with lung cancer. AIs in male
patients [(Odds ratio, OR), 5.380 (1.267–22.850); P=0.024] with age
>60.5 years [OR, 1.074 (0.998–1.156); P=0.057], CTpre
>28.5 HU [OR, 1.179 (1.078–1.289); P<0.001] and Radscore
>0.567 [OR, 473.911 (41.943–5354.651); P<0.001] tended to
have metastases.
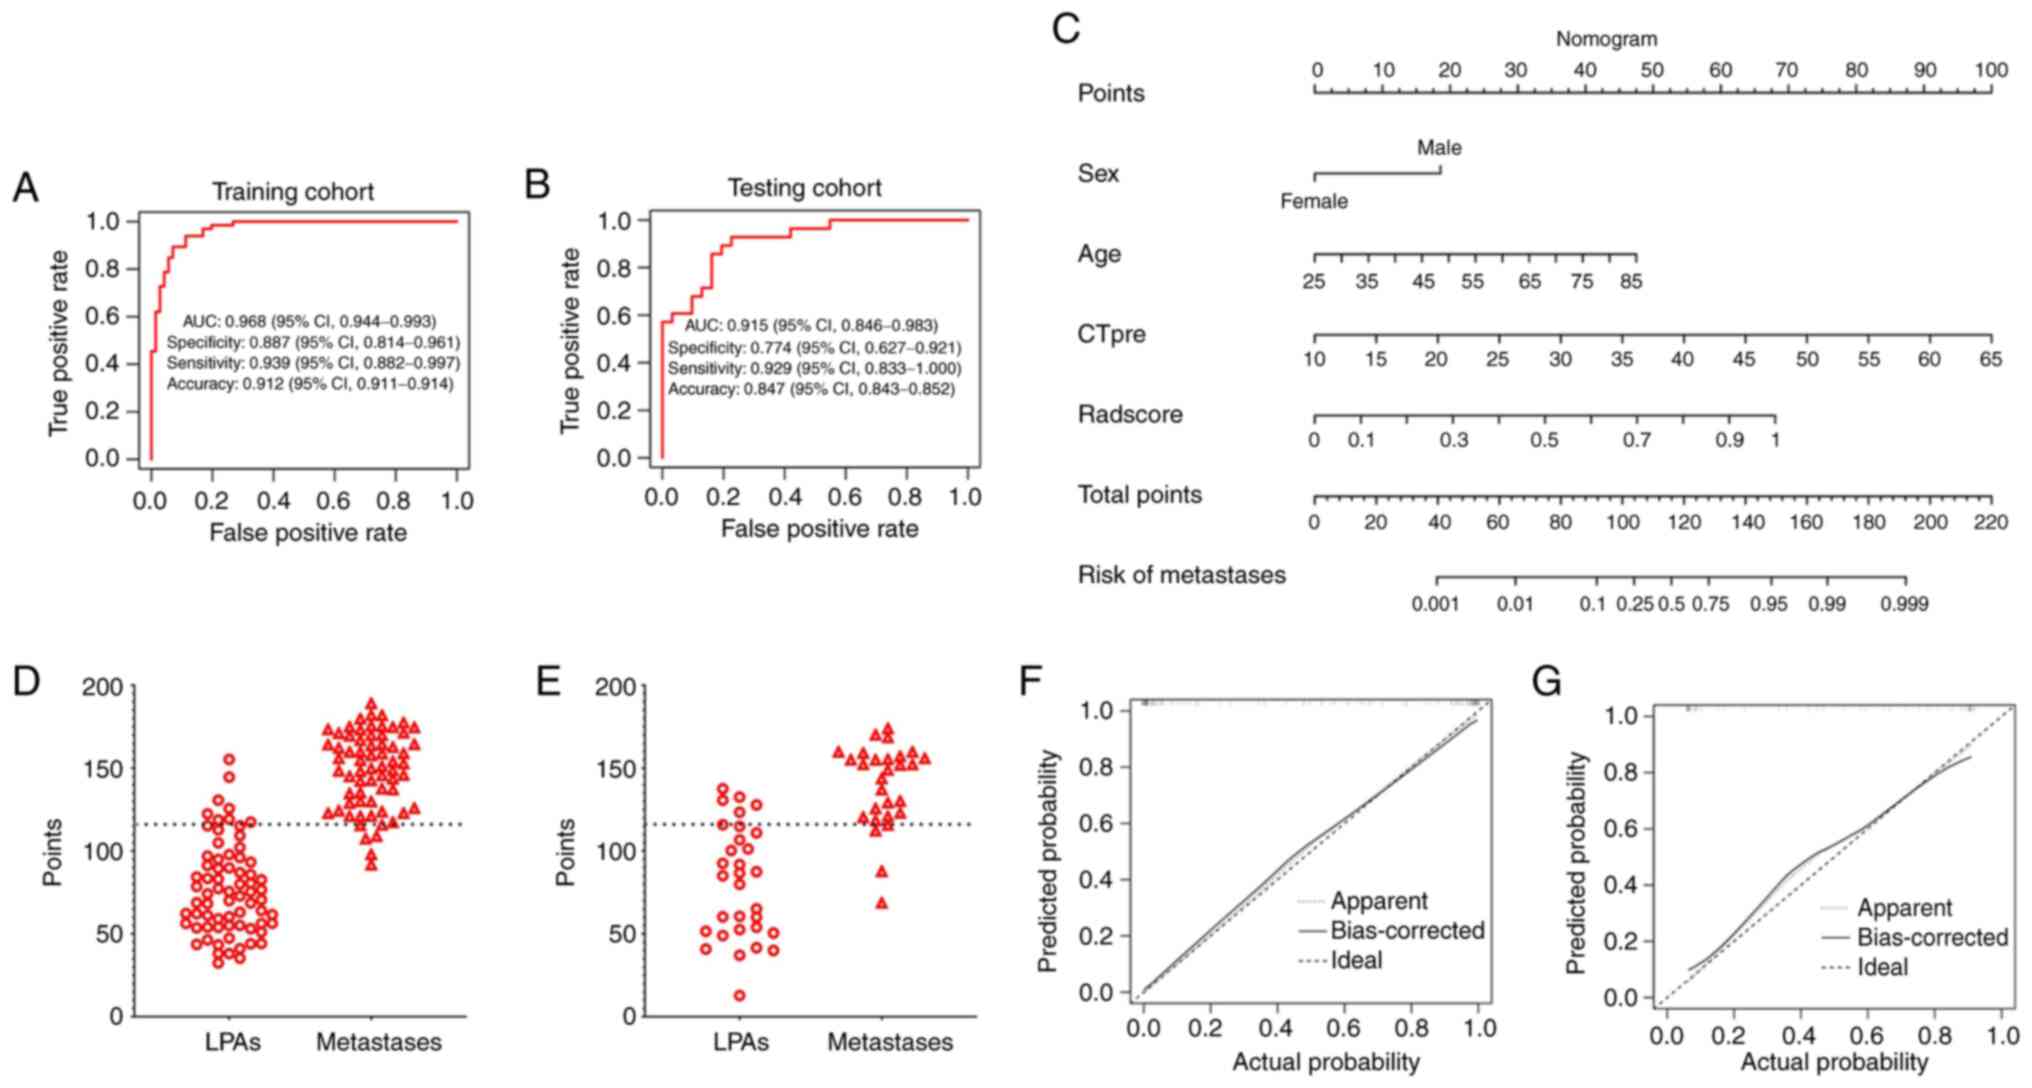
The clinical-imaging-radiomic model provided an AUC
of 0.968 in the training dataset and 0.915 in the testing dataset
(Fig. 5A and B). Meanwhile, the
AUCs of the clinical-imaging-radiomic model were significantly
higher than the clinical-imaging model (details of the
clinical-imaging model are found in Fig. S1) in both training and testing
cohorts (Table III). The nomogram
revealed that >115.33 could be considered lung cancer
metastases, with an AUC of 0.953, a sensitivity of 92.6%, a
specificity of 86.3% and an accuracy of 89.3% in the training
dataset. The AUC, sensitivity, specificity and accuracy of the
nomogram was 0.850, 89.3%, 80.6 and 84.7% in the testing dataset
when using 115.33 as the cut-off value (Fig. 5C-E). Favourable calibration curves
were shown in both the training (P=0.940) and testing datasets
(P=0.094; Fig. 5F and G).
| Table III.Comparison of the performance of the
Radscore, clinical-imaging model, and clinical-imaging-radiomic
model in both training and testing cohorts. |
Table III.
Comparison of the performance of the
Radscore, clinical-imaging model, and clinical-imaging-radiomic
model in both training and testing cohorts.
|
| Training
cohort | Testing cohort |
|---|
|
|
|
|
|---|
| Model | AUC | Z statistic | P-value | AUC | Z statistic | P-value |
|---|
|
Clinical-imaging-radiomic model vs.
clinical-imaging model | 0.968 vs.
0.896 | 3.098 | 0.002 | 0.915 vs.
0.790 | 2.733 | 0.006 |
|
Clinical-imaging-radiomic model vs.
Radscore | 0.968 vs.
0.920 | 2.892 | 0.004 | 0.915 vs.
0.888 | 0.782 | 0.434 |
| Clinical-imaging
model vs. Radscore | 0.896 vs.
0.920 | 0.726 | 0.468 | 0.790 vs.
0.888 | 1.393 | 0.164 |
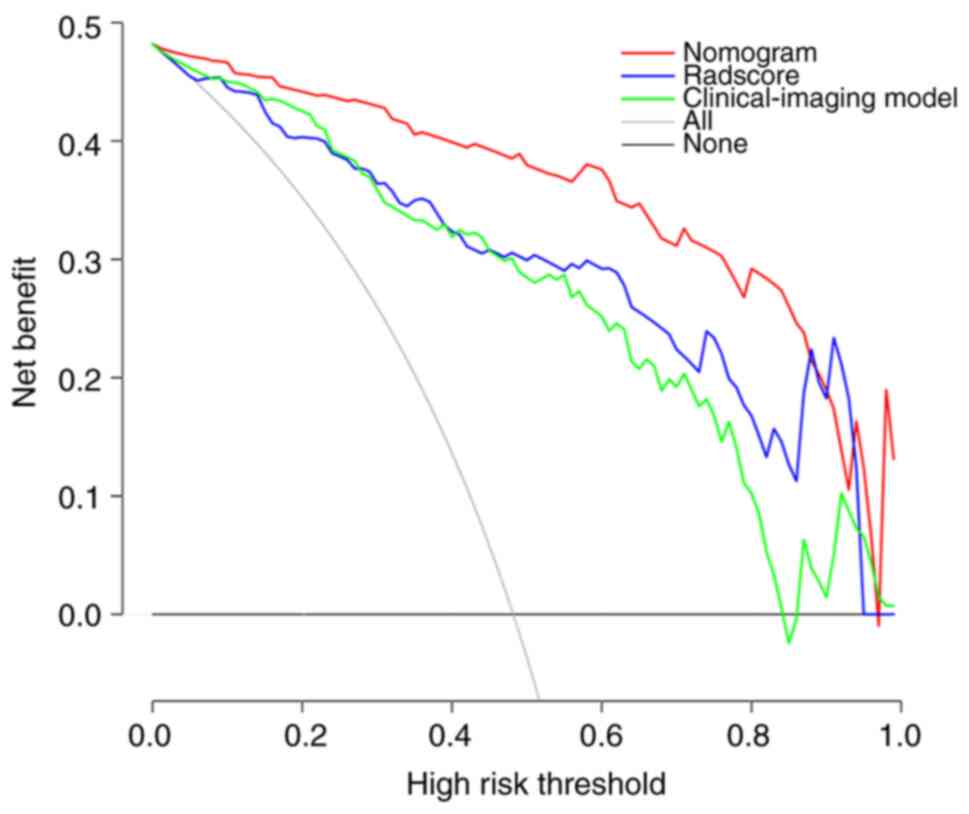
Clinical application value according
to DCA
Compared with the clinical-imaging model (details of
models in Fig. S1) and the
Radscore, the DCA of the nomogram had the highest clinical net
benefit at almost all the threshold probabilities, showing that the
clinical-imaging-radiomic nomogram is a potential tool to
effectively predict metastases in patients with lung cancer with
small hyperattenuating AIs (Fig.
6).
Discussion
The present study aimed to settle a real diagnostic
conundrum for clinicians and radiologists. Most patients with lung
cancer present with adrenal metastases at the time of diagnosis and
an adrenal mass may be the only sign of cancer dissemination
(28). Correctly differentiating
metastases from LPAs is pivotal for optimal treatment. While in
clinical practice, small unilateral AIs with CTpre ≥10
HU are usually discovered in patients with lung cancer undergoing
routine non-contrast chest or abdominal CT scans. Unfortunately,
most patients currently need to go for enhanced CT due to the
difficulty in differentiating LPAs from metastases with initial
plain CT (7–9). The present study was confined to
initial plain CT on account that the aim was to determine whether
the analysis based on initial plain CT images alone would be
sufficient to make a satisfactory differential diagnosis. If the
distinction was valid, it would help avoid the additional
examinations and risks associated with contrast media.
Radiomics may be an important predictor for
differential diagnosis in tumors and the application of Radiomics
has been increasing in adrenal lesions (29,30).
Yi et al (29) discovered
that the radiomic nomograms by incorporating clinical risk factors
and Radscore based on enhanced and unenhanced CT images could
effectively differentiate lipid-poor adenoma from subclinical
pheochromocytoma, with favourable specificity, sensitivity and
accuracy. He et al (30)
concluded that the radiomic nomogram based on pre-enhanced CT by
integrating the Radscore and traditional clinical factors helped to
effectively identify aldosterone-producing adenoma. To the best of
our knowledge, few previous studies have determined whether a
clinical-imaging-radiomic nomogram could be used to differentiate
LPAs from metastases based on initial plain CT images in patients
with lung cancer and with small unilateral AIs. Previous studies
concerning adrenal metastases or LPAs have proved radiomics could
provide some promising results. However, these findings have some
limitations including small sample sizes, non-comprehensive
analysis (no combination of clinical, radiological features and
radiomics features), involving different primary malignant tumors
or different adrenal malignant tumors, and no studies have
introduced Radscore (4,31,32).
For example, Ho et al (31)
revealed that the contrast-enhanced CT texture features achieved a
mean AUC of 0.800, indicating the potential ability for
distinguishing between benign and malignant lesions. Yet, the
malignant lesions included not only metastases but also two cases
of adrenal cortical carcinomas, and the study suffered from a small
sample size (20 patients). In addition, Ho et al (31) did not discuss primary malignant
tumors. Furthermore, although Andersen et al (4) proved certain texture parameters could
statistically differentiate benign adrenal masses from metastases
in patients with a history of lung cancer and constructed a
diagnostic model, the AUC (0.73), sensitivity (58%), accuracy (68%)
and specificity (77%) were relatively low.
As a part of a growing number of studies using
Radscore, the present study established a Radscore using 4
radiomics features on unenhanced CT, and the best cut-off value of
0.567 afforded a specificity of 90.1% and a sensitivity of 78.8%
for identifying adrenal metastases in the testing cohort. In
addition, the Radscore had favourable predictive performance for
adrenal metastases with an AUC of 0.888 and OR of 473.911, which
demonstrated that the Radscore could be a useful stand-alone factor
for identifying metastases from LPAs in patients with lung
cancer.
Sex and age, as clinical-imaging risk factors, were
included in the predictive model for distinguishing LPAs from lung
cancer metastases in the present study. It was revealed that male
patients aged >60.5 years were associated with a higher
likelihood of being diagnosed with lung cancer metastases. This
observation may be attributed to the specific selection of lung
cancer (33). Additionally,
CTpre was another important feature for identifying
metastases of lung cancer. Metastases exhibited significantly
higher plaint CT attenuation compared with LPAs, with a cut-off
value exceeding 28.5 HU and an OR of 1.179. This finding aligns
with previous research by Ho et al (31), who revealed the statistical
significance of unenhanced CT attenuation in distinguishing benign
from malignant adrenal masses. Homogeneity, shape and border
revealed no statistical significance in the present study,
inconsistent with Moawad et al (34) and Ho et al (31). It is likely that the small size of
metastases (≤4 cm) used in the present study reflects the early
stages of cancer, without neo-angiogenesis or necrosis, thus they
demonstrated approximately the same homogeneous, uniform and fine
with LPAs from traditional imaging assessment (35,36).
The present study developed a
clinical-imaging-radiomic nomogram by integrating the Radscore,
sex, age and CTpre based on pre-enhanced CT for
identifying metastases from LPAs with a large study cohort, and the
diagnostic performance of which was further improved (AUC=0.915).
The present study demonstrated that the clinical-imaging-radiomic
nomogram based on initial plain CT images is a potential tool to
predict metastases successfully before surgery, which could enable
individualized treatment strategies for each patient with lung
cancer. The promising results of the present study may have
important clinical applications including that additional
examinations may no longer be required. Compared with enhanced CT,
PET/CT or MRI, the plain CT is easier to obtain, is less
time-consuming, produces reliable image quality and is cheaper.
Therefore, the findings of the present study can be quickly applied
to clinical practice.
In conclusion, the novel points of the present study
contain three key aspects: i) The focus on a specific research
population, namely patients with small unilateral AIs, as opposed
to previous studies which included all AIs regardless of size or
laterality (4,31,32);
ii) the differentiation between adrenal metastases and LPAs based
solely on plain CT images with a large sample size, in contrast to
most previous studies that utilized enhanced CT images with smaller
sample sizes and generally distinguished between benign [(including
adrenal adenoma and other benign lesions (for example, oncocytoma
and ganglioneuroma)] and malignant (including adrenal metastases
and adrenocortical carcinomas) adrenal tumors (4,31,34);
and iii) an improved AUC value of 0.915 for the model developed in
the present study compared with previous studies (AUC=0.730–0.850),
indicating the current model has superior predictive performance
(4,31,34).
The present study has several noteworthy
limitations. Firstly, the single-centre and retrospective nature of
the study may introduce population bias, which could limit the
generalizability of the findings. Secondly, a subset of patients
did not have histological confirmation in accordance with the
inclusion criteria of the study, potentially leading to diagnostic
uncertainty in these cases. Thirdly, the present research lacked
external validation of the nomogram. To enhance the robustness and
reliability of the present findings, further research should
prioritize validation on a larger scale, potentially involving
multiple centres.
In conclusion, the clinical-imaging-radiomic
nomogram built by integrating the Radscore and traditional
clinical-imaging risk factors helped to accurately identify
metastases in patients with lung cancer with small hyperattenuating
AIs.
Supplementary Material
Supporting Data
Acknowledgements
Not applicable.
Funding
Funding: No funding was received.
Availability of data and materials
The data generated in the present study are not
publicly available due to patient privacy purposes but may be
requested from the corresponding author.
Authors' contributions
JL, YL, LC, WX and HC designed the study. LC, HY,
DY, HW, YY and LZ collected, analyzed and interpreted the data. LC,
HY and DY wrote the original draft of the manuscript. WX and HC
reviewed the manuscript. LC and HW confirm the authenticity of all
the raw data. All authors contributed to the article, and read and
approved the final version of the manuscript.
Ethics approval and consent to
participate
The present study was approved (approval no.
RMYY-LLKS-2023202) by the Medical Ethics Committee of Tangshan
People's Hospital (Tangshan, China). Written informed consent was
obtained from each patient included and the present study was
performed in accordance with the 1964 Helsinki Declaration and its
later amendments or comparable ethical standards.
Patient consent for publication
The patients provided written informed consent for
publication.
Competing interests
The authors declare that they have no competing
interests.
Glossary
Abbreviations
Abbreviations:
|
LPA
|
lipid-poor adenoma
|
|
AI
|
adrenal incidentaloma
|
|
LASSO
|
least absolute shrinkage and selection
operator
|
|
AUC
|
area under the receiver operating
characteristic curve
|
|
DCA
|
decision curve analysis
|
|
LD
|
long diameter
|
|
SD
|
short diameter
|
|
CTpre
|
pre-enhanced CT value
|
|
VOI
|
volume of interest
|
|
CI
|
confidence interval
|
|
ICC
|
intra-class correlation
coefficient
|
|
HU
|
Hounsfield units
|
|
OR
|
odds ratio
|
References
|
1
|
Barzon L, Sonino N, Fallo F, Palu G and
Boscaro M: Prevalence and natural history of adrenal
incidentalomas. Eur J Endocrinol. 149:273–285. 2003. View Article : Google Scholar : PubMed/NCBI
|
|
2
|
Song JH, Chaudhry FS and Mayo-Smith WW:
The incidental adrenal mass on CT: Prevalence of adrenal disease in
1,049 consecutive adrenal masses in patients with no known
malignancy. AJR Am J Roentgenol. 190:1163–1168. 2008. View Article : Google Scholar : PubMed/NCBI
|
|
3
|
Fassnacht M, Arlt W, Bancos I, Dralle H,
Newell-Price J, Sahdev A, Tabarin A, Terzolo M, Tsagarakis S and
Dekkers OM: Management of adrenal incidentalomas: European society
of endocrinology clinical practice guideline in collaboration with
the european network for the study of adrenal tumors. Eur J
Endocrinol. 175:G1–G34. 2016. View Article : Google Scholar : PubMed/NCBI
|
|
4
|
Andersen MB, Bodtger U, Andersen IR,
Thorup KS, Ganeshan B and Rasmussen F: Metastases or benign adrenal
lesions in patients with histopathological verification of lung
cancer: Can CT texture analysis distinguish? Eur J Radiol.
138:1096642021. View Article : Google Scholar : PubMed/NCBI
|
|
5
|
Terzolo M, Stigliano A, Chiodini I, Loli
P, Furlani L, Arnaldi G, Reimondo G, Pia A, Toscano V, Zini M, et
al: AME position statement on adrenal incidentaloma. Eur J
Endocrinol. 164:851–870. 2011. View Article : Google Scholar : PubMed/NCBI
|
|
6
|
Gaujoux S and Mihai R; Joint working group
of ESES and ENSAT, : European society of endocrine surgeons (ESES)
and european network for the study of adrenal tumours (ENSAT)
recommendations for the surgical management of adrenocortical
carcinoma. Br J Surg. 104:358–376. 2017. View Article : Google Scholar : PubMed/NCBI
|
|
7
|
Young WF Jr: Clinical practice. The
incidentally discovered adrenal mass. N Engl J Med. 356:601–610.
2007. View Article : Google Scholar : PubMed/NCBI
|
|
8
|
Ilias I, Sahdev A, Reznek RH, Grossman AB
and Pacak K: The optimal imaging of adrenal tumours: A comparison
of different methods. Endocr Relat Cancer. 14:587–599. 2007.
View Article : Google Scholar : PubMed/NCBI
|
|
9
|
Zeiger MA, Siegelman SS and Hamrahian AH:
Medical and surgical evaluation and treatment of adrenal
incidentalomas. J Clin Endocrinol Metab. 96:2004–2015. 2011.
View Article : Google Scholar : PubMed/NCBI
|
|
10
|
Mayo-Smith WW, Song JH, Boland GL, Francis
IR, Israel GM, Mazzaglia PJ, Berland LL and Pandharipande PV:
Management of incidental adrenal masses: A white paper of the ACR
incidental findings committee. J Am Coll Radiol. 14:1038–1044.
2017. View Article : Google Scholar : PubMed/NCBI
|
|
11
|
Bednarczuk T, Bolanowski M, Sworczak K,
Górnicka B, Cieszanowski A, Otto M, Ambroziak U, Pachucki J,
Kubicka E, Babińska A, et al: Adrenal incidentaloma in
adults-management recommendations by the Polish society of
endocrinology. Endokrynol Pol. 67:234–258. 2016. View Article : Google Scholar : PubMed/NCBI
|
|
12
|
Pandharipande PV, Herts BR, Gore RM,
Mayo-Smith WW, Harvey HB, Megibow AJ and Berland LL: Rethinking
normal: Benefits and risks of not reporting harmless incidental
findings. J Am Coll Radiol. 13:764–767. 2016. View Article : Google Scholar : PubMed/NCBI
|
|
13
|
Fujiyoshi F, Nakajo M, Fukukura Y and
Tsuchimochi S: Characterization of adrenal tumors by chemical shift
fast low-angle shot MR imaging: Comparison of four methods of
quantitative evaluation. AJR Am J Roentgenol. 180:1649–1657. 2003.
View Article : Google Scholar : PubMed/NCBI
|
|
14
|
Guerin C, Pattou F, Brunaud L, Lifante JC,
Mirallié E, Haissaguerre M, Huglo D, Olivier P, Houzard C, Ansquer
C, et al: Performance of 18F-FDG PET/CT in the characterization of
adrenal masses in noncancer patients: A prospective study. J Clin
Endocrinol Metab. 102:2465–2472. 2017. View Article : Google Scholar : PubMed/NCBI
|
|
15
|
Caoili EM, Korobkin M, Francis IR, Cohan
RH, Platt JF, Dunnick NR and Raghupathi KI: Adrenal masses:
Characterization with combined unenhanced and delayed enhanced CT.
Radiology. 222:629–633. 2002. View Article : Google Scholar : PubMed/NCBI
|
|
16
|
Haider MA, Ghai S, Jhaveri K and Lockwood
G: Chemical shift MR imaging of hyperattenuating (>10 HU)
adrenal masses: does it still have a role? Radiology. 231:711–716.
2004. View Article : Google Scholar : PubMed/NCBI
|
|
17
|
Koo HJ, Choi HJ, Kim HJ, Kim SO and Cho
KS: The value of 15-minute delayed contrast-enhanced CT to
differentiate hyperattenuating adrenal masses compared with
chemical shift MR imaging. Eur Radiol. 24:1410–1420. 2014.
View Article : Google Scholar : PubMed/NCBI
|
|
18
|
Akkus G, Guney IB, Ok F, Evran M, Izol V,
Erdogan S, Bayazit Y, Sert M and Tetiker T: Diagnostic efficacy of
18F-FDG PET/CT in patients with adrenal incidentaloma. Endocr
Connect. 8:838–845. 2019. View Article : Google Scholar : PubMed/NCBI
|
|
19
|
Kassirer JP: Our stubborn quest for
diagnostic certainty. A cause of excessive testing. N Engl J Med.
320:1489–1491. 1989. View Article : Google Scholar : PubMed/NCBI
|
|
20
|
Lambin P, Leijenaar RTH, Deist TM,
Peerlings J, de Jong EEC, van Timmeren J, Sanduleanu S, Larue R,
Even AJG, Jochems A, et al: Radiomics: the bridge between medical
imaging and personalized medicine. Nat Rev Clin Oncol. 14:749–762.
2017. View Article : Google Scholar : PubMed/NCBI
|
|
21
|
Yang C, Jiang Z, Cheng T, Zhou R, Wang G,
Jing D, Bo L, Huang P, Wang J, Zhang D, et al: Radiomics for
predicting response of neoadjuvant chemotherapy in nasopharyngeal
carcinoma: A systematic review and meta-analysis. Front Oncol.
12:8931032022. View Article : Google Scholar : PubMed/NCBI
|
|
22
|
Gillies RJ, Kinahan PE and Hricak H:
Radiomics: Images are more than pictures, they are data. Radiology.
278:563–577. 2016. View Article : Google Scholar : PubMed/NCBI
|
|
23
|
Zhang Z, Yang J, Ho A, Jiang W, Logan J,
Wang X, Brown PD, McGovern SL, Guha-Thakurta N, Ferguson SD, et al:
Correction to: A predictive model for distinguishing radiation
necrosis from tumour progression after gamma knife radiosurgery
based on radiomic features from MR images. Eur Radiol.
28:3570–3571. 2018. View Article : Google Scholar : PubMed/NCBI
|
|
24
|
Nishino M, Jagannathan JP, Ramaiya NH and
Van den Abbeele AD: Revised RECIST guideline version 1.1: What
oncologists want to know and what radiologists need to know. AJR Am
J Roentgenol. 195:281–289. 2010. View Article : Google Scholar : PubMed/NCBI
|
|
25
|
Lee HY, Oh YL and Park SY:
Hyperattenuating adrenal lesions in lung cancer: Biphasic CT with
unenhanced and 1-min enhanced images reliably predicts benign
lesions. Eur Radiol. 31:5948–5958. 2021. View Article : Google Scholar : PubMed/NCBI
|
|
26
|
Liu H, Guan X, Xu B, Zeng F, Chen C, Yin
HL, Yi X, Peng Y and Chen BT: Computed tomography-based machine
learning differentiates adrenal pheochromocytoma from lipid-poor
adenoma. Front Endocrinol (Lausanne). 13:8334132022. View Article : Google Scholar : PubMed/NCBI
|
|
27
|
Zhang GM, Shi B, Sun H, Jin ZY and Xue HD:
Differentiating pheochromocytoma from lipid-poor adrenocortical
adenoma by CT texture analysis: feasibility study. Abdom Radiol
(NY). 42:2305–2313. 2017. View Article : Google Scholar : PubMed/NCBI
|
|
28
|
Ettinghausen SE and Burt ME: Prospective
evaluation of unilateral adrenal masses in patients with operable
non-small-cell lung cancer. J Clin Oncol. 9:1462–1466. 1991.
View Article : Google Scholar : PubMed/NCBI
|
|
29
|
Yi X, Guan X, Zhang Y, Liu L, Long X, Yin
H, Wang Z, Li X, Liao W, Chen BT and Zee C: Radiomics improves
efficiency for differentiating subclinical pheochromocytoma from
lipid-poor adenoma: A predictive, preventive and personalized
medical approach in adrenal incidentalomas. EPMA J. 9:421–429.
2018. View Article : Google Scholar : PubMed/NCBI
|
|
30
|
He K, Zhang ZT, Wang ZH, Wang Y, Wang YX,
Zhang HZ, Dong YF and Xiao XL: A clinical-radiomic nomogram based
on unenhanced computed tomography for predicting the risk of
aldosterone-producing adenoma. Front Oncol. 11:6348792021.
View Article : Google Scholar : PubMed/NCBI
|
|
31
|
Ho LM, Samei E, Mazurowski MA, Zheng Y,
Allen BC, Nelson RC and Marin D: Can texture analysis be used to
distinguish benign from malignant adrenal nodules on unenhanced CT,
contrast-enhanced CT, or in-phase and opposed-phase MRI? AJR Am J
Roentgenol. 212:554–561. 2019. View Article : Google Scholar : PubMed/NCBI
|
|
32
|
Tu W, Verma R, Krishna S, McInnes MDF,
Flood TA and Schieda N: Can adrenal adenomas be differentiated from
adrenal metastases at single-phase contrast-enhanced CT? AJR Am J
Roentgenol. 211:1044–1050. 2018. View Article : Google Scholar : PubMed/NCBI
|
|
33
|
de Groot P and Munden RF: Lung cancer
epidemiology, risk factors, and prevention. Radiol Clin North Am.
50:863–876. 2012. View Article : Google Scholar : PubMed/NCBI
|
|
34
|
Moawad AW, Ahmed A, Fuentes DT, Hazle JD,
Habra MA and Elsayes KM: Machine learning-based texture analysis
for differentiation of radiologically indeterminate small adrenal
tumors on adrenal protocol CT scans. Abdom Radiol (NY).
46:4853–4863. 2021. View Article : Google Scholar : PubMed/NCBI
|
|
35
|
You X, Sun X, Yang C and Fang Y: CT
diagnosis and differentiation of benign and malignant varieties of
solitary fibrous tumor of the pleura. Medicine (Baltimore).
96:e90582017. View Article : Google Scholar : PubMed/NCBI
|
|
36
|
Ganeshan B, Goh V, Mandeville HC, Ng QS,
Hoskin PJ and Miles KA: Non-small cell lung cancer: Histopathologic
correlates for texture parameters at CT. Radiology. 266:326–336.
2013. View Article : Google Scholar : PubMed/NCBI
|