Introduction
Malignant and non-malignant tumors of the central
nervous system, including the brain, are a burden to society. They
are diagnosed at a rate of 0.55 per 0.1 million individuals in a
range of countries (1); however,
malignancy is unusual in the USA and accounts for an unequal burden
of cancer mortality owing to its augmented fatality rate (2). An average annual mortality rate of
4.43 per 100,000 individuals was recorded in those with malignant
CNS tumors (3). Among these tumors,
several types are gliomas, which are classified as malignant
transformations of glial cells. Researchers have noted the
occurrence of malignant gliomas in ~5 cases per 1 million people
(4). It has also been observed that
the considerable mortality and morbidity rates associated with
malignant gliomas are due to inadequate treatment efficacy and the
use of aggressive therapies in the USA (5). During the calculation of glioma
mortality from 1995 to 2018, it was noted that the rate declined by
0.4% per year, but an increased mortality rate was observed in
older adults >80 years of age (6). On the other hand, Upadhyaya et
al (7) found that high-grade
glioma contributed to 66% of the mortality in the children
population.
Glioblastoma multiforme (GBM) is a type of glioma
and central nervous system tumor that can originate from ≥3
possible precursor cells: Neural stem cells (NSC), NSC-derived
astrocytes and oligodendrocyte precursor cells (8). Based on their growth, gliomas were
categorized into four groups (grades 1-4). Grade 4 astrocytomas are
also known as GBMs. According to the World Health Organization
(WHO), GBM constitutes ~16% of all brain tumors and 54% of all
gliomas (9). Stupp et al
(10) developed a standard
protocol, the addition of temozolomide (TMZ) to radiotherapy (RT),
for treating GBMs, which is followed by many clinicians. The tumors
are surgically resected according to this protocol. Subsequently,
postoperative ionizing radiation is applied alongside adjuvant
temozolomide chemotherapy (10).
Ionizing radiation and chemotherapy act through common pathways
that induce DNA damage and cell death. They can act directly or
indirectly by generating reactive oxygen species (11).
However, multidrug resistance (MDR) limits
advancements in the treatment of brain tumors. MDR is a significant
global problem associated with a series of processes that primarily
account for chemotherapeutic drug resistance (12). Glutathione S-transferase is a group
of multifunctional proteins involved in MDR. These enzymes belong
to a superfamily of detoxification enzymes (13). Therefore, it is necessary to study
MDR patterns in brain cancers such as GBMs, gliomas,
medulloblastomas and neuroblastomas. GBMs are highly resistant to
most treatments owing to their cellular heterogeneity (14). Intense clonal plasticity has also
been reported. Moreover, cancer stem cells may inhibit TMZ- and
RT-induced cell death (15). Thus,
it is necessary to further understand GBM-associated genes and
their role in chemotherapy resistance.
Several studies have reported that gene expression
is responsible for MDR and chemoresistance in brain tumors
(16–18). Studies have investigated alterations
in the gene expression profiles of several types of brain tumors
under different therapeutic conditions. Ngo and Harley assessed the
global gene expression profile alterations in GBMs during therapy
with the antineoplastic drug TMZ. Yao et al (19) illustrated the gene expression
profiles of GBM resistance and identified two candidate genes,
Fanconi anemia complementation group D2 and squalene epoxidase,
linked to ferroptosis-related chemoresistance in GBMs.
Nevertheless, there is a knowledge gap in the gene expression
profiling of TMZ-resistant GBM and it is necessary to understand
the gene expression profiles of drug-resistant GBM cell lines.
Therefore, the present study aimed to assess the downregulated and
upregulated genes in TMZ-resistant GBM. Previous studies have
discussed the role of different mutations in TMZ-resistant GBM,
such as anaplastic lymphoma kinase mutations (20). In contrast, O6-methylguanine-DNA
methyltransferase overexpression is widely used as a biomarker to
predict which patients with GBM will be unsuitable for TMZ
treatment (21).
The WHO has classified GBM into two types:
Isocitrate dehydrogenase (IDH)-wild-type and IDH-mutant, which
possess different genetic, epigenetic and transcriptional
characteristics (22). Several
studies have reported that patients with IDH-mutant GBMs have
improved outcomes after TMZ treatment (23). Therefore, an enhanced understanding
of the IDH mutational landscape in TMZ-resistant GBM cells is
required. Therefore, the present study aimed to assess the IDH
mutational landscape in TMZ-resistant GBMs.
Mutations in IDH are significant factors associated
with several human malignancies. Three IDH isoforms are present in
humans: IDH1 is found in peroxisomes and the cytoplasm, whereas
IDH2 and IDH3 are found in the mitochondrial matrix (20,24).
Han et al (24) described
the potential molecular mechanisms underlying IDH mutations in
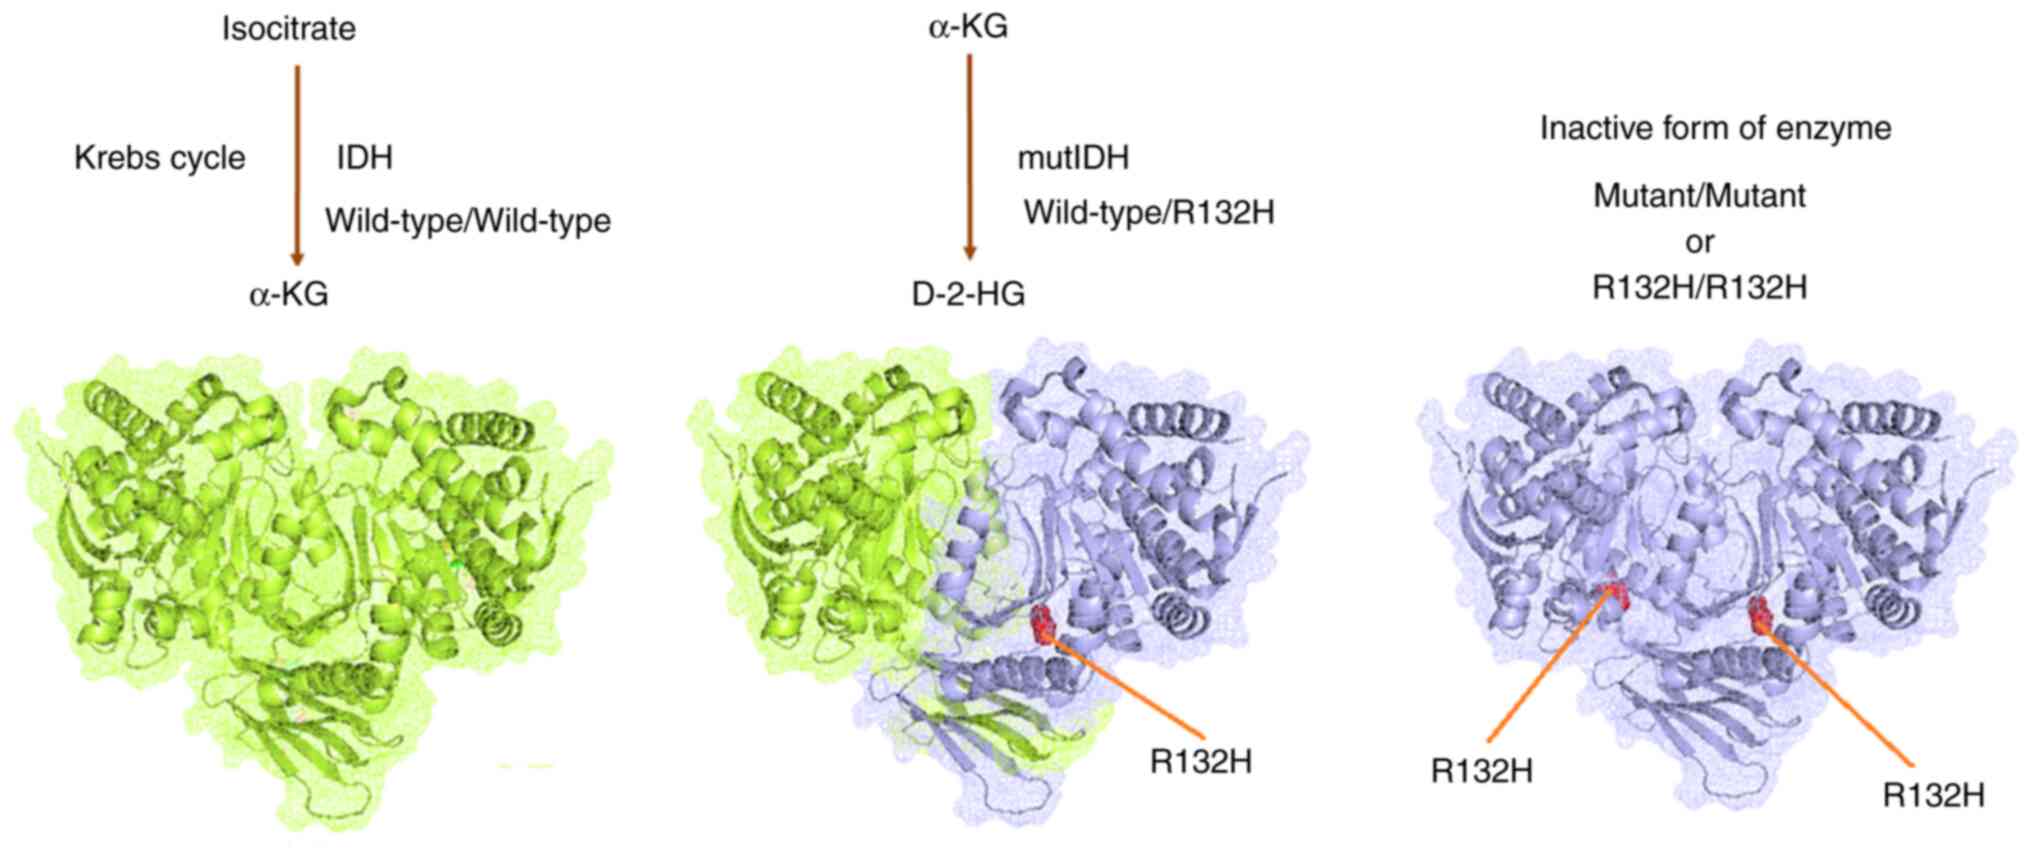
gliomas. Wild-type IDH enzymes (IDH1 and IDH2) transform isocitrate
into α-ketoglutarate (α-KG), reducing NAD(P)+ to NAD(P)H
in the Krebs cycle. The IDH heterodimer is found in cells; thus,
wild-type IDH serves a significant role in the Krebs cycle and
exhibits regular activity. However, a mutation in one part of the
IDH heterodimer produces D-(R)-2-hydroxyglutarate (D-2HG) from
α-KG. Simultaneously, the R132H mutation in each part of the IDH
homodimer (two homodimers of IDH from the IDH heterodimer) results
in an inactive IDH. Moreover, IDH1 mutants result from epigenome
modifications. Epigenetic reprogramming has been reported to be
involved in histone modifications, DNA methylation and aberrant
chromatin states in several cancers, including gliomas. Molecular
targeting approaches, such as targeting redox homeostasis, have
also been used to improve the efficiency of therapeutics against
IDH-mutated gliomas (24).
Additionally, immunotherapies have been used as advanced
therapeutics against IDH-mutated gliomas (24). IDH1 mutations are also frequently
found in secondary GBMs and are responsible for 73% of secondary
GBMs. However, they are not common in primary GBMs and are
responsible for only 3.7% of clinical cases (25). Several studies have reported that
patients with IDH-mutant GBMs have improved outcomes with TMZ
treatment (23,26). Qi et al (27) reported that patients with IDH-mutant
secondary GBMs had improved TMZ treatment outcomes and prolonged
survival. Therefore, it is necessary to understand the gene
expression in TMZ-resistant GBM cells, the structure of IDH, and
its mutational landscape in GBMs.
The present study aimed to assess the gene
expression profiles of TMZ-resistant GBM and the IDH mutational
landscapes in GBM in two ways: First, the expression of the genes
associated with TMZ resistance was determined. GBM
GBM8401-resistant cells were analyzed using next-generation
sequencing (NGS) and RNA sequencing (RNA-seq) to assess the
expression profiles of downregulated and upregulated genes. Meta-Z
analysis was also performed using the Prediction of Clinical
Outcomes from Genomic Profiles (PRECOG) system to identify all the
upregulated and downregulated genes in TMZ-resistant GBM.
Kaplan-Meier (KM) survival analysis, in silico gene
expression pattern analysis, protein-protein interaction (PPI)
network establishment, cluster analysis of co-expressed gene
networks, and hierarchical clustering of all upregulated and
downregulated genes were performed. Second, an immune-histochemical
staining assay was performed to evaluate the upregulated and
downregulated genes in the wild-type and mutant IDH cells. The
relative gene expression intensity in these cells was also
evaluated. Finally, the mutational landscape of IDH in GBMs was
demonstrated using in silico modeling. Meta-Z and KM
survival analyses were performed in different brain cancers, such
as astrocytomas, gliomas, medulloblastomas, meningiomas and
neuroblastomas, along with GBMs, for all upregulated and
downregulated genes. The present study also aimed to determine the
prognostic and therapeutic landscape of genes in all human brain
cancers, including GBM.
Materials and methods
Cell culture and generation of
chemotherapy drug-resistant GBM cell lines
The human brain malignant glioma GBM8401 cell line
was purchased from the Bioresource Collection and Research Center
(Hsinchu, Taiwan). TMZ-resistant cells were induced in the GBM8401
cell line using 200 µM TMZ-containing medium, with the medium
changed every 2-3 days for 140 days (28). TMZ was purchased from Sigma-Aldrich
(Merck KGaA). GBM8401 and TMZ-resistant GBM8401 cells were
maintained in RPMI1640 medium (Gibco; Thermo Fisher Scientific,
Inc.) supplemented with 10% heat-inactivated fetal bovine serum
(Gibco; Thermo Fisher Scientific, Inc.), 50 U/ml penicillin and 50
mg/ml streptomycin (Sigma-Aldrich; Merck KGaA). Cell lines were
maintained in a humidified atmosphere of 5% CO2 mixed
with 95% air at 37°C. These cells were used for subsequent
experiments.
Cell viability assay
Anti-TMZ GBM cell line viability was determined
using MTT assays. Cells were seeded in 96-well plates and 20 µl of
5 mg/ml MTT (Sigma-Aldrich; Merck KGaA) was added at the end of the
exposure time. The cells were incubated at 37°C for 4 h and then
medium was carefully removed. Dimethyl sulfoxide (100 µl) was added
to each well and the absorbance was measured at 570 nm using a
microplate spectrophotometer (BioTek Epoch; Agilent Technologies,
Inc.).
RNA-seq using NGS
The RNA expression profiles of TMZ-resistant GBM8401
cells were analyzed using NGS. NGS transcriptome sequencing and
data analyses were performed by Welgene Biotech Co., Ltd. (Taipei,
Taiwan). Total RNA was extracted using TRIzol™ Reagent
(Invitrogen™; Thermo Fisher Scientific, Inc.) according to the
manufacturer's instructions. The SureSelect Strand-Specific RNA
Library Preparation Kit (cat. no. G9691B; Agilent Technologies,
Inc.) was used for library construction, followed by AMPure XP
beads (cat. no. A63882; Beckman Coulter, Inc.). The loading
concentration was 250 pM. Paired-end sequencing with a read length
of 150 bp was performed using a NovaSeq 6000 S4 reagent kit (cat.
no. 20012866; Illumina, Inc.) on an Illumina NovaSeq 6000 System
(Illumina, Inc.). RNA library quantification was performed using
the Agilent 4150 TapeStation System (cat. no. G2992AA; Agilent
Technologies Deutschland GmbH) and High Sensitivity D1000
ScreenTape Assay (cat. no. 5067-5585; Agilent Technologies
Deutschland GmbH). Sequencing data (FASTQ reads) were generated
using the pipeline of Welgene Biotech Co., Ltd. based on the
base-calling program bcl2fastq v2.20 of Illumina, Inc. Base calls
were converted using the official Illumina, Inc. tool, bcl2fastq2
conversion software version 2.19, which was used to convert the BCL
files from the Illumina sequencing systems. Both adaptor clipping
and sequence quality trimming of the Illumina FASTQ data were
performed using Trimmomatic version 0.36 (29). HISAT2 uses the global GFM index
(graph FM index) and a large set of small GFM indices that
collectively cover the entire genome for rapid and accurate
alignment (30). Differential
expression analysis was performed using Cuffdiff (@cufflinks 2.2.1) with genome bias
detection/correction and in-house Welgene programs (31). The RNA-seq data in the present
publication have been deposited in the NCBI Gene Expression Omnibus
and are accessible through the GEO Series accession number
GSE234762 (https://www.ncbi.nlm.nih.gov/geo).
Relative quantification of RNA
expression
Total cellular RNA was isolated using TRIzol Reagent
(Invitrogen; Thermo Fisher Scientific, Inc.). Equal amounts of
total RNA were reverse transcribed into cDNA using the
iScriptTMcDNA Synthesis Kit (cat. no. 1708891; Bio-Rad
Laboratories, Inc.). The following conditions were used for PCR:
25°C for 5 min (primer annealing), 46°C for 20 min (reverse
transcription), 95°C for 1 min (inactivation) and 4°C holds.
Reverse transcripts were amplified and quantified using the CFX96TM
Real-time PCR Detection System (Bio-Rad Laboratories, Inc.). The
iQTM SYBR Green Supermix (Bio-Rad Laboratories, Inc.) was monitored
using a CFX96TM Real-time System equipped with CFX ManagerTM
software (version 3.1; Bio-Rad Laboratories, Inc.). The PCR program
was as follows: 95°C for 3 min; 40 cycles of 95°C for 30 sec, 56°C
for 30 sec; and 72°C for 50 sec. The expression levels of target
genes were quantified relative to the expression level of GAPDH as
an internal control for normalization using the 2−ΔΔCq
method (32). Primer sequences are
listed in Table I.
 | Table I.Primers used in quantitative PCR. |
Table I.
Primers used in quantitative PCR.
|
| Primer (5′-3′) |
|---|
|
|
|
|---|
| Gene | Forward | Reverse |
|---|
| TIE1 |
CCCAGATTGCGCTACAGCTА |
GCCCGCGTAAGTGAAGTTCT |
| CACNA2D1 |
CTGACGGTCCAAATCCTTGT |
GTCATAACAGGCGGTGTGTG |
| CAPN6 |
ACTATGGGTCCTCCTCTG |
AGCTGGTGGTTGCTAATG |
| ADAMTS6 |
TACCATGGCCGCAAAGACAT |
TCCTAGGCTGGAATCACGGT |
| SAA1 |
CTGCAGAAGTGATCAGCG |
ATTGTGTACCСТСТСССС |
| SAA2 |
CTGCAGAAGTGATCAGCA |
ATTATATGCATTATCTCAGC |
| GDF15 |
GTTAGCCAAAGACTGCCACTG |
CCTTGAGCCCATTCCACA |
| USP26 |
CGATGATATGCGGGTGTTAG |
GTACCCAGTGCAACGCCTAT |
| GADPH |
GACCCCTTCATTGACCTCAAC |
CTTCTCCATGGTGGTGAAGA |
PRECOG analysis to comprehend the
meta-Z analysis of all upregulated and downregulated genes from
TMZ-resistant GBM8401 cells
PRECOG analysis (https://precog.stanford.edu/) was performed for all
upregulated and downregulated genes identified using meta-Z
analysis across the brain tumor subtypes. The server helped to
predict clinical outcomes from genomic profiles and determine the
prognostic landscape of genes in all human cancers (33). Different brain cancers, including
astrocytomas, GBMs, gliomas, medulloblastomas, meningiomas and
neuroblastomas, were considered in this analysis. In the present
study, the Z-scores of all the downregulated and upregulated genes
were used. Finally, statistical models were developed for all the
downregulated and upregulated genes, considering the Z-scores of
all brain cancers; however, Z-scores were associated with P-values
and were thus added to the P-value conversion scale.
KM survival analysis
Survival analysis provides a visual demonstration of
the survival curves of ≥2 groups of biological organisms (34). In the present study, the PRECOG
server dataset was used to develop KM survival plots and understand
the survival of patients with different brain tumor subtypes. The
KM survival plots of different genes were incorporated into the
server as built-in properties. The developed KM plots were informed
of the high- and low-risk groups, and the PRECOG dataset was used
for the KM plot development of brain tumor subtypes. In certain
cases, patient data for specific genes in specific brain tumors
were not available. Therefore, it was not possible to develop these
plots. KM plots were generated using all downregulated and
upregulated genes from the dataset using meta-Z analysis.
In silico gene expression pattern of
downregulated and upregulated genes
Gene expression patterns were assessed for all
downregulated and upregulated genes. In the present study, the
Genomic Data Commons-The Cancer Genome Atlas (TCGA) data
(https://genome.ucsc.edu/) for 671 GBM samples
were used for analysis. A gene expression plot was developed using
the copy number of the genes and RNAseq-HTseq-FPKM-UQ data. The
University of California Santa Cruz Cancer Genomics Browser was
used (35). Log2
transformed data were used for statistical analysis.
Establishing a PPI network and cluster
analysis of upregulated and downregulated genes
First, the GeneCards database was searched for all
upregulated and downregulated genes (36,37).
In the present study, the PPI networks of the Search Tool for the
Retrieval of Interacting Genes/Proteins (STRING) (https://string-db.org/) linked the respective genes.
Using STRING, an interaction network was developed for all the
upregulated and downregulated genes using the STRING server
(StringApp version 1.7.1) (38). To
develop the network, medium confidence (0.400) of the STRING server
was used, and all other input parameters were set as general
parameters. In the STRING server, no clustering was applied, and
the network was shown as a network. Cluster analyses were performed
using the STRING server using all upregulated and downregulated
genes, which were identified in the NGS and quantitative (q)PCR
analyses of the TMZ-resistant GBM8401 cell samples. Finally, the
outcomes from the STRING tool were combined with those from the
Cytoscape software (v. 3.9.1; http://cytoscape.org/) to establish the PPI
network.
Construction of a co-expression gene
network and hierarchical clustering using all upregulated and
downregulated genes
A co-expression gene network and hierarchical
clustering were constructed using the COXPRESdb v7 server
(https://coxpresdb.jp/). All downregulated and
upregulated genes [tyrosine kinase with immunoglobulin and
epidermal growth factor homology domains 1 (TIE1), calcium
voltage-gated channel auxiliary subunit α2Δ1 (CACNA2D1),
calpain 6 (CAPN6) and a disintegrin and metalloproteinase
with thrombospondin motifs 6 (ADAMTS6)] and upregulated
[serum amyloid (SA)A1, SAA2, growth differentiation
factor 15 (GDF15) and ubiquitin specific peptidase 26
(USP26)] were converted to Entrez Gene IDs (39). The Entrez Gene IDs of all genes were
used as query sequences. In the present study, two types of
co-expressed gene networks were developed. The first was a
co-expressed gene plot using Entrez Gene IDs, which provided a
global view of the network. The global view in two dimensions
showed a co-expressed gene plot of the query genes. The second was
a co-expressed gene plot with the query and co-expressed genes.
Hierarchical clustering was also performed using all the
upregulated and downregulated genes. The two server parameters used
were Homo sapiens species and hsa-u. The c4-0 platform was
used for analysis. These two parameters were selected in the
COXPRESdb v7 server for the analysis.
Samples collection
Prior to the start of the present study, GBM (WHO
Grades 3 and 4) samples from different surgeries were deposited
into the tissue bank of Kaohsiung Chang Gung Memorial Hospital
(Kaohsiung, Taiwan) as a general hospital procedure in March 2019,
November 2020 and April 2021. Following approval from the
Institutional Review Board, GBM samples were collected from the
hospital tissue bank to initiate the study and perform further
analysis, in accordance with the hospital's tissue bank regulations
and other regulatory procedures. A total of two types of samples
were collected from 6 patients: GBM with wild-type IDH or mutant
IDH. The present study was approved by the Chang Gung Medical
Foundation Institutional Review Board (approval no.
201902218B1B0).
Immunohistochemical staining
Tissues were fixed in 4% paraformaldehyde at 4°C
overnight, and embedded in paraffin. Tissue blocks were sectioned
at a thickness of 4 µm on slides. Tissue sections were
deparaffinized in two changes of xylene, rehydrated in a graded
series of ethanol and rinsed in distilled water. For antigen
retrieval, the slides were incubated with proteinase K (cat. no.
P2308, Sigma-Aldrich; Merck KGaA) in Tris-EDTA buffer for 45 min in
a water bath at 37°C, and endogenous peroxidases were quenched with
3% H2O2 in phosphate-buffered saline for 8
min at room temperature. The sections were blocked with 4% horse
serum (cat. no. 008-000-121; Jackson ImmunoResearch Laboratories,
Inc.) in 0.1% bovine serum albumin (cat. no. 01-000-161; Jackson
ImmunoResearch Laboratories, Inc.) for 3 h at room temperature,
followed by incubation with primary antibodies diluted in 2% horse
serum (cat. no. 01-000-161; Jackson ImmunoResearch Laboratories,
Inc.) overnight at 4°C. The primary antibodies used were anti-SAA1
(1:100; cat. no. E-AB-52681; Elabscience Biotechnology, Inc.),
anti-SAA2 (1:100; cat. no. 13192-1-AP; Proteintech Group, Inc.),
anti-TIE1 (1:500; cat. no. ab111547; Abcam) and anti-Calpain 6
(1:100; cat. no. ab76974; Abcam). The sections were then incubated
with biotinylated secondary antibodies (cat. no. BA-1100; Vector
Laboratories, Inc.) diluted (1:400) in 2% horse serum (cat. no.
008-000-121; Jackson ImmunoResearch Laboratories, Inc.) for 90 min
at room temperature. Signals were detected using an avidin-biotin
complex (cat. no. PK-6100; Vector Laboratories, Inc.) and
3,3-diaminobenzidine tetrahydrochloride (cat. no. SK-4100; Vector
Laboratories, Inc.). The images were captured using a light
microscope (Leica DM 6000 B; Leica Microsystems GmbH) and Leica
Application Suite X software (version: 5.1.0.25593; Leica
Microsystems GmbH). Immunohistochemical analysis was performed as
previously described (40,41). Immunohistochemical images were
acquired at ×200 magnification under the same exposure time and
measured for each pixel value of the positive area using freely
available ImageJ software version 1.53k (National Institutes of
Health) without a specific plugin to perform deconvolution and
downstream analysis. The images were analyzed using a region of
interest manager to calculate the number of immunoreactive pixels
occupied by the target protein. For each tissue specimen, three
tissue fields were randomly selected and analyzed.
Evaluation of the mutational landscape
of IDH in GBM through in silico models
Molecular modeling of the IDH structure was based on
two published three-dimensional (3D) structures. A total of three
types of structures were developed: i) Wild-type IDH, ii) IDH1 with
mutation at position R132, iii) and IDH3 with mutation at positions
R140 and R172. Structures from the Protein Data Bank (PDB; PDB ID:
3MAP, 3MAS and 1T09) were retrieved for further analysis (42). The modeled 3D structure of IDH was
further analyzed using PyMOL 2.6 (43). Another 3D model of IDH was developed
using AlphaFold 3.0 (44), and
wild-type and mutant IDH structures were developed (positions R132,
R140 and R172). The 3D model was validated using the same server.
The secondary structural landscape was analyzed using PDBsum 2.58
(45).
Statistical analysis
The cell viability was analyzed using one-way
analysis of variance and Dunnett's post-hoc test. The data of the
immunohistochemical staining assay were analyzed using unpaired
Student's t-tests. Statistical graphs, plots and models were
constructed using the PAST 4.03 statistical software (46). This software built the ‘statistical
models’ and depicted the ‘polynomial models’ order 2 with the
R2 value. In the present study, the ‘statistical
models/statistical plots’ were developed using gene expression and
other data. Simultaneously, MATLAB 9.6 was also used to analyze and
depict the plots and graphs (47).
For KM survival analysis, a median split was used by the PRECOG web
server to generate KM plots, and the log-rank test was used by the
server for curve separation.
An outline of the workflow of the present study is
presented in Fig. 1, including the
strategies and step-by-step analysis.
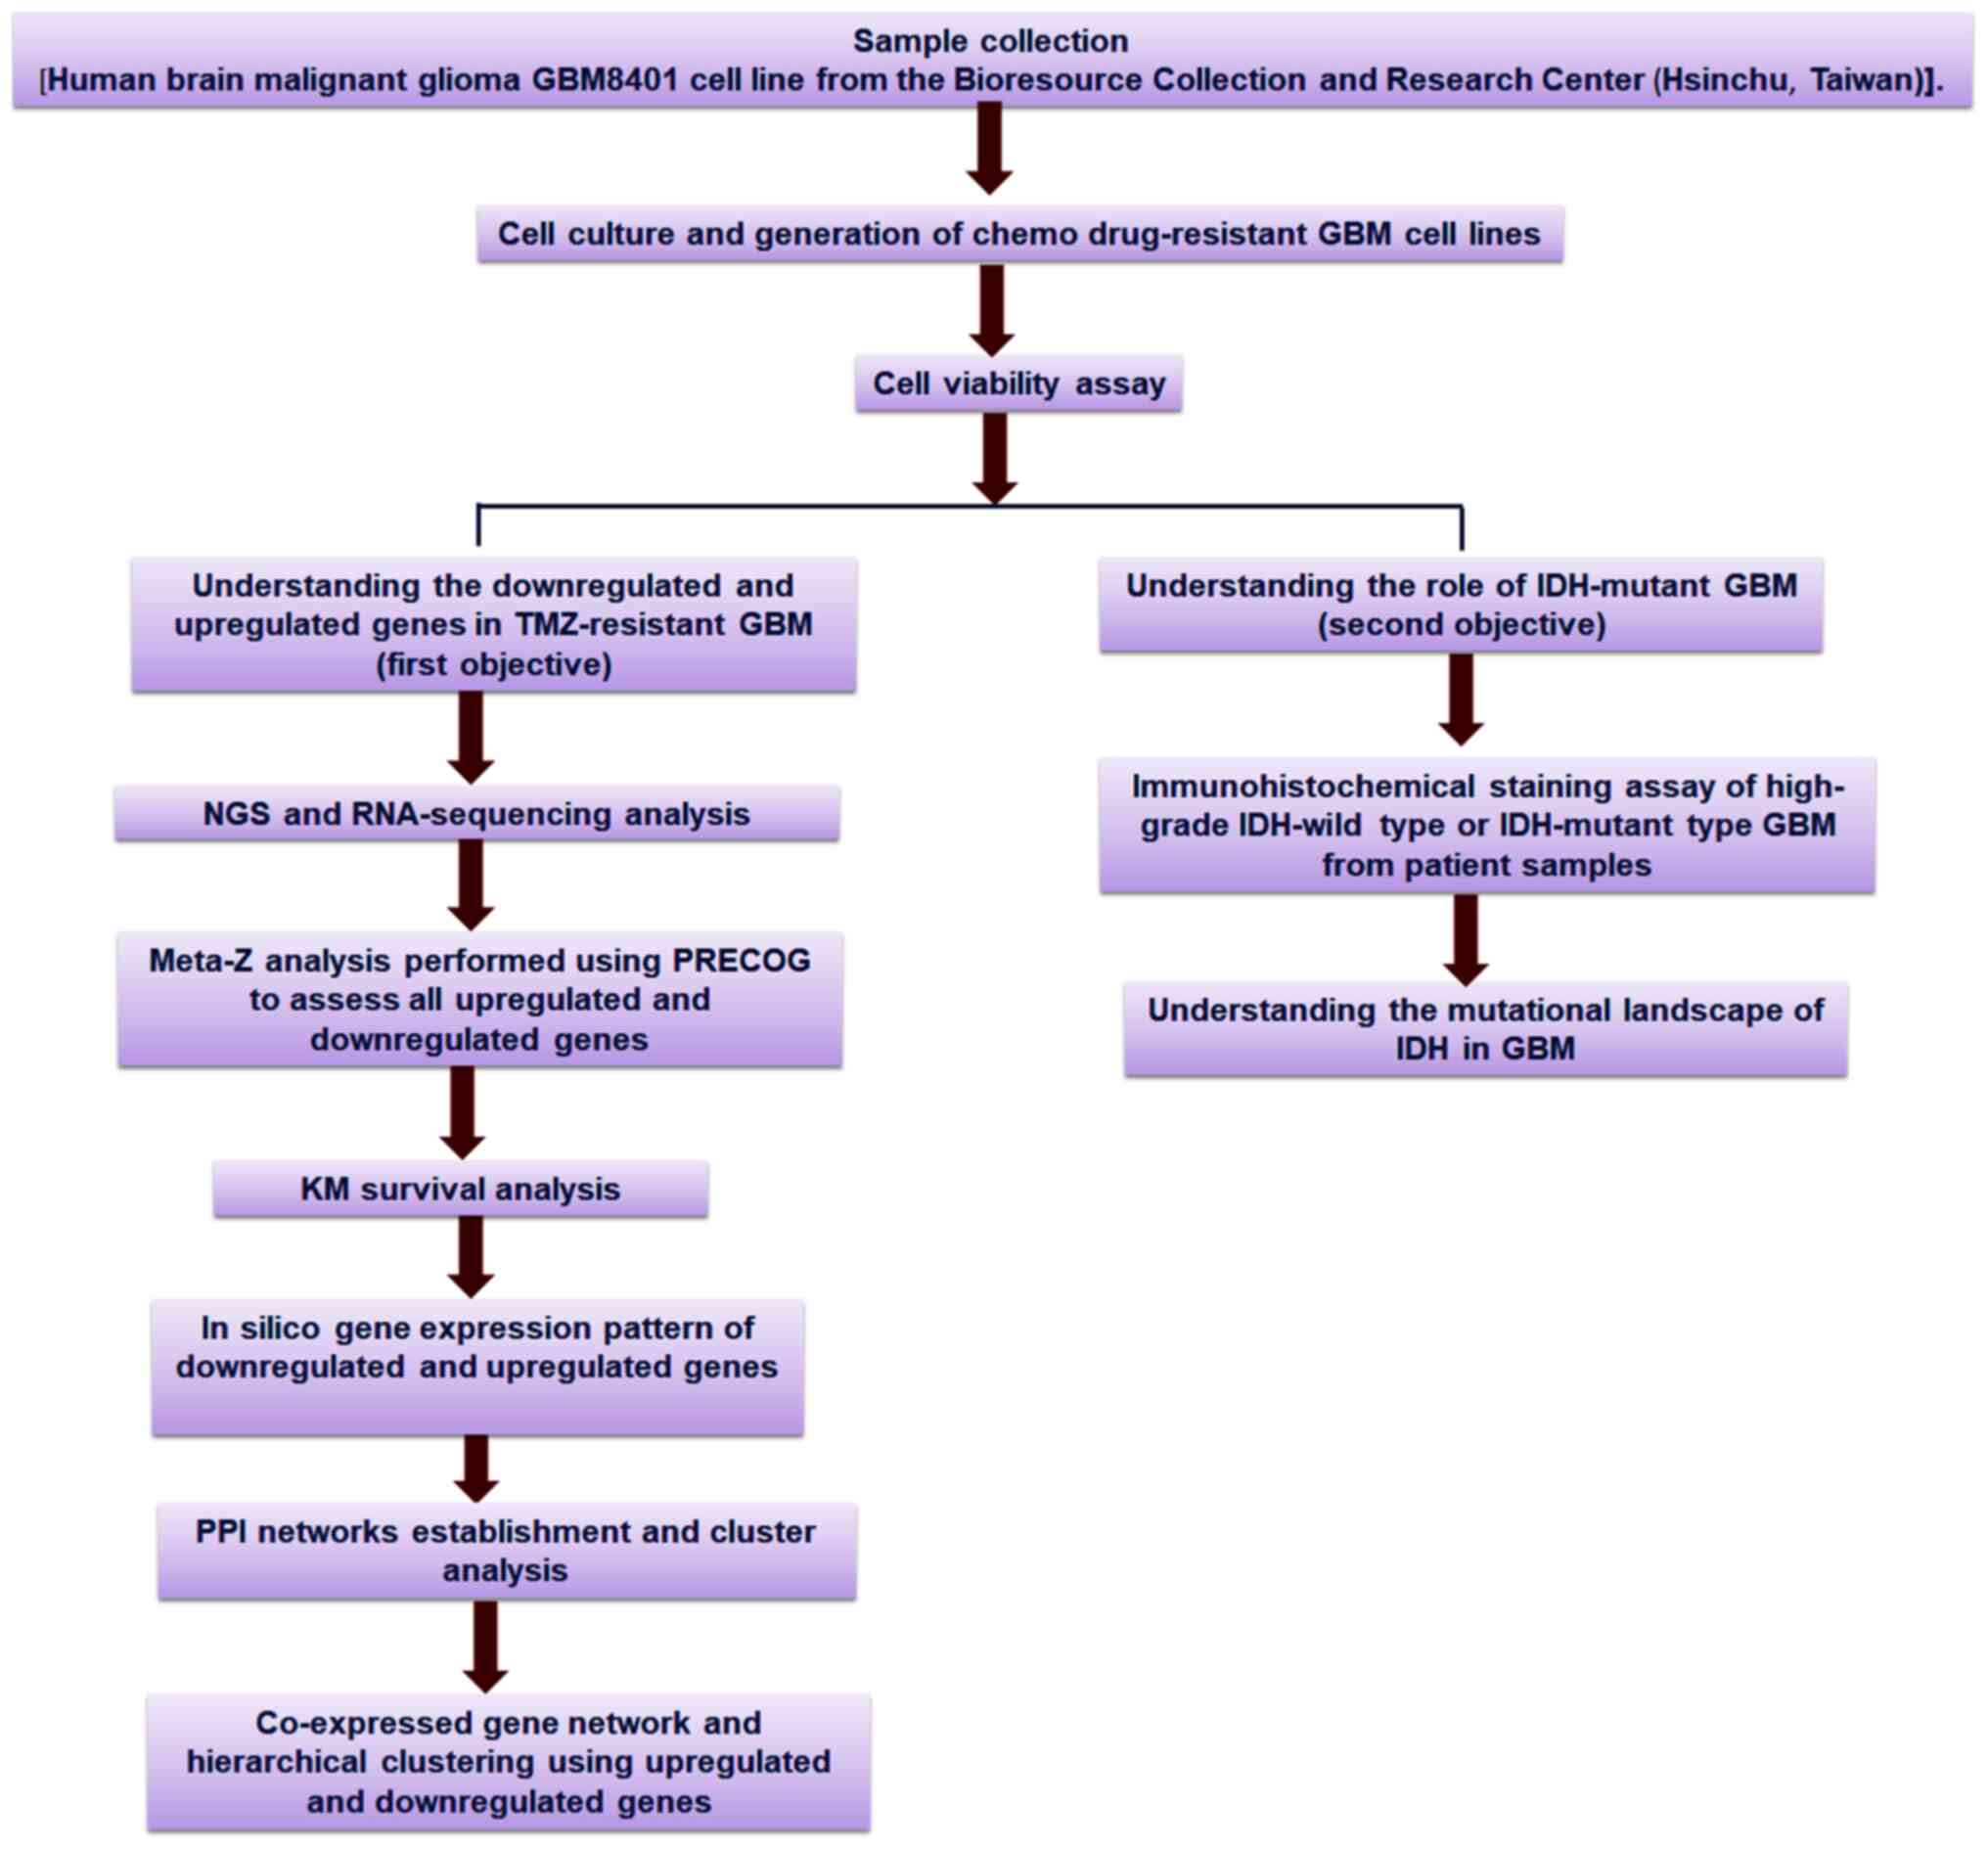 | Figure 1.Schematic diagram of the overall
study methodology. The study was performed with two objectives:
First, it aimed to assess the downregulated and upregulated genes
and their profiles using TMZ-resistant GBM cell lines; and second,
it aimed to understand the mutational landscape of IDH in GBM. For
the first objective, NGS and RNA-sequencing analyses, meta-Z
analysis using PRECOG, KM survival analysis using PRECOG, in
silico gene expression pattern analysis, PPI networks
establishment and cluster analysis of the co-expressed gene
network, and hierarchical clustering were performed. For the second
objective, an immunohistochemical staining assay of the upregulated
and downregulated genes in IDH-wild type or mutant cells as well as
in silico analysis of the mutational landscape of IDH in GBM
through several developed models were performed. TMZ, temozolomide;
GBM, glioblastoma multiforme; IDH, isocitrate dehydrogenase; NGS,
next-generation sequencing; PRECOG, Prediction of Clinical Outcomes
from Genomic Profiles; KM, Kaplan-Meier; PPI, protein-protein
interaction. |
Results
Establishing a TMZ-resistant GBM cell
line
Drug resistance is a critical clinical issue in
patients with cancer, resulting in therapeutic failure. TMZ, an
imidazotetrazine, is an anticancer drug commonly used to treat
patients with GBM; however, TMZ resistance is a common problem in
GBMs (48). To assess TMZ
resistance in TMZ-resistant GBM, a cell viability study was
performed using MTT assays to determine the anticancer effects of
different doses of TMZ in GBM8401 and TMZ-resistant GBM8401 cell
lines for different periods (24, 48 and 72 h). The viability
results of TMZ treatment in GBM8401 and TMZ-resistant GBM8401 cell
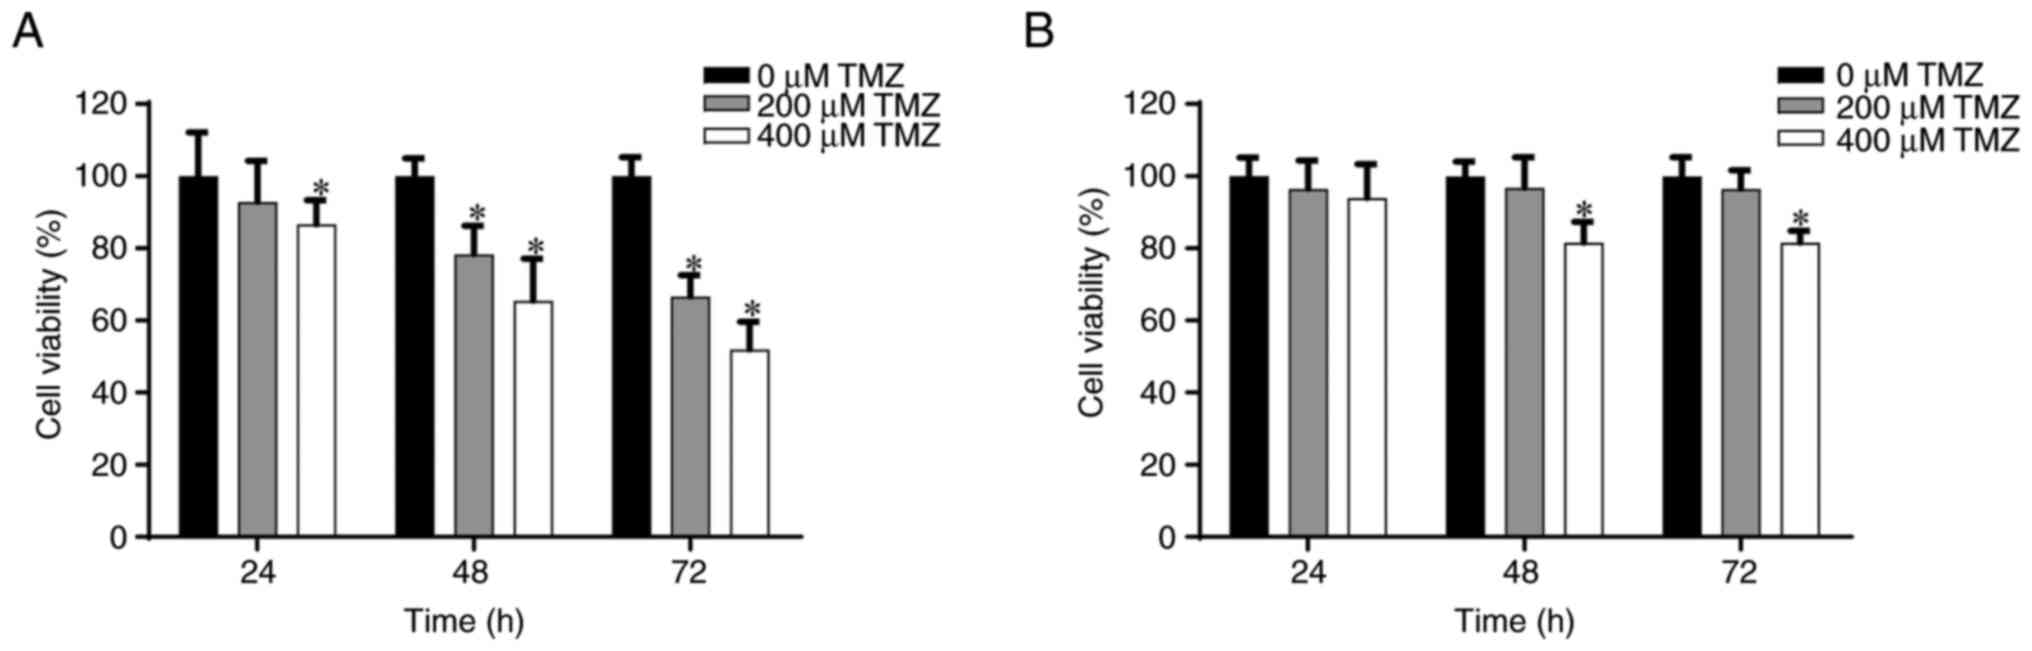
lines from the MTT assay are presented in Fig. 2. After 48 h, treatment with 200 and
400 µM TMZ significantly reduced cell viability to ~80 and 70%,
respectively, in comparison with cells treated with 0 µM TMZ.
Similarly, it was demonstrated that treatment with 200 and 400 µM
TMZ significantly reduced cell viability after 72 h to ~70 and 58%,
respectively, in comparison with cells treated with 0 µM TMZ
(Fig. 2A). Furthermore, in
TMZ-resistant GBM8401, treatment with 400 µM TMZ significantly
reduced cell viability to ~80% after both 48 and 72 h, in
comparison with cells treated with 0 µM TMZ. However, no
significant effect was observed after treatment with 200 µM TMZ
after 48 or 72 h (Fig. 2B).
NGS and qPCR analysis in TMZ-resistant
GBM8401 cells
Using NGS, two groups of GBM cells were analyzed:
Normal and TMZ-resistant. The results revealed that, compared with
the normal group, 20 genes were upregulated >2 times and 20
genes were downregulated >2 times in the TMZ-resistant group.
The O6-methylguanine-DNA-methyltransferase (MGMT) gene has been
upregulated in cases of resistance to the drug TMZ (49). As a result, this gene was
intentionally omitted from the scope of this study. Further
validation of NGS results was performed using qPCR. After analyzing
NGS and qPCR, a focus was placed on the genes that showed a
decrease of >2 times in expression (Table II) and those that showed an
increase of >2 times in expression (Table III) in TMZ-resistant cells.
| Table II.Downregulated mRNAs in
temozolomide-resistant GBM8401 cells. |
Table II.
Downregulated mRNAs in
temozolomide-resistant GBM8401 cells.
| Gene | Gene expression NGS
result | qPCR result |
|---|
| TIE1 | −3.85766 | 0.05 |
| CACNA2D1 | −3.27131 | 0.17 |
| CAPN6 | −3.05983 | 0.20 |
| ADAMTS6 | −3.66361 | 0.26 |
| Table III.Upregulated mRNAs in
temozolomide-resistant GBM8401 cells. |
Table III.
Upregulated mRNAs in
temozolomide-resistant GBM8401 cells.
| Gene | Gene expression NGS
result | qPCR result |
|---|
| SAA2 | 4.384488 | 11.70 |
| GDF15 | 3.957493 | 6.18 |
| SAA1 | 3.432643 | 6.13 |
| USP26 | 4.788689 | 3.94 |
Downregulated (TIE1, CACNA2D1, CAPN6 and
ADAMTS6) and upregulated (SAA1, SAA2, GDF-15 and
USP26) genes were identified. A statistical model was
developed to understand gene patterns using NGS data (Fig. 3A). TIE1 had the greatest
level of downregulation (−3.85766), whilst CAPN6 had the
least (−3.05983). Furthermore, USP26 had the greatest level
of upregulation (4.788689), whilst SAA1 had the least
(3.432643). The polynomial statistical model yielded an
R2 value of 0.4063.
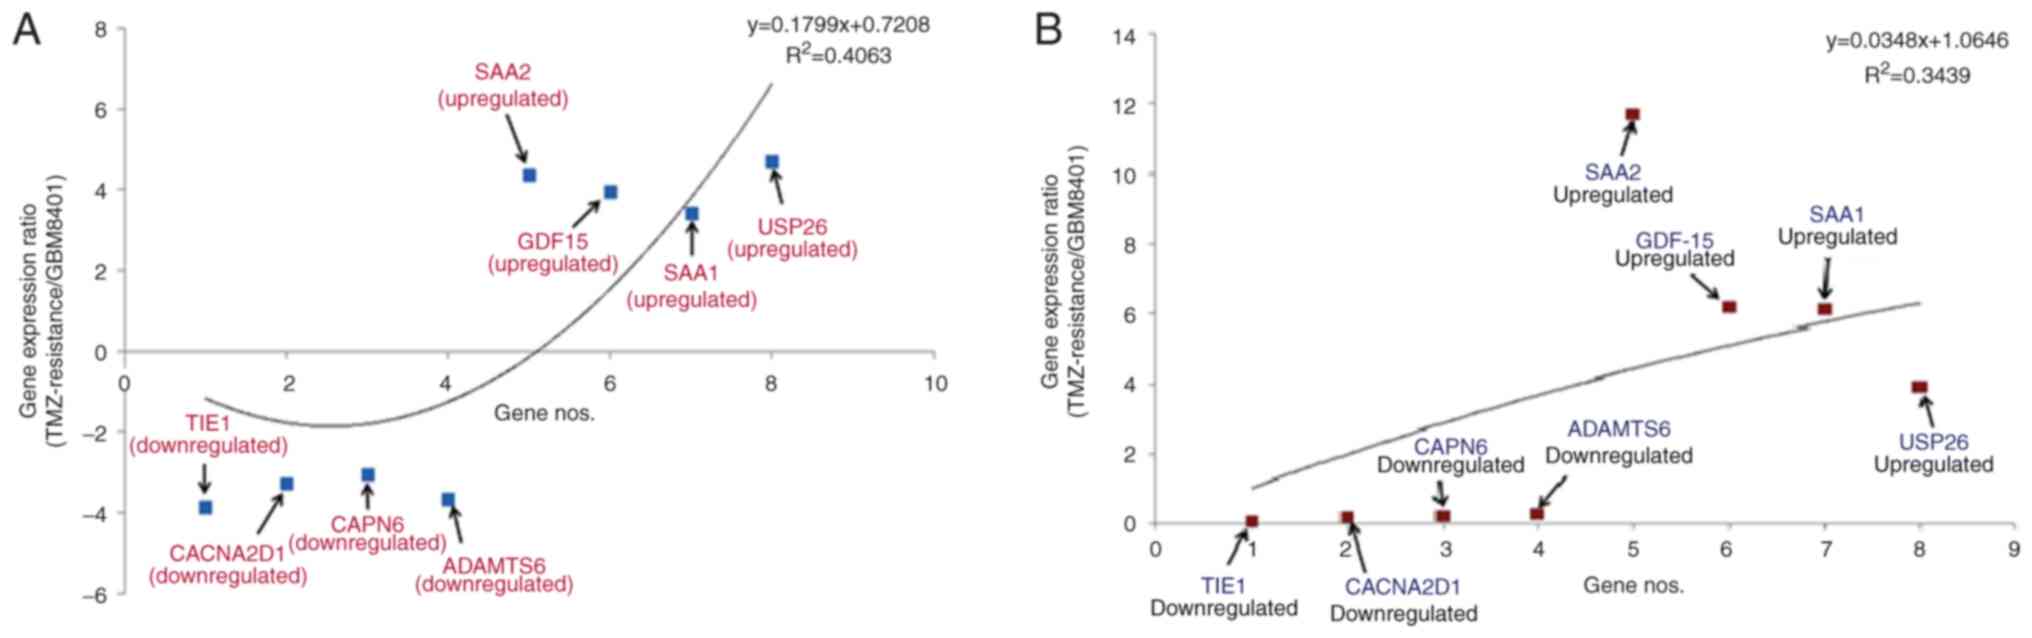 | Figure 3.Pattern of differential gene
expression in TMZ-resistant GBM8401 cells. Statistical model of
upregulation and downregulation of the genes using (A) NGS and (B)
qPCR data. TMZ, temozolomide; NGS, next-generation sequencing;
qPCR, quantitative PCR; SAA2, serum amyloid A2; GDF15,
growth/differentiation factor 15; SAA1, serum amyloid A1; USP26,
ubiquitin-specific protease 26; TIE1, tyrosine kinase with
immunoglobulin and epidermal growth factor homology domains 1;
CACNA2D1, calcium voltage-gated channel auxiliary subunit α2Δ1;
CAPN6, calpain 6; ADAMTS, a disintegrin and metalloproteinase with
thrombospondin motifs 6. |
Simultaneously, another statistical model was
developed to identify the patterns of upregulated and downregulated
genes using the qPCR data (Fig.
3B). According to this model, TIE1 had the greatest
level of downregulation (0.05), whilst ADAMTS6 had the least
(0.26). Furthermore, SAA2 had the greatest level of
upregulation (11.70), whilst USP26 had the least (3.94). The
polynomial statistical model yielded an R2 value of
0.3439.
Meta-Z analysis of all upregulated and
downregulated genes from TMZ-resistant GBM8401 cells using the
PRECOG server
Meta-Z analysis using the PRECOG server revealed the
Z-scores of all the upregulated and downregulated genes. The
Z-scores of the downregulated genes (TIE1, CACNA2D1, CAPN6
and ADAMTS6) were determined for different types of brain
cancer (Fig. 4). Z-scores indicate
the survival outcomes for candidate genes. According to the
correspondence table, Z-scores can be converted to P-values,
Z-score >1.96, which is equivalent to P<0.05. In the present
study, different statistical models of the downregulated genes
(TIE1, CACNA2D1, CAPN6 and ADAMTS6) in different
brain cancers, such as astrocytomas, glioblastomas, gliomas,
medulloblastomas, meningiomas and neuroblastomas, were developed
(Fig. 5). For TIE1, the
models demonstrated that the highest Z-score was for meningioma and
the lowest was for astrocytomas (Fig.
5A). Similarly, for CACNA2D1, the models revealed that
the highest Z-score was for neuroblastoma and the lowest for
astrocytoma (Fig. 5B). For
CAPN6, the highest Z-score from the developed models was for
GBM and the lowest was for meningioma (Fig. 5C). Finally, for ADAMTS6, the
statistical models demonstrated that the highest Z-score was for
neuroblastomas and the lowest was for astrocytomas (Fig. 5D).
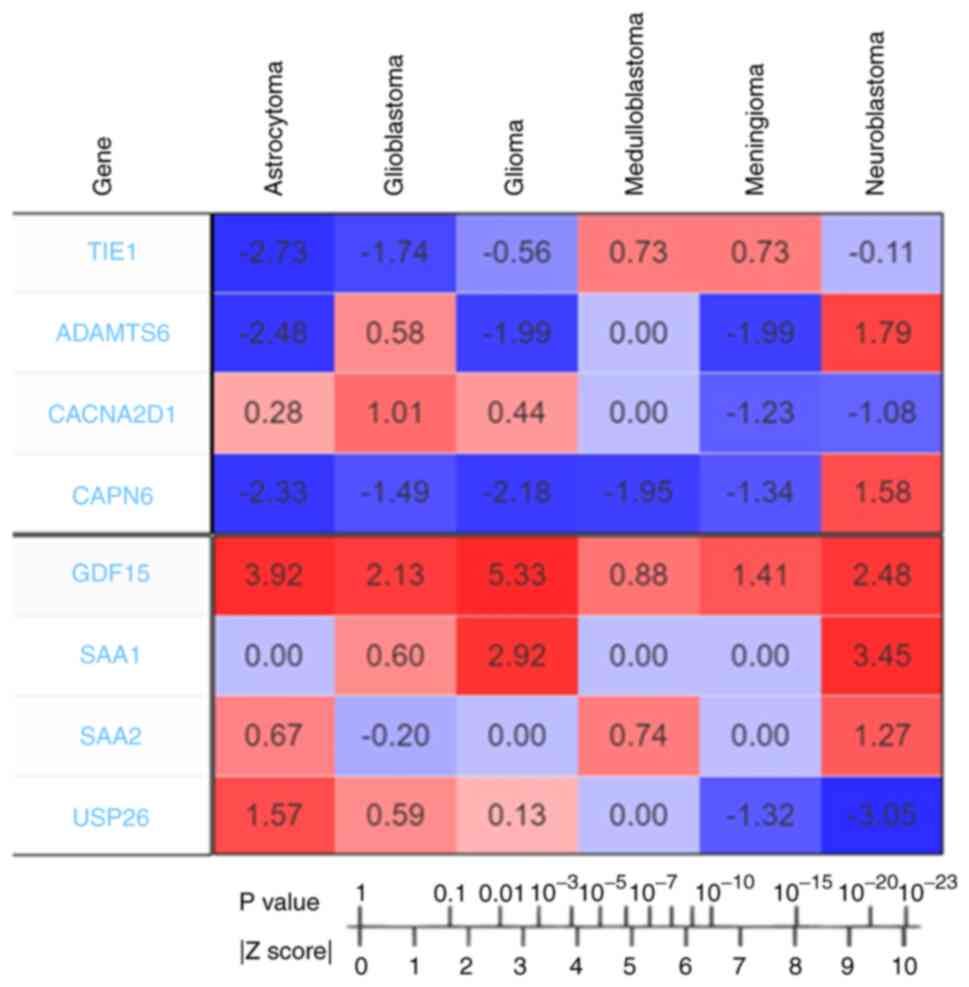 | Figure 4.Outcomes of PRECOG analysis of
downregulated (TIE1, ADAMTS6, CACNA2D1 and CAPN6) and
upregulated candidate genes (GDF15, SAA1, SAA2 and
USP26). The Z-scores represent the association between
candidate genes and prognosis and are associated with P-values. The
Z-score to P-value conversion was also recorded. The Z-scores
indicate the survival outcome for candidate genes. The values
indicating poor prognosis genes are shown in red, and those
indicating good prognosis genes are shown in blue. This figure was
generated using the PRECOG server. PRECOG, Prediction of Clinical
Outcomes from Genomic Profiles; TIE1, tyrosine kinase with
immunoglobulin and epidermal growth factor homology domains 1;
CACNA2D1, calcium voltage-gated channel auxiliary subunit α2Δ1;
CAPN6, calpain 6; ADAMTS6, a disintegrin and metalloproteinase with
thrombospondin motifs 6; SA, serum amyloid; GDF15, growth
differentiation factor 15; USP26, ubiquitin specific peptidase
26. |
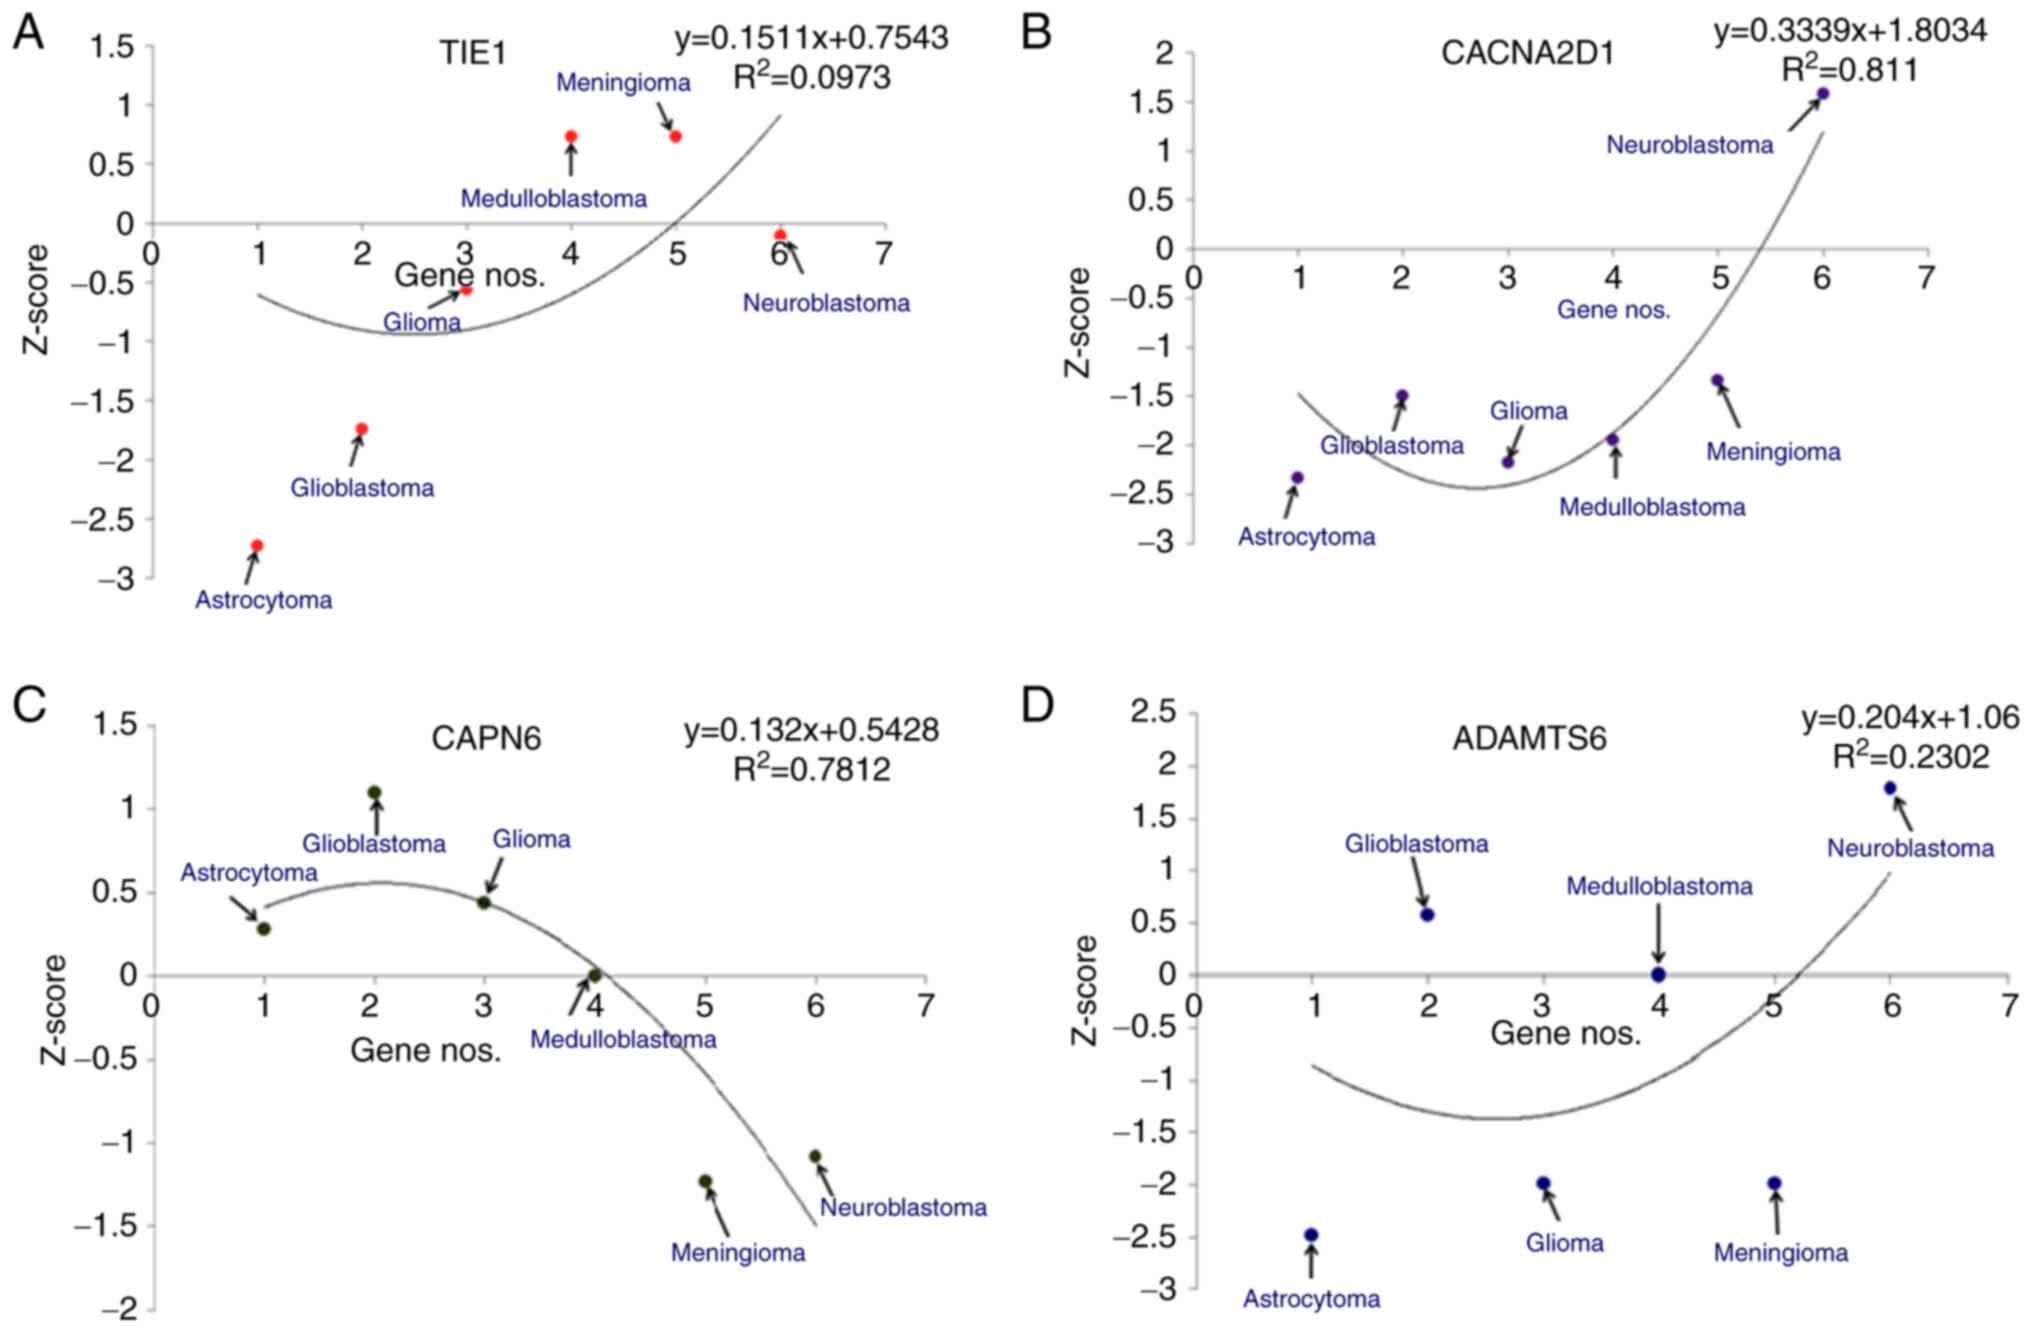 | Figure 5.Different statistical models of
downregulated genes in different types of brain cancer, such as
astrocytoma, glioblastoma, glioblastoma multiforme,
medulloblastoma, meningioma and neuroblastoma. The Z-scores of
downregulated genes are shown: (A) TIE1, (B)
CACNA2D1, (C) CAPN6 and (D) ADAMTS6. TIE1,
tyrosine kinase with immunoglobulin and epidermal growth factor
homology domains 1; CACNA2D1, calcium voltage-gated channel
auxiliary subunit α2Δ1; CAPN6, calpain 6; ADAMTS6, a disintegrin
and metalloproteinase with thrombospondin motifs 6. |
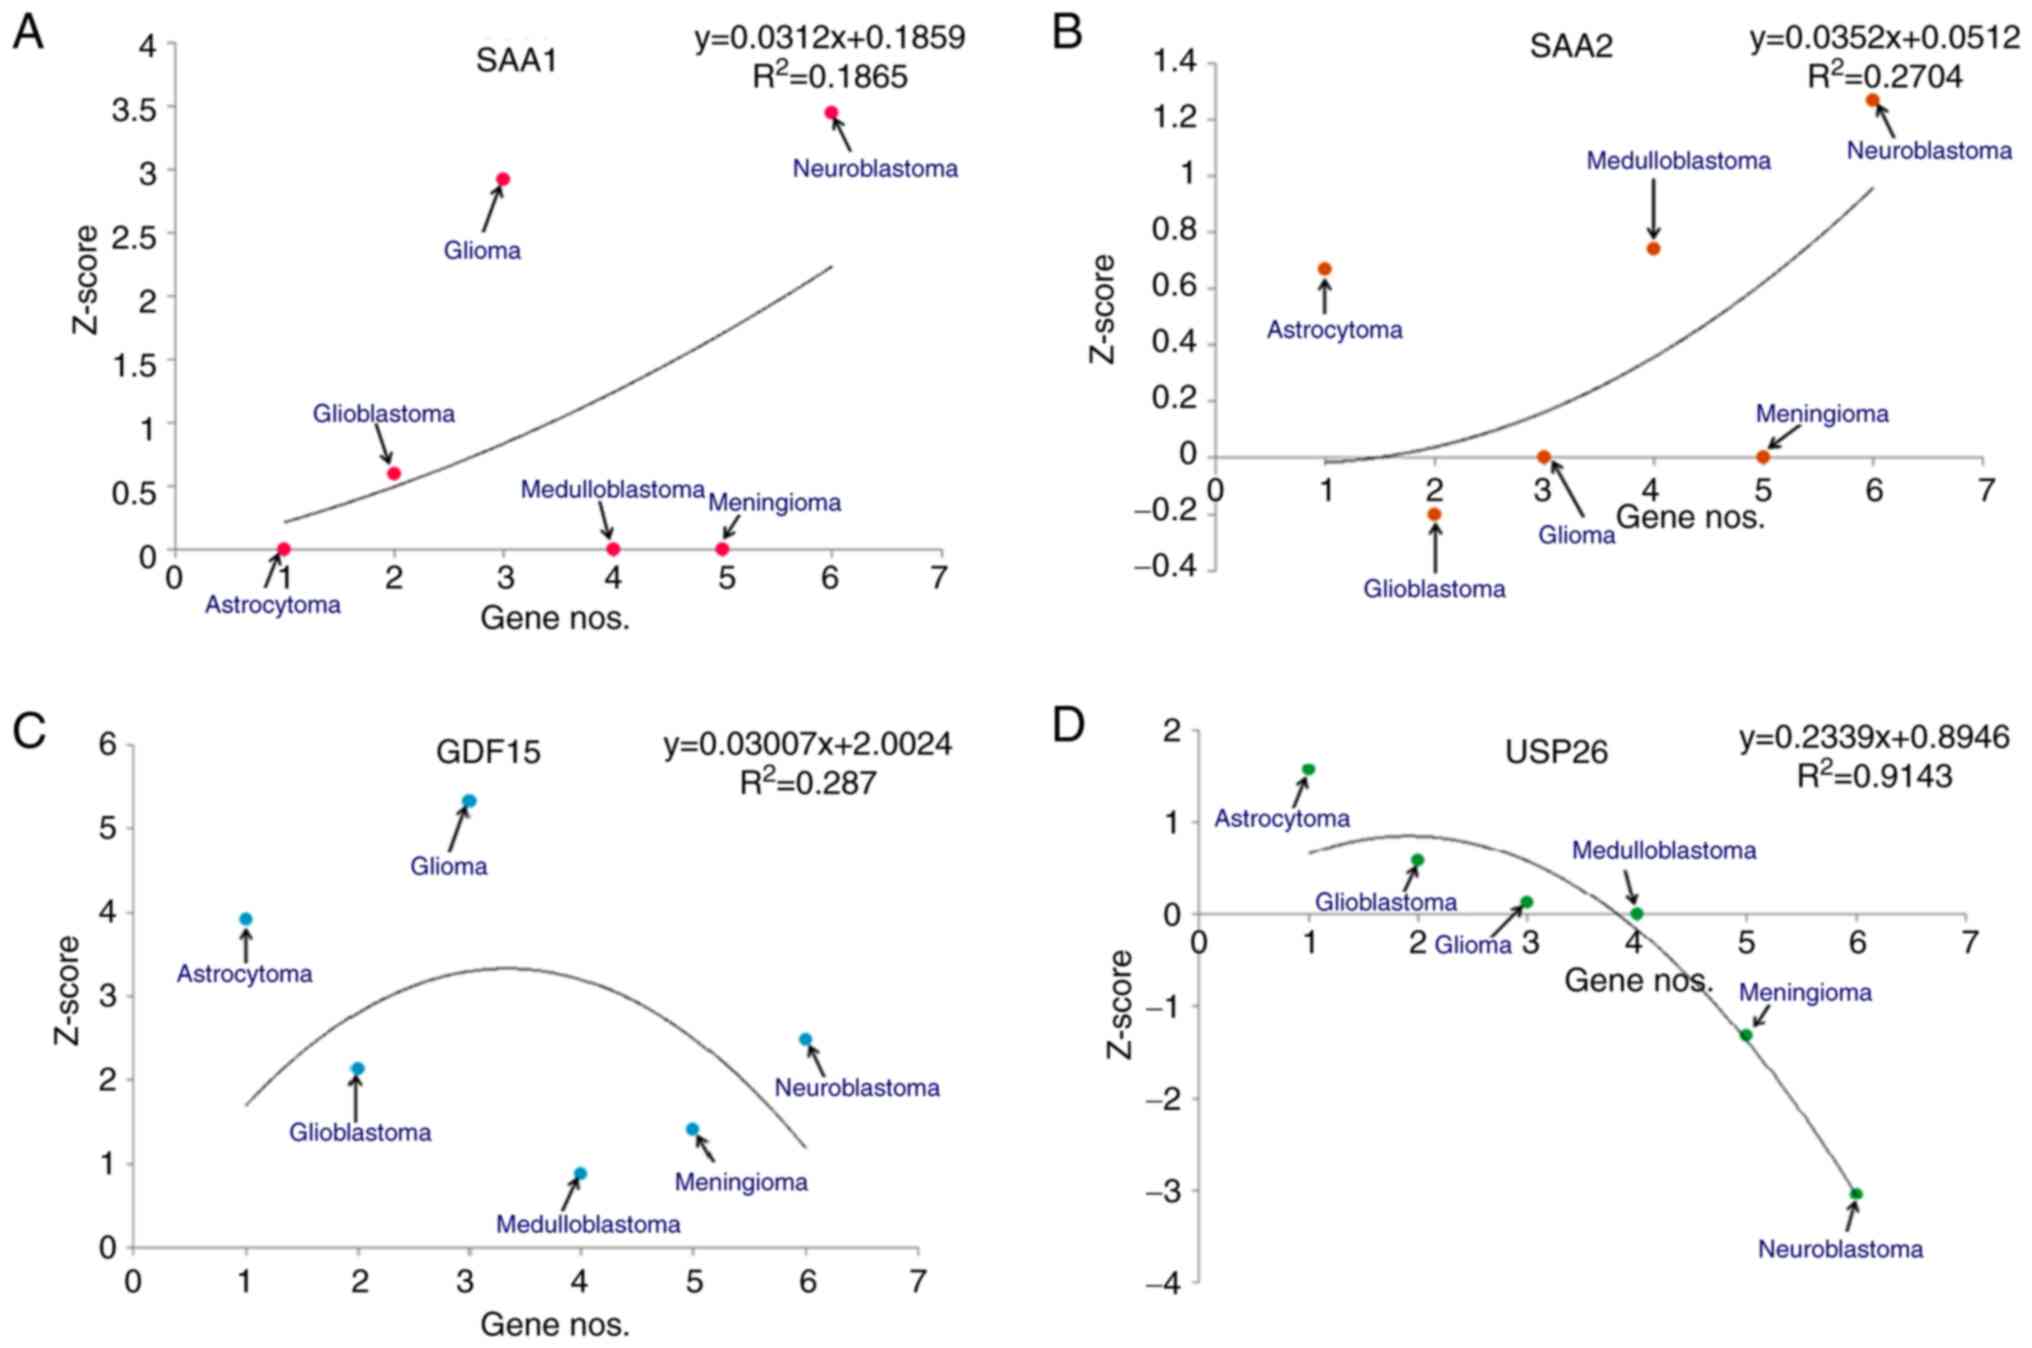
Similarly, the Z-scores of the upregulated genes
(SAA1, SAA2, GDF15 and USP26) were determined for
different types of brain cancer (Fig.
4) and several statistical models were developed for these
upregulated genes in the aforementioned types of brain cancer
(Fig. 6). For SAA1, the
models demonstrated that the highest Z-score was for neuroblastomas
and the lowest was for astrocytomas (Fig. 6A). Similarly, for SAA2, the
statistical models revealed that the highest Z-score was for
neuroblastoma and the lowest was for GBM (Fig. 6B). Similarly, for GDF15, the
statistical models demonstrated that the highest Z-score was for
gliomas and the lowest was for medulloblastomas (Fig. 6C). Finally, for USP26, it was
revealed that the highest Z-score was for astrocytomas and the
lowest was for neuroblastomas (Fig.
6D).
KM survival analysis for downregulated
genes
KM analysis was performed for all downregulated
genes (TIE1, CACNA2D1, CAPN6 and ADAMTS6) in the
present study using a cohort of patients with different brain
cancers. KM plots were constructed using a patient cohort with
astrocytoma, GBM, glioma and medulloblastoma. For TIE1, in
the cohort of patients with astrocytoma (n=154), a log-rank test
result of P=0.061 and hazard ratio (HR)=0.745; the cohort of
patients with GBM (n=90) demonstrated similar log-rank test results
(P=0.051; HR=0.1006); the cohort of patients with glioma (n=50)
revealed a log-rank test result of P=0.091 and HR=0.875; and the
patient cohort with medulloblastoma (n=60) demonstrated log-rank
test results of P=0.39 and HR=1.178 (Fig. S1A). For CACNA2D1, the patient
cohort with astrocytoma (n=154) revealed a log-rank test result of
P=0.00051 and HR=0.722; the patient cohort with GBM (n=39)
demonstrated a log-rank test result of P=0.08 and HR=1.348; the
patient cohort with glioma (n=50) revealed a log-rank test result
of P=0.55 and HR=0.908; and the patient cohort with medulloblastoma
(n=60) demonstrated a log-rank test result of P=0.22 and HR=0.675
(Fig. S1B). For CAPN6, the
patient cohort with astrocytoma (n=154) revealed a log-rank test
result of P=0.46 and HR=1.215; the patient cohort with GBM (n=39)
demonstrated a log-rank test result of P=0.41 and HR=0.1.094; the
patient cohort with glioma (n=50) had a log-rank test result of
P=0.63 and HR=1.02; and the patient cohort with neuroblastoma
(n=85) demonstrated a log-rank test result of P=0.91 and HR=1.139
(Fig. S1C). Finally, for ADAMTS6,
the patient cohort with astrocytoma (n=154) revealed a log-rank
test result of P=0.15 and HR=1.089; the patient cohort with GBM
(n=39) demonstrated a log-rank test result of P=0.09 and HR=1.024;
the patient cohort with glioma (n=136) revealed a log-rank test
result of P=0.48 and HR=1.23; and the patient cohort with
meningioma (n=60) demonstrated a log-rank test result of P=0.81 and
HR=0.627 (Fig. S1D).
KM survival analysis for upregulated
genes
KM analysis was performed for all upregulated genes
(SAA1, SAA2, GDF15, and USP26) in cohorts of patients
with different brain cancers. Using the cohorts of patients with
glioma and neuroblastoma, KM plots were generated for SAA1.
The patient cohort with glioma (n=50) demonstrated a log-rank test
result of P=0.043 and HR=1.721. Similarly, the patient cohort with
neuroblastoma (n=85) revealed a log-rank test result of P=0.85 and
HR=1.239 (Fig. S2A). KM plots of
SAA2 expression was generated using patient cohorts with GBM and
medulloblastoma. The cohort with GBM (n=39) demonstrated a log-rank
test result of P 0.62 and HR=0.96. The patient cohort with
medulloblastoma (n=60) revealed a log-rank test result of P=0.11
and HR=1.404 (Fig. S2B). KM plots
for GDF15 was generated using patient cohorts with
astrocytoma, GBM, glioma and medulloblastoma. The patient cohort
with astrocytoma (n=154) revealed a log-rank test result of P=0.082
and HR=1.273; the patient cohort with GBM (n=39) demonstrated a
log-rank test result of P=0.83 and HR=0.0976; the patient cohort
with glioma (n=50) had a log-rank test result of P=0.00028 and
HR=1.479; and the patient cohort with medulloblastoma (n=60)
demonstrated a log-rank test result of P=0.57 and HR=1.224
(Fig. S2C). KM curves for
USP26 were generated using patient cohorts with
astrocytomas, glioblastomas, GBM and meningiomas. The astrocytoma
patient cohort (n=154) revealed a log-rank test result of P=0.0012
and HR=0.0699; the patient cohort with GBM (n=39) demonstrated a
log-rank test result of P=0.035 and HR=1.103; the patient cohort
with glioma (n=136) revealed a log-rank test result of P=0.91 and
HR=1.256; and the patient cohort with meningioma (n=67)
demonstrated a log-rank test result of P=0.47 and HR=0.901
(Fig. S2D).
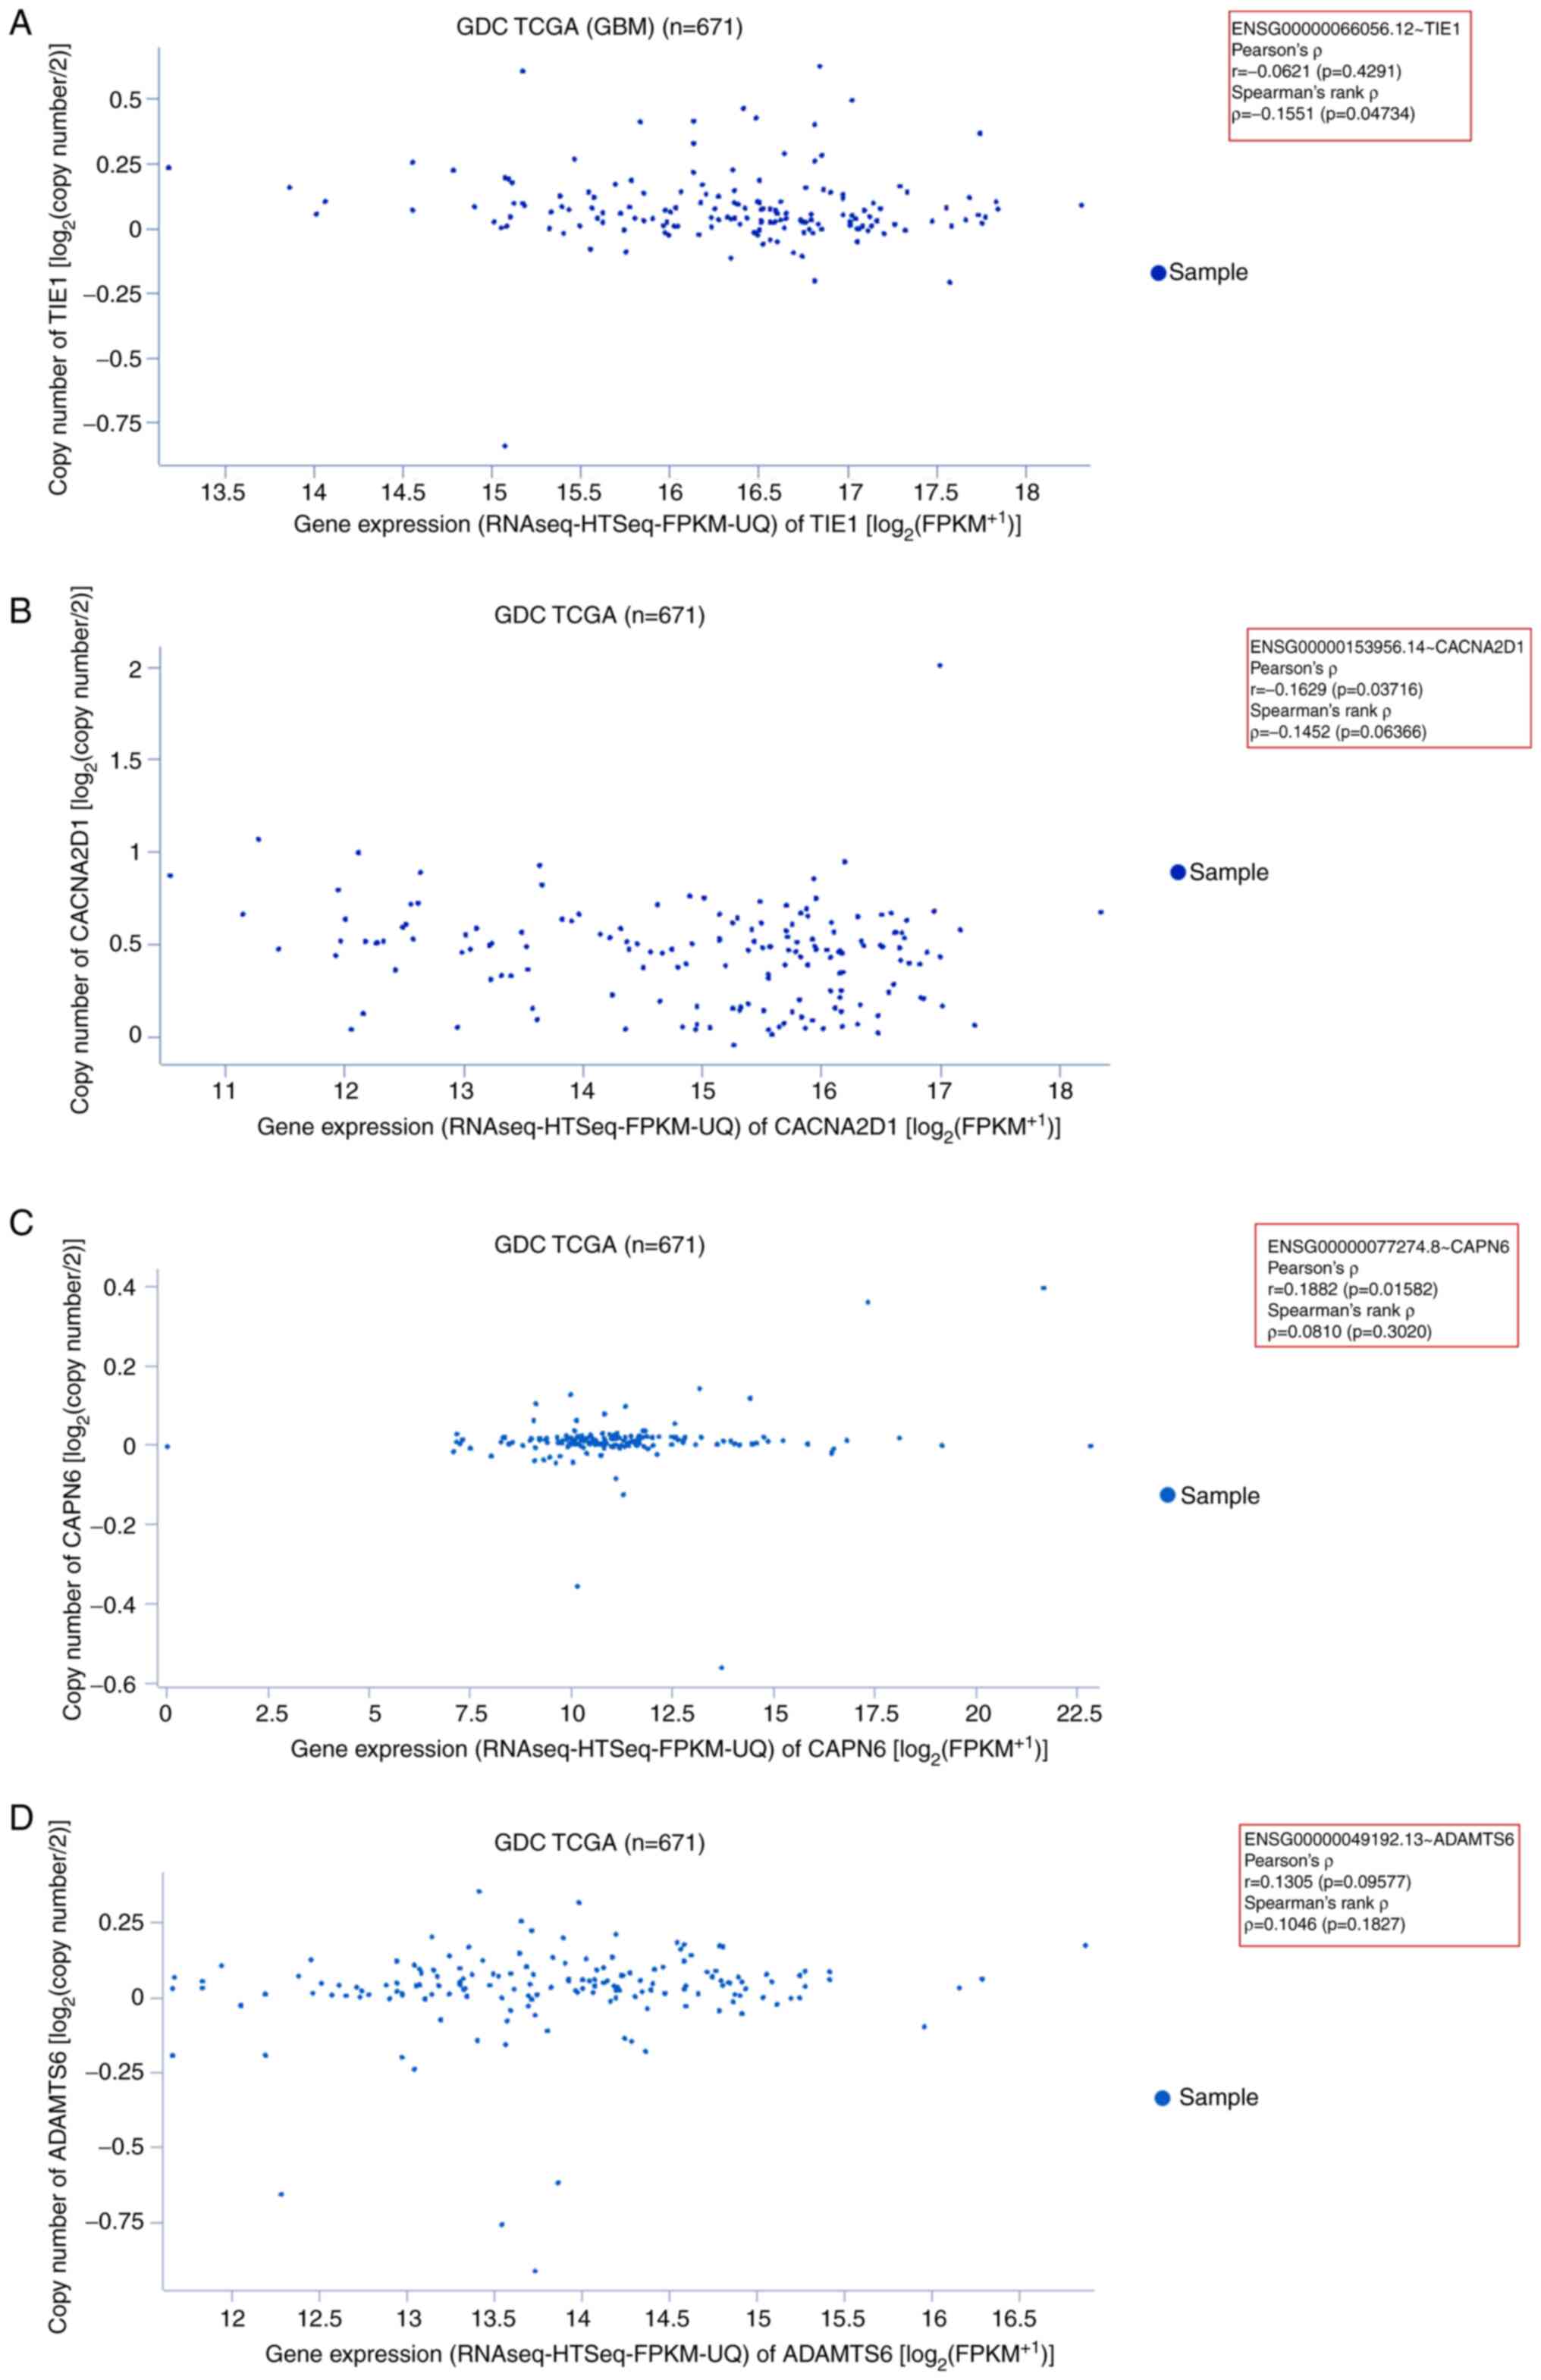
Gene expression patterns of
downregulated genes
In the present study, the expression patterns of
downregulated genes (TIE1, CACNA2D1, CAPN6 and
ADAMTS6) were determined using the GDC TCGA dataset of 671
GBM samples. First, the expression of TIE1 in GBM samples
was assessed. In the generated scatter plot, most sample data
points were plotted within 14.5–18 on the x-axis
(RNAseq-HTseq-FPKM-UQ data). The plotted data revealed Pearson's
ρ=−0.06216 (P=0.4291) and Spearman's rank ρ=−0.1551 (P=0.04734;
Fig. 7A). Second, the gene
expression pattern of CACNA2D1 was determined in GBM
samples. The scatter plot demonstrated that most sample data points
were plotted within 12–17 on the x-axis. The plotted data revealed
Pearson's ρ=−0.1629 (P=0.03716) and Spearman's ρ=−0.1452
(P=0.06366; Fig. 7B). Third, the
gene expression pattern of CAPN6 was assessed in GBM
samples. The generated scatter plot demonstrated that most sample
data points were plotted within 16–17.5 of the x-axis. The plotted
data revealed Pearson's ρ=0.1882 (P=0.01582) and Spearman's rank
ρ=0.08109 (P=0.3020; Fig. 7C).
Fourth, the gene expression pattern of ADAMTS6 was evaluated
using GBM samples. The scatter plot demonstrated that most sample
data points were plotted within 0–15.5 of the x-axis. The plotted
data revealed Pearson's ρ=0.1305 (P=0.09577) and Spearman's rank
ρ=0.1046 (P=0.1827; Fig. 7D).
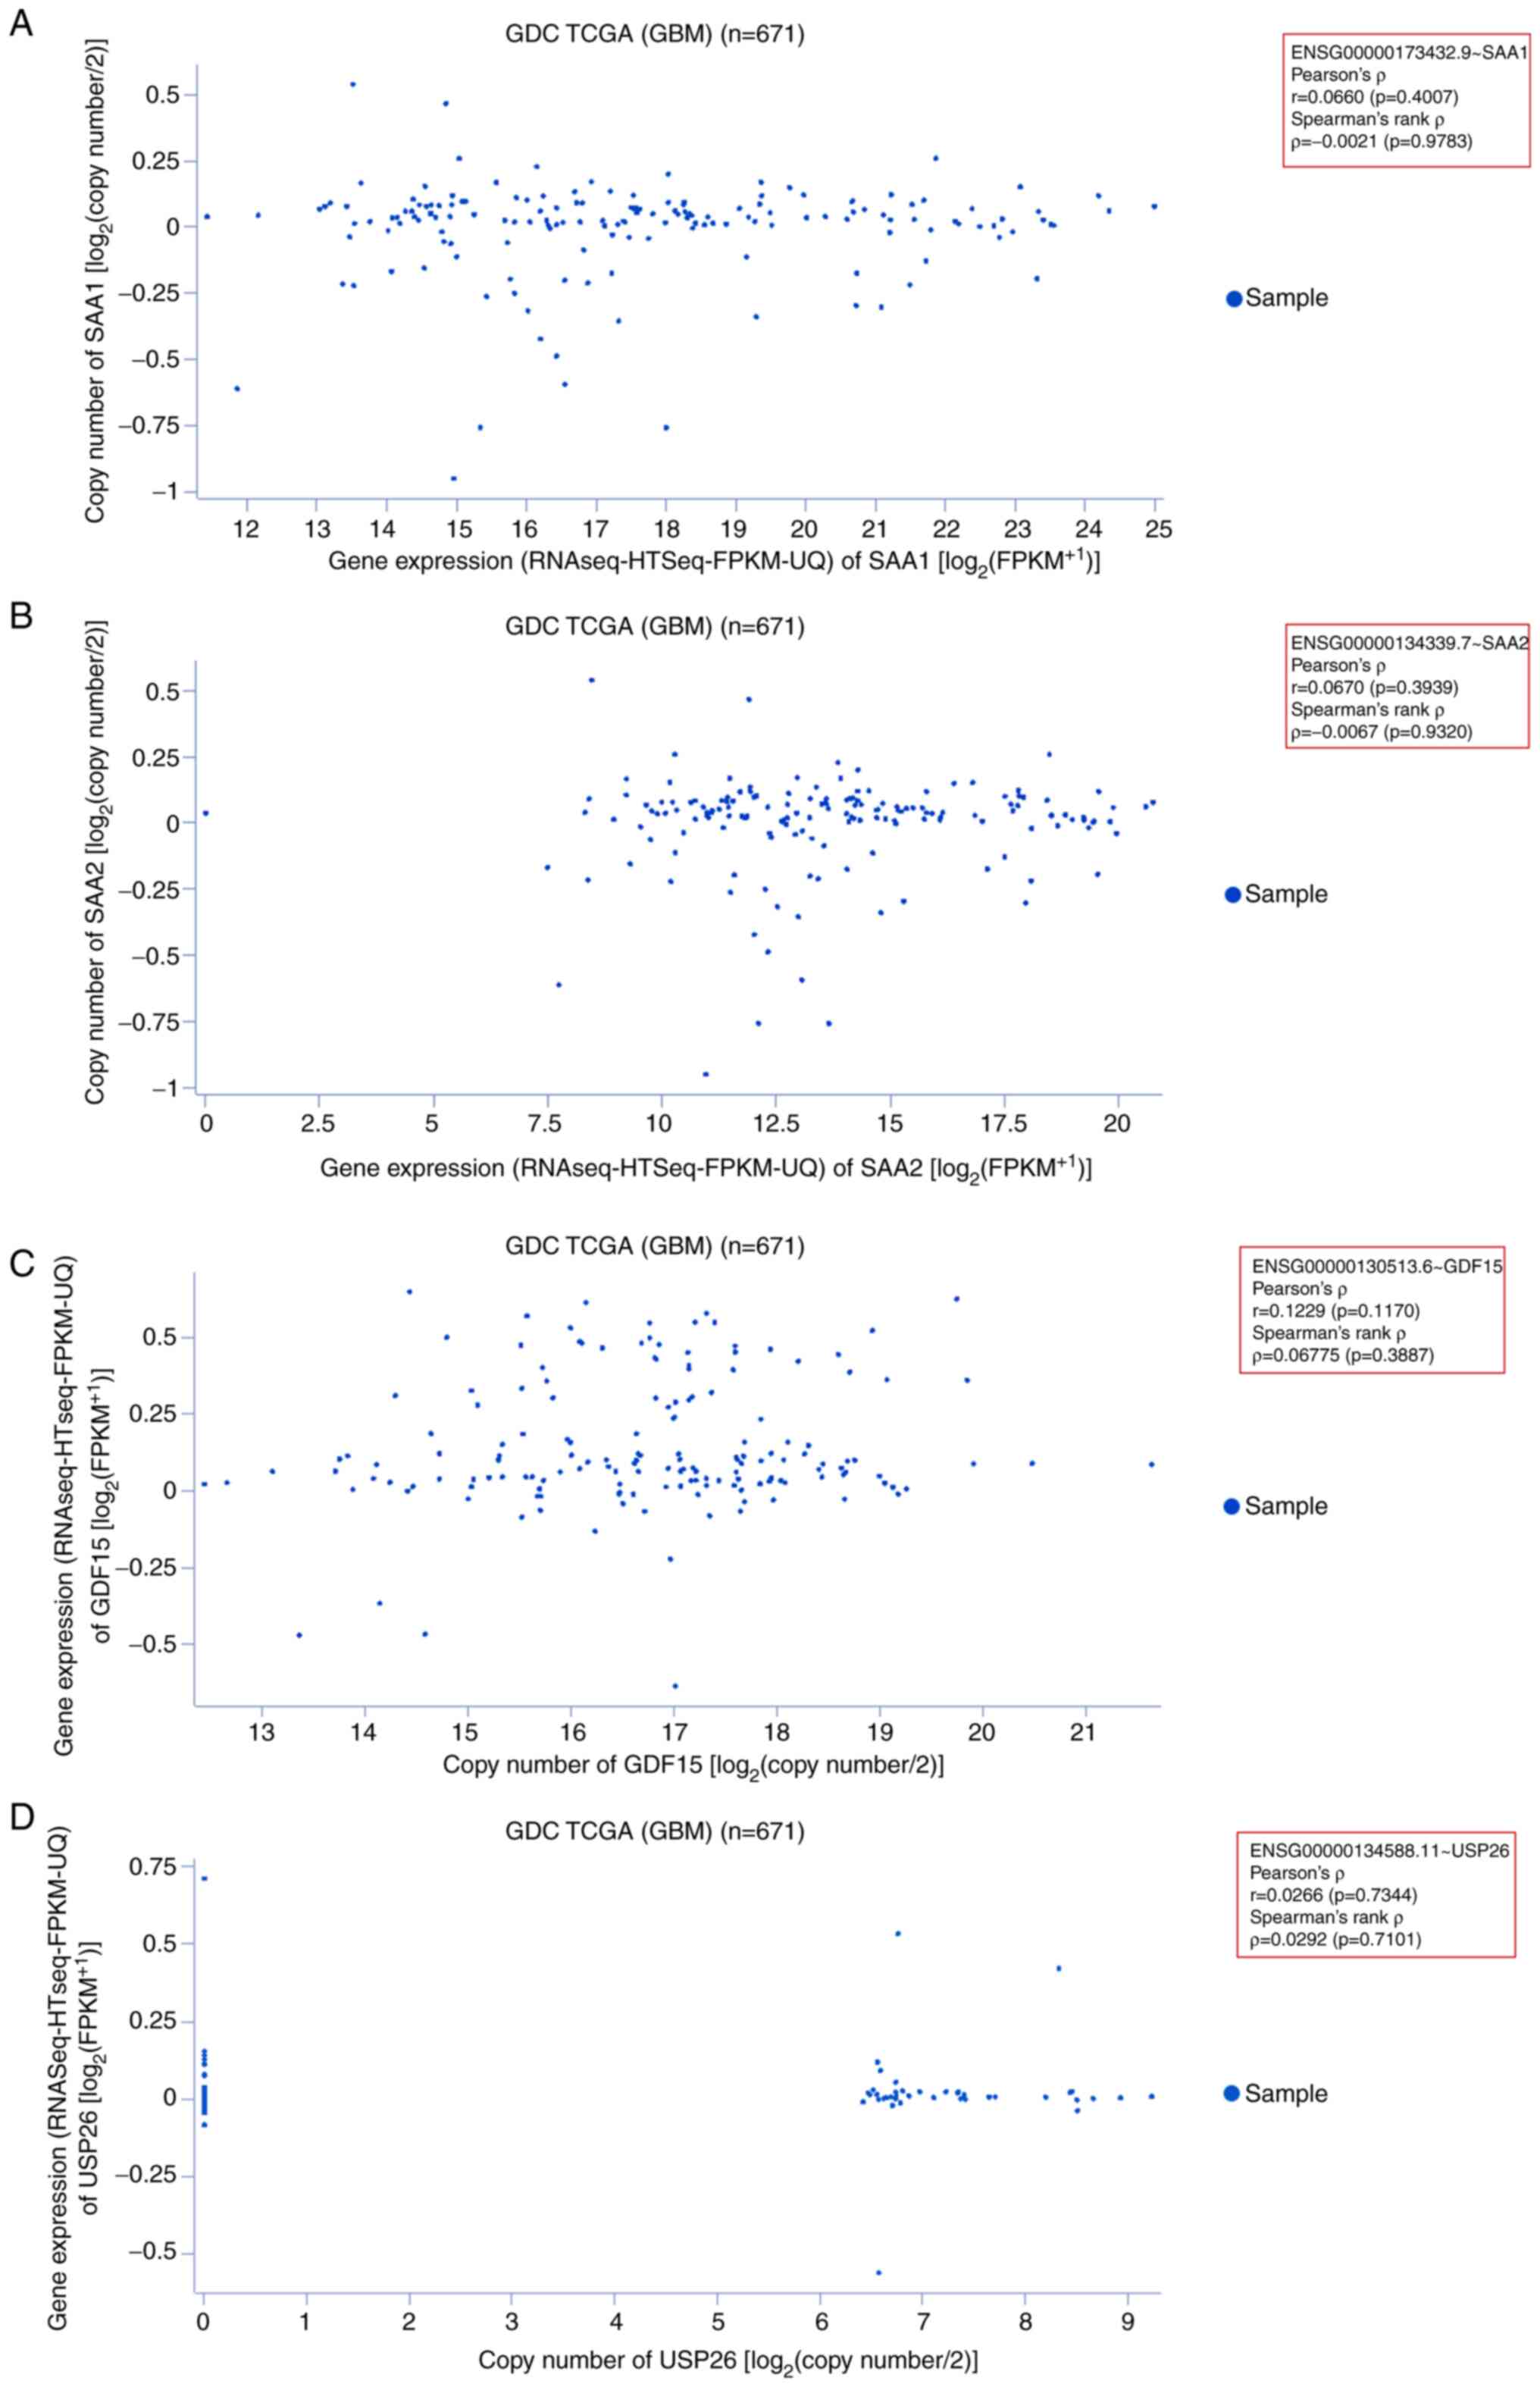
Gene expression pattern of upregulated
genes
The expression patterns of the upregulated genes
(SAA1, SAA2, GDF15 and USP26) were also identified
using 671 GDC TCGA GBM samples. First, the gene expression pattern
of SAA1 was assessed in GBM samples. The scatter plot
demonstrated that most sample data were plotted along the x-axis
(0–14; RNAseq-Htseq-FPKM-UQ data). The plotted data revealed
Pearson's ρ=0.06606 (P=0.4007) and Spearman's rank ρ=−0.002141
(P=0.9783; Fig. 8A). Second, the
gene expression pattern of SAA2 was assessed in GBM samples.
The scatter plot demonstrated that most of the sample data were
plotted within 7.5–20 on the x-axis (RNAseq-Htseq-FPKM-UQ data).
The plotted data revealed Pearson's ρ=0.06701 (P=0.3939) and
Spearman's rank ρ=−0.006710 (P=0.9320; Fig. 8B). Third, the gene expression
pattern of GDF15 was assessed in GBM samples. A scatter plot
was constructed from the analysis, which indicated that most sample
data points were plotted within 12–20 on the x-axis. The samples
were also scattered. The plotted data revealed Pearson's ρ=0.1229
(P=0.1170) and Spearman's rank ρ=0.06775 (P=0.3887; Fig. 8C). Finally, the gene expression
patterns of USP26 were determined using the same
aforementioned samples. The scatter plot illustrated that there
were fewer of these gene samples than the others, and the sample
data were plotted within 6–9 on the x-axis. The plot revealed
Pearson's ρ=0.02669 (P=0.7344) and Spearman's rank ρ=0.02925
(P=0.7101; Fig. 8D).
Establishing a PPI network and cluster
analysis using all upregulated and downregulated genes
The physical and functional relationships between
the proteins of the upregulated and downregulated genes were
assessed. Several in silico analyses were performed to
understand the characteristics of upregulated and downregulated
protein coding genes by establishing a PPI network. The
interactions within the PPI network of downregulated protein-coding
genes (TIE1, CACNA2D1, CAPN6 and ADAMTS6) were
depicted using Cytoscape (Fig.
9A-D), which demonstrated that other proteins were associated
with this network. In the PPI network for downregulated genes, the
nodes denoting the proteins participated in the interactions which
denote the protein coding genes. The edge of the network, which is
part of the PPI network of two nodes, was also noted and shows the
interactions between the two proteins. The maximum number of nodes
in the PPI network was observed for ADAMTS6 (n=23) and
TIE1 (n=23). The lowest number of nodes was observed in the
PPI network of CACNA2D1 (n=16). The maximum number of edges
in the PPI network was observed for CACNA2D1 (n=101), and
the minimum number of edges was observed for CAPN6 (n=41;
Table SI). The results of the
present study indicated that the PPI networks of TIE1,
CACNA2D1, CAPN6 and ADAMTS6 showed interactions between
6, 14, 7 and 2 partner proteins, respectively (Table SII). Simultaneously, a box plot was
generated using the numbers of nodes and edges, where the number of
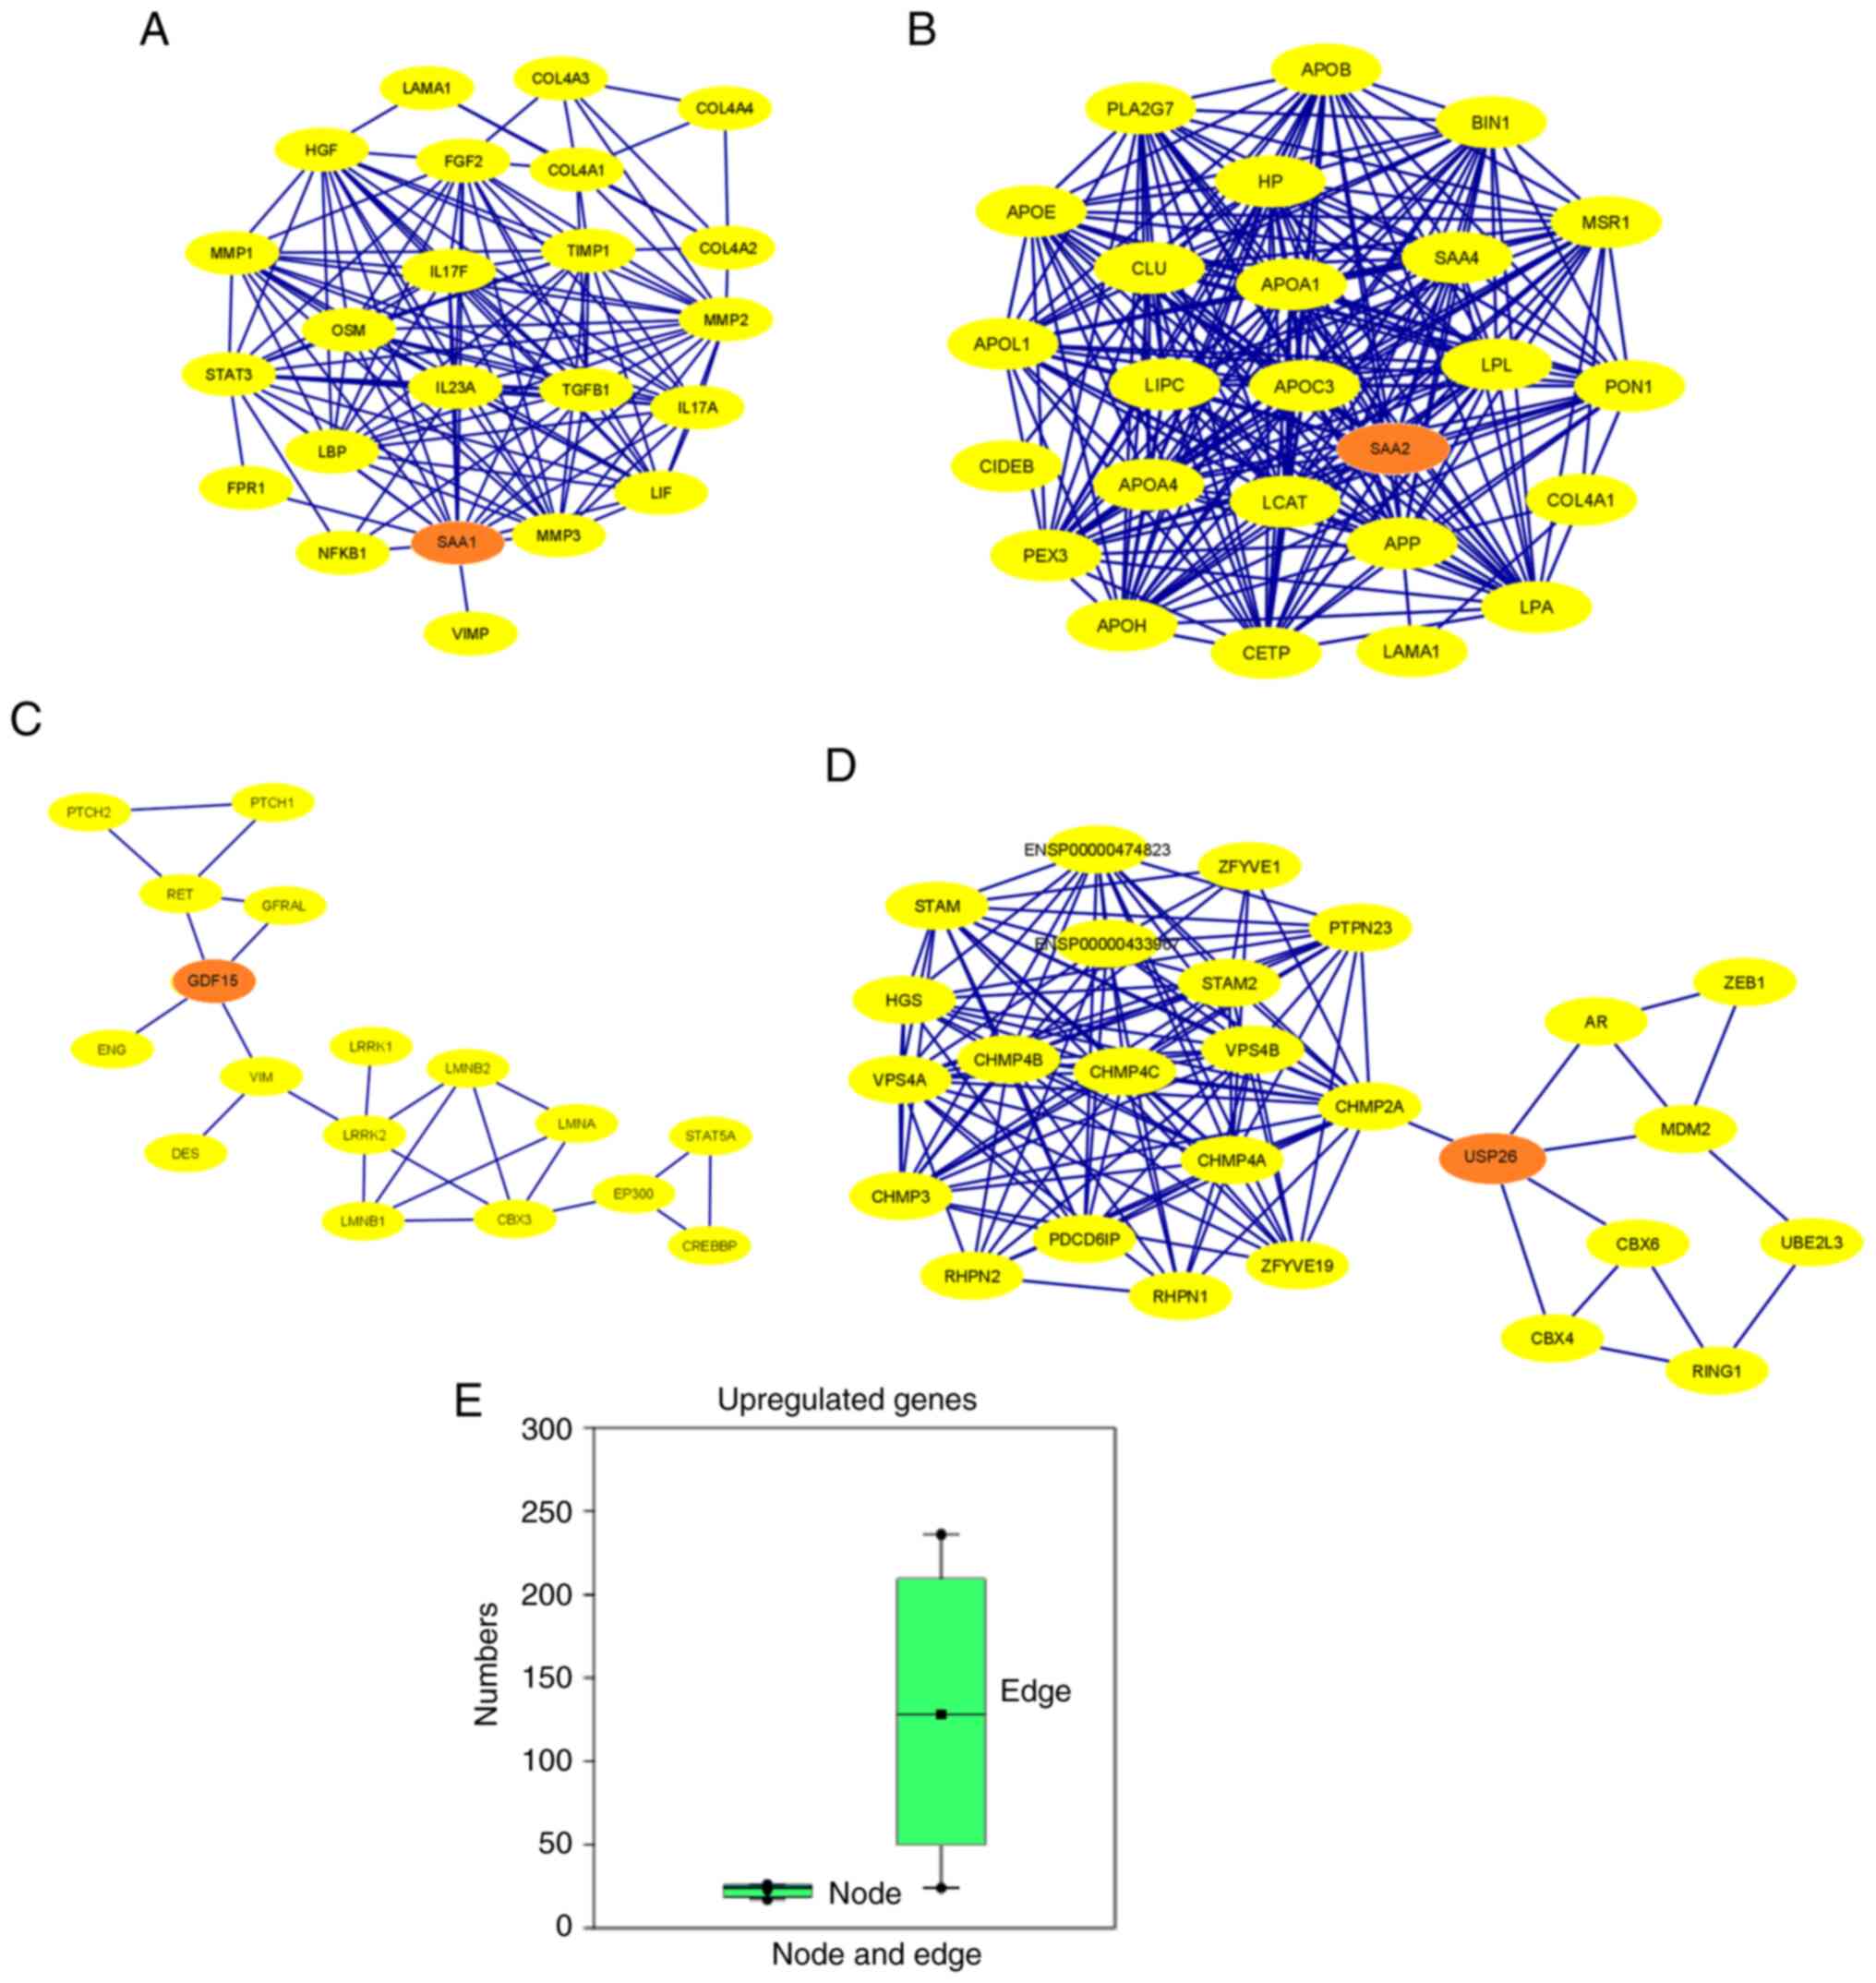
edges was markedly greater than that of the nodes (Fig. 9E). The protein clusters of the
downregulated genes assessed using the STRING server are also
presented in Fig. S3.
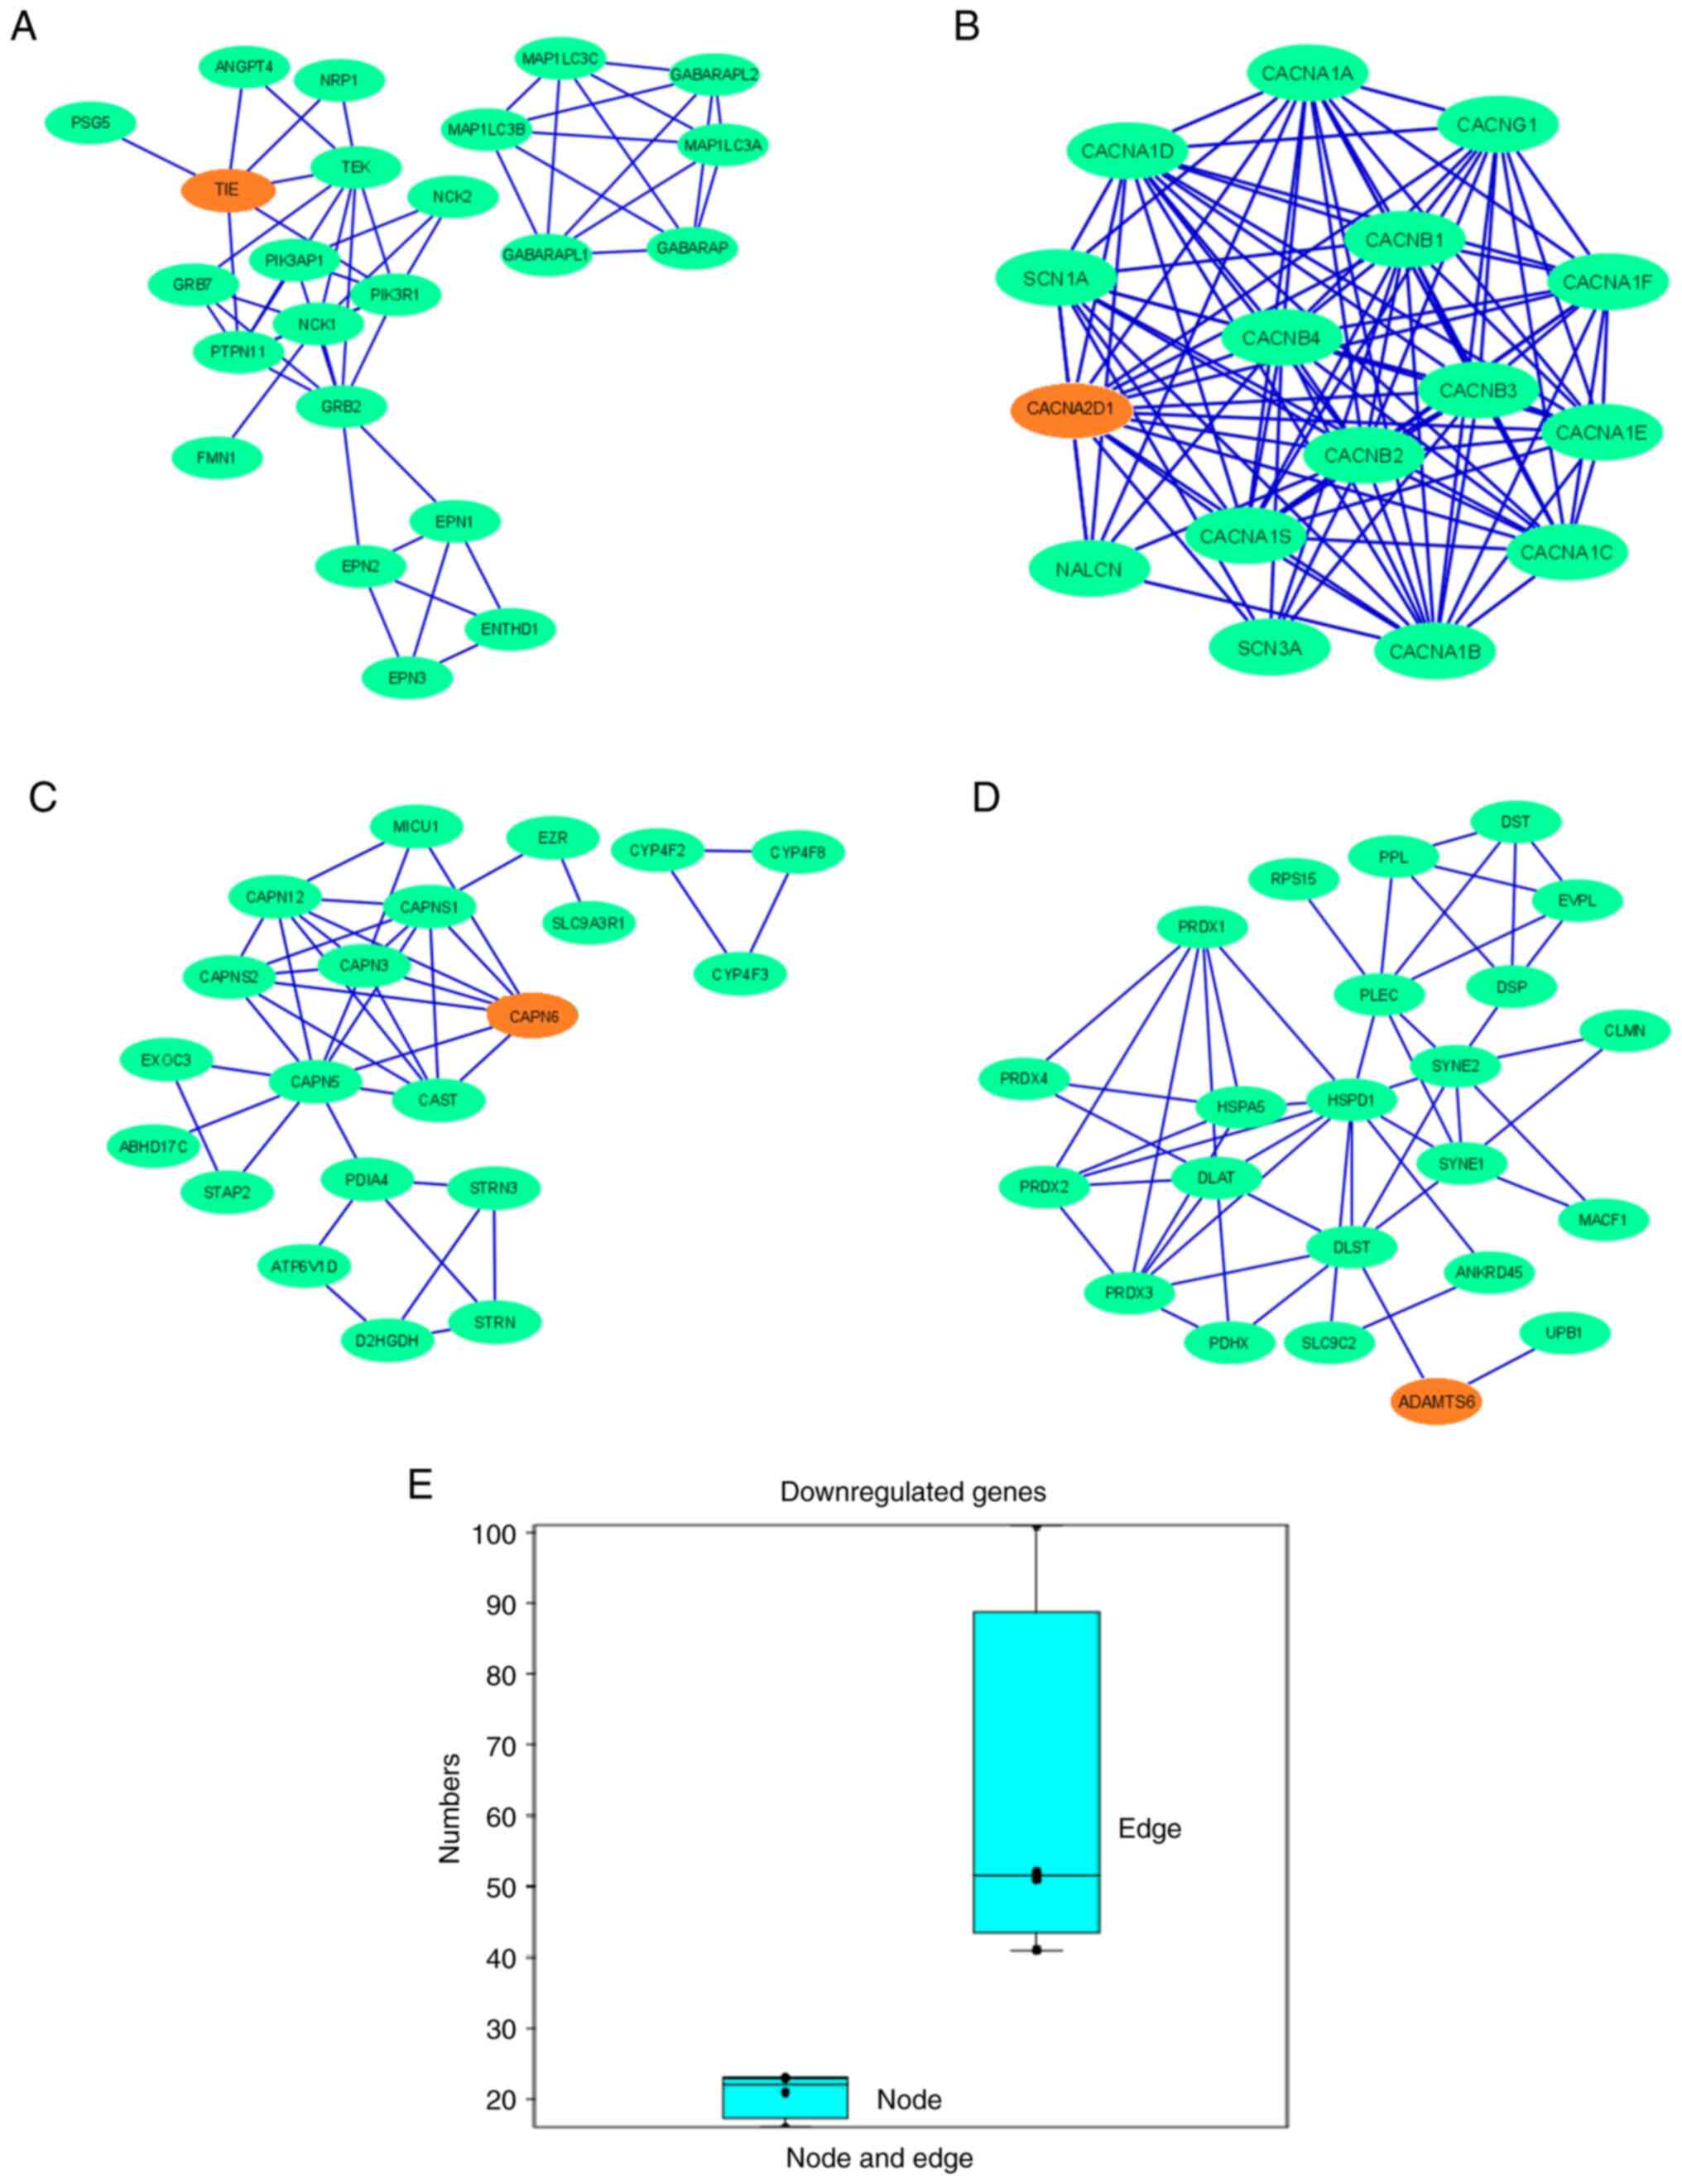 | Figure 9.PPI network demonstrates the PPIs of
the protein-coding downregulated genes depicted using Cytoscape.
Nodes are represented as green elliptical shapes. Edges are
represented by blue lines. PPI network demonstrates the PPIs of the
protein-coding gene (A) TIE1, showing two clusters in the
PPI networks. One main cluster has two sub-clusters, with one
demonstrating no interactions with the gene of interest. The PPI
network has 23 nodes and 52 edges; (B) CACNA2D1, showing one
cluster in the PPI networks. The PPI network has 16 nodes and 101
edges; (C) CAPN6, showing two clusters in the PPI networks.
One main cluster has two sub-clusters, with one demonstrating no
interactions with the gene of interest. The PPI network has 21
nodes and 41 edges; and (D) ADAMTS6, showing one cluster of
the PPI network. The PPI network has 23 nodes and 51 edges. (E) Box
plot representing the number of nodes and edges of all the
downregulated genes. PPI, protein-protein interaction; TIE1,
tyrosine kinase with immunoglobulin and epidermal growth factor
homology domains 1; CACNA2D1, calcium voltage-gated channel
auxiliary subunit α2Δ1; CAPN6, calpain 6; ADAMTS6, a disintegrin
and metalloproteinase with thrombospondin motifs 6. |
Furthermore, the PPI network proteins of the
upregulated genes were established (Fig. 10A-D). Several other proteins
associated with this network were also identified. In addition, the
maximum number of nodes in the PPI network was identified for
USP26 (n=26) and the minimum number of nodes for
GDF15 (n=17). Moreover, the maximum number of edges in the
PPI-network was reported for SAA2 (n=236) and the minimum
number of edges for GDF15 (n=24; Table SI). The results of the present
study indicated that the PPI network of SAA1, SAA2, GDF15
and USP26 showed interactions between 15, 21, 4 and 5
partner proteins, respectively (Table
SII). Simultaneously, a box plot was developed using the number
of nodes and edges (Fig. 10E). The
number of edges is higher than the number of nodes; however, the
range of the number of edges in the upregulated genes is greater
than that in the downregulated genes. Protein clusters of
downregulated genes identified using the STRING server are also
present (Fig. S4).
Establishing a PPI network using all
upregulated and downregulated genes as a whole
Finally, a PPI network was established using all
downregulated and upregulated genes as input samples (Fig. 11A). The PPI network contained 35
nodes and 241 edges (Table SI).
Furthermore, a bar diagram was generated to demonstrate the numbers
of nodes and edges assessed using a statistical model (Fig. 11B). For the polynomial statistical
model, the R2 value was 1.297.
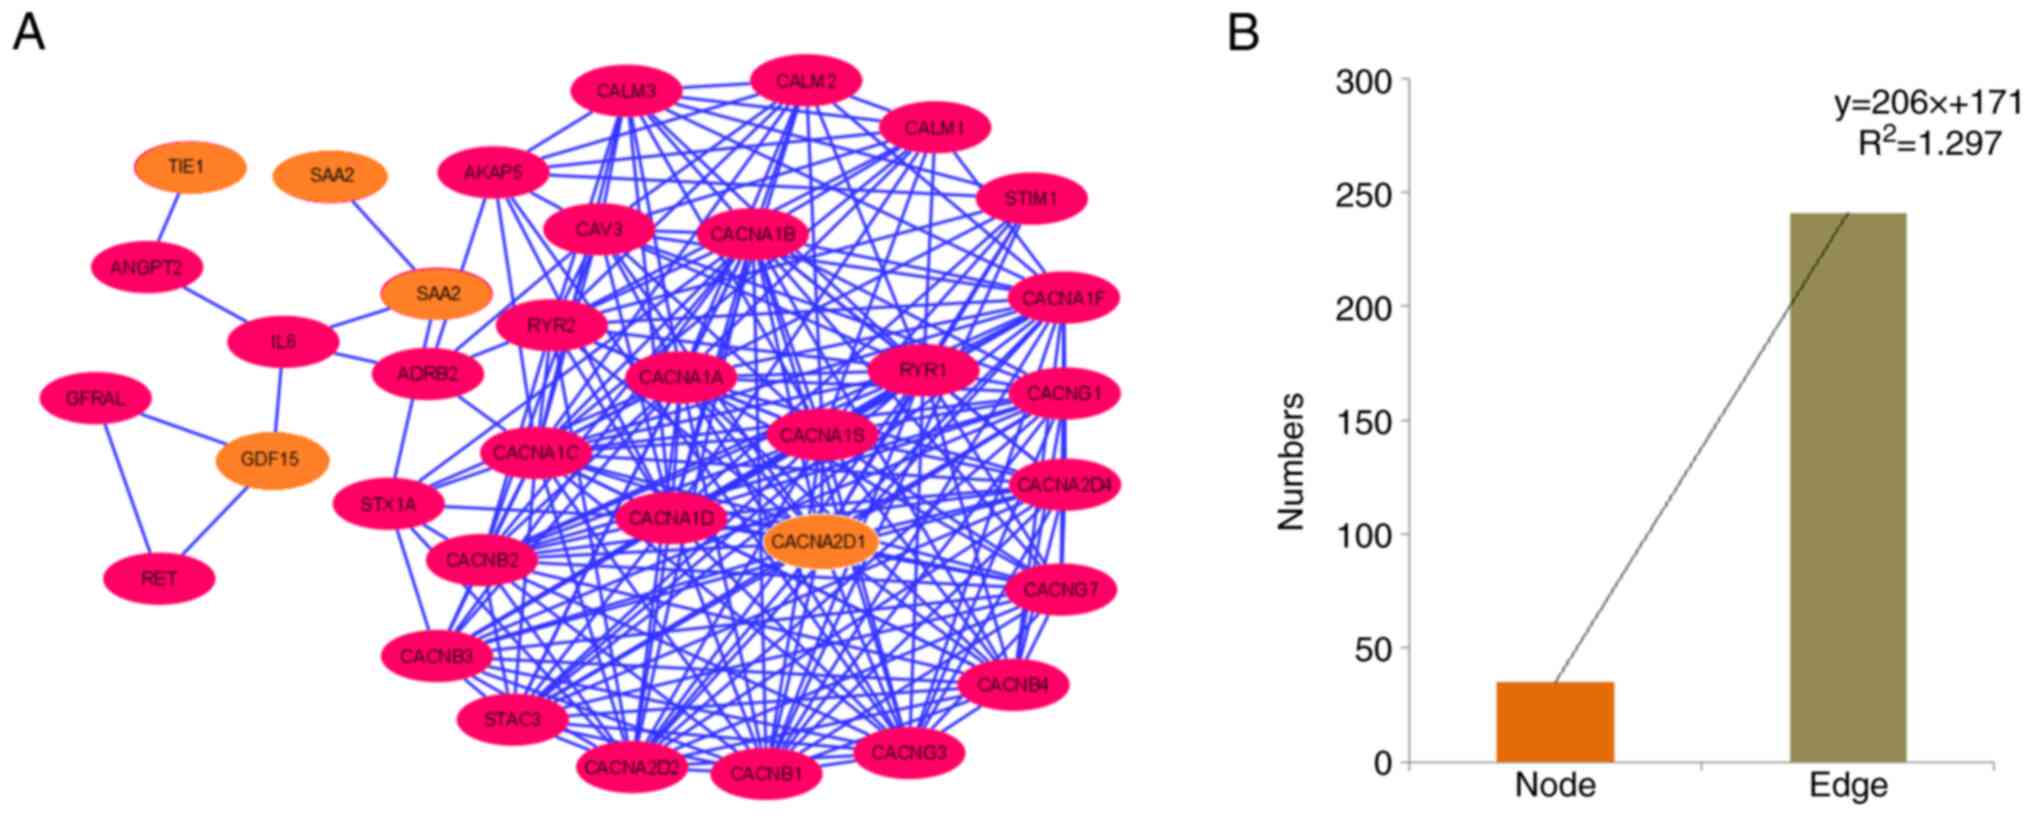 | Figure 11.PPI network of the protein-coding
downregulated and upregulated genes. (A) PPI network demonstrating
the PPI of protein-coding downregulated and upregulated genes
(TIE1, CACNA2D1, CAPN6, ADAMTS6, SAA2, GDF15, SAA1, and
USP26), depicted using Cytoscape. Nodes are represented as
pink elliptical shapes. Edges are represented as blue lines. A
total of one cluster is shown in the PPI network. The PPI network
has 35 nodes and 241 edges. (B) Bar diagram representing the number
of nodes and edges of the PPI network. PPI, protein-protein
interaction; TIE1, tyrosine kinase with immunoglobulin and
epidermal growth factor homology domains 1; CACNA2D1, calcium
voltage-gated channel auxiliary subunit α2Δ1; CAPN6, calpain 6;
ADAMTS6, a disintegrin and metalloproteinase with thrombospondin
motifs 6; SA, serum amyloid; GDF15, growth differentiation factor
15; USP26, ubiquitin specific peptidase 26. |
Co-expressed gene network and
hierarchical clustering
In the present study, a co-expressed gene network
was described. The Entrez Gene IDs of all downregulated and
upregulated genes were used as inputs or query genes (Table SIII). First, a plot of co-expressed
genes was constructed. This provided a global view of the
two-dimensional form of the network. The global co-expressed gene
plot demonstrated that only 4/8 query genes (TIE1, CAPN6,
SAA1 and GDF15) were involved in generating the
co-expressed gene plot (Fig. 12A).
Additionally, the co-expressed gene plot with the query and
co-expressed genes revealed that several co-expressed genes were
involved in co-expressed gene plot generation (Fig. 12B).
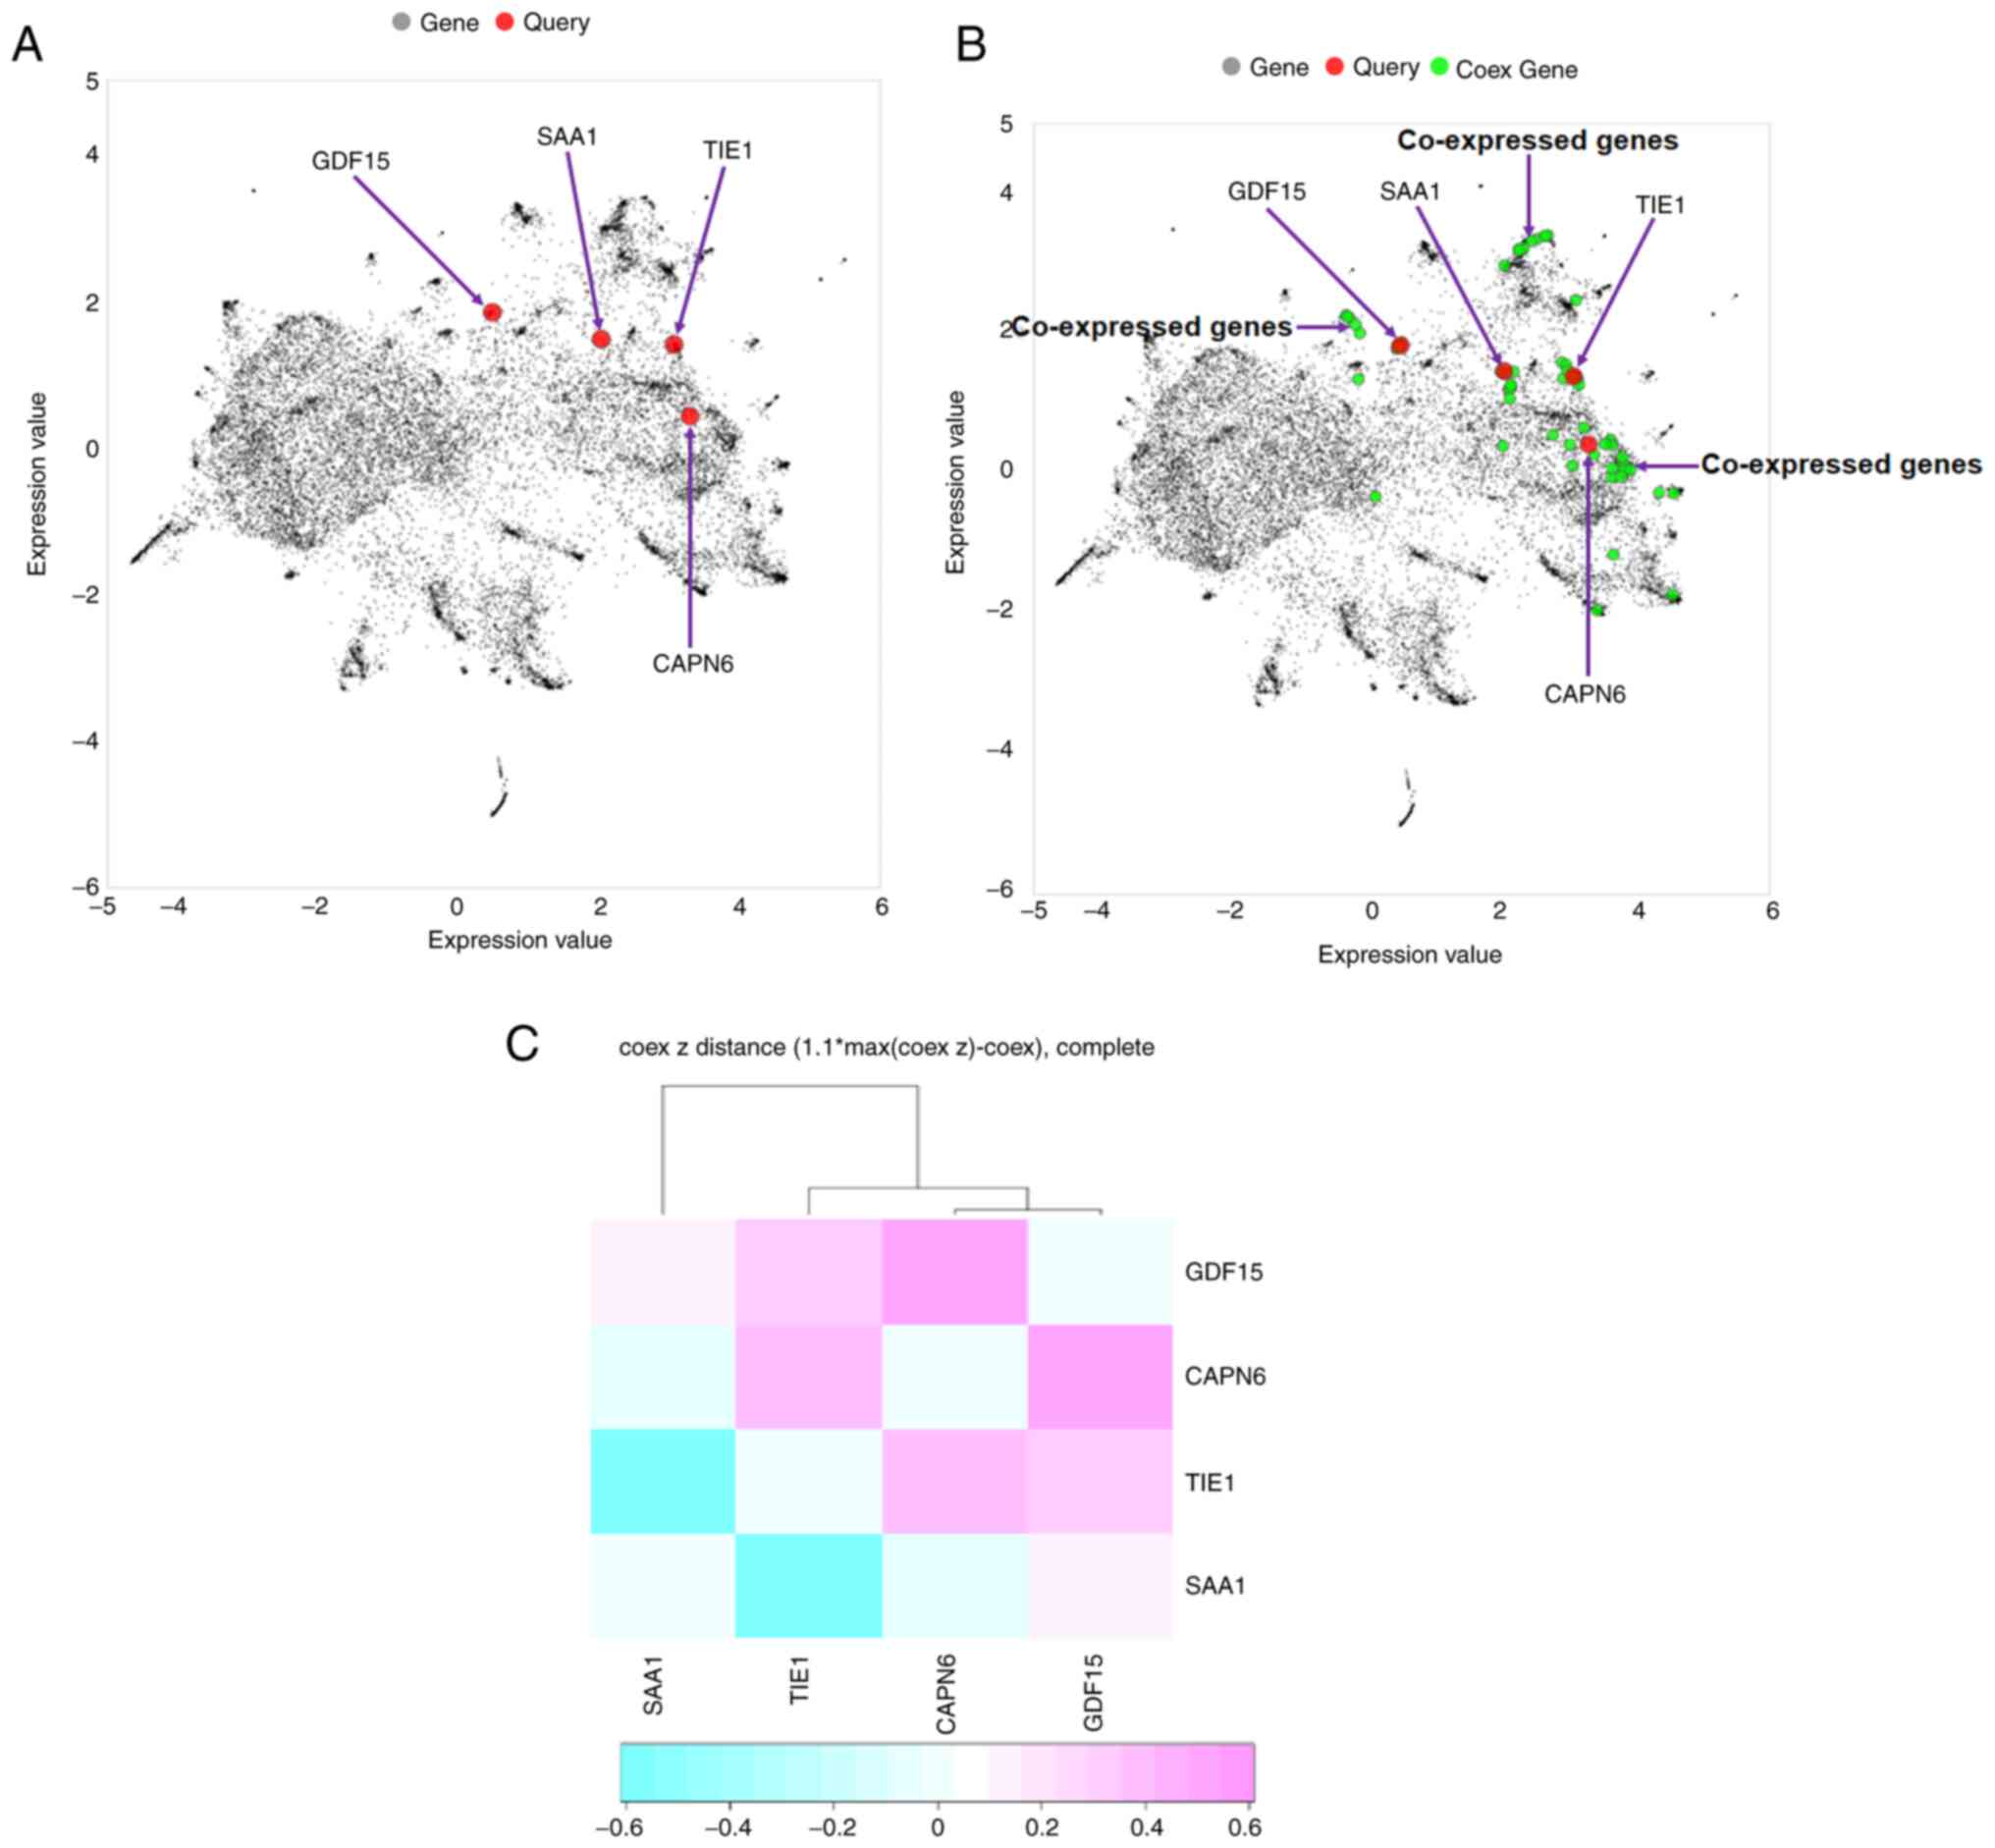 | Figure 12.Co-expressed gene plot and
hierarchical clustering. (A) Four query genes (TIE1, CAPN6,
SAA1 and GDF15) were found to be involved in generating
a co-expressed gene plot. (B) Co-expressed gene plot with query and
co-expressed genes. Several co-expressed genes were found in the
plot. (C) Hierarchical clustering of the co-expressed gene network
was developed using all downregulated and upregulated genes. The
genes (TIE1, CAPN6, SAA1 and GDF15) were found to be
involved in the generation of hierarchical clustering. The Entrez
Gene IDs of all downregulated and upregulated genes were used as
input or query genes (TIE1, CACNA2D1, CAPN6, ADAMTS6,
SAA1, SAA2, GDF15 and USP26). TIE1, tyrosine kinase with
immunoglobulin and epidermal growth factor homology domains 1;
CACNA2D1, calcium voltage-gated channel auxiliary subunit α2Δ1;
CAPN6, calpain 6; ADAMTS6, a disintegrin and metalloproteinase with
thrombospondin motifs 6; SA, serum amyloid; GDF15, growth
differentiation factor 15; USP26, ubiquitin specific peptidase 26;
Coex, co-expressed. |
Hierarchical clustering of a co-expressed gene
network of all downregulated and upregulated genes was performed.
Hierarchical clustering is represented by a heat map in Fig. 12C. Hierarchical clustering of the
co-expressed gene network revealed a cluster of four genes:
TIE1, CAPN6, SAA1 and GDF15. Among these, two genes
were upregulated and two were downregulated.
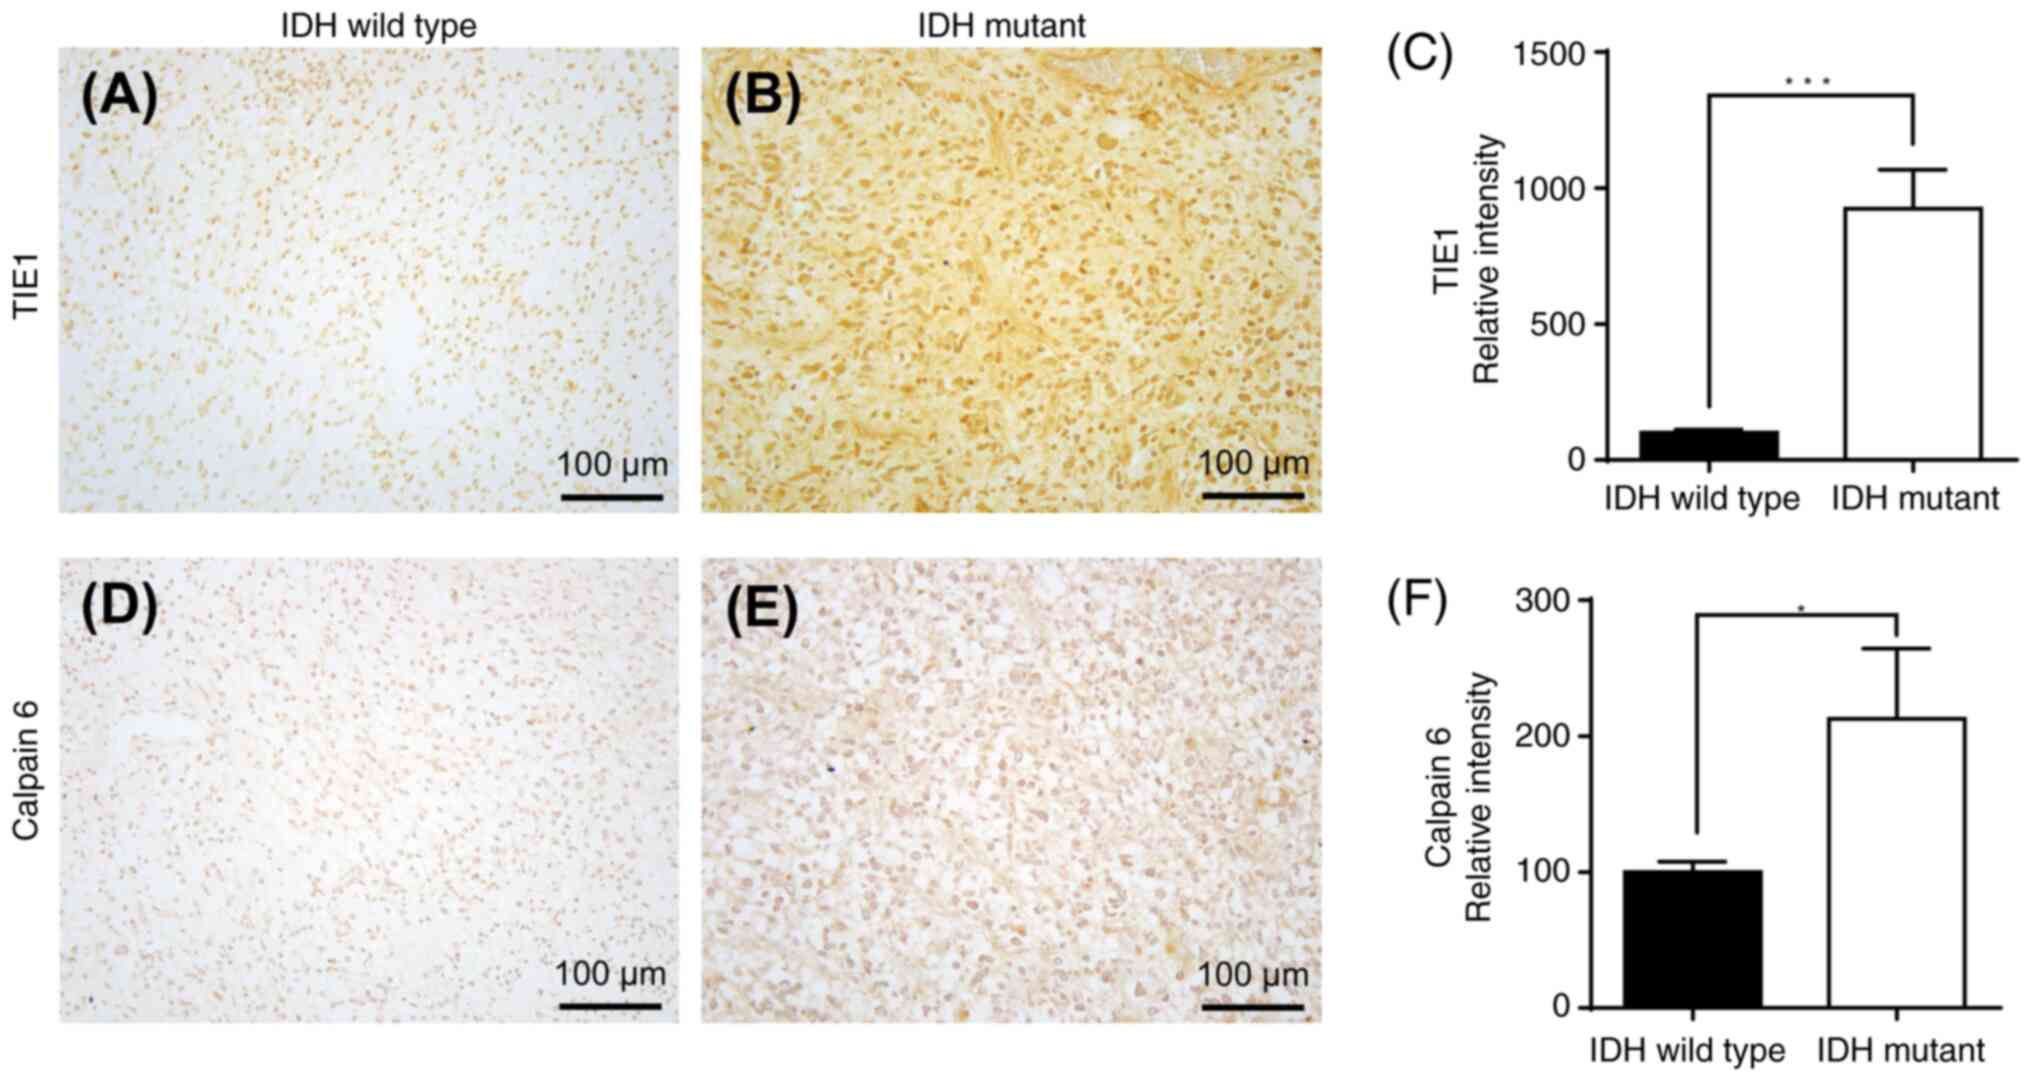
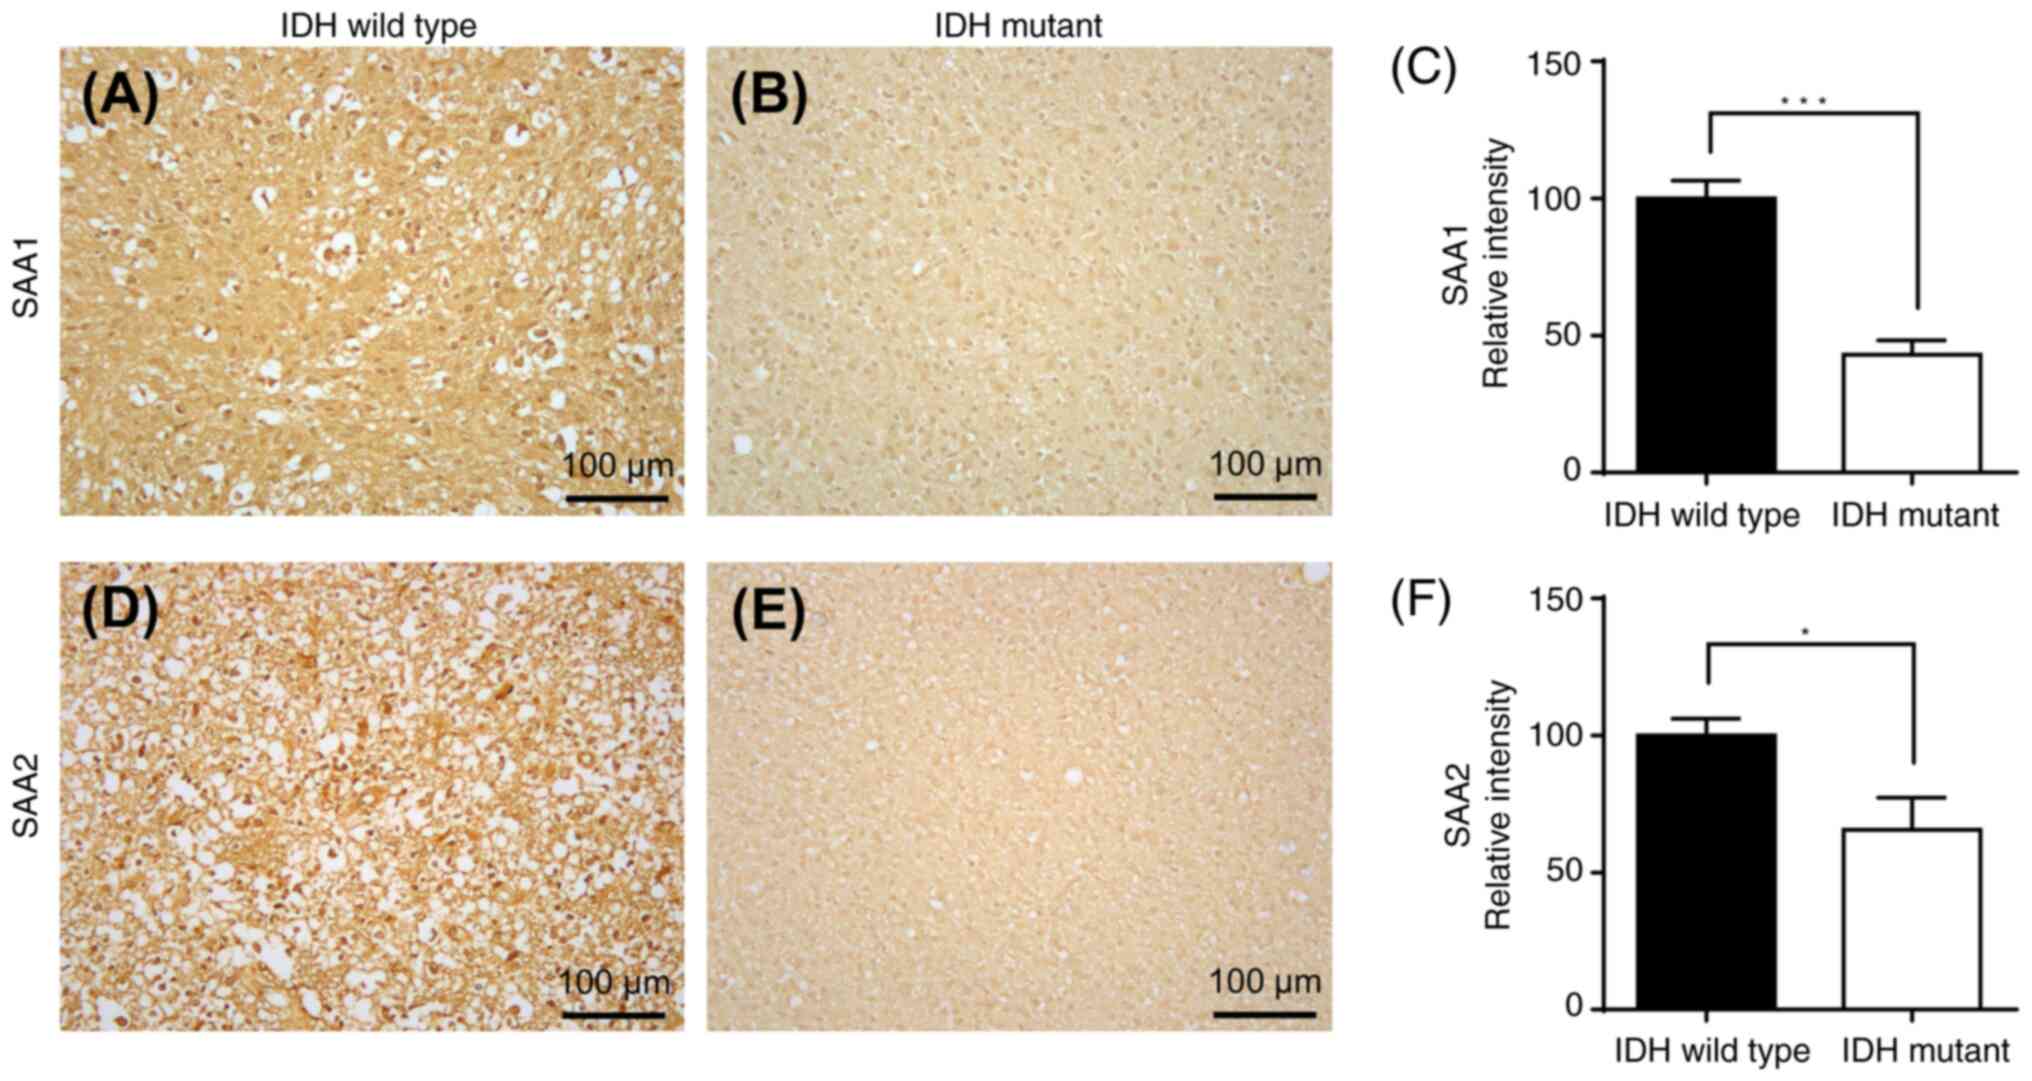
Immunohistochemical staining assay to
assess the upregulated and downregulated genes in IDH-wild type or
mutant samples and their associations
Immunohistochemical staining of GBM cells with
wild-type or mutant IDH was performed. Immunohistochemical staining
of IDH wild-type or IDH-mutant GBM samples with two downregulated
mRNA-encoded proteins (TIE1 and CAPN6) is presented in Fig. 13, and immunohistochemical staining
of IDH-wild-type or IDH-mutant GBM samples of two upregulated
mRNA-encoded proteins (SAA1 and SAA2) is demonstrated in Fig. 14. There was a significant
upregulation of TIE1 (P<0.001) and CAPN6 (P<0.05) protein
expression in IDH-mutant GBM compared with that in IDH wild-type
(Fig. 13). Furthermore, there was
a significant downregulation of SAA1 (P<0.001) and SAA2
(P<0.05) protein expression in IDH-mutant GBM compared with that
in IDH wild-type (Fig. 14).
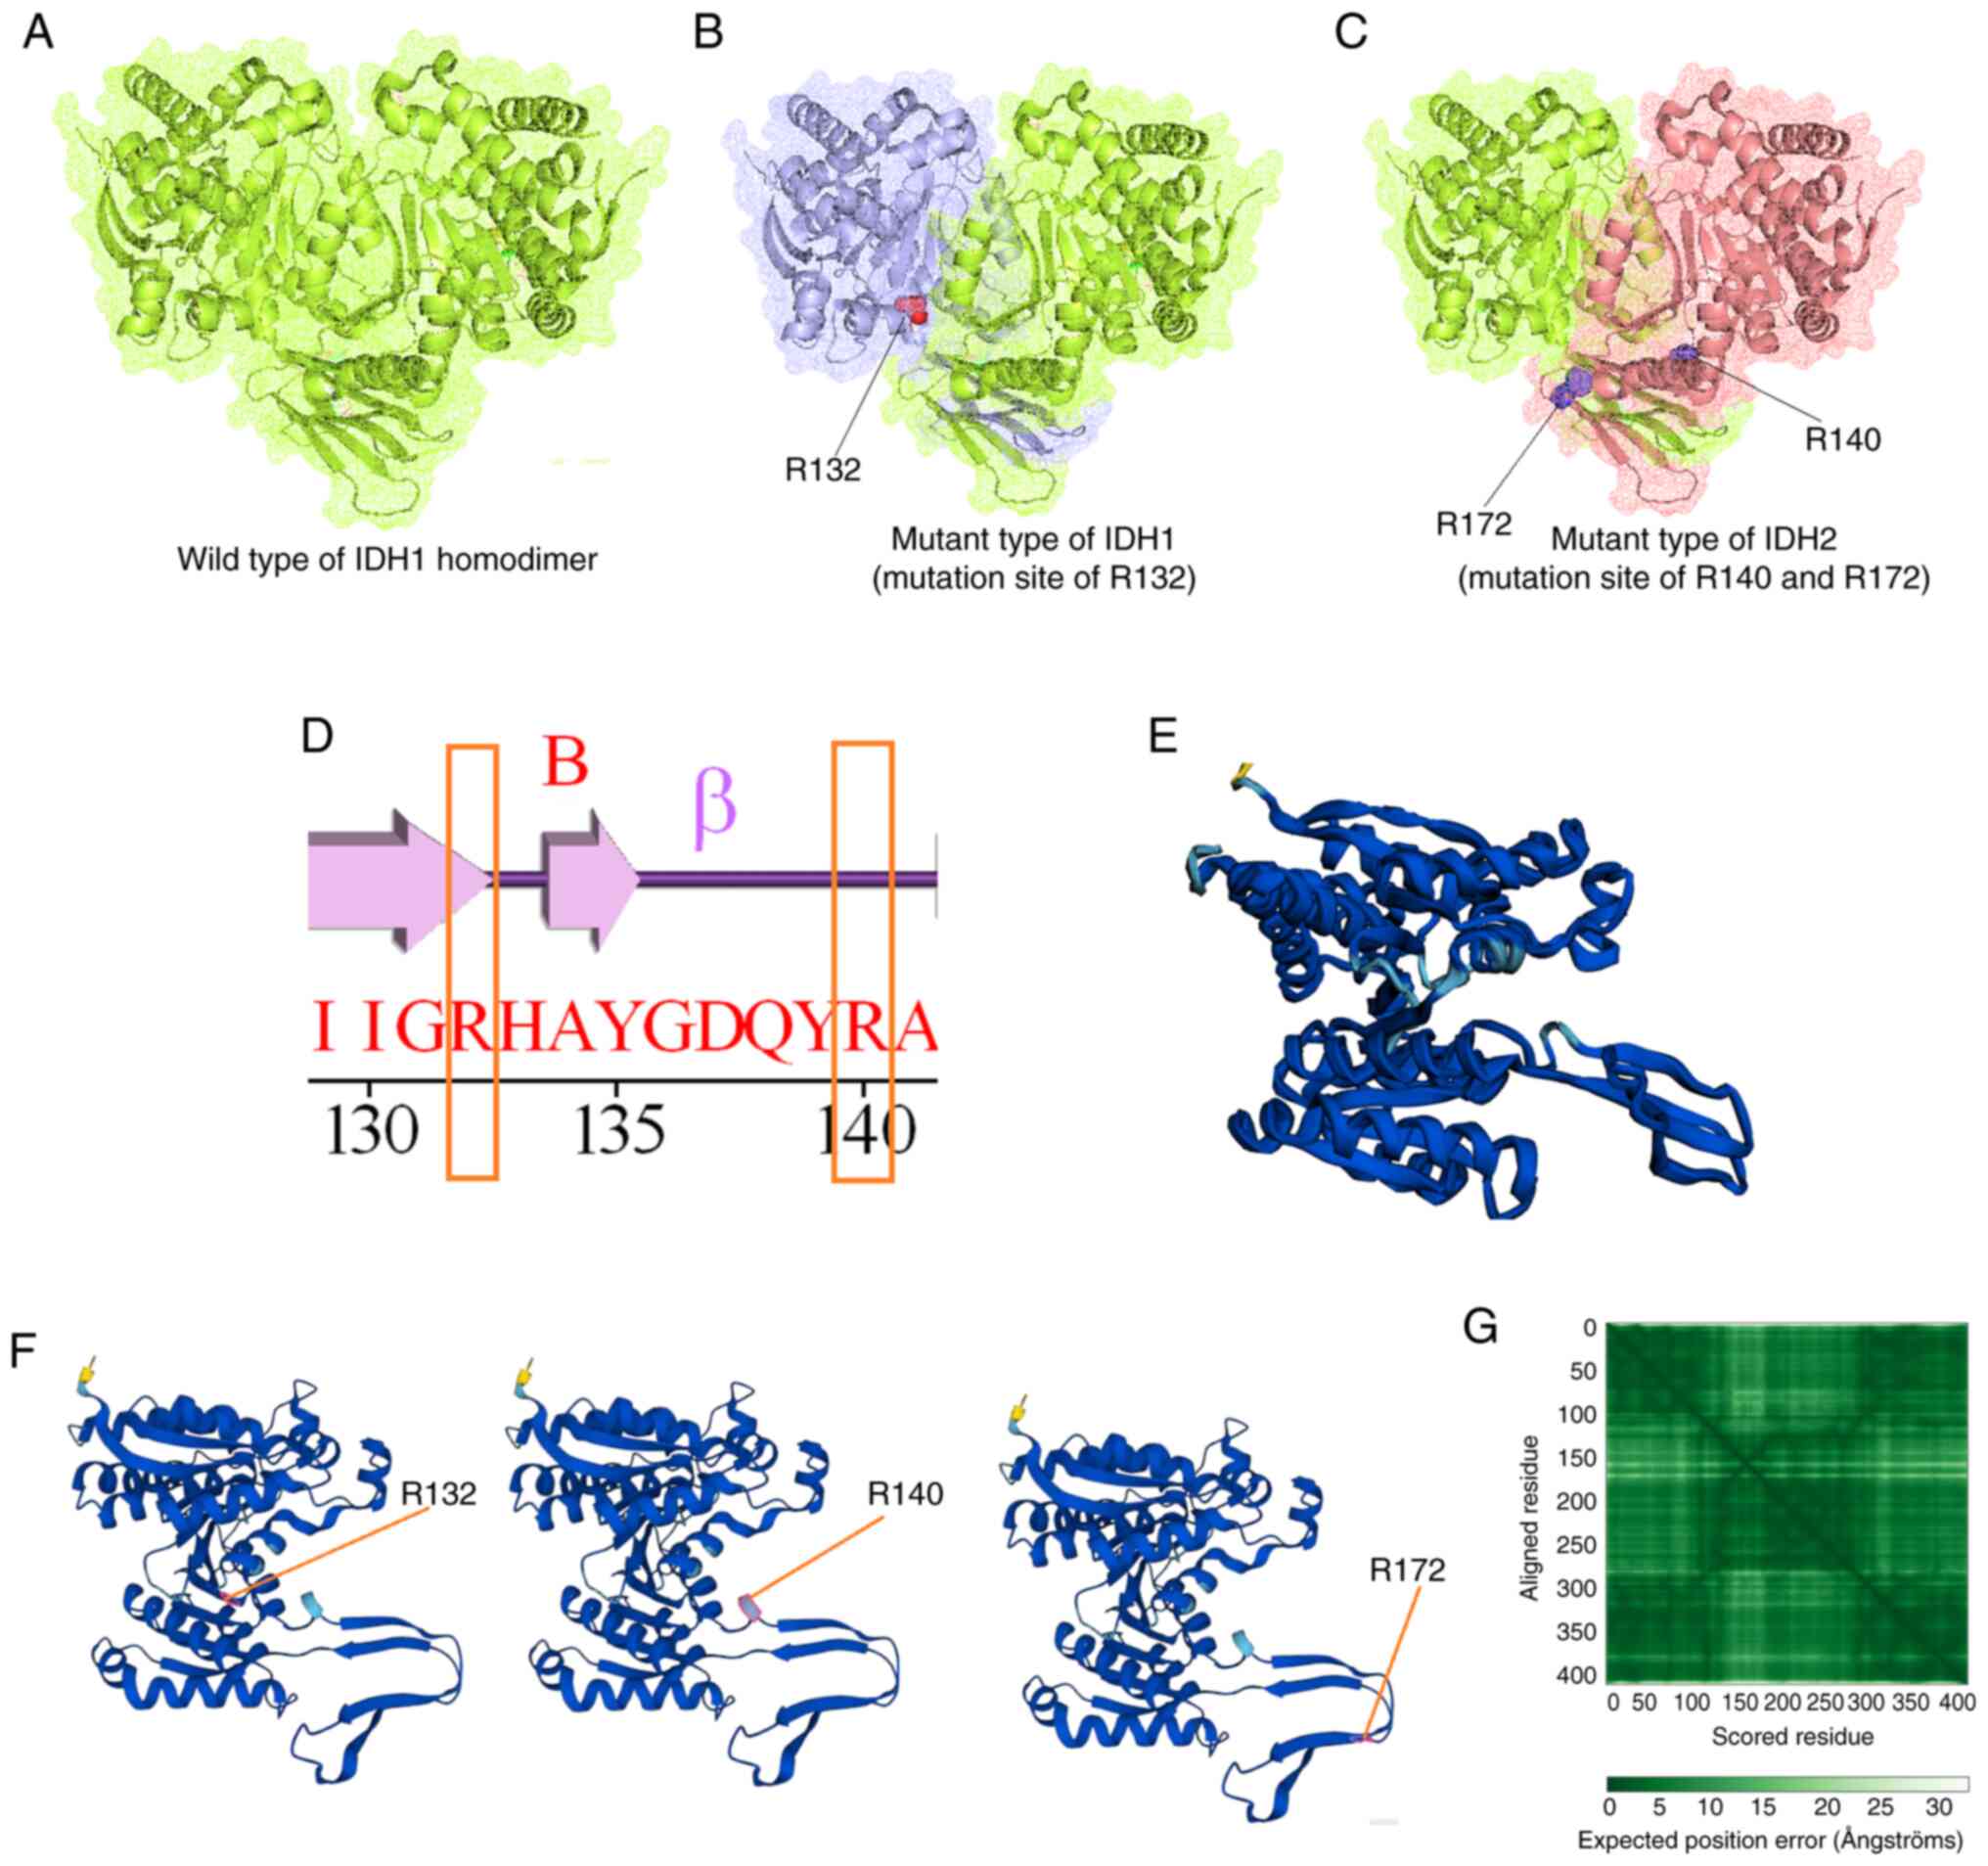
Mutational landscape of IDH in GBM
through in silico models
The present study demonstrated the mutational
landscape of IDH in GBM using in silico models. A total of
three types of structures were developed through the molecular
modeling of wild-type IDH: IDH1 with mutation position R132, and
IDH2 with mutation position R140 or R172. Fig. 15A presents the wild-type IDH1
homodimer; Fig. 15B demonstrates
the mutant-type IDH1, in which the mutated residue position R132
was identified; Fig. 15C
illustrates the mutant-type IDH2, with mutation residue positions
R140 or R172. Simultaneously, a secondary structural landscape of
IDH was demonstrated. The mutated residue positions were indicated
as R132 or R140 (Fig. 15D),
demonstrating the position of the mutations in the alpha helices or
beta sheets. In addition, a 3D structural model was developed using
AlphaFold (Fig. 15E).
Simultaneously, all three mutant residues (R132, R140 and R172)
were identified in the model (3D model of the AlphaFold; Fig. 15F). Furthermore, the performance of
the 3D structural model was validated using the aligned residues,
and an expected position error was noted (Fig. 15G). Model performance evaluation
using the aligned residues indicated that the model was
significant.
Finally, the role of IDH mutations in GBM was
illustrated (Fig. 16). The
wild-type heterodimer exhibited regular IDH activity and could
generate α-KG from isocitrate. The one-part mutant IDH heterodimer
(wild-type/R132H) could generate D-2HG from α-KG. However, both
one-part mutant types of the IDH heterodimer were inactive against
IDH. Furthermore, IDH mutations were acquired by IDH, which
resulted in considerable metabolic reprogramming. Neomorphic
activity may diminish the Krebs cycle by draining α-KG for D-2-HG
production. However, further studies are needed to confirm this
hypothesis.
Discussion
In the present study, experimental and in
silico analyses were performed to assess the upregulated and
downregulated genes in a GBM8401 resistant strain to fulfill two
objectives: i) To establish the downregulated and upregulated genes
and their profiles (characterized dysregulation); and ii) to
understand the mutational landscape of IDH in GBM. To fulfill the
first objective, both experimental and in silico analyses
were used to evaluate the genes downregulated (TIE1, CACNA2D1,
CAPN6 and ADAMTS6) and upregulated (SAA1, SAA2,
GDF15 and USP26). First, the gene expression of
TMZ-resistant GBM8401 cells was analyzed using NGS, and RNA
expression profiles were assessed to determine the downregulated
and upregulated genes. Meta-Z analysis was also performed using
PRECOG to identify all the upregulated and downregulated genes in
TMZ-resistant GBM. KM survival analysis, in silico gene
expression pattern identification, PPI network establishment,
cluster analysis of the co-expressed gene network, and hierarchical
clustering of all upregulated and downregulated genes were
performed. To fulfill the second objective, an immunohistochemical
staining assay of high-grade GBM tissue with wild-type or mutant
IDH from patient samples was performed. Finally, based on NGS
analysis and qPCR data in TMZ-resistant GBM8401 cells, IDH-mutant
GBM was compared with IDH wild-type GBM in terms of upregulated and
downregulated genes. For comparison, two upregulated (SAA1
and SAA2) and two downregulated genes (TIE1 and
CAPN6) were selected. The relative intensities of the
expressed genes were determined in wild-type and mutant IDH cells.
Finally, using in silico models, the present study
illustrated the mutational landscape of IDH in GBM. Therefore,
comprehensive, in-depth and step-by-step analyses were performed to
elucidate the gene expression profile and pattern in
GBM8401-resistant cells and the mutational landscape of IDH in
GBM.
Chemotherapy resistance is a major global concern,
with >90% of cancer-related deaths associated with MDR (50). Studies have focused on analyzing the
gene expression patterns in chemotherapy-resistant cancers and the
identification of differentially upregulated and downregulated
genes in different cancers is a priority. For example, Rapin et
al (51) compared the gene
expression profiles of patients with acute myeloid leukemia, and
recently, Cheng et al (52)
investigated upregulated and downregulated genes in TMZ-resistant
GBM cells. In the present study, upregulated and downregulated
genes in TMZ-resistant GBM samples from hospitalized patients
(TMZ-resistant GBM8401 cells) were analyzed. Therefore, the
findings of the present study are important from the perspective of
chemoresistance.
Several researchers have used methods similar to
those used in the present study to map gene expression in different
types of cancer (53,54). In the present study, different in
silico methods were used to understand the gene expression
patterns in different types of brain cancer using the PRECOG
server, and the Z-scores of the downregulated and upregulated genes
were calculated. However, in addition to GBM, meta-Z analysis was
performed for different types of brain cancers, such as
astrocytoma, glioma, medulloblastoma, meningioma and neuroblastoma,
for all upregulated and downregulated genes. The results of the
present study provide further understanding of the prognostic
landscape of genes in all human cancers. In addition, KM survival
analysis was performed for different brain cancer types along with
GBM. The observations from the analyses performed in the present
study provide further understanding of the survival of patients
with brain tumors.
Kothari et al (55) applied the PRECOG method to evaluate
the Z-scores of genes in triple-negative breast cancer, which were
analyzed using machine learning. Gentles et al (33) applied the PRECOG method to
pan-cancer gene signatures related to cancer-associated
fibroblasts. The present study attempted to identify the
therapeutic targets. A PPI network was developed and cluster
analysis was performed using the STRING server and Cytoscape
software to depict the network between genes. Kumar et al
(56) used the STRING server and
Cytoscape software to develop a network of genes associated with
ovarian cancer. Chakraborty et al (57) used the STRING server and Cytoscape
software to map and create a network of immune protective genes
against severe acute respiratory syndrome-coronavirus 2 infection.
Similarly, studies have used the COXPRESdb server to develop a
co-expression gene network and construct a hierarchical cluster of
differentially expressed genes in monkeypox-infected MK2 cells and
damaged osteoarthritis cartilage (58,59).
In the present study, several bioinformatics methods and servers
(PRECOG, COXPRESdb and STRING) were used to assess gene expression
and networks in TMZ-resistant GBM8401 cells. However, one of the
limitations of COXPRESdb is that it does not have a feature for
searching negative correlations of co-expression, resulting in only
positive correlations in the co-expression analysis. In a PPI
network, edges symbolize interactions between proteins and nodes
symbolize proteins (60). According
to the graph theory, the topological structure of a PPI network
provides direct and preliminary information related to the network
and its biological functions (60,61).
The PPI network provides information on different factors, such as
genetic cues and signaling circuits. It improves the understanding
of circuitry to predict the function of genes and cellular
behaviors associated with different signals (62). The present study therefore provides
a preliminary understanding of the PPI networks in TMZ-resistant
GBM cells; however, to further understand these factors, a broader
and more specific study of the PPI network in TMZ-resistant GBM is
necessary. Future studies should focus on these topics.
The present study evaluated the upregulated and
downregulated genes in wild-type and mutant IDH samples from
TMZ-resistant GBM8401 cells. Previous studies have mainly focused
on TMZ resistance in IDH wild-type GBM (63–65)
and O6-methylguanine-DNA-methyltransferase (66). There is a higher incidence of
TMZ-induced hypermutations in IDH-mutant gliomas than in IDH
wild-type gliomas (67,68). Exogenously expressed mutant IDH
increases TMZ resistance in glioma cells (69). Sun and Turcan (23) also suggested that TMZ treatment may
exacerbate IDH mutations in GBM. However, previous studies have not
elucidated the possible mechanisms of IDH mutations that contribute
to TMZ resistance in GBM, to the best of our knowledge.
TIE1 is an angiopoietin receptor with
immunoglobulin and EGF-like domains 1, and the TIE1 protein is a
cell surface protein expressed in endothelial cells (70); however, it is also expressed in
immature hematopoietic cells and platelets (71). TIE1 has an inflammatory
effect and may serve a role in mechanotransduction,
neovascularization and inflammation. It serves an important role in
the development of atherosclerosis (72) and a significant pathophysiological
role in the development of several cancers. Therefore, the orphan
receptor TIE1 is a drug target for inhibiting cancer
angiogenesis and migration (73).
Therefore, it is necessary to understand TIE1 gene
expression patterns in gliomas and GBMs. CACNA2D1 encodes
calcium voltage-gated channel auxiliary subunit α2/Δ1 protein
(calcium channel α2δ1 subunit), a membrane protein associated with
the voltage-gated calcium channel complex. It serves a role in the
influx of calcium ions into calcium channels (74). The CACNA2D1 protein is the molecular
target of the gabapentinoid group of molecules, including
gabapentin and pregabalin. Gabapentin is a class of anticonvulsant
molecules used to treat epilepsy, particularly drug-resistant focal
epilepsy (75). Pregabalin is used
for the treatment of diabetic neuropathic pain in adults. It is
also used to treat neuropathic pain, such as cancer and
chemotherapy-induced postherpetic neuralgia, fibromyalgia and
diabetic neuropathy (76–78). Understanding CACNA2D1 gene
expression patterns in gliomas, GBMs and other brain tumors is
therefore essential. The CAPN6 gene is encodes the calpain
protein. This gene helps in microtubule stabilization and is
associated with cytoskeletal organization and regulation of
microtubule dynamics (79). The
protein belongs to a family of calcium-dependent cysteine proteases
that is well conserved in nature (80). CAPN6 may also serve a role in tumor
formation by inhibiting apoptosis and promoting angiogenesis
(81). Therefore, CAPN6 gene
expression patterns should be studied in GBM and other brain
tumors. ADAMTS6 encodes ADAM metallopeptidase with six
thrombospondin type 1 motif proteins, which are members of the
ADAMTS protein family (82).
Researchers have reported that cytokine TNF-α may regulate the
expression of a gene, which may be ADAMTS6. Similarly, it
has been reported that ADAMTS6 restrains tumor development
through the ERK signaling pathway (83); however, further studies are required
to understand the ADAMTS6 gene in GBM and its
resistance.
SAA1 and SAA2 are two significant and
highly homologous genes (84,85).
The SAA1 gene encodes the SAA1 protein, which is considered
to be an ‘acute response protein’. This gene is expressed in
hepatocytes, amnion fibroblasts, the epithelium of the amnion and
trophoblasts of the chorion (86)
and is expressed in tissue injury, infection, chronic inflammation
and cancers such as renal cancer (87,88).
SAA1 expression patterns should be studied in gliomas, GBMs
and other brain cancers, as well as in chemotherapy-resistant brain
tumors. Similarly, SAA2 encodes the SAA2 protein, which is
highly conserved during mammalian evolution (89). Furthermore, SAA2 may be expressed in
lung cancer cells. Kim et al (90) quantified the SAA2 protein in lung
cancer plasma. However, the role of SAA2 in GBM and its
resistance to chemotherapy remains unknown and should be
investigated. GDF15 was first identified as a macrophage
inhibitory cytokine that encodes the GDF15 protein and belongs to
the TGF-β superfamily (91).
Elevated GDF15 levels have also been observed in patients with
autoimmune diseases (91,92). GDF15 has a functional association
with Ras suppressor-1 in cancer cell invasion and may act as a drug
target for cancers, such as breast cancer (93). The USP26 gene encodes a
member of a family of ubiquitin-specific processing proteins, and
it is an X chromosome-linked deubiquitinase. This gene has a
distinct role in spermatogenesis (94). Recently, Guo et al (95) reported an association between
GDF15 gene expression and malignant progression in gliomas.
USP26 gene expression patterns in gliomas, GBMs and
chemotherapy-resistant brain tumors should be investigated.
Furthermore, a relationship between SAA1
upregulation and TMZ resistance in GBM may exist, and SAA1
upregulation may promote TMZ resistance. Zhang et al
(96) reported that SAA1
knockdown promoted GBM cell apoptosis through PI3K/Akt signaling.
Moreover, Singh et al (48)
reported the role of the PI3K/Akt signaling pathway in
TMZ-resistant GBM. Therefore, SAA1 may serve a role in
TMZ-resistant GBM via the PI3K/Akt signaling pathway. However,
further studies are needed to confirm this hypothesis. Similarly,
other than the PI3K/Akt signaling pathway, the involvement of the
tricarboxylic acid (TCA) cycle has been noted in TMZ-resistant GBM
as IDH enzymes are the prime components of the TCA cycle.
Therefore, the TCA cycle may be associated with TMZ-resistant GBM
(97). However, Immanuel et
al (98) investigated the
metabolic landscapes associated with oxidative phosphorylation
pathways, the malate-aspartate shunt, glycolysis and the TCA cycle,
which are linked with the oxidative phosphorylation of neuronal
cells, and potentially, TMZ-resistant GBM.
Among the genes assessed in the present study,
certain genes were found to serve a role in cell differentiation
and the relative tumor response. For example, SAA1 and
SAA2 serve potential roles in cell differentiation. Lee
et al (99) reported that SA
proteins (SAA1 and SAA2) promote Th17 cell differentiation.
Additionally, Takehara et al (100) reported that SAA1 expression
promotes cancer cell progression. SAA1 may also serve a role
in cancer cell differentiation and progression. Similarly, studies
have shown that GDF15, a mitochondrial cytokine (mitokine), induces
cancer cell subpopulations and provides an invasive advantage. Kang
et al (101) reported that
GDF15 expression in tumors is associated with tumor aggressiveness
and that GDF15 influences STAT3 activation, which assists in
thyroid cancer tumor progression. They also reported that GDF15
acts via the STAT3 signaling axis. Similarly, Wosnitzer et
al (102) reported that the
expression of the USP26 gene promotes cell differentiation
and induces tumorigenesis.
IDH mutations are among the most critical and
earliest genomic alterations in GBM progression and recurrence
(24). IDH enzymes catalyze the
conversion of isocitrate to α-KG, an intermediate in the citric
acid cycle that contributes to NADPH production (103). The IDH mutation produces
neomorphic enzymatic activity that converts α-KG to D-2-HG, leading
to the accumulation of 2-HG and inhibition of α-KG-dependent
enzymes such as histone and DNA demethylases in the tumor (104). The role of IDH mutations has also
been explored in other brain tumors (105). Therefore, it is necessary to
understand the role of IDH mutations in GBM progression. The
present study assessed the mutational landscape of IDH in GBM
through in silico models. Therefore, the findings of the
present study are important for understanding the role of IDH
mutations in GBM progression. However, future research is required
to enhance the understanding of the complete molecular mechanisms
underlying IDH mutations in GBM progression.
The present study identified the gene expression
profiles of TMZ-resistant GBM, mainly the upregulated and
downregulated genes and the IDH mutational landscapes in GBM. The
mapped genes will help future researchers understand the
association between these upregulated and downregulated genes and
the development of TMZ resistance. Specifically, previous studies
reported that there may be an indirect relationship between the
SAA1 gene and TMZ-resistant GBM through the PI3K/Akt
signaling pathway (48,96); however, future studies are needed to
assess the hypothesis. Additionally, a previous study reported that
GDF15 promotes the upregulation of the programmed
death-ligand 1 (PD-L1) protein expression in glioblastoma (106); however, no direct evidence
indicates that the upregulation of GDF15 promotes TMZ
resistance. Nevertheless, a study reported that TMZ-mediated PD-L1
expression in GBM cells and knockdown of PD-L1 impaired the
TMZ-induced inhibition effect of GBM cells (107). Therefore, we hypothesize that
GDF15 is likely to be involved in TMZ resistance through the
regulation of PD-L1. Furthermore, CACNA2D3 is a tumor
suppressor in gliomas (108) and
can enhance the chemosensitivity of esophageal squamous cell
carcinoma (109). It is also one
of the objectives worthy of future exploration.
In the future, the targeted genes whose expression
levels increase (SAA1, SAA2, GDF15 and USP26) or
decrease (TIE1, CACNA2D1, CAPN, and ADAMTS6) in
TMZ-resistance GBM will be manipulated by gene knockdown (e.g.,
using siRNA) or gene overexpression (e.g., via transfection
plasmid), respectively. Further research should investigate whether
the cytotoxic sensitivity to TMZ of TMZ-resistant GBM cells can be
altered and the molecular mechanisms involved, in order to
understand TMZ resistance in GBM from a molecular mechanistic
viewpoint, which may help solve the MDR problem.
However, researchers are attempting to fight GBM
from different directions, and therefore, rapid progress has been
made in GBM research to combat tumors. For example, the 3D
bioprinting of neural cells is essential for understanding neural
cells and their therapeutics (110). Dai et al (111) developed a 3D-bioprinted model in
which glioblastoma stem cells (GSCs) and mesenchymal stem cells
(MSCs) were fused. This will aid in understanding the interaction
between GSCs and MSCs and explain tumor progression. Interactions
between NSCs and microglial cells have also been studied through
single-cell whole-transcriptome sequencing, which helps to further
understand the recurrence of GBM (112). Additionally, Liu et al
(113) developed ultra-small
zirconium carbide nanoparticles to treat gliomas.
The present study has some limitations. Firstly,
during immunohistochemical staining, the expression of TIE1
and CAPN6 genes, and SAA1 and SAA2 genes was
studied. The expression of other genes was not studied through
immunohistochemical staining due to the lack of availability of
other antibodies. Secondly, the study depended on the servers'
dataset for bioinformatics analysis. For example, the PRECOG server
dataset was used during the KM survival and meta-Z analyses.
However, these servers are highly cited.
In conclusion, GBM is a complex heterogeneous
disease and chemoresistance is a significant issue in patients with
GBM. To this end, the present comprehensive study identified the
downregulated and upregulated genes and their expression patterns.
This simplifies the current understanding of this complex disease
and TMZ resistance. NGS and RNA-seq analyses identified upregulated
and downregulated genes in the GBM8401-resistant cells. The present
study also illustrated the mutational landscape of IDH in GBM,
which suggested that the IDH mutational landscape contributes to
TMZ resistance in GBM cells. The results of the present study
provide possible mechanisms for IDH mutations that contribute to
TMZ resistance in GBM. They also provide significant insights into
the molecular mechanisms of resistance in GBM. The present study
also provides directions that may assist in future therapeutic
developments related to IDH mutations. A deeper understanding of
TMZ resistance in GBM may help solve the MDR problem. Therefore,
the results of the present study are important for future
researchers to develop novel biomarkers and therapeutics for brain
tumors. These findings will help to identify the underlying
molecular mechanisms and signaling networks, appropriate
biomarkers, new therapeutic targets and novel therapeutics for GBM
and other brain tumors.
Supplementary Material
Supporting Data
Supporting Data
Acknowledgements
The authors would like to thank Chang Gung Medical
Foundation Kaohsiung Chang Gung Memorial Hospital Biobank &
Research Specimen Processing Lab for patient sample preparation and
sectioning.
Funding
The present study was supported by research grants from the
National Science and Technology Council (grant nos.
109-2314-B-182A-080-MY2 and 111-2314-B-182A-132-MY3) and Chang Gung
Memorial Hospital (grant nos. CMRPG8K1403 and CMRPG8N1461).
Availability of data and materials
The RNA-seq data generated in the present study may
be found in the NCBI Gene Expression Omnibus under the GEO Series
accession number GSE234762 or at the following URL (https://www.ncbi.nlm.nih.gov/geo/query/acc.cgi?acc=GSE234762).
All other data generated in the present study may be requested from
the corresponding author.
Authors' contributions
WFC, ZHW and CC wrote the manuscript, performed
analyses and sketched the figures and tables. JMJC, NFC, SNY and MB
performed formal analyses and validation. HTL and KD performed the
analysis and/or interpretation of data, and the review of the
manuscript. WFC and ZHW confirm the authenticity of all the raw
data. All authors have read and approved the final manuscript.
Ethics approval and consent to
participate
The present study was approved by the Chang Gung
Medical Foundation Institutional Review Board (approval no.
201902218B1B0). Written informed consent was obtained before
collecting the samples.
Patient consent for publication
Not applicable.
Competing interests
The authors declare that they have no competing
interests.
References
|
1
|
Grech N, Dalli T, Mizzi S, Meilak L,
Calleja N and Zrinzo A: Rising incidence of glioblastoma multiforme
in a well-defined population. Cureus. 12:e81952020.PubMed/NCBI
|
|
2
|
Miller KD, Ostrom QT, Kruchko C, Patil N,
Tihan T, Cioffi G, Fuchs HE, Waite KA, Jemal A, Siegel RL and
Barnholtz-Sloan JS: Brain and other central nervous system tumor
statistics, 2021. CA Cancer J Clin. 71:381–406. 2021. View Article : Google Scholar : PubMed/NCBI
|
|
3
|
Ostrom QT, Cioffi G, Waite K, Kruchko C
and Barnholtz-Sloan JS: CBTRUS statistical report: Primary brain
and other central nervous system tumors diagnosed in the United
States in 2014–2018. Neuro Oncol. 23 (12 Suppl 2):iii1–iii105.
2021. View Article : Google Scholar : PubMed/NCBI
|
|
4
|
Wen PY and Kesari S: Malignant gliomas in
adults. N Engl J Med. 359:492–507. 2008. View Article : Google Scholar : PubMed/NCBI
|
|
5
|
Kleihues P and Ohgaki H: Primary and
secondary glioblastomas: From concept to clinical diagnosis. Neuro
Oncol. 1:44–51. 1999. View Article : Google Scholar : PubMed/NCBI
|
|
6
|
Lin D, Wang M, Chen Y, Gong J, Chen L, Shi
X, Lan F, Chen Z, Xiong T, Sun H and Wan S: Trends in Intracranial
glioma incidence and mortality in the United States, 1975–2018.
Front Oncol. 11:7480612021. View Article : Google Scholar : PubMed/NCBI
|
|
7
|
Upadhyaya SA, Ghazwani Y, Wu S, Broniscer
A, Boop FA, Gajjar A and Qaddoumi I: Mortality in children with
low-grade glioma or glioneuronal tumors: A single-institution
study. Pediatr Blood Cancer. 65:10.1002/pbc.26717. 2018. View Article : Google Scholar
|
|
8
|
Yao M, Li S, Wu X, Diao S, Zhang G, He H,
Bian L and Lu Y: Cellular origin of glioblastoma and its
implication in precision therapy. Cell Mol Immunol. 15:737–739.
2018. View Article : Google Scholar : PubMed/NCBI
|
|
9
|
Louis DN, Perry A, Reifenberger G, von
Deimling A, Figarella-Branger D, Cavenee WK, Ohgaki H, Wiestler OD,
Kleihues P and Ellison DW: The 2016 World Health Organization
classification of tumors of the central nervous system: A summary.
Acta Neuropathol. 131:803–820. 2016. View Article : Google Scholar : PubMed/NCBI
|
|
10
|
Stupp R, Mason WP, van den Bent MJ, Weller
M, Fisher B, Taphoorn MJ, Belanger K, Brandes AA, Marosi C, Bogdahn
U, et al: Radiotherapy plus concomitant and adjuvant temozolomide
for glioblastoma. N Engl J Med. 352:987–996. 2005. View Article : Google Scholar : PubMed/NCBI
|
|
11
|
Olivier C, Oliver L, Lalier L and Vallette
FM: Drug resistance in glioblastoma: The two faces of oxidative
stress. Front Mol Biosci. 7:6206772021. View Article : Google Scholar : PubMed/NCBI
|
|
12
|
Mansoori B, Mohammadi A, Davudian S,
Shirjang S and Baradaran B: The different mechanisms of cancer drug
resistance: A brief review. Adv Pharm Bull. 7:339–348. 2017.
View Article : Google Scholar : PubMed/NCBI
|
|
13
|
Jakoby WB: The glutathione S-transferases:
A group of multifunctional detoxification proteins. Adv Enzymol
Relat Areas Mol Biol. 46:383–414. 1978.PubMed/NCBI
|
|
14
|
Oliver L, Lalier L, Salaud C, Heymann D,
Cartron PF and Vallette FM: Drug resistance in glioblastoma: Are
persisters the key to therapy? Cancer Drug Resist. 3:287–301.
2020.PubMed/NCBI
|
|
15
|
Phi LTH, Sari IN, Yang YG, Lee SH, Jun N,
Kim KS, Lee YK and Kwon HY: Cancer stem cells (CSCs) in drug
resistance and their therapeutic implications in cancer treatment.
Stem Cells Int. 2018:54169232018. View Article : Google Scholar : PubMed/NCBI
|
|
16
|
Liu G, Yuan X, Zeng Z, Tunici P, Ng H,
Abdulkadir IR, Lu L, Irvin D, Black KL and Yu JS: Analysis of gene
expression and chemoresistance of CD133+ cancer stem cells in
glioblastoma. Mol Cancer. 5:672006. View Article : Google Scholar : PubMed/NCBI
|
|
17
|
Behnan J, Finocchiaro G and Hanna G: The
landscape of the mesenchymal signature in brain tumours. Brain.
142:847–866. 2019. View Article : Google Scholar : PubMed/NCBI
|
|
18
|
Yu Z, Chen Y, Wang S, Li P, Zhou G and
Yuan Y: Inhibition of NF-κB results in anti-glioma activity and
reduces temozolomide-induced chemoresistance by down-regulating
MGMT gene expression. Cancer Lett. 428:77–89. 2018. View Article : Google Scholar : PubMed/NCBI
|
|
19
|
Yao L, Li J, Zhang X, Zhou L and Hu K:
Downregulated ferroptosis-related gene SQLE facilitates
temozolomide chemoresistance, and invasion and affects immune
regulation in glioblastoma. CNS Neurosci Ther. 28:2104–2115. 2022.
View Article : Google Scholar : PubMed/NCBI
|
|
20
|
Cohen AL, Holmen SL and Colman H: IDH1 and
IDH2 mutations in gliomas. Curr Neurol Neurosci Rep. 13:3452013.
View Article : Google Scholar : PubMed/NCBI
|
|
21
|
Hegi ME, Diserens AC, Gorlia T, Hamou MF,
de Tribolet N, Weller M, Kros JM, Hainfellner JA, Mason W, Mariani
L, et al: MGMT gene silencing and benefit from temozolomide in
glioblastoma. N Engl J Med. 352:997–1003. 2005. View Article : Google Scholar : PubMed/NCBI
|
|
22
|
Perez A and Huse JT: The evolving
classification of diffuse gliomas: World Health Organization
updates for 2021. Curr Neurol Neurosci Rep. 21:672021. View Article : Google Scholar : PubMed/NCBI
|
|
23
|
Sun X and Turcan S: From laboratory
studies to clinical trials: Temozolomide use in IDH-mutant gliomas.
Cells. 10:12252021. View Article : Google Scholar : PubMed/NCBI
|
|
24
|
Han S, Liu Y, Cai SJ, Qian M, Ding J,
Larion M, Gilbert MR and Yang C: IDH mutation in glioma: Molecular
mechanisms and potential therapeutic targets. Br J Cancer.
122:1580–1589. 2020. View Article : Google Scholar : PubMed/NCBI
|
|
25
|
Nobusawa S, Watanabe T, Kleihues P and
Ohgaki H: IDH1 mutations as molecular signature and predictive
factor of secondary glioblastomas. Clin Cancer Res. 15:6002–6007.
2009. View Article : Google Scholar : PubMed/NCBI
|
|
26
|
Govindarajan V, Shah AH, Di L, Rivas S,
Suter RK, Eichberg DG, Luther E, Lu V, Morell AA, Ivan ME, et al:
Systematic review of epigenetic therapies for treatment of
IDH-mutant glioma. World Neurosurg. 162:47–56. 2022. View Article : Google Scholar : PubMed/NCBI
|
|
27
|
Qi S, Lei Y, Si G, YanQing D, HuiXia H,
XueLin Z, LanXiao W and Fei Y: IDH mutations predict longer
survival and response to temozolomide in secondary glioblastoma.
Cancer Sci. 103:269–273. 2012. View Article : Google Scholar : PubMed/NCBI
|
|
28
|
Munoz JL, Bliss SA, Greco SJ, Ramkissoon
SH, Ligon KL and Rameshwar P: Delivery of functional anti-miR-9 by
mesenchymal stem cell-derived exosomes to glioblastoma multiforme
cells conferred chemosensitivity. Mol Ther Nucleic Acids.
2:e1262013. View Article : Google Scholar : PubMed/NCBI
|
|
29
|
Bolger AM, Lohse M and Usadel B:
Trimmomatic: A flexible trimmer for Illumina sequence data.
Bioinformatics. 30:2114–2120. 2014. View Article : Google Scholar : PubMed/NCBI
|
|
30
|
Pertea M, Kim D, Pertea GM, Leek JT and
Salzberg SL: Transcript-level expression analysis of RNA-seq
experiments with HISAT, StringTie and Ballgown. Nat Protoc.
11:1650–1667. 2016. View Article : Google Scholar : PubMed/NCBI
|
|
31
|
Trapnell C, Roberts A, Goff L, Pertea G,
Kim D, Kelley DR, Pimentel H, Salzberg SL, Rinn JL and Pachter L:
Differential gene and transcript expression analysis of RNA-seq
experiments with TopHat and Cufflinks. Nat Protoc. 7:562–578. 2012.
View Article : Google Scholar : PubMed/NCBI
|
|
32
|
Livak KJ and Schmittgen TD: Analysis of
relative gene expression data using real-time quantitative PCR and
the 2(−Delta Delta C(T)) method. Methods. 25:402–408. 2001.
View Article : Google Scholar : PubMed/NCBI
|
|
33
|
Gentles AJ, Newman AM, Liu CL, Bratman SV,
Feng W, Kim D, Nair VS, Xu Y, Khuong A, Hoang CD, et al: The
prognostic landscape of genes and infiltrating immune cells across
human cancers. Nat Med. 21:938–945. 2015. View Article : Google Scholar : PubMed/NCBI
|
|
34
|
Dudley WN, Wickham R and Coombs N: An
introduction to survival statistics: Kaplan-Meier analysis. J Adv
Pract Oncol. 7:91–100. 2016.PubMed/NCBI
|
|
35
|
Lubbock ALR, Katz E, Harrison DJ and
Overton IM: TMA navigator: Network inference, patient
stratification and survival analysis with tissue microarray data.
Nucleic Acids Res. 41((Web Server Issue)): W562–W568. 2013.
View Article : Google Scholar : PubMed/NCBI
|
|
36
|
Stelzer G, Dalah I, Stein TI, Satanower Y,
Rosen N, Nativ N, Oz-Levi D, Olender T, Belinky F, Bahir I, et al:
In-silico human genomics with GeneCards. Hum Genomics. 5:709–717.
2011. View Article : Google Scholar : PubMed/NCBI
|
|
37
|
Stelzer G, Rosen N, Plaschkes I, Zimmerman
S, Twik M, Fishilevich S, Stein TI, Nudel R, Lieder I, Mazor Y, et
al: The GeneCards suite: From gene data mining to disease genome
sequence analyses. Curr Protoc Bioinformatics. 54:1.30.1–1.30.33.
2016. View
Article : Google Scholar : PubMed/NCBI
|
|
38
|
Szklarczyk D, Franceschini A, Wyder S,
Forslund K, Heller D, Huerta-Cepas J, Simonovic M, Roth A, Santos
A, Tsafou KP, et al: STRING v10: Protein-protein interaction
networks, integrated over the tree of life. Nucleic Acids Res.
43((Database Issue)): D447–D452. 2015. View Article : Google Scholar : PubMed/NCBI
|
|
39
|
Maglott D, Ostell J, Pruitt KD and
Tatusova T: Entrez gene: Gene-centered information at NCBI. Nucleic
Acids Res. 33((Database Issue)): D54–D58. 2005.PubMed/NCBI
|
|
40
|
Crowe AR and Yue W: Semi-quantitative
determination of protein expression using immunohistochemistry
staining and analysis: An Integrated Protocol. Bio Protoc.
9:e34652019. View Article : Google Scholar : PubMed/NCBI
|
|
41
|
Yuan JX and Munson JM: Quantitative
immunohistochemistry of the cellular microenvironment in patient
glioblastoma resections. J Vis Exp. 560252017.PubMed/NCBI
|
|
42
|
Burley SK, Berman HM, Kleywegt GJ, Markley
JL, Nakamura H and Velankar S: Protein data bank (PDB): The single
global macromolecular structure archive. Methods Mol Biol.
1607:627–641. 2017. View Article : Google Scholar : PubMed/NCBI
|
|
43
|
Yuan S, Chan HCS, Filipek S and Vogel H:
PyMOL and inkscape bridge the data and the data visualization.
Structure. 24:2041–2042. 2016. View Article : Google Scholar : PubMed/NCBI
|
|
44
|
Jumper J, Evans R, Pritzel A, Green T,
Figurnov M, Ronneberger O, Tunyasuvunakool K, Bates R, Žídek A,
Potapenko A, et al: Highly accurate protein structure prediction
with AlphaFold. Nature. 596:583–589. 2021. View Article : Google Scholar : PubMed/NCBI
|
|
45
|
de Beer TAP, Berka K, Thornton JM and
Laskowski RA: PDBsum additions. Nucleic Acids Res. 42((Database
Issue)): D292–D296. 2014. View Article : Google Scholar : PubMed/NCBI
|
|
46
|
Hammer Ø, Harper DAT and Ryan PD: PAST:
Paleontological statistics software package for education and data
analysis. Palaeontol Electron. 4:92001.
|
|
47
|
MATLAB, . High performance numeric
computation and visualization software: User's guide: For UNIX
workstations. Mathworks Incorporated. 2003.
|
|
48
|
Singh N, Miner A, Hennis L and Mittal S:
Mechanisms of temozolomide resistance in glioblastoma-a
comprehensive review. Cancer Drug Resist. 4:17–43. 2021.PubMed/NCBI
|
|
49
|
Chen X, Zhang M, Gan H, Wang H, Lee JH,
Fang D, Kitange GJ, He L, Hu Z, Parney IF, et al: A novel enhancer
regulates MGMT expression and promotes temozolomide resistance in
glioblastoma. Nat Commun. 9:29492018. View Article : Google Scholar : PubMed/NCBI
|
|
50
|
Bukowski K, Kciuk M and Kontek R:
Mechanisms of multidrug resistance in cancer chemotherapy. Int J
Mol Sci. 21:32332020. View Article : Google Scholar : PubMed/NCBI
|
|
51
|
Rapin N, Bagger FO, Jendholm J,
Mora-Jensen H, Krogh A, Kohlmann A, Thiede C, Borregaard N,
Bullinger L, Winther O, et al: Comparing cancer vs normal gene
expression profiles identifies new disease entities and common
transcriptional programs in AML patients. Blood. 123:894–904. 2014.
View Article : Google Scholar : PubMed/NCBI
|
|
52
|
Cheng SY, Chen NF, Wen ZH, Yao ZK, Tsui
KH, Kuo HM and Chen WF: Glutathione S-transferase M3 is associated
with glycolysis in intrinsic temozolomide-resistant glioblastoma
multiforme cells. Int J Mol Sci. 22:70802021. View Article : Google Scholar : PubMed/NCBI
|
|
53
|
Gordinier ME, Schau GF, Pollock SB,
Shields LBE and Talwalkar S: Genomic characterization of vulvar
squamous cell carcinoma reveals differential gene expression based
on clinical outcome. Gynecol Oncol. 180:111–117. 2024. View Article : Google Scholar : PubMed/NCBI
|
|
54
|
Hu G, Wei B, Wang L, Wang L, Kong D, Jin Y
and Sun Z: Analysis of gene expression profiles associated with
glioma progression. Mol Med Rep. 12:1884–1890. 2015. View Article : Google Scholar : PubMed/NCBI
|
|
55
|
Kothari C, Osseni MA, Agbo L, Ouellette G,
Déraspe M, Laviolette F, Corbeil J, Lambert JP, Diorio C and
Durocher F: Machine learning analysis identifies genes
differentiating triple negative breast cancers. Sci Rep.
10:104642020. View Article : Google Scholar : PubMed/NCBI
|
|
56
|
Kumar SU, Kumar DT, Siva R, Doss CGP and
Zayed H: Integrative bioinformatics approaches to map potential
novel genes and pathways involved in ovarian cancer. Front Bioeng
Biotechnol. 7:3912019. View Article : Google Scholar : PubMed/NCBI
|
|
57
|
Chakraborty C, Sharma AR, Bhattacharya M,
Zayed H and Lee SS: Understanding gene expression and transcriptome
profiling of COVID-19: An initiative towards the mapping of
protective immunity genes against SARS-CoV-2 infection. Front
Immunol. 12:7249362021. View Article : Google Scholar : PubMed/NCBI
|
|
58
|
Chakraborty C, Bhattacharya M, Dhama K and
Lee SS: Evaluation of differentially expressed genes during
replication using gene expression landscape of monkeypox-infected
MK2 cells: A bioinformatics and systems biology approach to
understanding the genomic pattern of viral replication. J Infect
Public Health. 16:399–409. 2023. View Article : Google Scholar : PubMed/NCBI
|
|
59
|
Dunn SL, Soul J, Anand S, Schwartz JM,
Boot-Handford RP and Hardingham TE: Gene expression changes in
damaged osteoarthritic cartilage identify a signature of
non-chondrogenic and mechanical responses. Osteoarthritis
Cartilage. 24:1431–1440. 2016. View Article : Google Scholar : PubMed/NCBI
|
|
60
|
Chen SJ, Liao DL, Chen CH, Wang TY and
Chen KC: Construction and analysis of protein-protein interaction
network of heroin use disorder. Sci Rep. 9:49802019. View Article : Google Scholar : PubMed/NCBI
|
|
61
|
Raman K: Construction and analysis of
protein-protein interaction networks. Autom Exp. 2:22010.
View Article : Google Scholar : PubMed/NCBI
|
|
62
|
Silverbush D and Sharan R: A systematic
approach to orient the human protein-protein interaction network.
Nat Commun. 10:30152019. View Article : Google Scholar : PubMed/NCBI
|
|
63
|
Lee SY: Temozolomide resistance in
glioblastoma multiforme. Genes Dis. 3:198–210. 2016. View Article : Google Scholar : PubMed/NCBI
|
|
64
|
Mrugala MM and Chamberlain MC: Mechanisms
of disease: Temozolomide and glioblastoma-look to the future. Nat
Clin Pract Oncol. 5:476–486. 2008. View Article : Google Scholar : PubMed/NCBI
|
|
65
|
Woo PYM, Li Y, Chan AHY, Ng SCP, Loong
HHF, Chan DTM, Wong GKC and Poon WS: A multifaceted review of
temozolomide resistance mechanisms in glioblastoma beyond
O-6-methylguanine-DNA methyltransferase. Glioma. 2:68–82. 2019.
View Article : Google Scholar
|
|
66
|
Kitange GJ, Carlson BL, Schroeder MA,
Grogan PT, Lamont JD, Decker PA, Wu W, James CD and Sarkaria JN:
Induction of MGMT expression is associated with temozolomide
resistance in glioblastoma xenografts. Neuro Oncol. 11:281–291.
2009. View Article : Google Scholar : PubMed/NCBI
|
|
67
|
Barthel FP, Johnson KC, Varn FS, Moskalik
AD, Tanner G, Kocakavuk E, Anderson KJ, Abiola O, Aldape K, Alfaro
KD, et al: Longitudinal molecular trajectories of diffuse glioma in
adults. Nature. 576:112–120. 2019. View Article : Google Scholar : PubMed/NCBI
|
|
68
|
Jonsson P, Lin AL, Young RJ, DiStefano NM,
Hyman DM, Li BT, Berger MF, Zehir A, Ladanyi M, Solit DB, et al:
Genomic correlates of disease progression and treatment response in
prospectively characterized gliomas. Clin Cancer Res. 25:5537–5547.
2019. View Article : Google Scholar : PubMed/NCBI
|
|
69
|
Ohba S, Mukherjee J, See WL and Pieper RO:
Mutant IDH1-driven cellular transformation increases RAD51-mediated
homologous recombination and temozolomide resistance. Cancer Res.
74:4836–4844. 2014. View Article : Google Scholar : PubMed/NCBI
|
|
70
|
Chen T, Wang J, Xue B, Kong Q, Liu Z and
Yu B: Identification and characterization of a novel porcine
endothelial cell-specific Tie1 promoter. Xenotransplantation.
20:438–448. 2013. View Article : Google Scholar : PubMed/NCBI
|
|
71
|
Rodewald HR and Sato TN: Tie1, a receptor
tyrosine kinase essential for vascular endothelial cell integrity,
is not critical for the development of hematopoietic cells.
Oncogene. 12:397–404. 1996.PubMed/NCBI
|
|
72
|
Woo KV and Baldwin HS: Role of Tie1 in
shear stress and atherosclerosis. Trends Cardiovasc Med.
21:118–123. 2011. View Article : Google Scholar : PubMed/NCBI
|
|
73
|
Meltzer M, Eliash N, Azoulay Z, Hadad U
and Papo N: In vitro inhibition of cancer angiogenesis and
migration by a nanobody that targets the orphan receptor Tie1. Cell
Mol Life Sci. 79:3122022. View Article : Google Scholar : PubMed/NCBI
|
|
74
|
Dolphin AC: Voltage-gated calcium channel
α 2δ subunits: an assessment of proposed novel roles.
F1000Res. 7:F1000 Faculty Rev. –1830. 2018. View Article : Google Scholar : PubMed/NCBI
|
|
75
|
Panebianco M, Al-Bachari S, Hutton JL and
Marson AG: Gabapentin add-on treatment for drug-resistant focal
epilepsy. Cochrane Database Syst Rev. 1:CD0014152021.PubMed/NCBI
|
|
76
|
Derry S, Bell RF, Straube S, Wiffen PJ,
Aldington D and Moore RA: Pregabalin for neuropathic pain in
adults. Cochrane Database Syst Rev. 1:CD0070762019.PubMed/NCBI
|
|
77
|
Alles SRA, Cain SM and Snutch TP:
Pregabalin as a pain therapeutic: Beyond calcium channels. Front
Cell Neurosci. 14:832020. View Article : Google Scholar : PubMed/NCBI
|
|
78
|
Verma V, Singh N and Singh Jaggi A:
Pregabalin in neuropathic pain: Evidences and possible mechanisms.
Curr Neuropharmacol. 12:44–56. 2014. View Article : Google Scholar : PubMed/NCBI
|
|
79
|
Tonami K, Kurihara Y, Aburatani H,
Uchijima Y, Asano T and Kurihara H: Calpain 6 is involved in
microtubule stabilization and cytoskeletal organization. Mol Cell
Biol. 27:2548–2561. 2007. View Article : Google Scholar : PubMed/NCBI
|
|
80
|
Ono Y and Sorimachi H: Calpains: An
elaborate proteolytic system. Biochim Biophys Acta. 1824:224–236.
2012. View Article : Google Scholar : PubMed/NCBI
|
|
81
|
Chen L, Xiao D, Tang F, Gao H and Li X:
CAPN6 in disease: An emerging therapeutic target (review). Int J
Mol Med. 46:1644–1652. 2020.PubMed/NCBI
|
|
82
|
Kelwick R, Desanlis I, Wheeler GN and
Edwards DR: The ADAMTS (a disintegrin and metalloproteinase with
thrombospondin motifs) family. Genome Biol. 16:1132015. View Article : Google Scholar : PubMed/NCBI
|
|
83
|
Xie Y, Gou Q, Xie K, Wang Z, Wang Y and
Zheng H: ADAMTS6 suppresses tumor progression via the ERK signaling
pathway and serves as a prognostic marker in human breast cancer.
Oncotarget. 7:61273–61283. 2016. View Article : Google Scholar : PubMed/NCBI
|
|
84
|
Mori M, Tian G, Ishikawa A and Higuchi K:
Diversity and complexity of the mouse Saa1 and Saa2 genes. Exp
Anim. 63:99–106. 2014. View Article : Google Scholar : PubMed/NCBI
|
|
85
|
Jumeau C, Awad F, Assrawi E, Cobret L,
Duquesnoy P, Giurgea I, Valeyre D, Grateau G, Amselem S, Bernaudin
JF and Karabina SA: Expression of SAA1, SAA2 and SAA4 genes in
human primary monocytes and monocyte-derived macrophages. PLoS One.
14:e02170052019. View Article : Google Scholar : PubMed/NCBI
|
|
86
|
Li W, Wang W, Zuo R, Liu C, Shu Q, Ying H
and Sun K: Induction of pro-inflammatory genes by serum amyloid A1
in human amnion fibroblasts. Sci Rep. 7:6932017. View Article : Google Scholar : PubMed/NCBI
|
|
87
|
Abouelasrar Salama S, De Bondt M, De Buck
M, Berghmans N, Proost P, Oliveira VLS, Amaral FA, Gouwy M, Van
Damme J and Struyf S: Serum amyloid A1 (SAA1) revisited: Restricted
leukocyte-activating properties of homogeneous SAA1. Front Immunol.
11:8432020. View Article : Google Scholar : PubMed/NCBI
|
|
88
|
Li S, Cheng Y, Cheng G, Xu T, Ye Y, Miu Q,
Cao Q, Yang X, Ruan H and Zhang X: High SAA1 expression predicts
advanced tumors in renal cancer. Front Oncol. 11:6497612021.
View Article : Google Scholar : PubMed/NCBI
|
|
89
|
Sack GH Jr: Serum amyloid A-a review. Mol
Med. 24:462018. View Article : Google Scholar : PubMed/NCBI
|
|
90
|
Kim YJ, Gallien S, El-Khoury V, Goswami P,
Sertamo K, Schlesser M, Berchem G and Domon B: Quantification of
SAA1 and SAA2 in lung cancer plasma using the isotype-specific PRM
assays. Proteomics. 15:3116–3125. 2015. View Article : Google Scholar : PubMed/NCBI
|
|
91
|
Wischhusen J, Melero I and Fridman WH:
Growth/differentiation factor-15 (GDF-15): From biomarker to novel
targetable immune checkpoint. Front Immunol. 11:9512020. View Article : Google Scholar : PubMed/NCBI
|
|
92
|
Arinaga-Hino T, Ide T, Akiba J, Suzuki H,
Kuwahara R, Amano K, Kawaguchi T, Sano T, Inoue E, Koga H, et al:
Growth differentiation factor 15 as a novel diagnostic and
therapeutic marker for autoimmune hepatitis. Sci Rep. 12:87592022.
View Article : Google Scholar : PubMed/NCBI
|
|
93
|
Gkretsi V, Louca M, Stylianou A, Minadakis
G, Spyrou GM and Stylianopoulos T: Inhibition of breast cancer cell
invasion by ras suppressor-1 (RSU-1) silencing is reversed by
growth differentiation factor-15 (GDF-15). Int J Mol Sci.
20:1632019. View Article : Google Scholar : PubMed/NCBI
|
|
94
|
Sakai K, Ito C, Wakabayashi M, Kanzaki S,
Ito T, Takada S, Toshimori K, Sekita Y and Kimura T: Usp26 mutation
in mice leads to defective spermatogenesis depending on genetic
background. Sci Rep. 9:137572019. View Article : Google Scholar : PubMed/NCBI
|
|
95
|
Guo L, Chen Y, Hu S, Gao L, Tang N, Liu R,
Qin Y, Ren C and Du S: GDF15 expression in glioma is associated
with malignant progression, immune microenvironment, and serves as
a prognostic factor. CNS Neurosci Ther. 28:158–171. 2022.
View Article : Google Scholar : PubMed/NCBI
|
|
96
|
Zhang H, Xu Y, Deng G, Yuan F, Tan Y, Gao
L, Sun Q, Qi Y, Yang K, Geng R and Jiang H: SAA1 knockdown promotes
the apoptosis of glioblastoma cells via downregulation of AKT
signaling. J Cancer. 12:2756–2767. 2021. View Article : Google Scholar : PubMed/NCBI
|
|
97
|
Tommasini-Ghelfi S, Murnan K, Kouri FM,
Mahajan AS, May JL and Stegh AH: Cancer-associated mutation and
beyond: The emerging biology of isocitrate dehydrogenases in human
disease. Sci Adv. 5:eaaw45432019. View Article : Google Scholar : PubMed/NCBI
|
|
98
|
Immanuel SRC, Ghanate AD, Parmar DS, Yadav
R, Uthup R, Panchagnula V and Raghunathan A: Integrated genetic and
metabolic landscapes predict vulnerabilities of temozolomide
resistant glioblastoma cells. NPJ Syst Biol Appl. 7:22021.
View Article : Google Scholar : PubMed/NCBI
|
|
99
|
Lee JY, Hall JA, Kroehling L, Wu L, Najar
T, Nguyen HH, Lin WY, Yeung ST, Silva HM, Li D, et al: Serum
amyloid A proteins induce pathogenic Th17 cells and promote
inflammatory disease. Cell. 180:79–91.e16. 2020. View Article : Google Scholar : PubMed/NCBI
|
|
100
|
Takehara M, Sato Y, Kimura T, Noda K,
Miyamoto H, Fujino Y, Miyoshi J, Nakamura F, Wada H, Bando Y, et
al: Cancer-associated adipocytes promote pancreatic cancer
progression through SAA1 expression. Cancer Sci. 111:2883–2894.
2020. View Article : Google Scholar : PubMed/NCBI
|
|
101
|
Kang YE, Kim JM, Lim MA, Lee SE, Yi S, Kim
JT, Oh C, Liu L, Jin Y, Jung SN, et al: Growth differentiation
factor 15 is a cancer cell-induced mitokine that primes thyroid
cancer cells for invasiveness. Thyroid. 31:772–786. 2021.
View Article : Google Scholar : PubMed/NCBI
|
|
102
|
Wosnitzer MS, Mielnik A, Dabaja A,
Robinson B, Schlegel PN and Paduch DA: Ubiquitin specific protease
26 (USP26) expression analysis in human testicular and extragonadal
tissues indicates diverse action of USP26 in cell differentiation
and tumorigenesis. PLoS One. 9:e986382014. View Article : Google Scholar : PubMed/NCBI
|
|
103
|
Parker SJ and Metallo CM: Metabolic
consequences of oncogenic IDH mutations. Pharmacol Ther. 152:54–62.
2015. View Article : Google Scholar : PubMed/NCBI
|
|
104
|
Dang L, White DW, Gross S, Bennett BD,
Bittinger MA, Driggers EM, Fantin VR, Jang HG, Jin S, Keenan MC, et
al: Cancer-associated IDH1 mutations produce 2-hydroxyglutarate.
Nature. 462:739–744. 2009. View Article : Google Scholar : PubMed/NCBI
|
|
105
|
Turkalp Z, Karamchandani J and Das S: IDH
mutation in glioma: New insights and promises for the future. JAMA
Neurol. 71:1319–1325. 2014. View Article : Google Scholar : PubMed/NCBI
|
|
106
|
Peng H, Li Z, Fu J and Zhou R: Growth and
differentiation factor 15 regulates PD-L1 expression in
glioblastoma. Cancer Manag Res. 11:2653–2661. 2019. View Article : Google Scholar : PubMed/NCBI
|
|
107
|
Wang S, Yao F, Lu X, Li Q, Su Z, Lee JH,
Wang C and Du L: Temozolomide promotes immune escape of GBM cells
via upregulating PD-L1. Am J Cancer Res. 9:1161–1171.
2019.PubMed/NCBI
|
|
108
|
Jin Y, Cui D, Ren J, Wang K, Zeng T and
Gao L: CACNA2D3 is downregulated in gliomas and functions as a
tumor suppressor. Mol Carcinog. 56:945–959. 2017. View Article : Google Scholar : PubMed/NCBI
|
|
109
|
Nie C, Qin X, Li X, Tian B, Zhao Y, Jin Y,
Li Y, Wang Q, Zeng D, Hong A and Chen X: CACNA2D3 enhances the
chemosensitivity of esophageal squamous cell carcinoma to cisplatin
via inducing Ca2+-mediated apoptosis and suppressing
PI3K/Akt pathways. Front Oncol. 9:1852019. View Article : Google Scholar : PubMed/NCBI
|
|
110
|
Dai X, Tian X, Gu S, Yang Y, Li H, Gao P,
Lan Q and Cheng H: Hybrid biofabrication of neurosecretory
structures as a model for neurosecretion. Int J Bioprint.
9:6592022. View Article : Google Scholar : PubMed/NCBI
|
|
111
|
Dai X, Shao Y, Tian X, Cao X, Ye L, Gao P,
Cheng H and Wang X: Fusion between glioma stem cells and
mesenchymal stem cells promotes malignant progression in
3D-bioprinted models. ACS Appl Mater Interfaces. 14:35344–35356.
2022. View Article : Google Scholar : PubMed/NCBI
|
|
112
|
Dai X, Ye L, Li H, Dong X, Tian H, Gao P,
Dong J and Cheng H: Crosstalk between microglia and neural stem
cells influences the relapse of glioblastoma in GBM immunological
microenvironment. Clin Immunol. 251:1093332023. View Article : Google Scholar : PubMed/NCBI
|
|
113
|
Liu D, Dai X, Zhang W, Zhu X, Zha Z, Qian
H, Cheng L and Wang X: Liquid exfoliation of ultrasmall zirconium
carbide nanodots as a noninflammatory photothermal agent in the
treatment of glioma. Biomaterials. 292:1219172023. View Article : Google Scholar : PubMed/NCBI
|