Introduction
According to 2020 Global Cancer Statistics, liver
cancer accounts for 75–85% of primary liver tumors, with ~906,000
new cases diagnosed each year, and is the third most frequent cause
of cancer-associated mortality worldwide (1). Due to the insidious onset of liver
cancer and the absence of early clinical manifestations, the
majority of patients with liver cancer are diagnosed at an advanced
disease stage, which precludes surgical intervention (2). Despite advancements in treatment
modalities such as liver transplantation, anatomical liver
resection, interventional therapy, local ablation therapy,
radiation therapy and targeted therapy, the 5-year overall survival
(OS) rate remains at <15% (3).
Long non-coding RNAs (lncRNAs), a class of RNAs
>200 nucleotides in length without protein translation capacity,
play a pivotal role in tumorigenesis (4). Certain lncRNAs are known to be
involved in various biological processes, including cell stemness,
DNA damage, chemical resistance, immune escape,
epithelial-mesenchymal transition (EMT) and metabolic disorders
(5). The aberrant expression of
lncRNA may contribute to the occurrence, progression, invasion and
metastasis of diverse tumors, including liver cancer (6–9). For
instance, Tang et al (10)
identified that the expression of lncRNA CRNDE was
upregulated in liver cancer, and promoted the proliferation and
migration of liver cancer cells by sponging microRNA (miR)-337-3p,
thereby upregulating the expression of sineoculis homeobox homolog
1. In another study, lncRNA CEBPA-DT was shown to interact
with heterogeneous nuclear ribonucleoprotein C, thereby activating
the interaction between discoidin domain receptor 2 and β-catenin,
leading to liver cancer metastasis (11). Furthermore, lncRNA SNHG7 was
indicated to induce the proliferation and migration of liver cancer
cells by sponging miR-122-5p (12),
and lncRNA ANRIL was demonstrated to regulate liver cancer
cell proliferation, migration and invasion via the targeting of
miR-384 and modulation of STAT3 (13).
The formation of N6-methyladenosine (m6A) is a
frequently occurring epigenetic modification that is essential for
mRNA splicing, export, translation and degradation, and has been
shown to play an important role in the occurrence and progression
of numerous malignancies (14).
Previous studies have demonstrated that lncRNAs regulate m6A
modifications in various types of cancer (15). Endoplasmic reticulum membrane
protein complex subunit 3 antisense RNA 1 (EMC3-AS1) is an
lncRNA located on chromosome 3q25. A correlation analysis performed
in our preliminary screening analysis (unpublished data) revealed
that the expression of EMC3-AS1 positively correlates with
that of m6A-associated genes in liver cancer, including
methyltransferase-like 3, RNA-binding motif protein 15B, YTH
N6-methyladenosine RNA-binding protein F1, heterogeneous nuclear
ribonucleoprotein A2/B1 and RNA-binding motif protein X-linked.
However, the expression and function of lncRNA EMC3-AS1 have
not yet been thoroughly explored in liver cancer.
In the current study, the differential expression of
EMC3-AS1 between liver cancer tissues and adjacent normal
(AN) liver tissues was identified by the analysis of data from The
Cancer Genome Atlas (TCGA) and three Gene Expression Omnibus (GEO)
datasets, and subsequently validated in a primary clinical cohort.
The potential association of EMC3-AS1 expression with the
prognosis and diagnosis of patients with liver cancer was then
explored. The tumor microenvironment (TME) was also compared
between liver cancer tissues with high (H) and low (L) expression
of EMC3-AS1. Additionally, EMC3-AS1 was silenced
using small interfering RNA (siRNA) in HepG2, Sk-Hep-1 and Huh-7
liver cancer cells, and cell proliferation, colony formation and
migration were evaluated in vitro.
Materials and methods
Data acquisition and expression
analysis
Gene expression data, comprising fragments per
kilobase of transcripts per million mapped reads, and the
respective clinical data of patients with liver cancer were
obtained from TCGA (http://cancergenome.nih.gov/). Subsequently, the
format of the gene expression data was converted into transcripts
per million reads values for analysis. In addition, three datasets
(GSE22058, GSE25097 and GSE64041) (16–18)
containing data on 428 tumor specimens and 451 AN specimens were
downloaded from the GEO database (https://www.ncbi.nlm.nih.gov/geo/) for the validation
of EMC3-AS1 expression (Table
SI). The expression of EMC3-AS1 was compared between
tumor and AN tissues in the datasets from TCGA and the GEO, and 50
pairs of liver cancer tissues and AN tissues from the same patients
in TCGA were compared as well.
Collection of patients and tissue
specimens
A total of 42 liver cancer and 35 AN tissues (at
least 2 cm away from the tumor edge) were acquired from patients
with liver cancer (n=42; mean age, 60.1 years; age range, 35–80
years) who underwent liver resection in Sichuan Provincial People's
Hospital (Chengdu, China) between January 2022 and September 2022.
Information on each patient is listed in Table SII. Patients in this study were
diagnosed with liver cancer by preoperative imaging examination or
biopsy, and their preoperative liver function was classified as
Child-Pugh grade A (19). None of
the patients underwent preoperative therapy. Patients with
cholangiocarcinoma or metastatic liver cancer were excluded. After
resection, all tissue specimens were promptly frozen in liquid
nitrogen and preserved at −80°C. The present study was conducted in
compliance with the Declaration of Helsinki and was approved by the
Ethics Committee of Sichuan Provincial People's Hospital (approval
no. 2022-2). Before surgery, all patients provided written informed
consent for the use of their tissue samples in the present
study.
RNA extraction and reverse
transcription-quantitative PCR (RT-qPCR)
Total RNA was isolated from liver cancer and normal
liver tissues using TRIzol® (Invitrogen; Thermo Fisher
Scientific, Inc.). A NanoDrop spectrophotometer (NanoDrop
Technologies; Thermo Fisher Scientific, Inc.) was utilized to
examine the yield and purity of the RNA samples. A 260/280 optical
density ratio of 1.8–2.2 was considered to indicate acceptable RNA
purity. Agarose gel electrophoresis was then conducted, and the
integrity and diffusion of the bands were examined to assess the
quality of the total RNA. Samples displaying RNA degradation during
collection were excluded to ensure the accuracy and reliability of
the experimental data. Subsequently, cDNA synthesis was conducted
using a PrimeScript™ RT Reagent kit with DNA Eraser
(Takara Bio, Inc.) according to the manufacturer's instructions.
qPCR was then conducted using
TB-Green®-Premix-Ex-Taq™-II (Takara Bio,
Inc.). EMC3-AS1 and GAPDH gene products were
amplified, with the latter serving as the reference gene. qPCR was
performed under the following conditions: 95°C for 30 sec, then 40
cycles of 95°C for 5 sec, 55°C for 30 sec and 72°C for 1 min,
followed by 95°C for 10 sec and 65°C for 5 sec. The primers used
were as follows: GAPDH forward, 5′-ACATCGCTCAGACACCATG-3′
and reverse, 5′-ACCAGAGTTAAAAGCAGCCC-3′; and EMC3-AS1
forward, 5′-TGCCTCAGTATCTGAACACAAG-3′ and reverse,
5′-TTGAGCCAGGGACATTTCTG-3′. Relative expression level was obtained
using the 2−Δ∆Cq method (20).
Prognostic and diagnostic value of
EMC3-AS1
Patients with liver cancer from TCGA were
categorized into H-EMC3-AS1 and L-EMC3-AS1 expression groups
according to the median EMC3-AS1 expression value.
Kaplan-Meier analysis and the log-rank test were used to compare OS
and disease-free survival (DFS) between the H- and L-EMC3-AS1
expression groups using the survival (version 3.3) package in the R
platform. The pROC (version 1.18) (21) package was used to perform receiver
operating characteristic (ROC) curve analysis on the aforementioned
datasets and the present cohort.
Functional enrichment analysis
Gene set variation analysis (GSVA) was performed to
assess the variation of pathways between the H- and L-EMC3-AS1
expression groups using the GSVA (version 1.44.2) package in R
(22), and the data were displayed
using heatmaps. Hallmark and Kyoto Encyclopedia of Genes and
Genomes (KEGG) gene sets were acquired from MSigDB (23). Gene set enrichment analysis (GSEA)
was carried out to determine the differential functional phenotype
between the H- and L-EMC-AS1 expression groups using the
clusterProfiler (version 4.4.4) (24) package. A false discovery rate (FDR)
of <0.05 was used as the cut-off threshold for significantly
enriched gene sets. The limma (version 3.52.1) (25) package was employed to identify
differentially expressed mRNAs (DEmRNAs) between the H- and
L-EMC-AS1 expression groups. Genes with a |log2 fold-change
(FC)|>1 and FDR <0.05 were selected as DEmRNAs. Gene Ontology
(GO) and KEGG pathway analyses were performed using the
clusterProfiler package. Adjusted P<0.05 was used as the cut-off
threshold for GO terms and KEGG pathways.
Analysis of EMC3-AS1 as a risk factor
for OS and its association with clinicopathological features
Univariate and multivariate Cox regression analyses
were conducted to screen for the risk factors for poor prognosis
(shorter OS time) in patients with liver cancer. Subgroup analyses
for EMC3-AS1 expression were conducted based on age, sex,
tumor stage, pathological stage, tumor grade, Child-Pugh stage,
bilirubin level, α-fetoprotein (AFP) level and vascular invasion
status. The 7th American Joint Committee on Cancer staging system
was used for staging (26).
Association of EMC3-AS1 expression
with tumor-infiltrating immune cells (TIICs)
CIBERSORT (version 1.06) (27) is a deconvolution algorithm used to
distinguish 22 human immune cell subtypes based on the gene
expression in complex tissues. The CIBERSORT algorithm was used to
determine the fraction of TIICs in the tumor environment, and the
associations between the infiltration of 22 subtypes of immune
cells and EMC3-AS1 expression in liver cancer were determined.
Immune checkpoint (IC) inhibitors (ICIs) have
markedly changed cancer treatment in recent decades (28). Thus, the mRNA expression levels of
35 ICs, such as cytotoxic T-lymphocyte antigen 4 (CTLA4),
programmed cell death protein 1 (PDCD1), CD86, CD274,
CD276, hepatitis A virus cellular receptor 2 (HAVCR2),
lymphocyte-activation gene 3 (LAG3), galectin 9
(LGALS9), neuropilin 1 (NRP1) and T cell
immunoreceptor with Ig and ITIM domains (TIGIT), among
others, were compared between the H- and L-EMC-AS1 expression
groups in the present study.
The activity of cancer stem cells (CSCs) can be
quantified using the mRNA stemness index (mRNAsi) and
epigenetically regulated mRNAsi (EREG-mRNAsi) (29), which reflect the dedifferentiation
capacity of CSCs. Therefore, the score of mRNAsi and EREG-mRNAsi
obtained from previous research (29) were compared between the H- and
L-EMC3-AS1 expression groups. Pearson's correlation analysis was
applied to investigate the correlations between the expression of
EMC3-AS1 and mRNAsi or EREG-mRNAsi. Furthermore, ESTIMATE score,
immune score and stromal score generated by ESTIMATE algorithm
(30) could reflect tumor immune
infiltration level. These scores of patients with liver cancer in
TCGA were obtained from the ESTIMATE database (https://bioinformatics.mdanderson.org/estimate/) and
were compared between H- and L-EMC3-AS1 expression groups,
respectively. Additionally, the activities of 13 immune-associated
pathways were evaluated using the single-sample GSEA (ssGSEA)
algorithm in GSVA (version 1.44.2) package (21), and comparisons between the H- and
L-EMC3-AS1 expression groups were made.
Therapeutic correlation analyses
The immunophenoscore (IPS) is a scoring scheme
ranging from 0 to 10 that reflects the response of patients with
cancer to anti-CTLA4 and anti-programmed cell death protein 1
(PD-1) therapy (31). IPSs were
obtained from The Cancer Immunome Atlas (TCIA; http://tcia.at/home), and were compared between the H-
and L-EMC3-AS1 expression groups to assess the association between
immunotherapy response and EMC3-AS1 expression in liver
cancer.
The tumor immune dysfunction and exclusion (TIDE)
scoring scheme (32) is a predictor
of the response to IC blockade in patients with cancer. The TIDE
score of patients with liver cancer was computed using the TIDE
online tool (http://tide.dfci.harvard.edu), and the TIDE scores of
the H- and L-EMC3-AS1 expression groups were compared. Furthermore,
the oncoPredict (version 0.2) package (33) was used to compute the half-maximal
inhibitory concentrations of various chemotherapeutic and molecular
targeted drugs for the treatment of liver cancer, and the
difference in drug sensitivity between the H- and L-EMC3-AS1
expression groups was then compared.
Cell culture, transfection and
treatment
HepG2, Sk-Hep-1 and Huh-7 cells were obtained from
The Cell Bank of Type Culture Collection of The Chinese Academy of
Sciences and were authenticated using STR profiling. The HepG2 and
Huh-7 cell lines were cultured in high-glucose DMEM (Gibco; Thermo
Fisher Scientific, Inc.) containing 10% FBS (Biological Industries;
Sartorius AG) and 1% streptomycin-penicillin (Biological
Industries; Sartorius AG), while the Sk-Hep-1 cells were cultured
in minimum essential medium (Gibco; Thermo Fisher Scientific, Inc.)
containing 10% FBS and 1% streptomycin-penicillin. Cells were
maintained in a 37°C incubator with 5% CO2.
The HepG2, Sk-Hep-1 and Huh-7 cells were transfected
with siRNAs (Shanghai GenePharma Co., Ltd.) using
Lipofectamine® 2000 (Invitrogen; Thermo Fisher
Scientific, Inc.) at a final concentration of 200 nM. After 48 h of
transfection at 37°C, total RNA was extracted. The efficacy of the
siRNA transfection was assessed to determine the interference
efficiency. The siRNAs demonstrating the highest interference
efficacy were chosen for further analyses. The siRNA sequences were
as follows: EMC3-AS1-negative control (NC) sense,
5′-UUCUCCGAACGUGUCACGUTT-3′ and antisense,
5′-ACGUGACACGUUCGGAGAATT-3′; EMC3-AS1-1739 sense,
5′-GUGCCACCAUGGAUAUUCATT-3′ and antisense,
5′-UGAAUAUCCAUGGUGGCACTT-3′; EMC3-AS1-2842 sense,
5′-CCACCAGAUAUACCACUAUTT-3′ and antisense,
5′-AUAGUGGUAUAUCUGGUGGTT-3′.
Colony formation assay
Following transfection, the HepG2, Sk-Hep-1 and
Huh-7 cells (2,000 cells/well) were independently cultured in
6-well plates and incubated for 14 days. Subsequently, the cells
were fixed with 4% paraformaldehyde for 20 min at room temperature
and stained with crystal violet (0.5%; Sigma-Aldrich; Merck KGaA)
for 15–20 min at room temperature. A cluster with >50 cells was
defined as a colony. Colony numbers were calculated using ImageJ
software (Version 1.52; National Institutes of Health), and
representative images were captured.
Cell proliferation assay
To detect cell proliferation, MTT (Sigma-Aldrich;
Merck KGaA) was added to transfected HepG2, Sk-Hep-1 and Huh-7
cells. The cells (4,000 cells/well) were seeded in a 96-well plate
(100 µl/well) and cultured. After 24, 48, 72 or 96 h of
transfection, 100 µl MTT was added and the cells were incubated for
another 4 h. Next, the supernatant was removed, and DMSO was added
(150 µl/well). The absorbance at 490 nm was recorded using a
microplate reader after shaking on an orbital shaker for 10
min.
Wound healing assay
Transfected cells were plated in a 6-well culture
plate after transfection. Upon reaching >90% cell confluence,
the wound was gently scraped with a 100-µl pipette tip and a
sterile ruler. After scraping, the cells were rinsed three times
with PBS to eliminate the detached cells, and 2 ml DMEM containing
2% FBS was added to each well followed by incubation. Images were
captured and the migration distance was measured by comparing the
images at 0 h and after culturing the cells for 24 h. An inverted
microscope (Olympus Corporation) was used to calculate the number
of migrated cells.
Transwell assay
Cell suspensions containing 5×10⁴ cells
were added to the upper chamber of a 24-well culture plate with
Transwell inserts and incubated with serum-free DMEM (200 µl) at 24
h post-transfection. In the lower chamber of the 24-well plates,
500 µl complete DMEM was added. Following 24 h of incubation at
37°C, the chambers were removed and rinsed once with sterile PBS.
Cells on the upper side were wiped away with a cotton swab. The
remaining cells were fixed for 15 min and stained with crystal
violet (0.5%) for 20 min at room temperature. Finally, a light
microscope was employed to collect images and count the number of
migrated cells.
Statistical analysis
Statistical analysis and plotting were performed in
R software (version 4.0) and GraphPad Prism (version 8.0;
Dotmatics). Univariate and multivariate Cox regression analyses
were used to identify prognostic factors associated with OS.
Survival curves were generated and compared between different
EMC3-AS1 expression groups using Kaplan-Meier analysis and the
log-rank test. For continuous variables with non-normal
distributions, Wilcoxon rank-sum test was applied for comparing
differences between two independent groups, while Wilcoxon
signed-rank test was used for paired groups. All experiments were
performed in triplicate. Data from the experiments are expressed as
the mean ± standard deviation. Differences among multiple groups
were compared by one-way analysis of variance followed by Dunnett's
post hoc test. P<0.05 was considered to indicate a statistically
significant result.
Results
EMC3-AS1 is upregulated in liver
cancer tissues
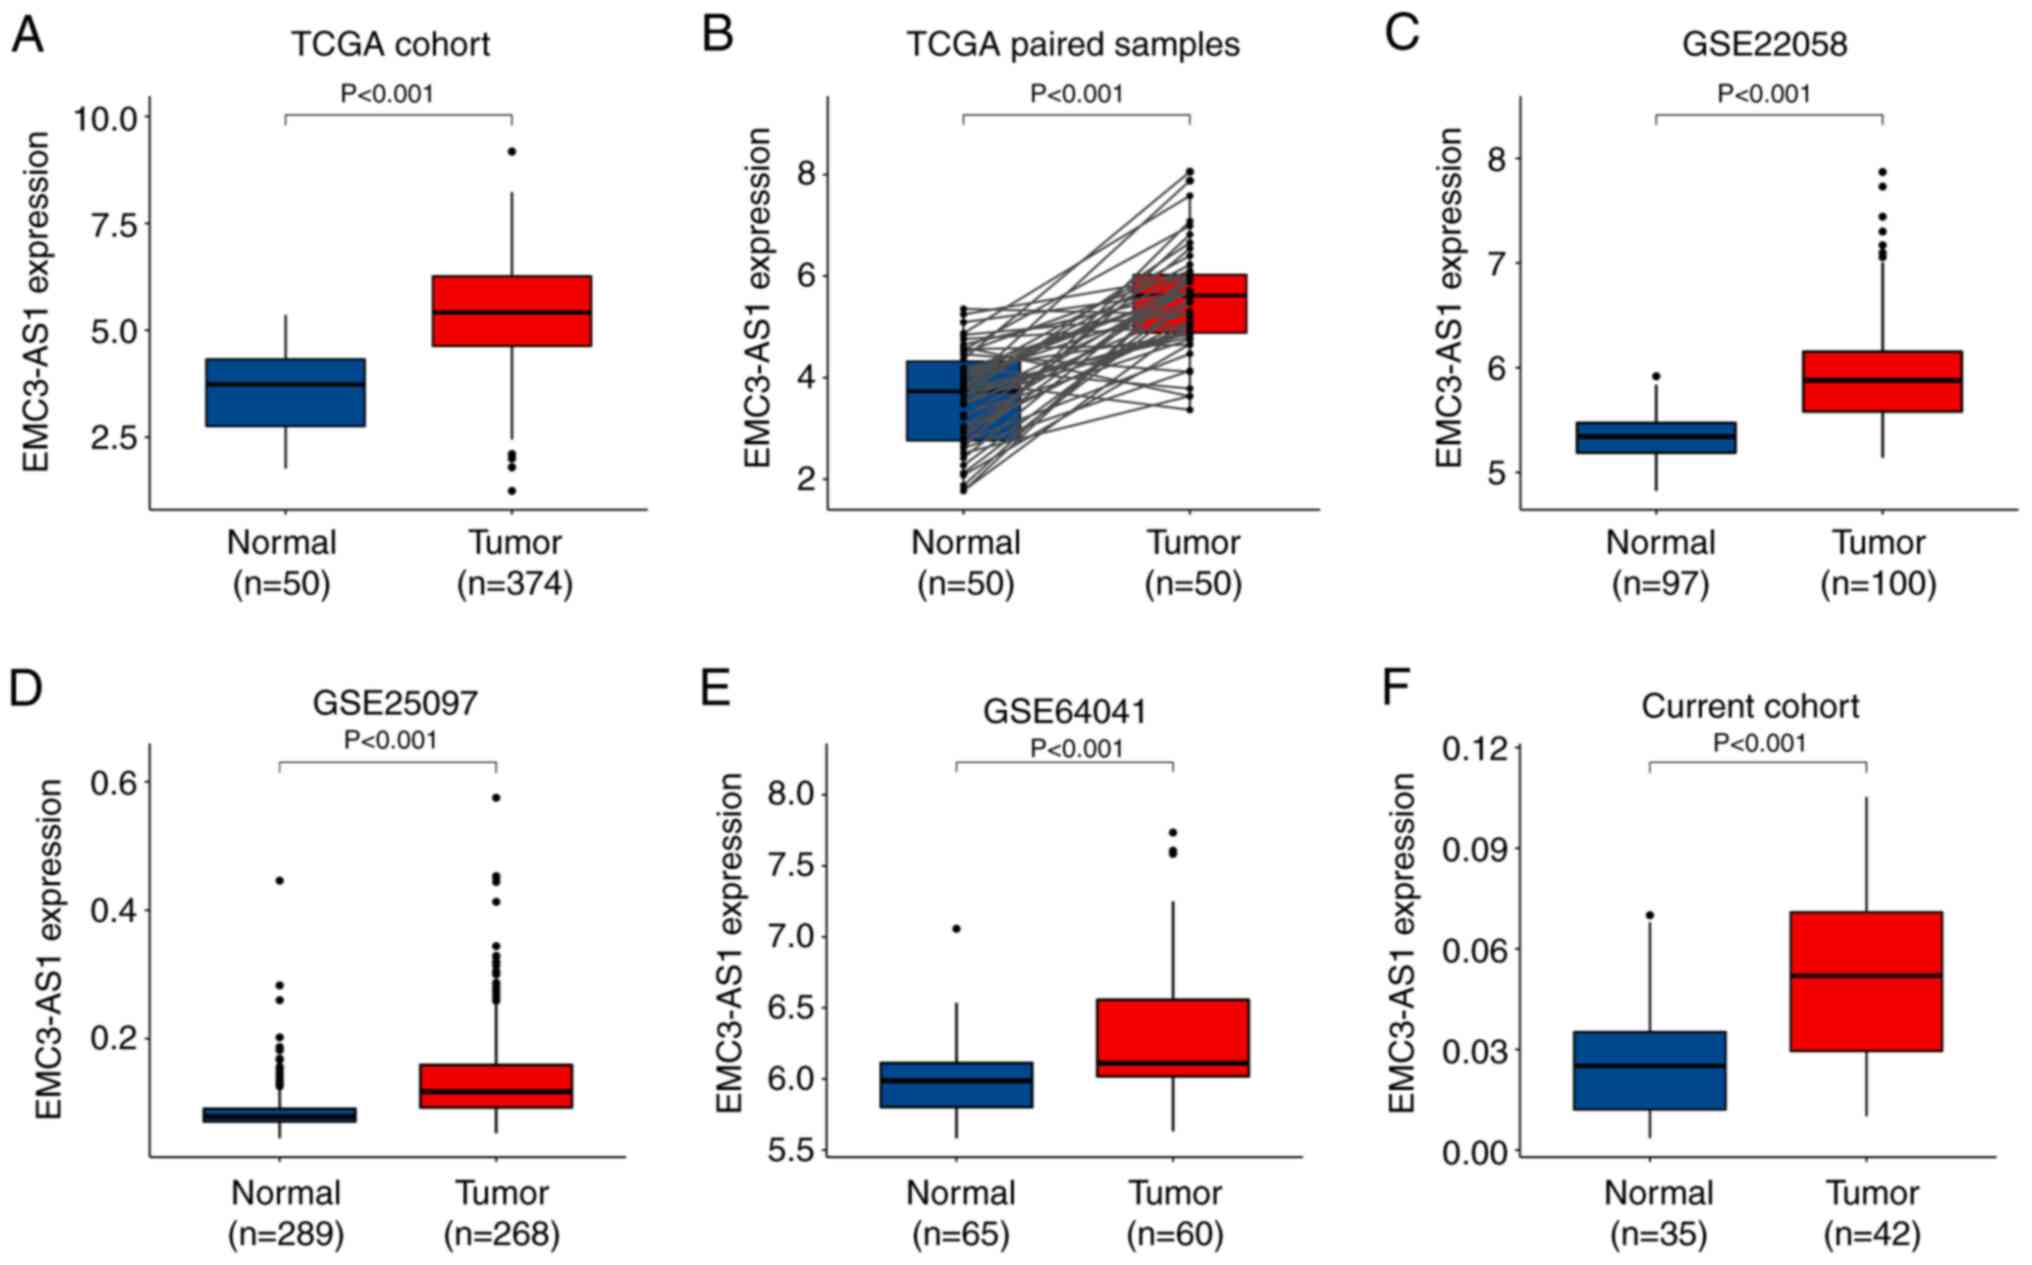
Analysis of data from TCGA revealed a significant
upregulation of EMC3-AS1 in 374 liver cancer tissues
compared with that in 50 AN tissues, as well as in 50 paired liver
cancer samples compared with AN tissues (P<0.001; Fig. 1A and B). EMC3-AS1
upregulation was also evident in the tumor tissues in the three GEO
datasets containing 428 liver cancer and 451 AN tissues
(P<0.001; Fig. 1C-E). In
addition, based on the results of RT-qPCR analysis of the current
study cohort, EMC3-AS1 expression was upregulated in the 42
liver cancer tissues compared with that in the 35 AN liver tissues
(P<0.001; Fig. 1F).
EMC3-AS1 is both an unfavorable
prognostic biomarker and an effective diagnostic biomarker
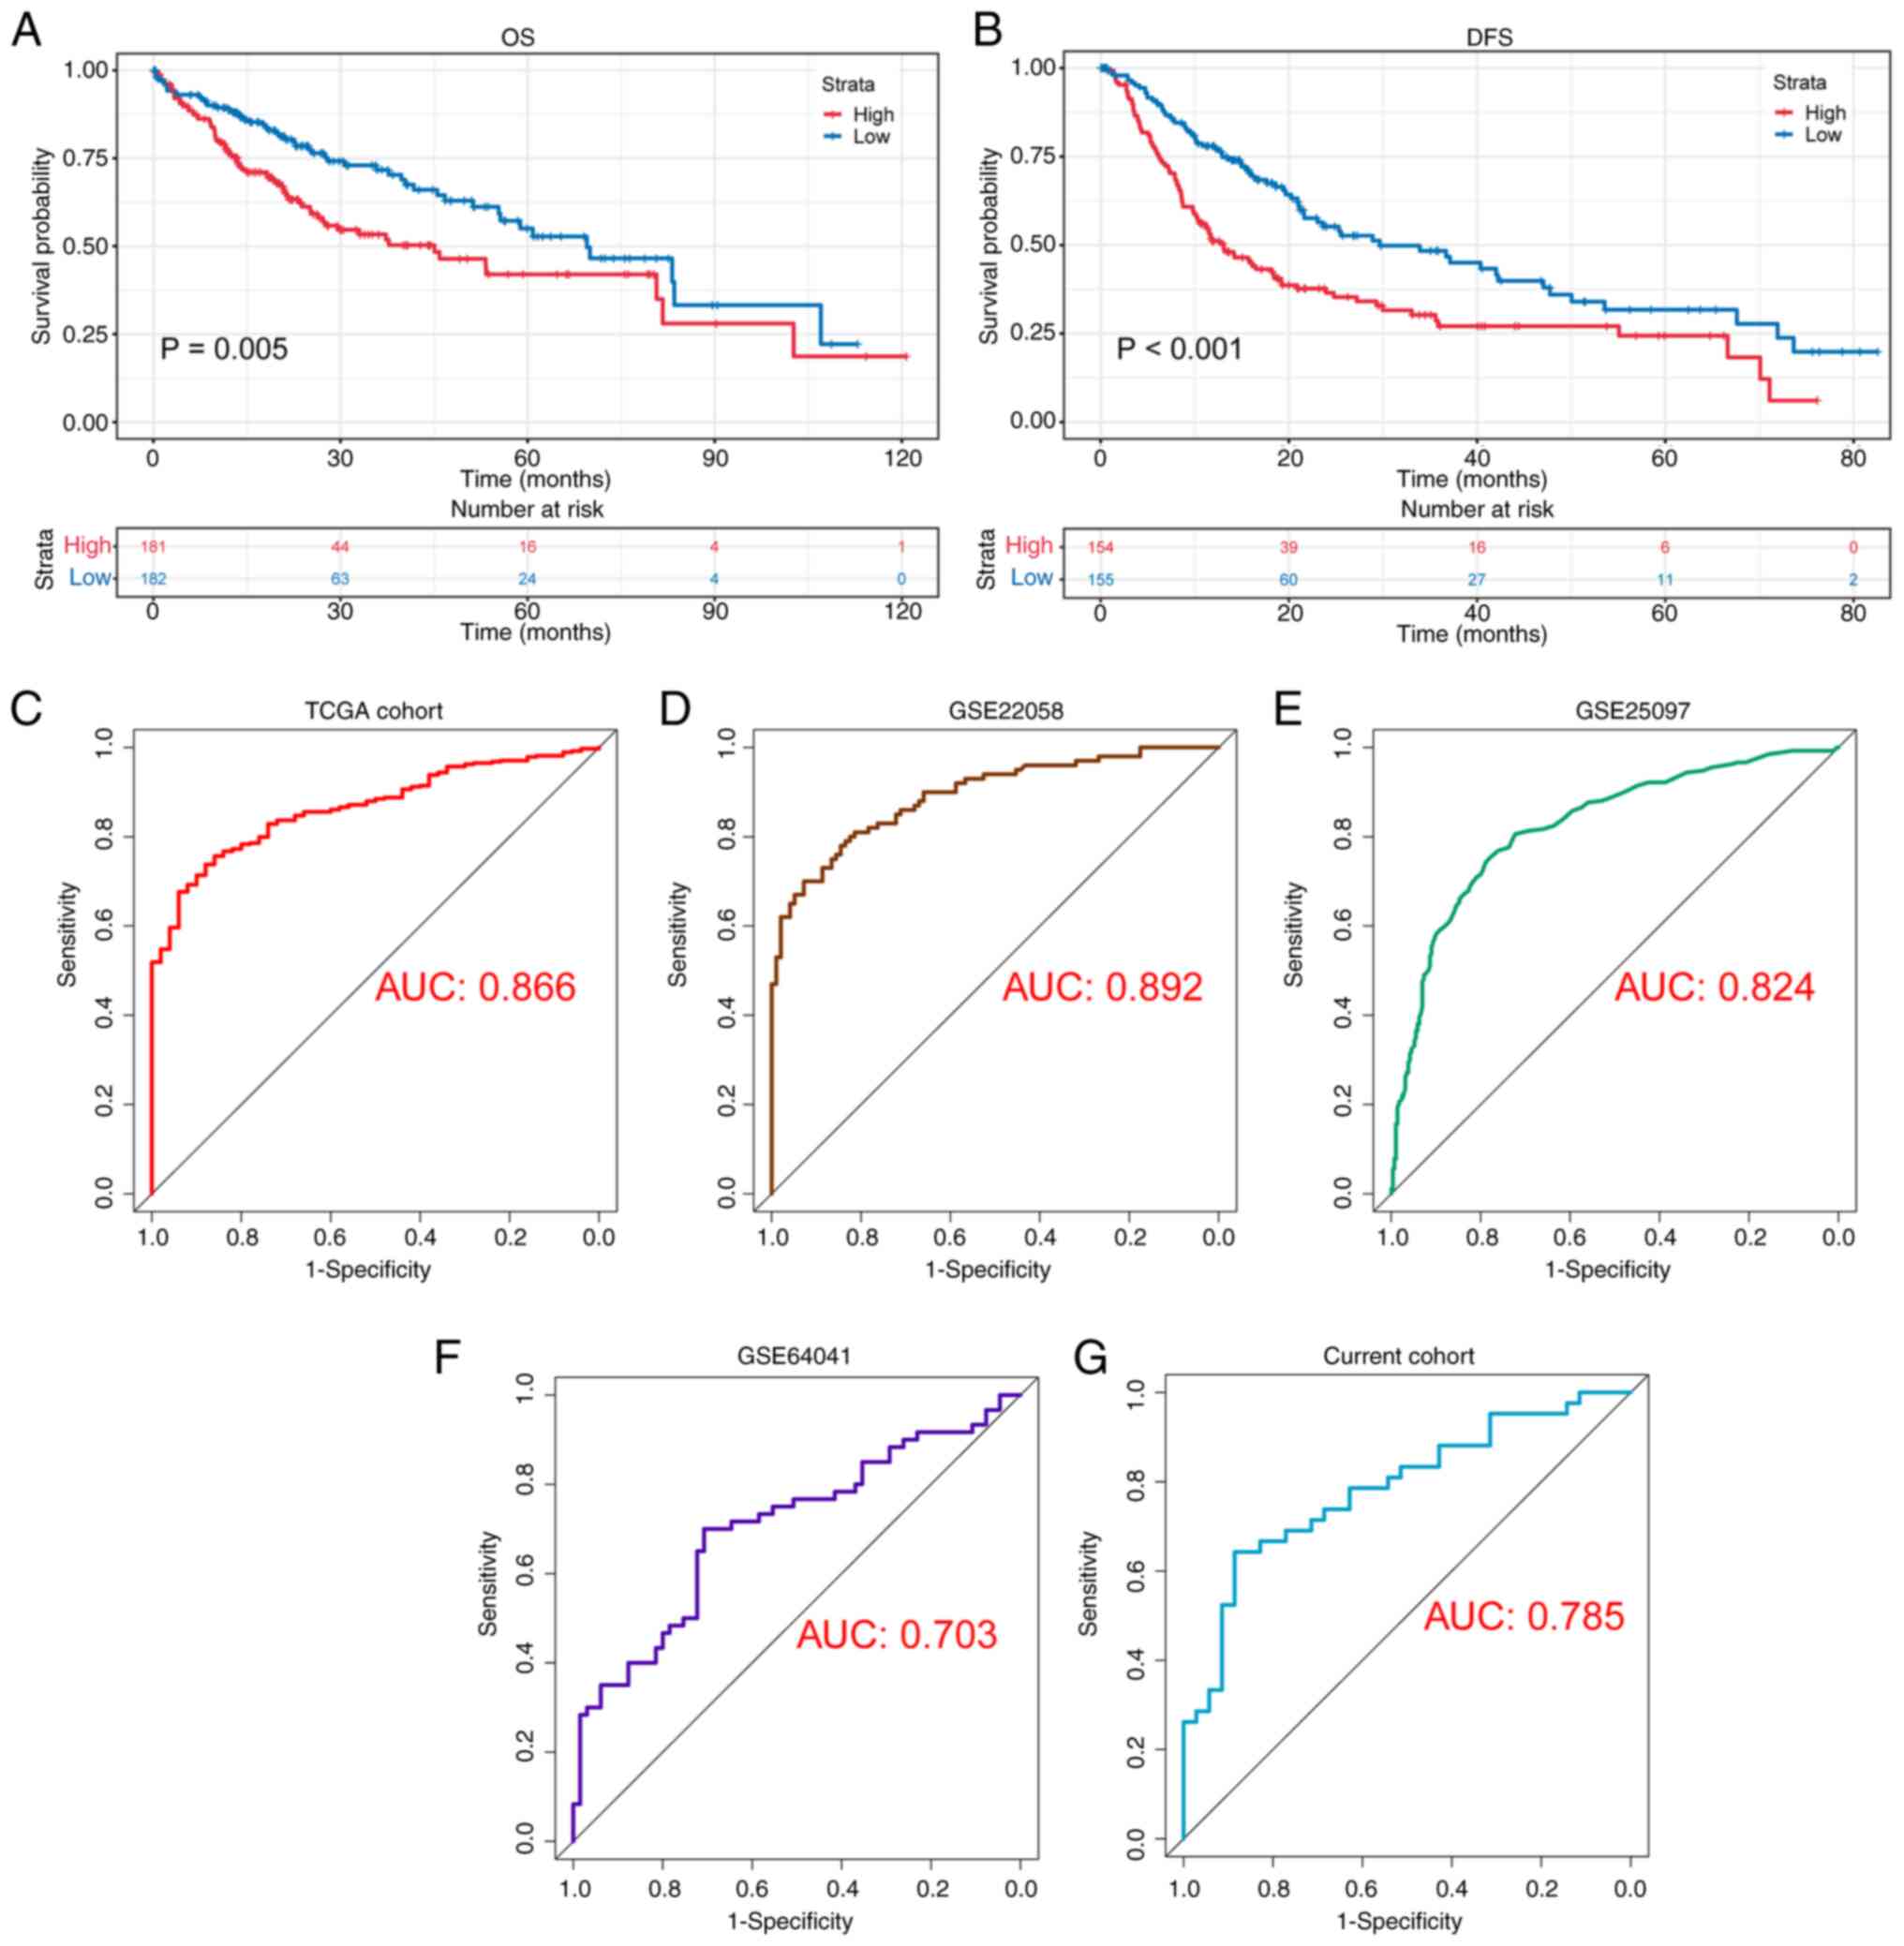
Kaplan-Meier analysis revealed that the patients in
the H-EMC3-AS1 group exhibited shorter OS (P=0.005) and DFS times
(P<0.001) compared with those in the L-EMC3-AS1 group (Fig. 2A and B). In the ROC analysis based
on EMC3-AS1 expression in HCC and adjacent tissues, the area
under the curve (AUC) in TCGA cohort was 0.866 (Fig. 2C). The good performance of
EMC3-AS1 was validated in the GEO datasets GSE22058,
GSE25097 and GSE64041, with AUCs of 0.892, 0.824 and 0.703,
respectively (Fig. 2D-F). In
addition, ROC analysis was conducted to examine the ability of
EMC3-AS1 expression to distinguish liver cancer in the
current study cohort. Notably, it was found that EMC3-AS1
exhibited good diagnostic ability, with an AUC of 0.785 (Fig. 2G).
EMC3-AS1 is a significant prognostic
factor
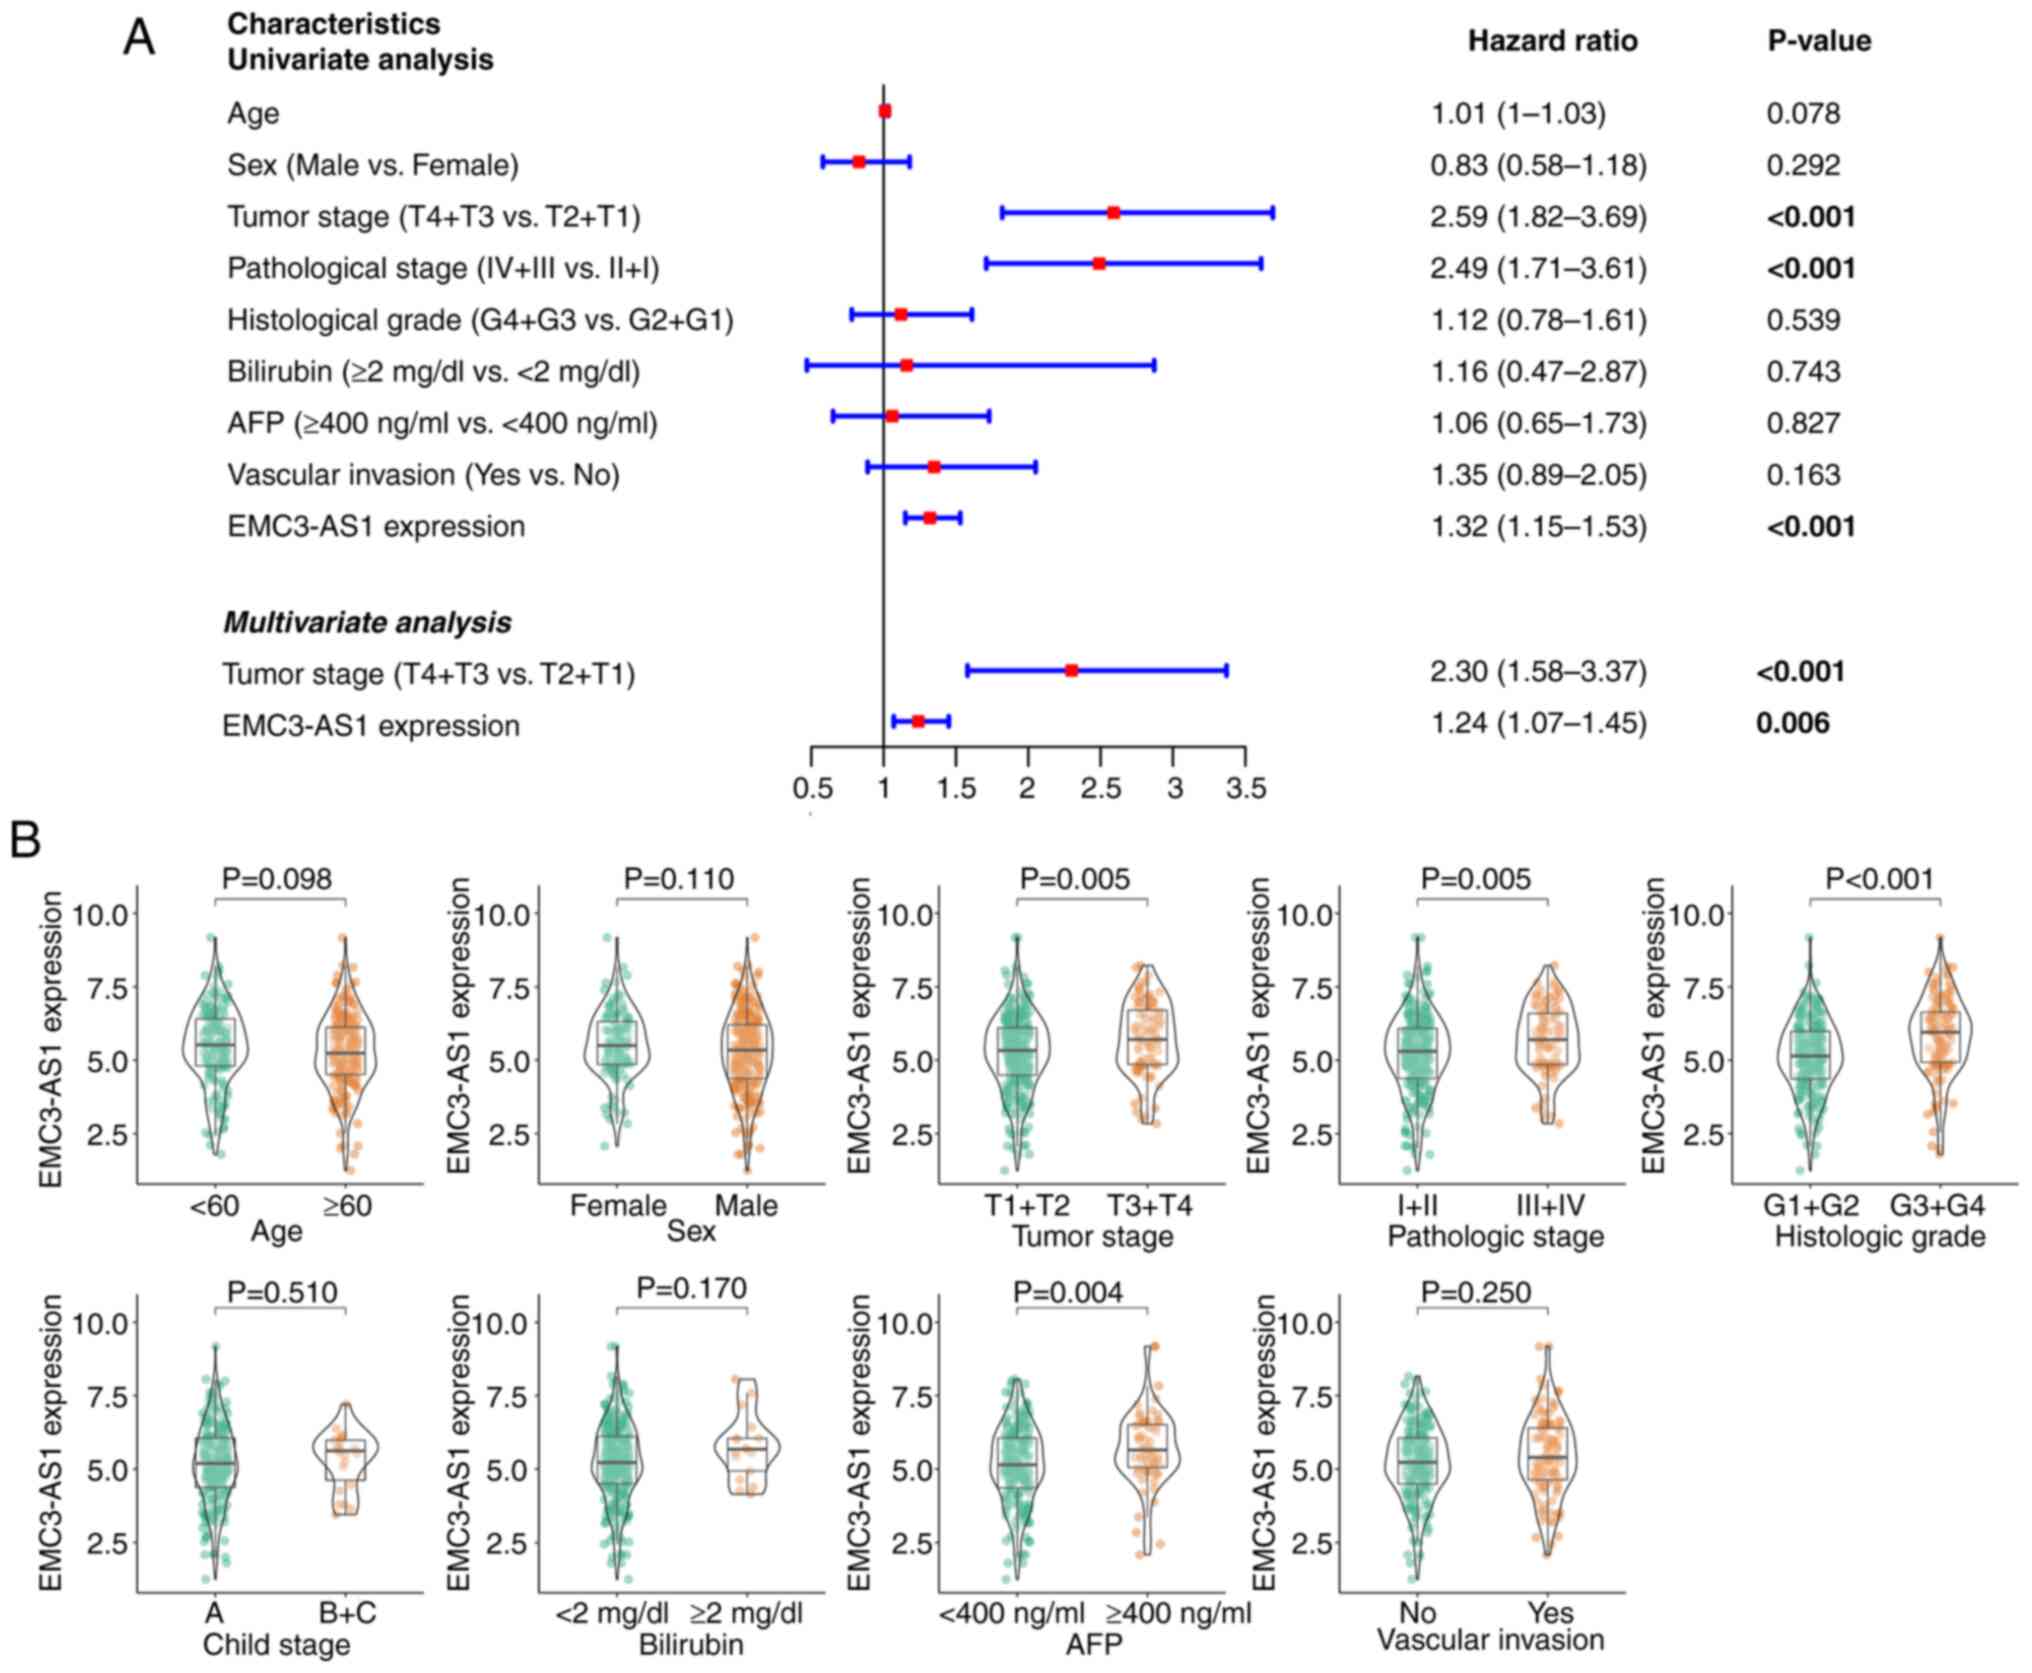
The univariate Cox regression analysis (Fig. 3A) indicated that poor prognosis was
associated with the expression of EMC3-AS1 [hazard ratio
(HR), 1.32; 95% confidence interval (CI), 1.15–1.53; P<0.001],
tumor stage (HR, 2.59; 95% CI, 1.82–3.69; P<0.001) and
pathological stage (HR, 2.49; 95% CI, 1.71–3.61; P<0.001). In
the multivariate Cox regression analysis (Fig. 3A), shorter OS time was found to be
independently associated with the expression of EMC3-AS1
(HR, 1.24; 95% CI, 1.07–1.45; P=0.006) and advanced tumor stage
(HR, 2.30; 95% CI, 1.58–3.37; P<0.001). In the subgroup
analysis, patients with liver cancer who had an advanced tumor
stage (P=0.005), advanced pathological stage (P=0.005), advanced
histological grade (P<0.001) and higher AFP level (P=0.004) were
found to have significantly elevated EMC3-AS1 expression
levels (Fig. 3B). However, no
notable differences in EMC3-AS1 expression were observed
between the subgroups based on age, sex, Child-Pugh stage,
bilirubin level or vascular invasion status.
Functional enrichment analysis
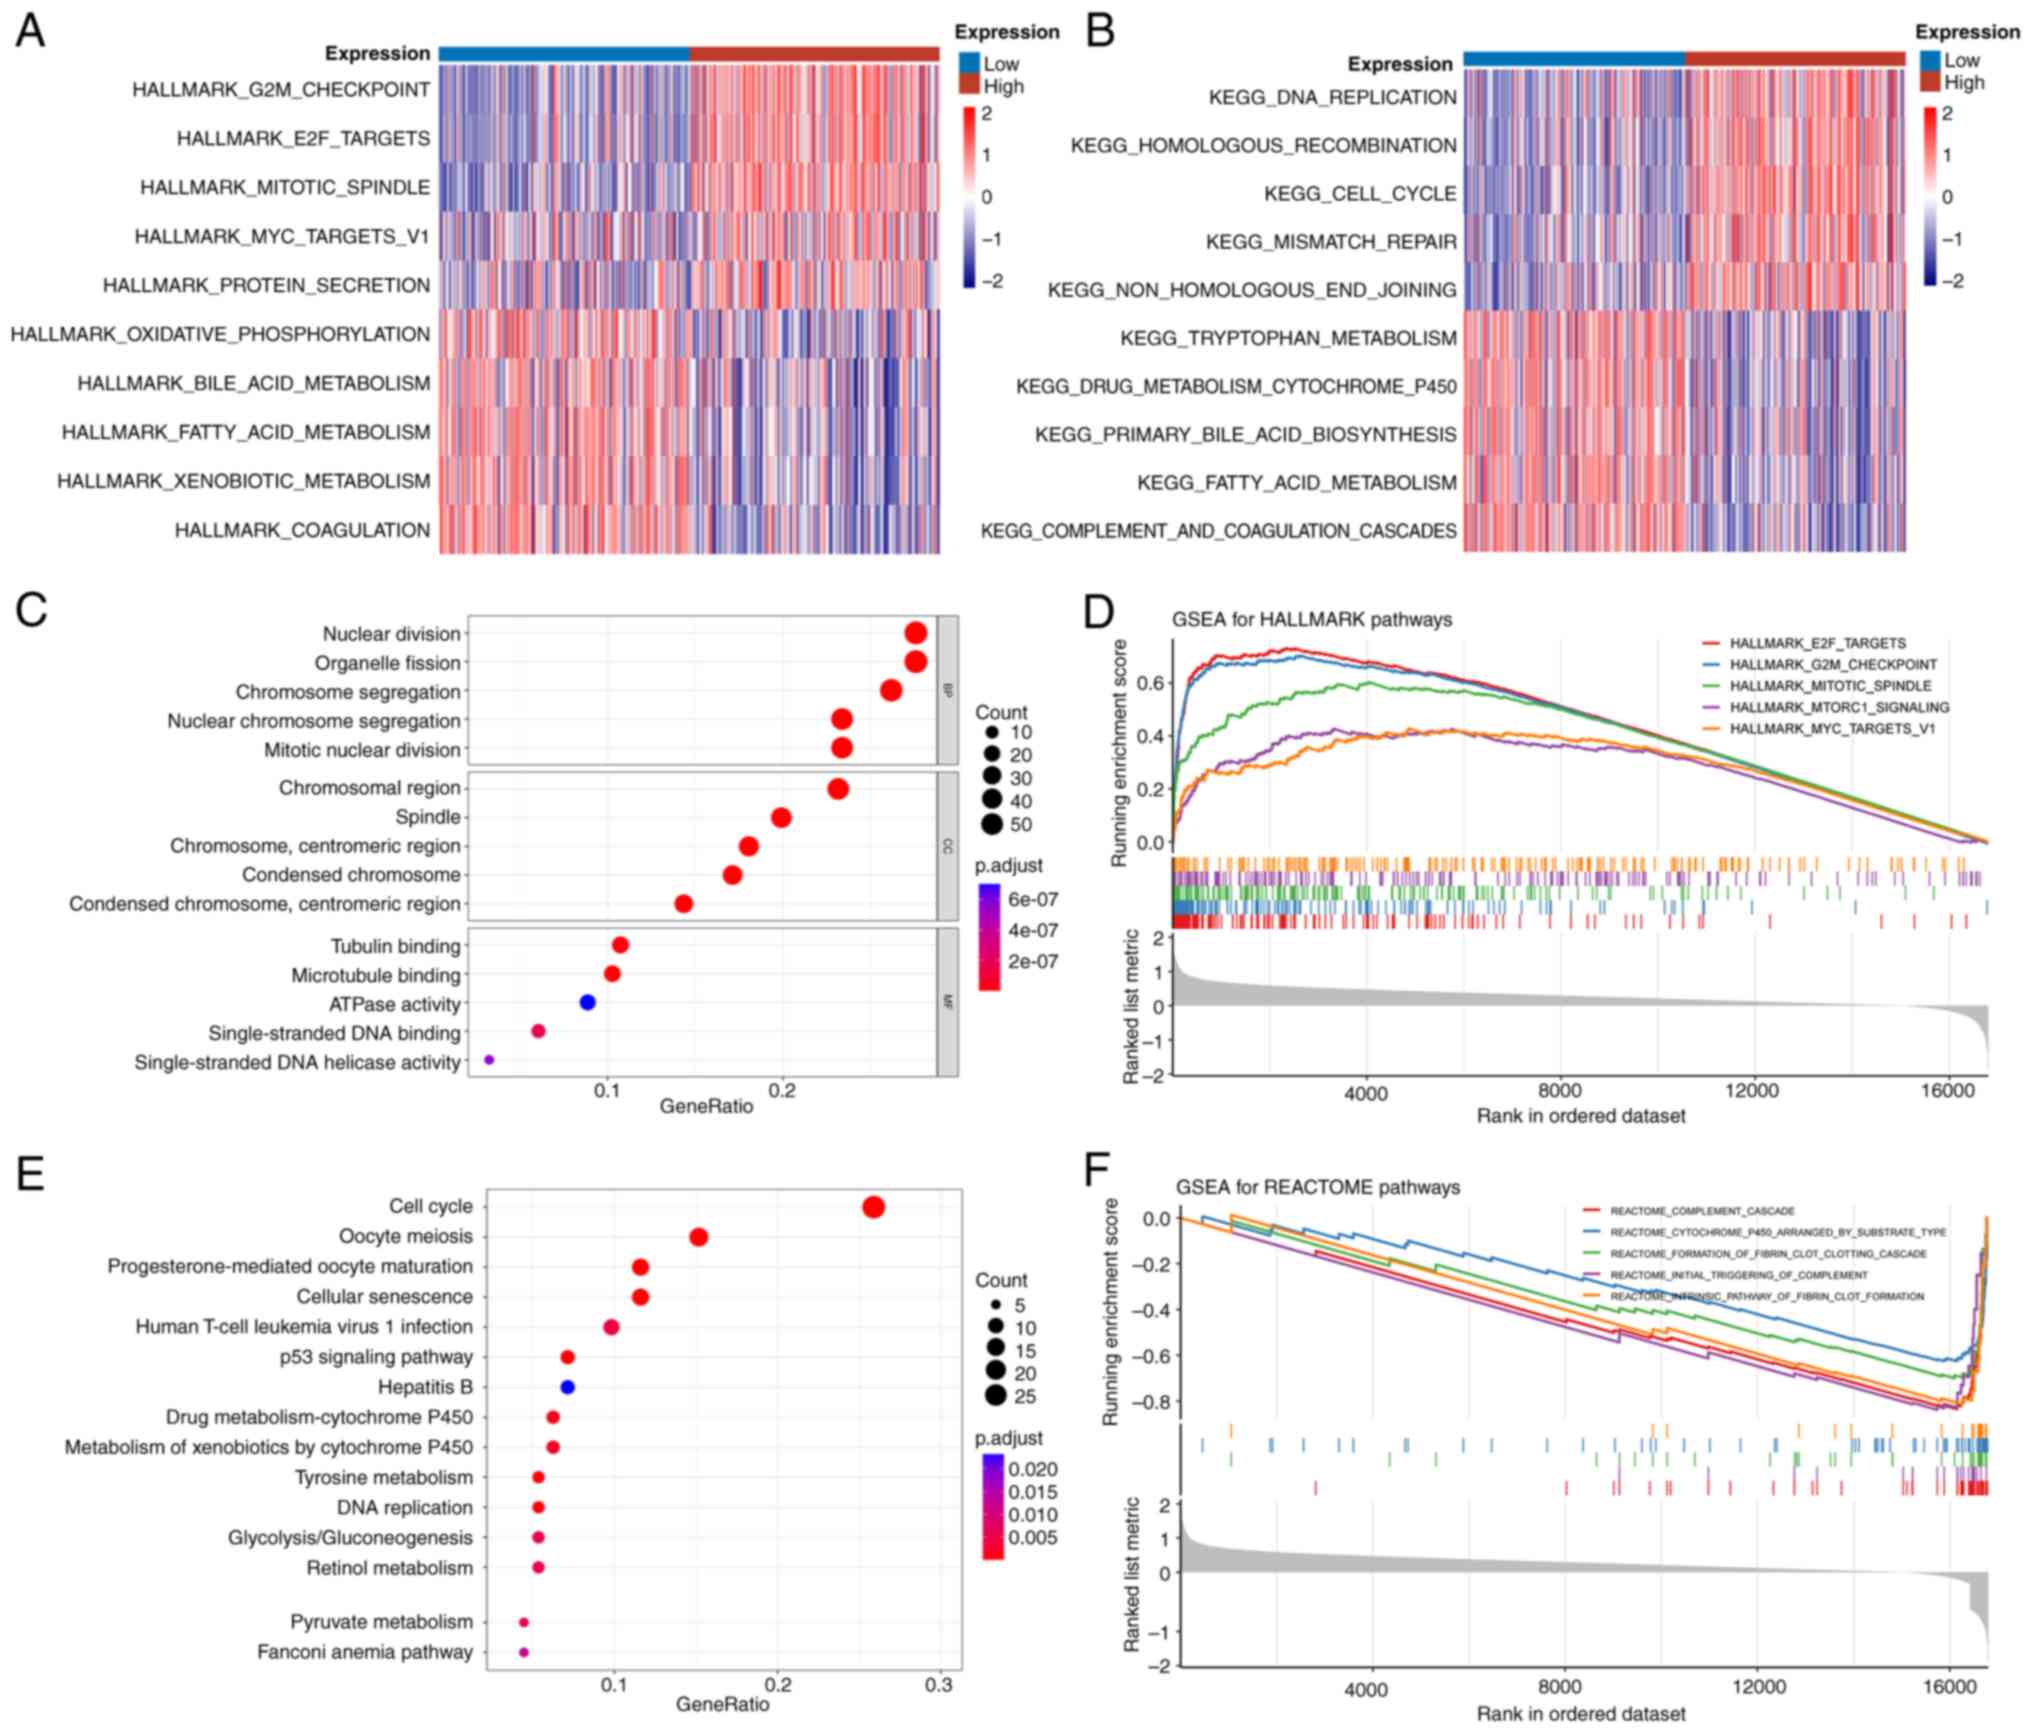
According to the result of GSVA, the Hallmark gene
sets ‘G2M checkpoint’, ‘E2F targets’ and ‘mitotic
spindle’ were markedly activated in the H-EMC3-AS1
expression group (Fig. 4A). In the
KEGG gene sets, pathways associated with cell division and
proliferation, including ‘DNA replication’ and ‘cell cycle’, were
markedly enriched in the H-EMC3-AS1 expression group (Fig. 4B). A total of 222 DEmRNA (180
upregulated and 42 downregulated genes) were identified between the
H- and L-EMC3-AS1 expression groups. For these DEGs, GO enrichment
analysis revealed that ‘nuclear division’, ‘chromosomal region’ and
‘tubulin binding’ were the most enriched terms in the biological
process, cellular component and molecular function categories
(Fig. 4C; Table SIII). ‘Progesterone-mediated oocyte
maturation’, ‘cell cycle’ and ‘oocyte meiosis’ were found to be the
most highly enriched pathways in the KEGG pathway enrichment
analysis (Fig. 4E; Table SIV).
In the GSEA, ‘E2F targets’, ‘G2M
checkpoint’ and ‘mitotic spindle’ were the top three enriched
pathways in the Hallmark gene sets, while ‘intrinsic pathway of
fibrin clot formation’, ‘cytochrome p450 arranged by substrate
type’ and ‘formation of fibrin clot clotting cascade’ were the most
enriched Reactome gene sets (Fig. 4D
and F).
Association of EMC3-AS1 expression
with immune status
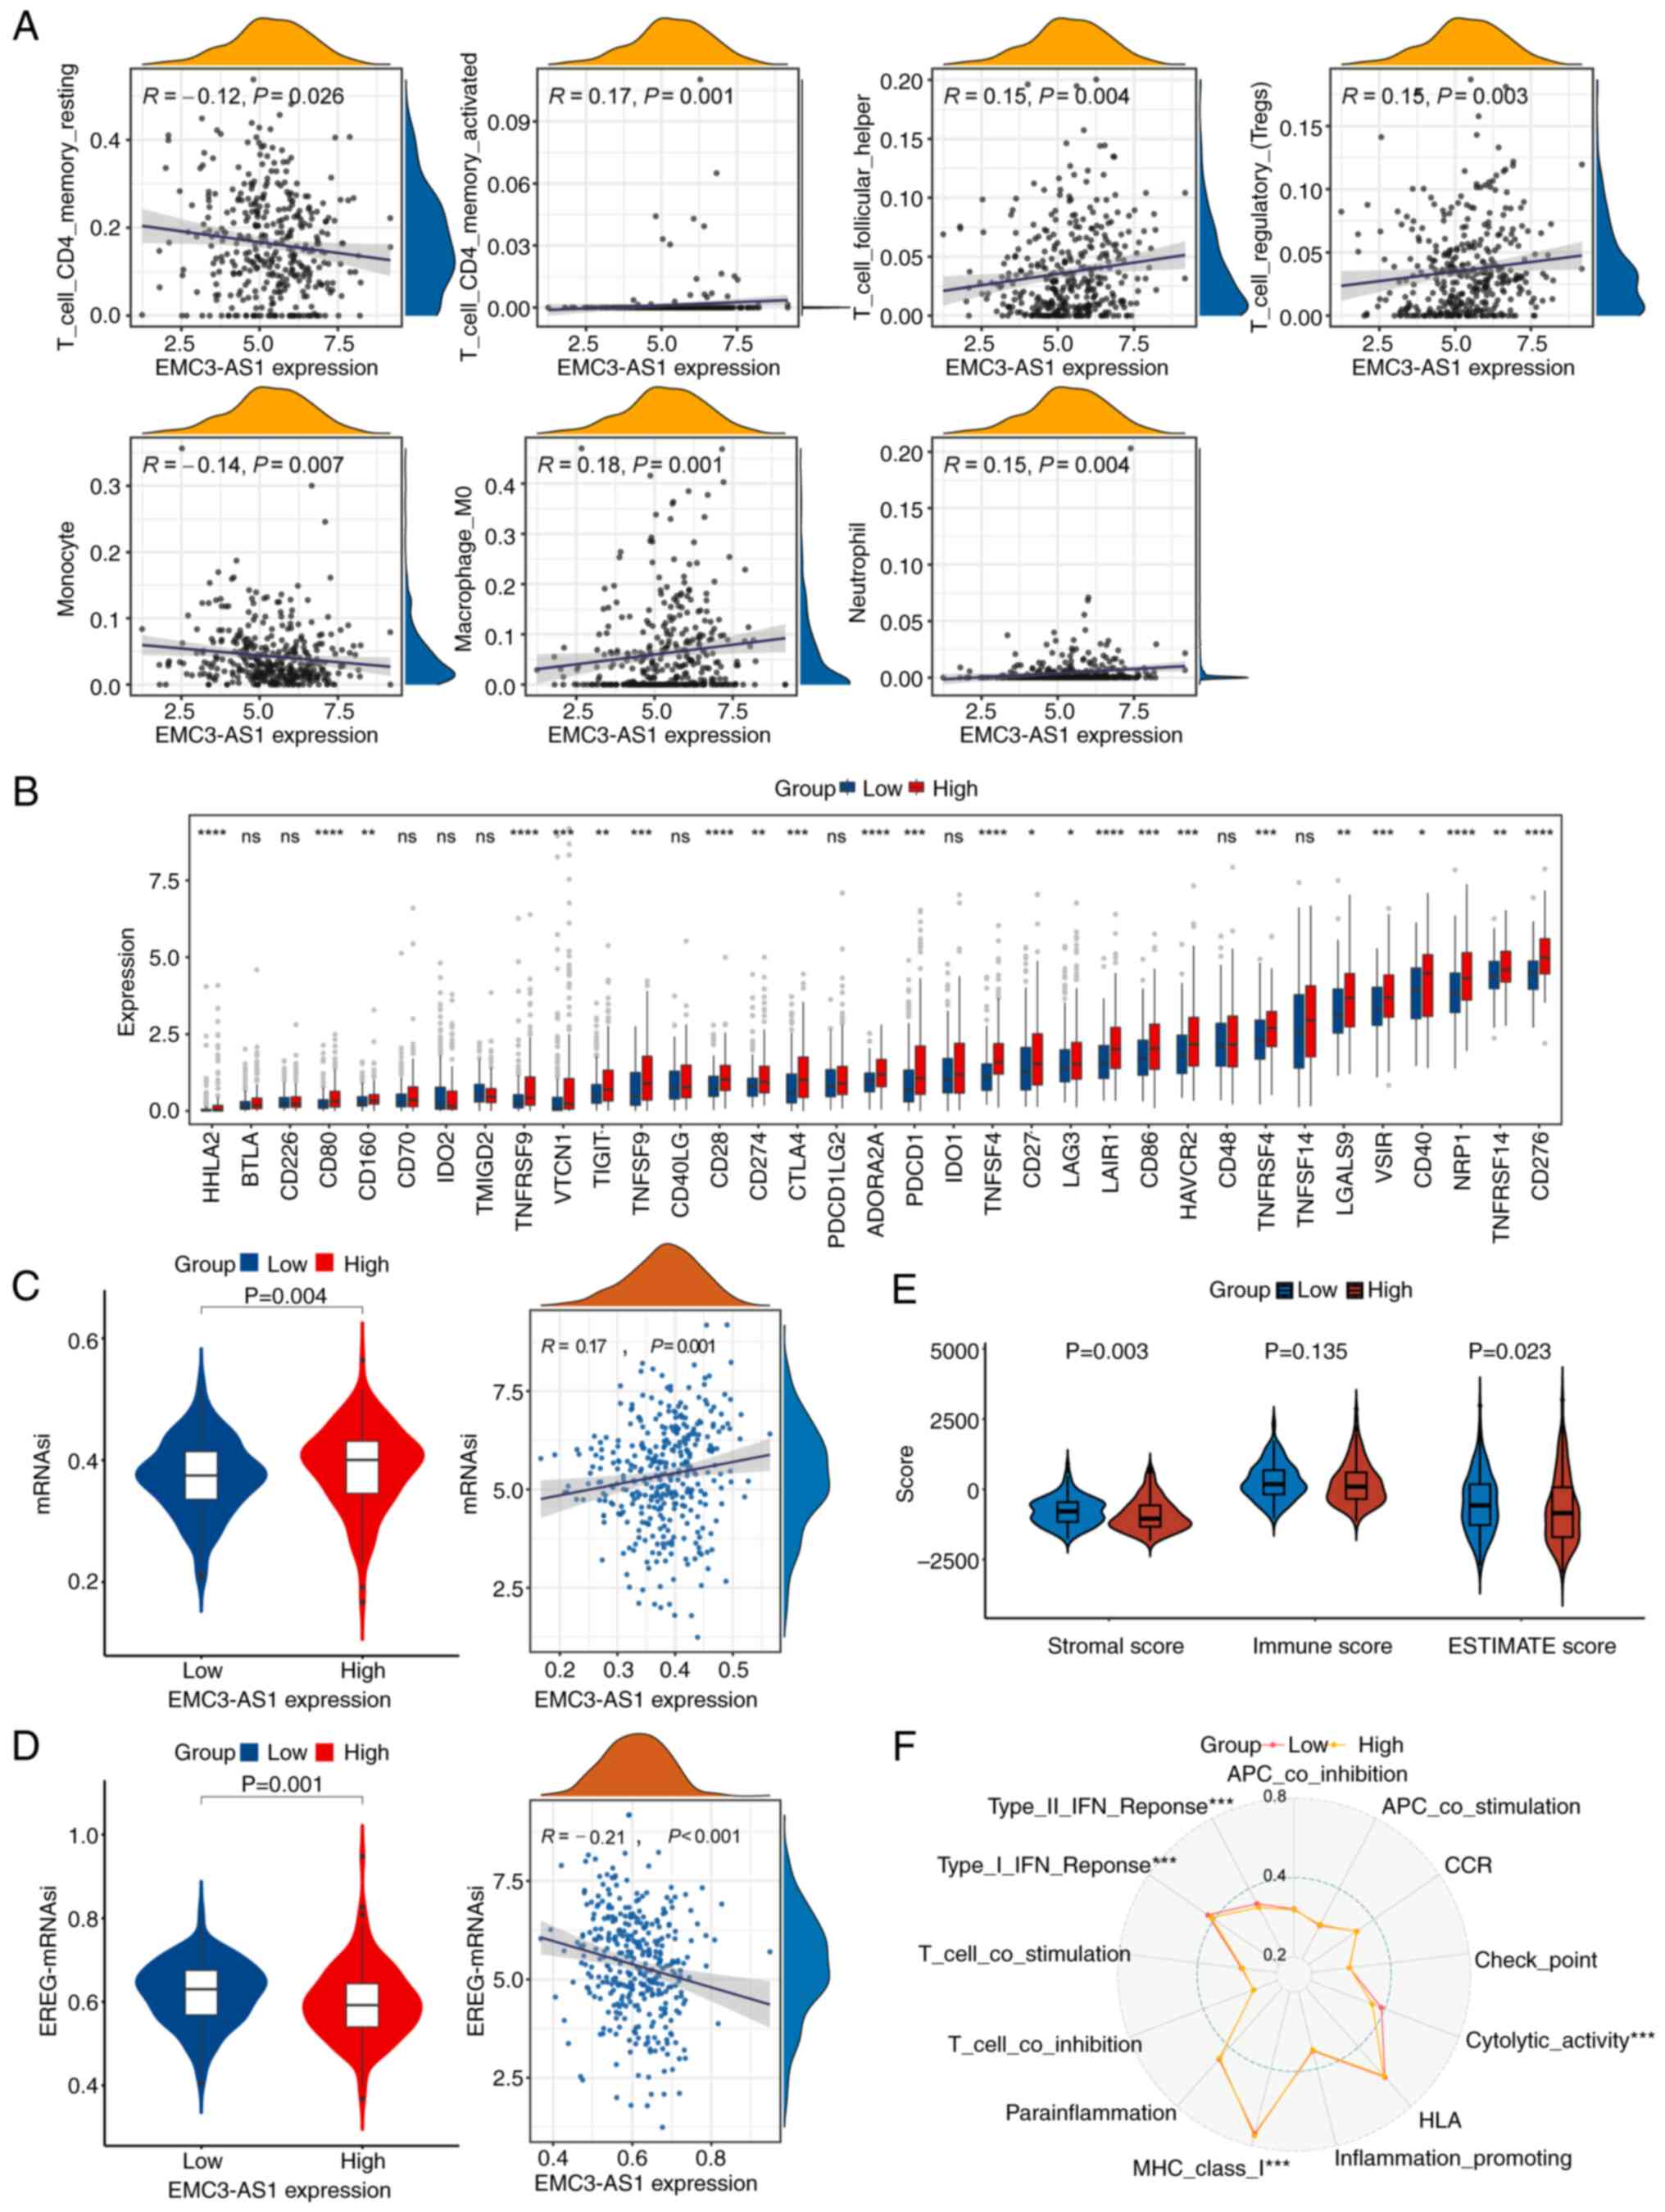
The expression of EMC3-AS1 was found to be
positively correlated with the infiltration of activated memory CD4
T cells (R=0.17, P=0.001), follicular helper T cells (R=0.15,
P=0.004), regulatory T cells (R=0.15, P=0.003), M0 macrophages
(R=0.18, P<0.001) and neutrophils (R=0.15, P=0.004), and
negatively correlated with the infiltration of resting memory CD4 T
cells (R=−0.12, P=0.026) and monocytes (R=−0.14, P=0.007) (Fig. 5A). The mRNA levels of the ICs
CTLA4, PDCD1, CD86, CD274, CD276, HAVCR2, LAG3, LGALS9, NRP1
and TIGIT were significantly higher in the H-EMC3-AS1
expression group compared with those in the L-EMC3-AS1 expression
group (P<0.05; Fig. 5B). In
addition, the mRNAsi of the H-EMC3-AS1 group was higher than that
of the L-EMC3-AS1 group (P=0.004; Fig.
5C) and was positively correlated with EMC3-AS1
expression (R=0.17, P=0.001). By contrast, the EREG-mRNAsi of the
H-EMC3-AS1 group was lower than that of the L-EMC3-AS1 group
(P=0.001), and was negatively correlated with EMC3-AS1
expression (R=−0.21, P<0.001; Fig.
5D). Additionally, the Stromal score (P=0.003) and Estimate
score (P=0.023) of patients in the H-EMC3-AS1 group were
significantly lower than those of patients in the L-EMC3-AS1 group
(Fig. 5E). According to the result
of the ssGSEA for 13 immune-related pathways, the activity of MHC
class I molecules was greater in the H-EMC3-AS1 group compared with
that in the L-EMC3-AS1 group (P<0.001), whereas type I/II IFN
responses and cytolytic activity were restrained in the H-EMC3-AS1
expression group (P<0.001, Fig.
5F).
Comprehensive therapeutic
analysis
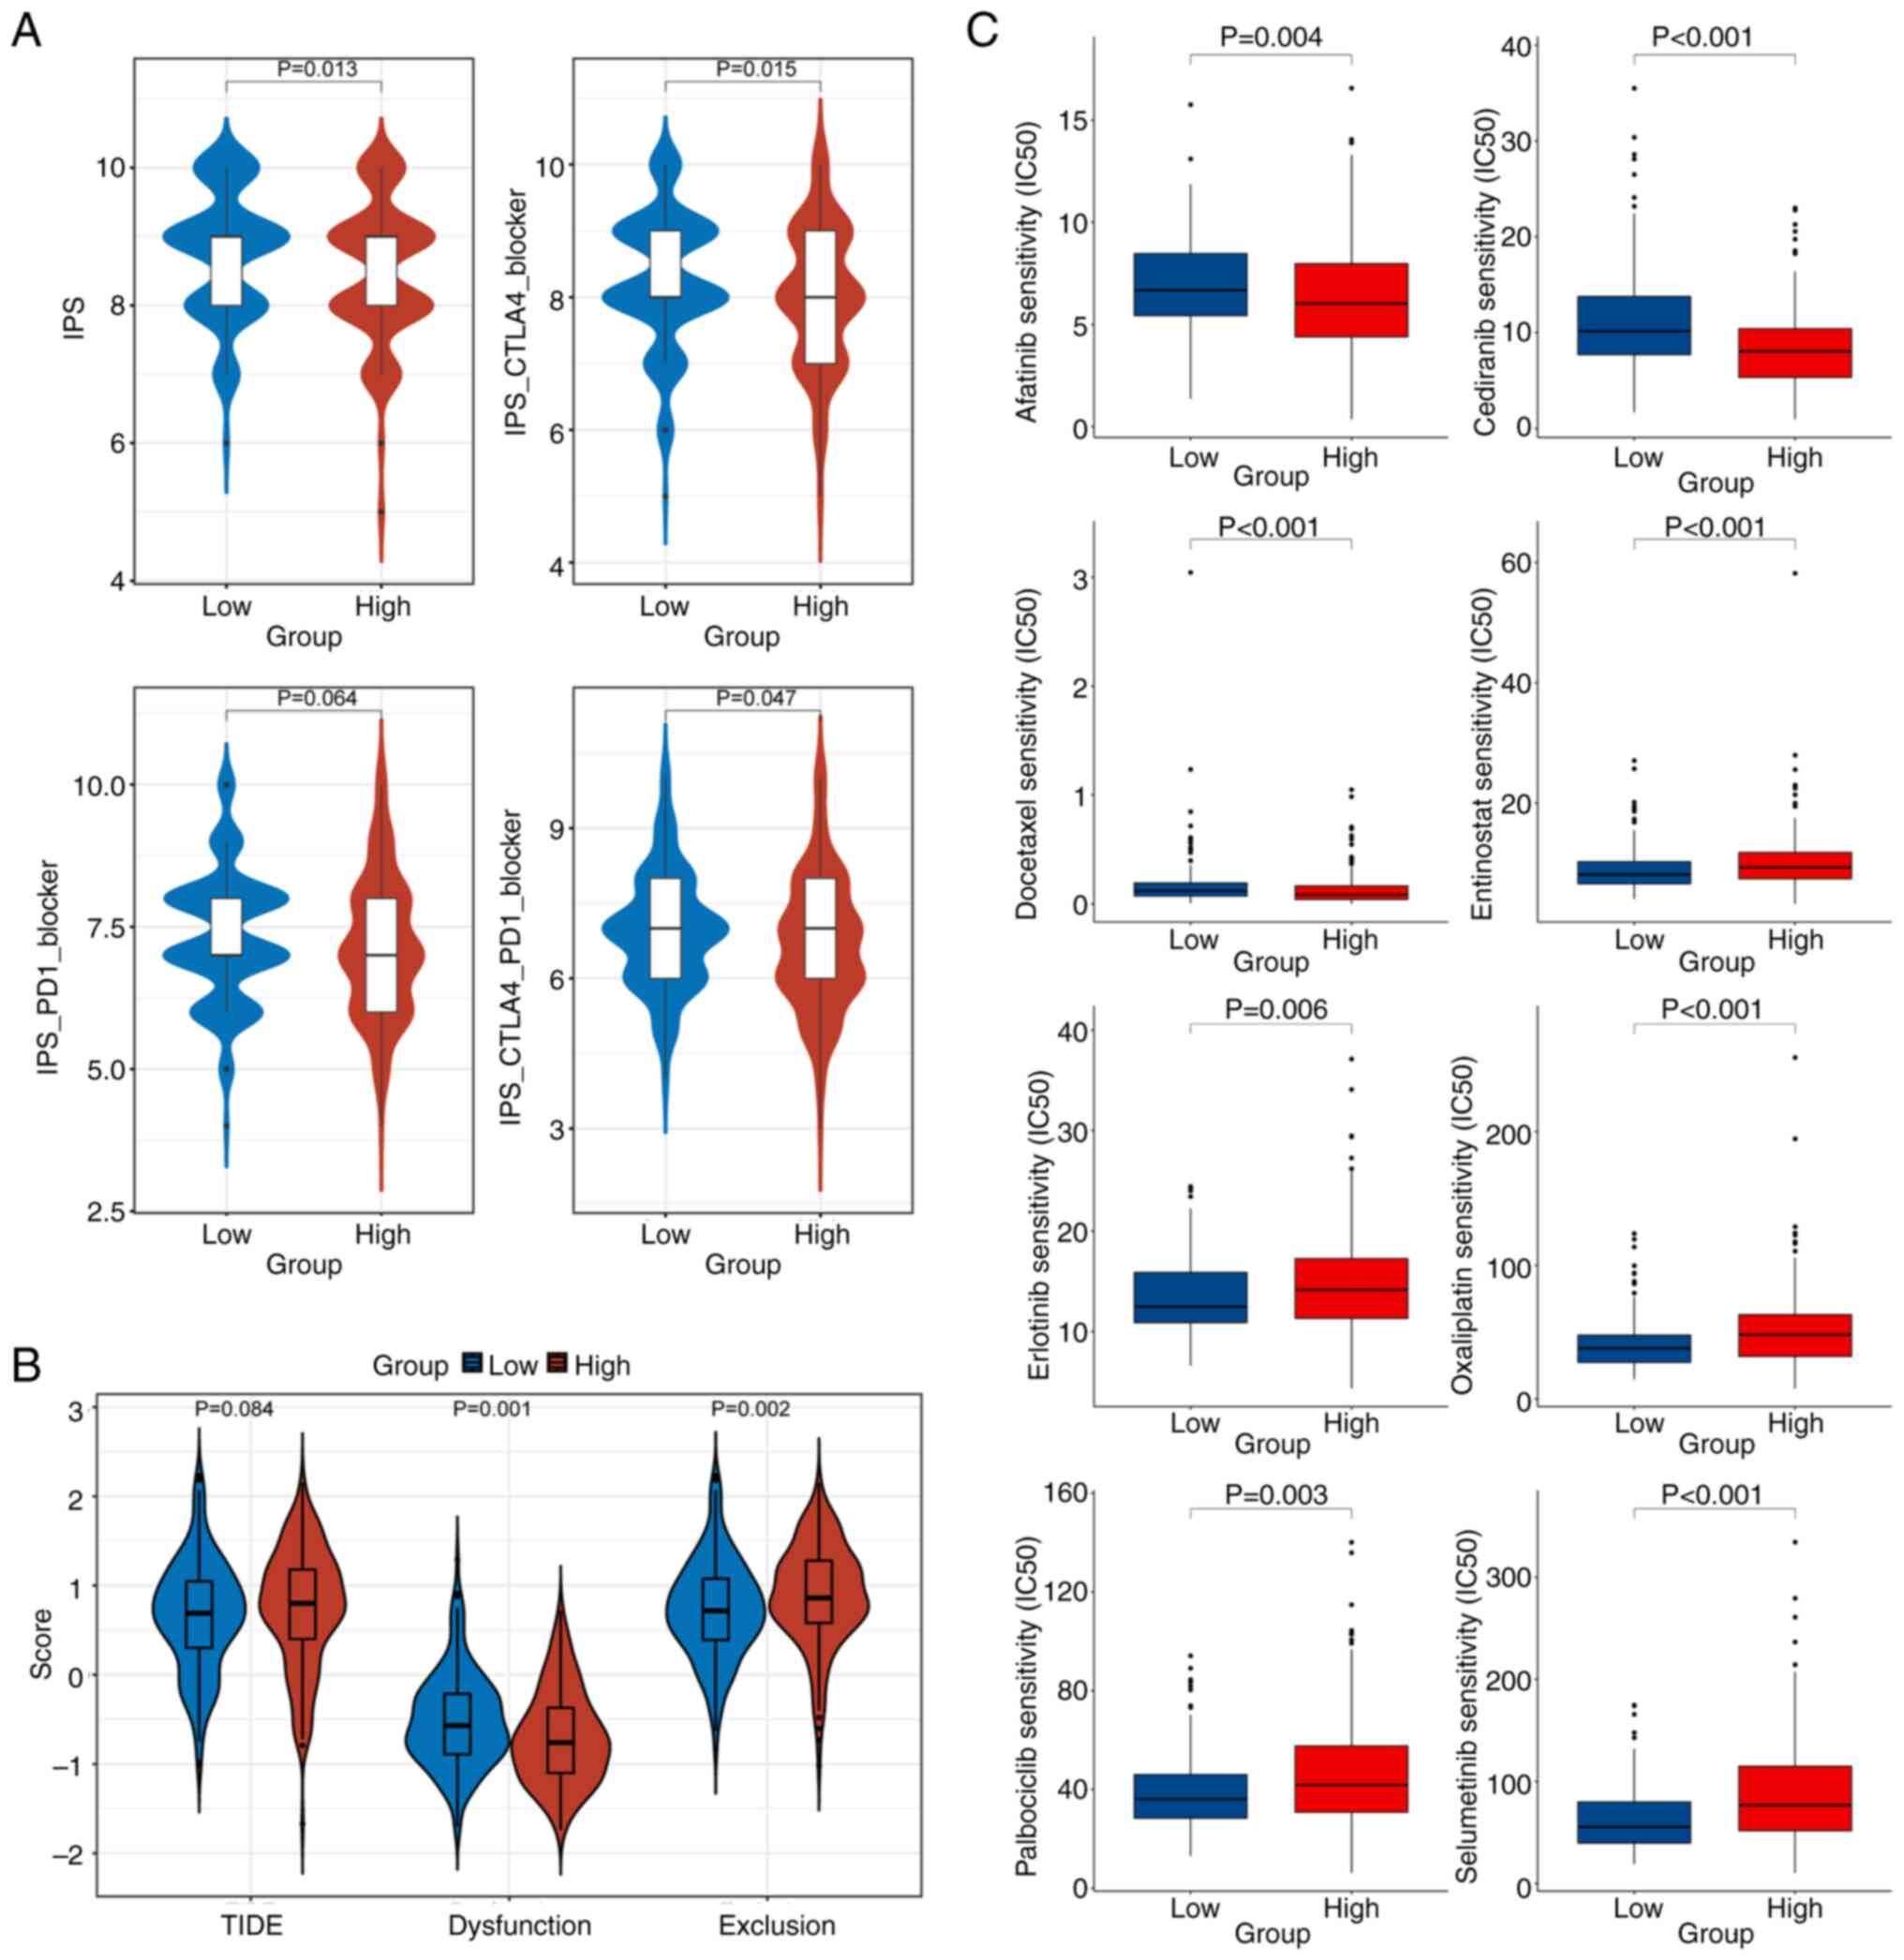
IPS analysis indicated that the IPS level of
patients in the L-EMC3-AS1 group was elevated compared with that of
the H-EMC3-AS1 group, suggesting that patients in the L-EMC3-AS1
expression group were more suitable for immunotherapy (P=0.013).
Furthermore, patients in L-EMC3-AS1 expression group also
demonstrated significantly higher IPS-CTLA4 blocker scores
(P=0.015) and IPS-CTLA4-PD1 blocker scores (P=0.047), which
suggested that these patients might experience an effective
response when treated with anti-CTLA4 or anti-PD1 plus anti-CTLA4
therapy (Fig. 6A). In the TIDE
analysis, lower dysfunction scores and higher exclusion scores of T
cells in the tumor microenvironment were found in patients with
high EMC3-AS1 expression compared with those in patients
with low EMC3-AS1 expression (P=0.001 and P=0.002,
respectively; Fig. 6B).
Furthermore, the oncoPredict analysis indicated that the patients
in the L-EMC3-AS1 group would be more sensitive to treatment
with entinostat, erlotinib, oxaliplatin, palbociclib and
selumetinib compared with those in the H-EMC3-AS1 group (all
P<0.05; Fig. 6C).
Silencing EMC3-AS1 inhibits liver
cancer cell proliferation
HepG2, Sk-Hep-1 and Huh-7 cells were transfected
with non-targeting siRNA (siRNA-NC) or EMC3-AS1-specific siRNAs
(siRNA-1739/2842) to silence the expression of EMC3-AS1.
According to the results of RT-qPCR, EMC3-AS1 expression was
successfully knocked down via transfection with siRNA-1739 and
siRNA-2842 in the HepG2, Sk-Hep-1 and Huh-7 cells (Fig. 7A-C), indicating that the
siRNA-silenced cells were suitable for use in subsequent assays.
Transfection with siRNA-1739 and siRNA-2842 was shown to reduce the
proliferation and colony forming ability of HepG2, Sk-Hep-1 and
Huh-7 cells compared with that of the siRNA-NC group (Fig. 7D-L).
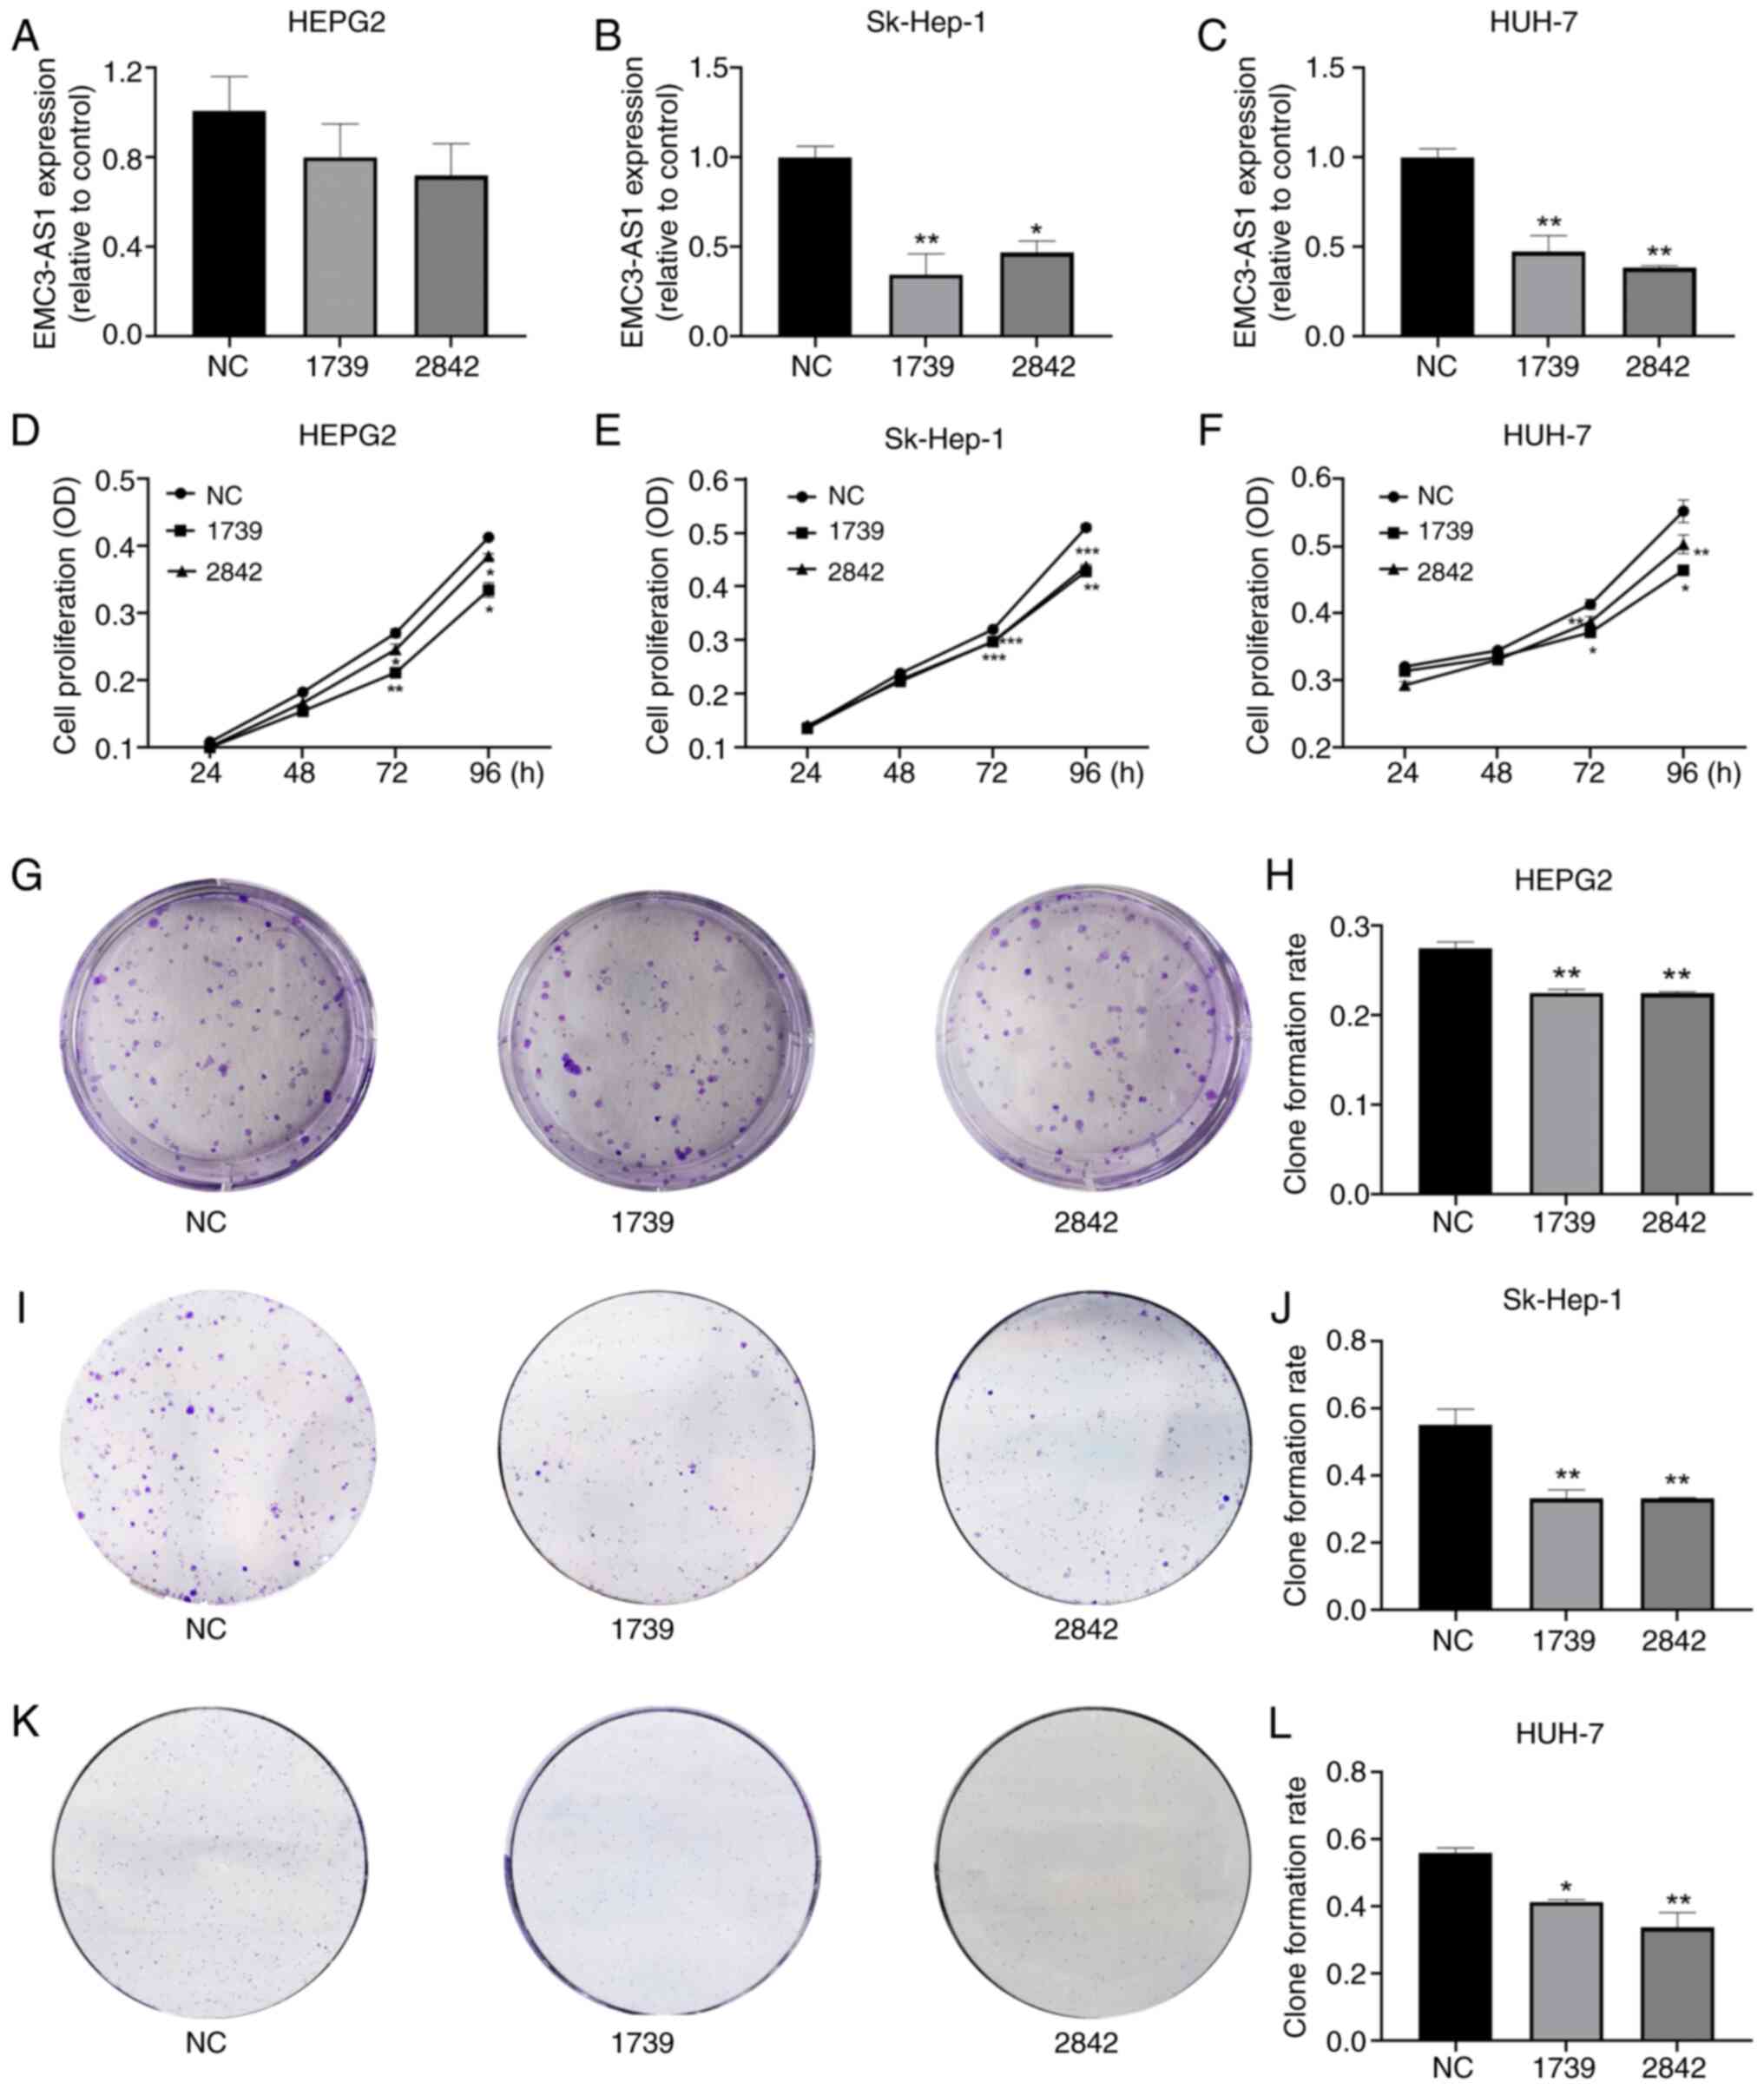 | Figure 7.Effect of EMC3-AS1 knockdown
on the proliferation of liver cancer cells. The expression of
EMC3-AS1 was suppressed by transfection with siRNA-1739 and
siRNA-2842 in (A) HepG2, (B) Sk-Hep-1 and (C) Huh-7 cells. The
knockdown of EMC3-AS1 expression inhibited the proliferation
of (D) HepG2, (E) Sk-Hep-1 and (F) Huh-7 cells, as determined by
MTT assay. (G-L) Colony forming assays revealed the inhibitory
effect of knocking down EMC3-AS1 expression on HepG2,
Sk-Hep-1 and Huh-7 cells. Representative images of (G) HepG2, (I)
Sk-Hep-1 and (K) Huh-7 colonies and colony formation rates for (H)
HepG2, (J) Sk-Hep-1 and (L) Huh-7 are presented. *P<0.05,
**P<0.01 and ***P<0.001 vs. the NC group. EMC3-AS1,
endoplasmic reticulum membrane protein complex subunit 3 antisense
RNA 1; siRNA, small interfering RNA; NC, negative control siRNA;
OD, optical density. |
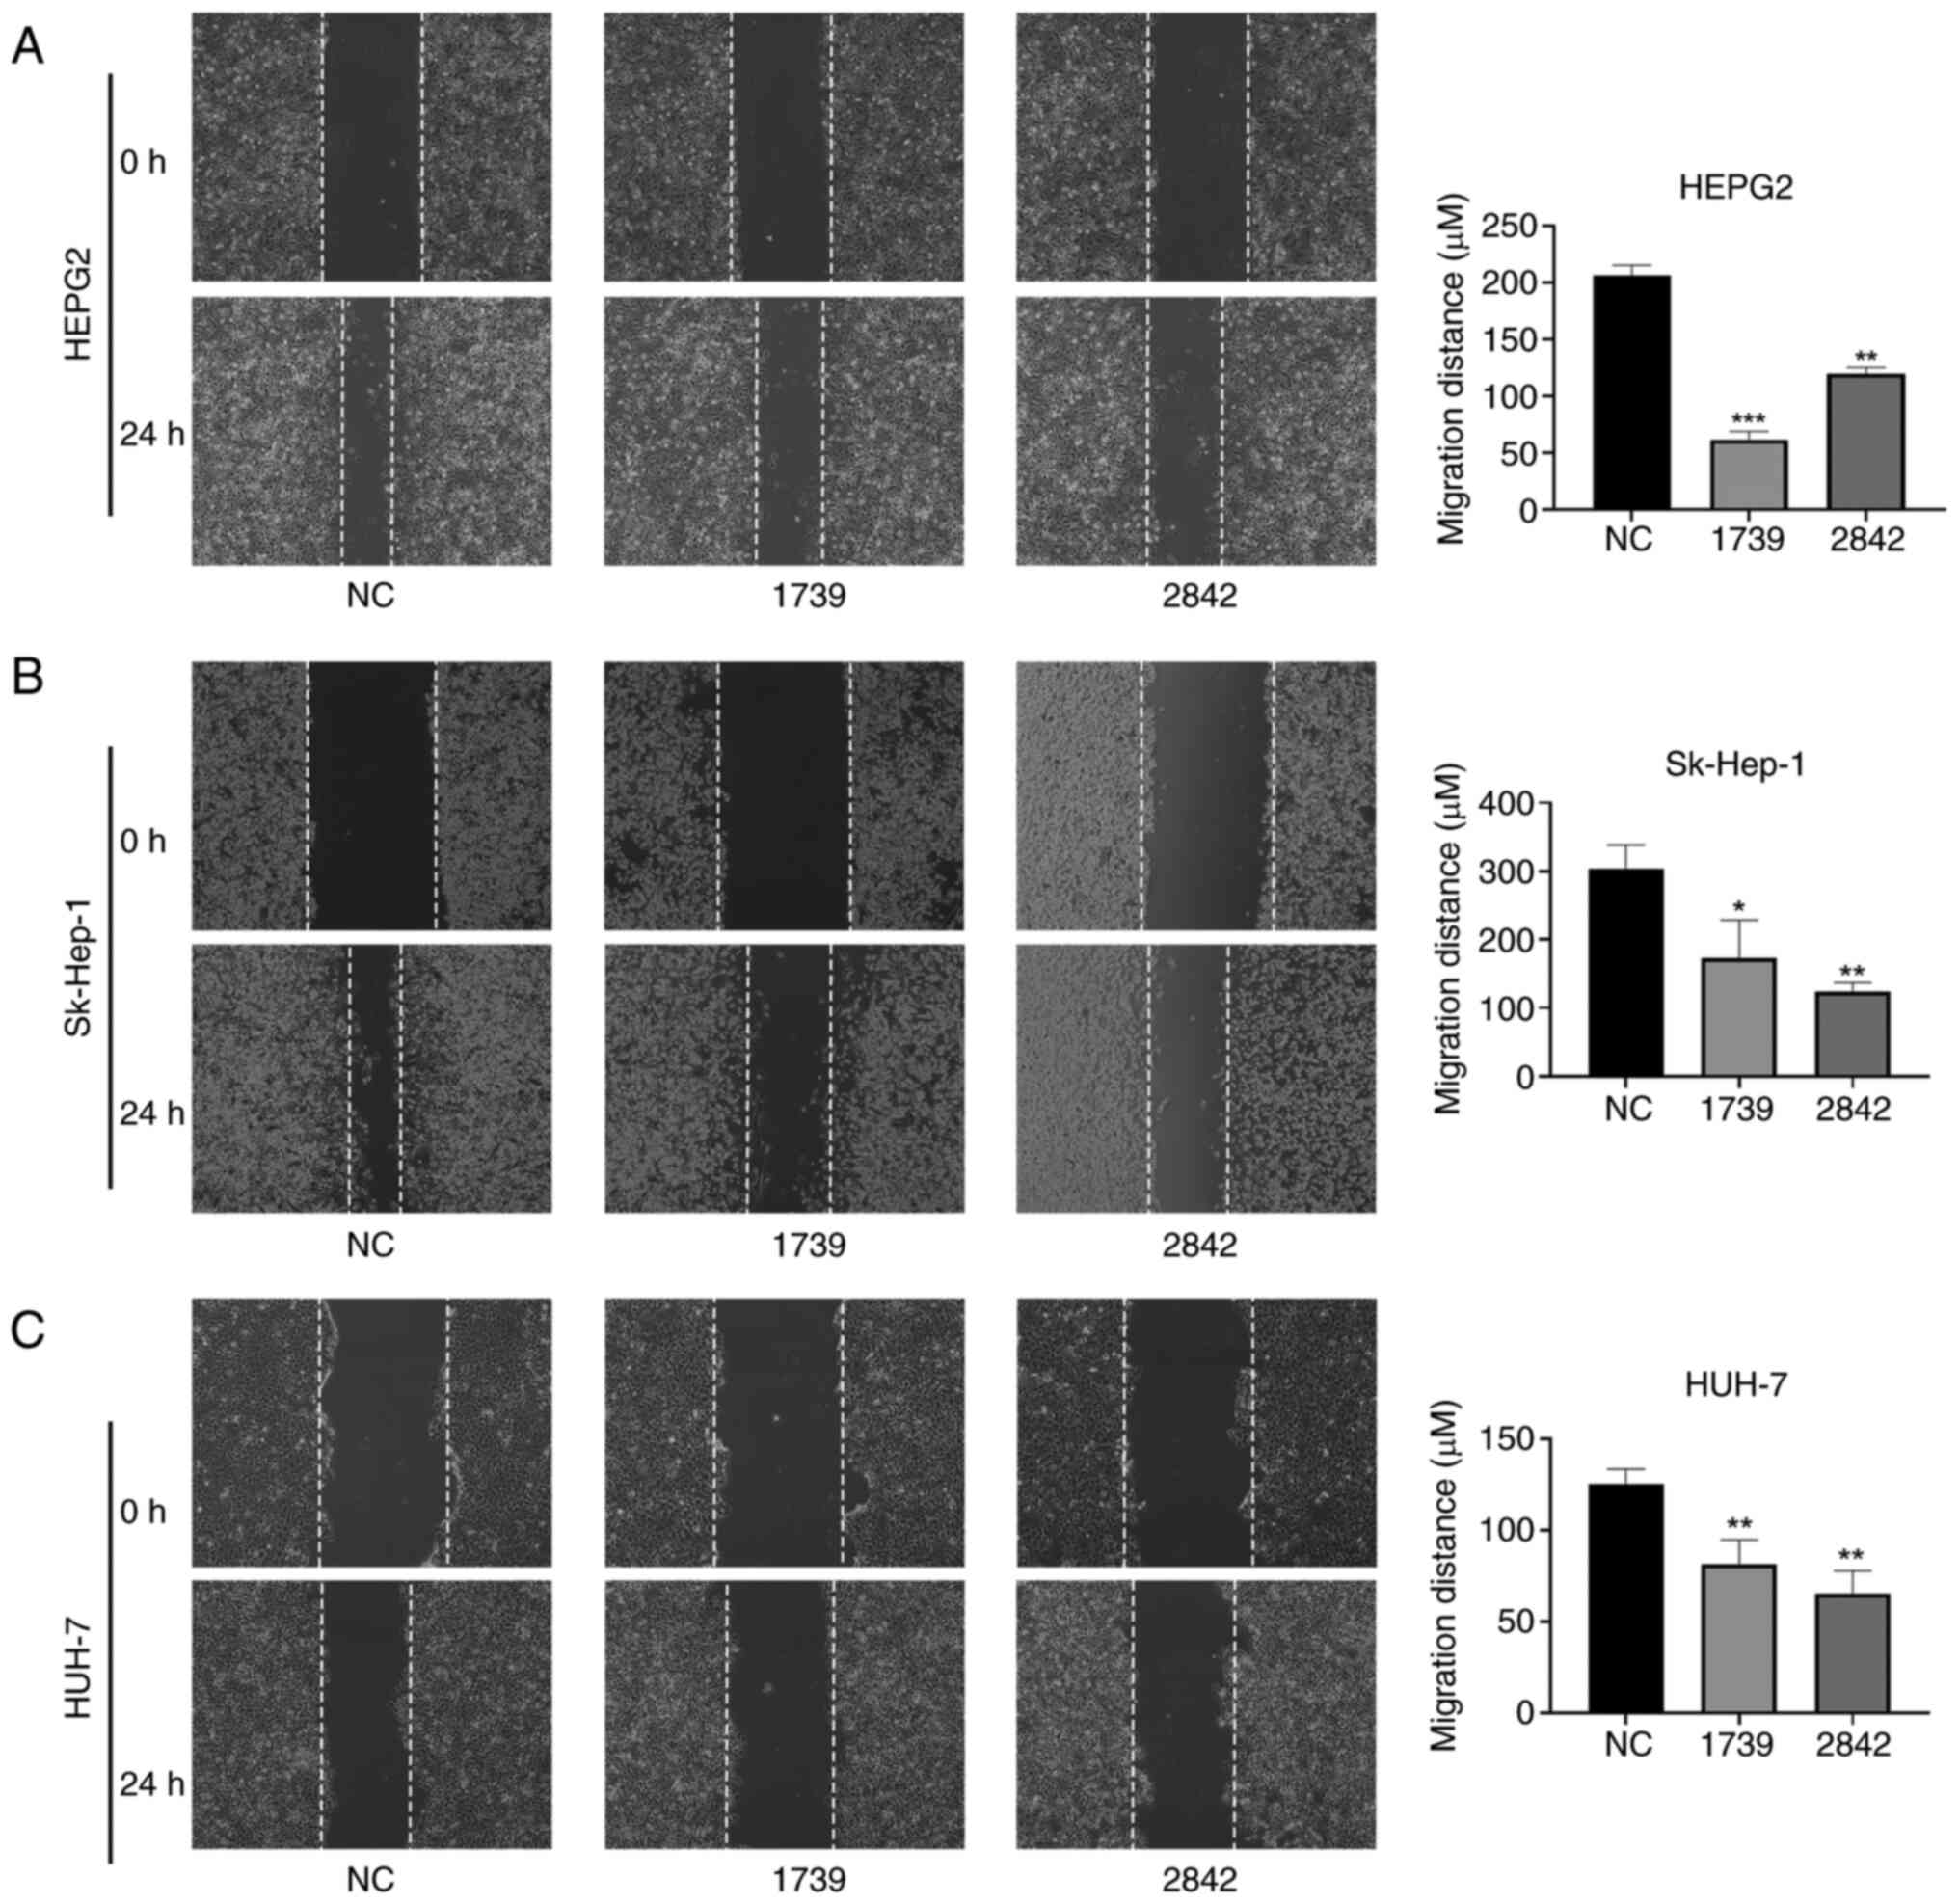
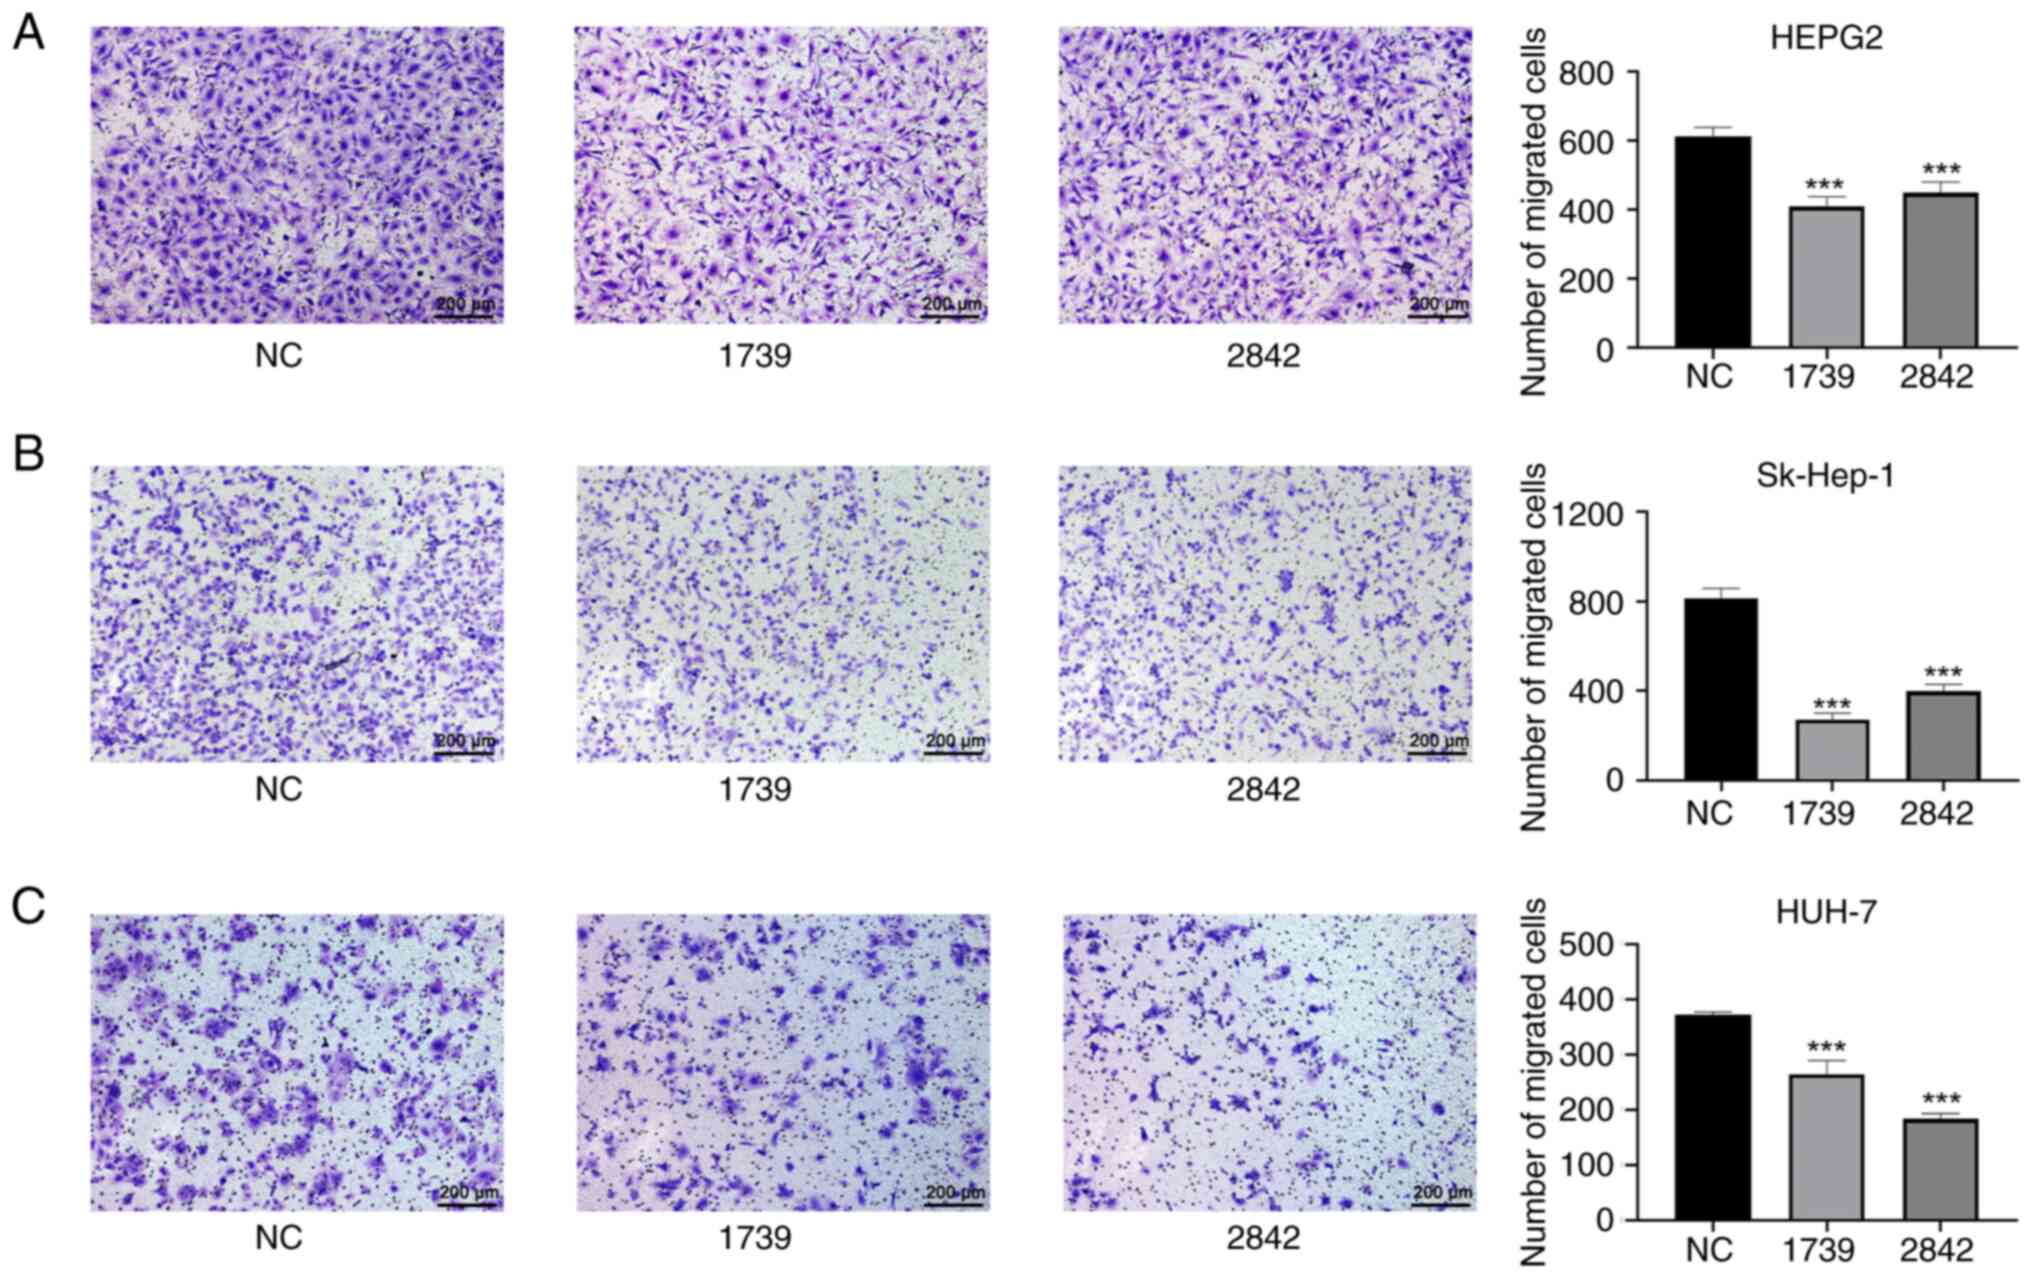
Silencing EMC3-AS1 suppresses liver
cancer cell migration
As shown in Fig. 8,
the migration ability of the HepG2, Sk-Hep-1 and Huh-7 liver cancer
cells in the wound healing assay was significantly reduced by the
knockdown of EMC3-AS1 expression (Fig. 8). The migration of HepG2, Sk-Hep-1
and Huh-7 cells in the Transwell assay was also significantly
inhibited after the knockdown of EMC3-AS1 (Fig. 9). These results suggest that a
deficiency in EMC3-AS1 affects the vital functions of liver cancer
cells, and that EMC3-AS1 may serve as a novel target for liver
cancer treatment.
Discussion
The current study demonstrated that the expression
of EMC3-AS1 was upregulated in liver cancer tissues compared
with that in AN tissues in various datasets, including TCGA and GEO
datasets, as well as in a primary clinical cohort. The expression
of EMC3-AS1 was also higher in patients with more advanced
liver cancer. Higher expression of EMC3-AS1 was associated
with shorter OS and DFS times in patients with liver cancer.
Furthermore, EMC3-AS1 demonstrated the ability to
effectively discriminate between liver cancer and normal tissues,
exhibiting a good performance not only in TCGA and GEO datasets,
but also in the current clinical cohort. These findings suggest
that EMC3-AS1 holds potential as a diagnostic and prognostic
biomarker. Multivariate Cox regression analysis indicated that
higher expression of EMC3-AS1 was independently associated
with a poor prognosis in patients with liver cancer. Furthermore,
GSVA, GSEA, GO and KEGG enrichment analyses showed significant
enrichment and activation of several pathways associated with the
tumorigenesis and progression of liver cancer, including
‘chromosome segregation’, ‘organelle fission’, ‘nuclear division’
and ‘cell cycle’.
The TME is primarily composed of immune cells,
extracellular matrix, cytokines and cancer cells (34). In addition to playing a crucial role
in tumor recognition and clearance, the TME also contributes to
immune escape and cancer progression (35). The TME of liver cancer is strongly
suppressive, with aberrant accumulation of immunosuppressive cells
(36). Immunotherapy targeting
immunosuppressive cells and pathways is a promising approach for
cancer treatment (37).
Tumor-associated neutrophils have been identified as key drivers of
progression and immunosuppression in liver cancer (38,39).
Wang et al (40) suggested
that the resistance of hepatocellular carcinoma cells to sorafenib
could be ascribed to the activation of CXCR2 signaling facilitated
by tumor-associated macrophages. Regulatory T cells have also been
shown to be associated with liver cancer invasion and to be crucial
in hindering the development of effective antitumor responses
(41). In the present study,
EMC3-AS1 expression was shown to be positively correlated
with the infiltration of follicular helper T cells, activated
memory CD4 T cells, M0 macrophages, regulatory T cells and
neutrophils in the liver. Conversely, a significant negative
correlation was observed between EMC3-AS1 expression and the
infiltration of monocytes and resting memory CD4 T cells.
ICIs have demonstrated marked therapeutic efficacy
for a variety of cancer types, including liver cancer (42–44).
Assessing the expression of ICs and their ligands in the TME is
often the initial step when making decisions regarding
immunotherapy in patients with cancer (45). In liver cancer, the upregulation of
PD ligand 1 (PD-L1) expression is a significant predictor of poor
survival (46–48). Enhancing the response of a patient
to anti-PD-1 or anti-PD-L1 treatment is a pivotal therapeutic
strategy for patients with liver cancer (48). Notably, in the current study, the
mRNA expression of several key ICIs, including CTLA4, CD86,
CD274, LGALS9, PDCD1 and TIGIT, was significantly higher
in the H-EMC3-AS1 expression group than that in the L-EMC3-AS1
expression group. This finding suggests that patients exhibiting
elevated levels of EMC3-AS1 also demonstrate increased
expression of various ICs in the TME, which would be clinically
helpful in improving patient stratification for IC blockade
immunotherapy.
Clinical impact assessments of ICIs have been
conducted in various cancer types, and drugs such as nivolumab,
pembrolizumab and atezolizumab have been recommended as first-line
treatments for patients with liver cancer (49). However, positive responses to
immunotherapy are observed in only a small proportion of patients
with liver cancer, highlighting the importance of identifying
responsive patients and understanding resistance mechanisms
(50). In the present study,
patients with liver cancer with low EMC3-AS1 expression had
higher IPSs when strategies to block CTLA4 or co-block PD1 and
CTLA4 were employed. Additionally, patients with low
EMC3-AS1 expression exhibited higher dysfunction scores and
lower exclusion scores for T cells, indicating that they were more
likely to benefit from immunotherapy.
Further experiments were performed in the present
study to investigate the influence of EMC3-AS1 on the
biological behavior of liver cancer cells in vitro.
Transfection with siRNA targeting EMC3-AS1 markedly reduced
its expression in HepG2, Sk-Hep-1 and Huh-7 cells, leading to
decreased cell proliferation and colony-forming ability. In
addition, the results of wound healing and Transwell assays
revealed that the migration capabilities of HepG2, Sk-Hep-1 and
Huh-7 cells were notably suppressed following the downregulation of
EMC3-AS1 expression. These findings imply that
EMC3-AS1 may act as a potential target for the treatment of
liver cancer.
However, the current study has several limitations
that should be acknowledged. Firstly, multicenter studies with
larger sample sizes are required to confirm the expression of
EMC3-AS1 in liver cancer. Secondly, additional experiments
are required to explore the potential in vitro and in
vivo mechanisms of EMC3-AS1 to support the present
findings. Thirdly, the CIBERSORT algorithm relies on the fidelity
of the reference profiles, which could deviate in cells involved in
heterotypic interactions, phenotypic plasticity or disease-induced
dysregulation. It is necessary to verify results in independent
cohorts or experimental models in future research. Finally,
prospective studies are warranted to validate the prognostic and
diagnostic value of EMC3-AS1 in patients with liver
cancer.
In summary, lncRNA EMC3-AS1 is upregulated in
liver cancer and is associated with a poor prognosis, making it a
potential diagnostic and prognostic biomarker for patients with
liver cancer. Silencing EMC3-AS1 is potentially a promising
therapeutic approach for liver cancer treatment.
Supplementary Material
Supporting Data
Acknowledgements
Not applicable.
Funding
The present study was supported by the Scientific Research
Project of Chengdu Health Commission (grant no. 2020118), the
Scientific Research Project of Sichuan Medical Association of China
(grant no. S20073) and the Joint Fund of Chengdu Medical University
and Pidu District People's Hospital (grant no. 2021LHZD-02).
Availability of data and materials
The data generated in the present study may be
requested from the corresponding author.
Authors' contributions
BL designed the study and analyzed the data. XY
performed the experiments. JZ and KD were involved in the
acquisition and management of data. TF analysed the data and
interpreted the results. BL, XY and TF revised the manuscript. CD
designed the study and wrote the manuscript. BL and XY confirm the
authenticity of all the raw data. All authors read and approved the
final manuscript.
Ethics approval and consent to
participate
This study was performed in accordance with the
principles of the Declaration of Helsinki. Approval was granted by
the Ethics Committee of Sichuan Provincial People's Hospital
(Chengdu, China; approval no. 2022-2). Written informed consent for
the use of their tissues was acquired from patients before
surgery.
Patient consent for publication
Not applicable.
Competing interests
The authors declare that they have no competing
interests.
References
|
1
|
Sung H, Ferlay J, Siegel RL, Laversanne M,
Soerjomataram I, Jemal A and Bray F: Global cancer statistics 2020:
GLOBOCAN estimates of incidence and mortality worldwide for 36
cancers in 185 countries. CA Cancer J Clin. 71:209–249. 2021.
View Article : Google Scholar : PubMed/NCBI
|
|
2
|
Nagtegaal ID, Odze RD, Klimstra D, Paradis
V, Rugge M, Schirmacher P, Washington KM, Carneiro F and Cree IA;
WHO Classification of Tumours Editorial Board, : The 2019 WHO
classification of tumours of the digestive system. Histopathology.
76:182–188. 2020. View Article : Google Scholar : PubMed/NCBI
|
|
3
|
Zhang W, Hu B, Han J, Wang Z, Ma G, Ye H,
Yuan J, Cao J, Zhang Z, Shi J, et al: Surgery after conversion
therapy with PD-1 Inhibitors plus tyrosine kinase inhibitors are
effective and safe for advanced hepatocellular carcinoma: A pilot
study of ten patients. Front Oncol. 11:7479502021. View Article : Google Scholar : PubMed/NCBI
|
|
4
|
Caley DP, Pink RC, Trujillano D and Carter
DRF: Long noncoding RNAs, chromatin, and development.
ScientificWorldJournal. 10:90–102. 2010. View Article : Google Scholar : PubMed/NCBI
|
|
5
|
Jiang MC, Ni JJ, Cui WY, Wang BY and Zhuo
W: Emerging roles of lncRNA in cancer and therapeutic
opportunities. Am J Cancer Res. 9:1354–1366. 2019.PubMed/NCBI
|
|
6
|
Huang Z, Zhou JK, Peng Y, He W and Huang
C: The role of long noncoding RNAs in hepatocellular carcinoma. Mol
Cancer. 19:772020. View Article : Google Scholar : PubMed/NCBI
|
|
7
|
Liu Y, Liu X, Lin C, Jia X, Zhu H, Song J
and Zhang Y: Noncoding RNAs regulate alternative splicing in
cancer. J Exp Clin Cancer Res. 40:112021. View Article : Google Scholar : PubMed/NCBI
|
|
8
|
Malakoti F, Targhazeh N, Karimzadeh H,
Mohammadi E, Asadi M, Asemi Z and Alemi F: Multiple function of
lncRNA MALAT1 in cancer occurrence and progression. Chem Biol Drug
Des. 101:1113–1137. 2023. View Article : Google Scholar : PubMed/NCBI
|
|
9
|
Si C, Yang L and Cai X: LncRNA LINC00649
aggravates the progression of cervical cancer through sponging
miR-216a-3p. J Obstet Gynaecol Res. 48:2853–2862. 2022. View Article : Google Scholar : PubMed/NCBI
|
|
10
|
Tang D, Zhao L, Peng C, Ran K, Mu R and Ao
Y: LncRNA CRNDE promotes hepatocellular carcinoma progression by
upregulating SIX1 through modulating miR-337-3p. J Cell Biochem.
120:16128–16142. 2019. View Article : Google Scholar : PubMed/NCBI
|
|
11
|
Cai Y, Lyu T, Li H, Liu C, Xie K, Xu L, Li
W, Liu H, Zhu J, Lyu Y, et al: LncRNA CEBPA-DT promotes liver
cancer metastasis through DDR2/β-catenin activation via interacting
with hnRNPC. J Exp Clin Cancer Res. 41:3352022. View Article : Google Scholar : PubMed/NCBI
|
|
12
|
Zhao Z, Gao J and Huang S: LncRNA SNHG7
promotes the HCC progression through miR-122-5p/FOXK2 axis. Dig Dis
Sci. 67:925–935. 2022. View Article : Google Scholar : PubMed/NCBI
|
|
13
|
Ji Y, Sun H, Liang H, Wang Y, Lu M, Guo Z,
Lv Z and Ren W: Evaluation of LncRNA ANRIL potential in hepatic
cancer progression. J Environ Pathol Toxicol Oncol. 38:119–131.
2019. View Article : Google Scholar : PubMed/NCBI
|
|
14
|
Dai D, Wang H, Zhu L, Jin H and Wang X:
N6-methyladenosine links RNA metabolism to cancer progression. Cell
Death Dis. 9:1242018. View Article : Google Scholar : PubMed/NCBI
|
|
15
|
Ma S, Chen C, Ji X, Liu J, Zhou Q, Wang G,
Yuan W, Kan Q and Sun Z: The interplay between m6A RNA methylation
and noncoding RNA in cancer. J Hematol Oncol. 12:1212019.
View Article : Google Scholar : PubMed/NCBI
|
|
16
|
Burchard J, Zhang C, Liu AM, Poon RT, Lee
NP, Wong KF, Sham PC, Lam BY, Ferguson MD, Tokiwa G, et al:
microRNA-122 as a regulator of mitochondrial metabolic gene network
in hepatocellular carcinoma. Mol Syst Biol. 6:4022010. View Article : Google Scholar : PubMed/NCBI
|
|
17
|
Sung WK, Zheng H, Li S, Chen R, Liu X, Li
Y, Lee NP, Lee WH, Ariyaratne PN, Tennakoon C, et al: Genome-wide
survey of recurrent HBV integration in hepatocellular carcinoma.
Nat Genet. 44:765–769. 2012. View Article : Google Scholar : PubMed/NCBI
|
|
18
|
Makowska Z, Boldanova T, Adametz D,
Quagliata L, Vogt JE, Dill MT, Matter MS, Roth V, Terracciano L and
Heim MH: Gene expression analysis of biopsy samples reveals
critical limitations of transcriptome-based molecular
classifications of hepatocellular carcinoma. J Pathol Clin Res.
2:80–92. 2016. View Article : Google Scholar : PubMed/NCBI
|
|
19
|
Pugh RN, Murray-Lyon IM, Dawson JL,
Pietroni MC and Williams R: Transection of the oesophagus for
bleeding oesophageal varices. Br J Surg. 60:646–649. 1973.
View Article : Google Scholar : PubMed/NCBI
|
|
20
|
Livak KJ and Schmittgen TD: Analysis of
relative gene expression data using real-time quantitative PCR and
the 2(-Delta Delta C(T)) method. Methods. 25:402–408. 2001.
View Article : Google Scholar : PubMed/NCBI
|
|
21
|
Robin X, Turck N, Hainard A, Tiberti N,
Lisacek F, Sanchez JC and Müller M: pROC: An open-source package
for R and S+ to analyze and compare ROC curves. BMC Bioinformatics.
12:772011. View Article : Google Scholar : PubMed/NCBI
|
|
22
|
Hänzelmann S, Castelo R and Guinney J:
GSVA: Gene set variation analysis for microarray and RNA-seq data.
BMC Bioinformatics. 14:72013. View Article : Google Scholar : PubMed/NCBI
|
|
23
|
Subramanian A, Tamayo P, Mootha VK,
Mukherjee S, Ebert BL, Gillette MA, Paulovich A, Pomeroy SL, Golub
TR, Lander ES and Mesirov JP: Gene set enrichment analysis: A
knowledge-based approach for interpreting genome-wide expression
profiles. Proc Natl Acad Sci USA. 102:15545–15550. 2005. View Article : Google Scholar : PubMed/NCBI
|
|
24
|
Yu G, Wang LG, Han Y and He QY:
clusterProfiler: An R package for comparing biological themes among
gene clusters. OMICS. 16:284–287. 2012. View Article : Google Scholar : PubMed/NCBI
|
|
25
|
Ritchie ME, Phipson B, Wu D, Hu Y, Law CW,
Shi W and Smyth GK: limma powers differential expression analyses
for RNA-sequencing and microarray studies. Nucleic Acids Res.
43:e472015. View Article : Google Scholar : PubMed/NCBI
|
|
26
|
Edge SB and Compton CC: The American joint
committee on cancer: The 7th edition of the AJCC cancer staging
manual and the future of TNM. Ann Surg Oncol. 17:1471–1474. 2010.
View Article : Google Scholar : PubMed/NCBI
|
|
27
|
Newman AM, Steen CB, Liu CL, Gentles AJ,
Chaudhuri AA, Scherer F, Khodadoust MS, Esfahani MS, Luca BA,
Steiner D, et al: Determining cell type abundance and expression
from bulk tissues with digital cytometry. Nat Biotechnol.
37:773–782. 2019. View Article : Google Scholar : PubMed/NCBI
|
|
28
|
Salmaninejad A, Valilou SF, Shabgah AG,
Aslani S, Alimardani M, Pasdar A and Sahebkar A: PD-1/PD-L1
pathway: Basic biology and role in cancer immunotherapy. J Cell
Physiol. 234:16824–16837. 2019. View Article : Google Scholar : PubMed/NCBI
|
|
29
|
Malta TM, Sokolov A, Gentles AJ,
Burzykowski T, Poisson L, Weinstein JN, Kamińska B, Huelsken J,
Omberg L, Gevaert O, et al: Machine learning identifies stemness
features associated with oncogenic dedifferentiation. Cell.
173:338–354.e15. 2018. View Article : Google Scholar : PubMed/NCBI
|
|
30
|
Yoshihara K, Shahmoradgoli M, Martínez E,
Vegesna R, Kim H, Torres-Garcia W, Treviño V, Shen H, Laird PW,
Levine DA, et al: Inferring tumour purity and stromal and immune
cell admixture from expression data. Nat Commun. 4:26122013.
View Article : Google Scholar : PubMed/NCBI
|
|
31
|
Charoentong P, Finotello F, Angelova M,
Mayer C, Efremova M, Rieder D, Hackl H and Trajanoski Z: Pan-cancer
immunogenomic analyses reveal genotype-immunophenotype
relationships and predictors of response to checkpoint blockade.
Cell Rep. 18:248–262. 2017. View Article : Google Scholar : PubMed/NCBI
|
|
32
|
Jiang P, Gu S, Pan D, Fu J, Sahu A, Hu X,
Li Z, Traugh N, Bu X, Li B, et al: Signatures of T cell dysfunction
and exclusion predict cancer immunotherapy response. Nat Med.
24:1550–1558. 2018. View Article : Google Scholar : PubMed/NCBI
|
|
33
|
Maeser D, Gruener RF and Huang RS:
oncoPredict: An R package for predicting in vivo or cancer patient
drug response and biomarkers from cell line screening data. Brief
Bioinform. 22:bbab2602021. View Article : Google Scholar : PubMed/NCBI
|
|
34
|
Chew V, Lai L, Pan L, Lim CJ, Li J, Ong R,
Chua C, Leong JY, Lim KH, Toh HC, et al: Delineation of an
immunosuppressive gradient in hepatocellular carcinoma using
high-dimensional proteomic and transcriptomic analyses. Proc Natl
Acad Sci USA. 114:E5900–E5909. 2017. View Article : Google Scholar : PubMed/NCBI
|
|
35
|
Dunn GP, Bruce AT, Ikeda H, Old LJ and
Schreiber RD: Cancer immunoediting: From immunosurveillance to
tumor escape. Nat Immunol. 3:991–998. 2002. View Article : Google Scholar : PubMed/NCBI
|
|
36
|
Shlomai A, de Jong YP and Rice CM: Virus
associated malignancies: The role of viral hepatitis in
hepatocellular carcinoma. Semin Cancer Biol. 26:78–88. 2014.
View Article : Google Scholar : PubMed/NCBI
|
|
37
|
Pardoll DM: The blockade of immune
checkpoints in cancer immunotherapy. Nat Rev Cancer. 12:252–264.
2012. View Article : Google Scholar : PubMed/NCBI
|
|
38
|
Margetts J, Ogle LF, Chan SL, Chan AWH,
Chan KCA, Jamieson D, Willoughby CE, Mann DA, Wilson CL, Manas DM,
et al: Neutrophils: Driving progression and poor prognosis in
hepatocellular carcinoma? Br J Cancer. 118:248–257. 2018.
View Article : Google Scholar : PubMed/NCBI
|
|
39
|
Arvanitakis K, Mitroulis I and Germanidis
G: Tumor-associated neutrophils in hepatocellular carcinoma
pathogenesis, prognosis, and therapy. Cancers (Basel). 13:28992021.
View Article : Google Scholar : PubMed/NCBI
|
|
40
|
Wang HC, Haung LY, Wang CJ, Chao YJ, Hou
YC, Yen CJ and Shan YS: Tumor-associated macrophages promote
resistance of hepatocellular carcinoma cells against sorafenib by
activating CXCR2 signaling. J Biomed Sci. 29:992022. View Article : Google Scholar : PubMed/NCBI
|
|
41
|
You M, Gao Y, Fu J, Xie R, Zhu Z, Hong Z,
Meng L, Du S, Liu J, Wang FS, et al: Epigenetic regulation of
HBV-specific tumor-infiltrating T cells in HBV-related HCC.
Hepatology. 78:943–958. 2023. View Article : Google Scholar : PubMed/NCBI
|
|
42
|
Zhu AX, Finn RS, Edeline J, Cattan S,
Ogasawara S, Palmer D, Verslype C, Zagonel V, Fartoux L, Vogel A,
et al: Pembrolizumab in patients with advanced hepatocellular
carcinoma previously treated with sorafenib (KEYNOTE-224): A
non-randomised, open-label phase 2 trial. Lancet Oncol. 19:940–952.
2018. View Article : Google Scholar : PubMed/NCBI
|
|
43
|
Romano E, Kusio-Kobialka M, Foukas PG,
Baumgaertner P, Meyer C, Ballabeni P, Michielin O, Weide B, Romero
P and Speiser DE: Ipilimumab-dependent cell-mediated cytotoxicity
of regulatory T cells ex vivo by nonclassical monocytes in melanoma
patients. Proc Natl Acad Sci USA. 112:6140–6145. 2015. View Article : Google Scholar : PubMed/NCBI
|
|
44
|
Powles T, Eder JP, Fine GD, Braiteh FS,
Loriot Y, Cruz C, Bellmunt J, Burris HA, Petrylak DP, Teng SL, et
al: MPDL3280A (anti-PD-L1) treatment leads to clinical activity in
metastatic bladder cancer. Nature. 515:558–562. 2014. View Article : Google Scholar : PubMed/NCBI
|
|
45
|
Rotte A, Jin JY and Lemaire V: Mechanistic
overview of immune checkpoints to support the rational design of
their combinations in cancer immunotherapy. Ann Oncol. 29:71–83.
2018. View Article : Google Scholar : PubMed/NCBI
|
|
46
|
Shi J, Liu J, Tu X, Li B, Tong Z, Wang T,
Zheng Y, Shi H, Zeng X, Chen W, et al: Single-cell immune signature
for detecting early-stage HCC and early assessing anti-PD-1
immunotherapy efficacy. J Immunother Cancer. 10:e0031332022.
View Article : Google Scholar : PubMed/NCBI
|
|
47
|
Pfister D, Núñez NG, Pinyol R, Govaere O,
Pinter M, Szydlowska M, Gupta R, Qiu M, Deczkowska A, Weiner A, et
al: NASH limits anti-tumour surveillance in immunotherapy-treated
HCC. Nature. 592:450–456. 2021. View Article : Google Scholar : PubMed/NCBI
|
|
48
|
Cheng AL, Hsu C, Chan SL, Choo SP and Kudo
M: Challenges of combination therapy with immune checkpoint
inhibitors for hepatocellular carcinoma. J Hepatol. 72:307–319.
2020. View Article : Google Scholar : PubMed/NCBI
|
|
49
|
Benson AB, D'Angelica MI, Abbott DE, Anaya
DA, Anders R, Are C, Bachini M, Borad M, Brown D, Burgoyne A, et
al: Hepatobiliary cancers, version 2.2021, NCCN clinical practice
guidelines in oncology. J Natl Compr Canc Netw. 19:541–565. 2021.
View Article : Google Scholar : PubMed/NCBI
|
|
50
|
Federico P, Petrillo A, Giordano P, Bosso
D, Fabbrocini A, Ottaviano M, Rosanova M, Silvestri A, Tufo A,
Cozzolino A and Daniele B: Immune checkpoint inhibitors in
hepatocellular carcinoma: Current status and novel perspectives.
Cancers (Basel). 12:30252020. View Article : Google Scholar : PubMed/NCBI
|