Introduction
According to data from the American Cancer Society,
the mortality rate of ovarian cancer (OC) is decreasing, but it
remains a common malignant tumor in women (1). OC is typically undetected in patients
until the middle or late stages of the disease (2). With the further study of gene targets
for cancer therapy, the use of neoadjuvant chemotherapy regimens
for patients with OC has the potential to prolong patient survival
(3,4). Therefore, the identification of key
genes involved in OC progression and understanding of their roles
in driving such progression are of importance.
In eukaryotic cells, mitochondria are essential for
metabolism and signal transduction (5). Proteins located in the outer
mitochondrial membrane (OMM) are essential for the functions of the
mitochondria and their connection with the cytoplasm. Therefore, a
number of diseases, including certain types of cancer, as well as
the aging process, are associated with the pathophysiology of OMM
protein malfunction (6).
Mitochondrial carrier homology 2 (MTCH2) is a non-classical OMM
member within the mitochondrial carrier protein family, and was
recently reported to function as an OMM insertion enzyme for
tail-anchored proteins (7).
Previous studies have demonstrated that MTCH2 serves a role in the
regulation of apoptosis and lipid homeostasis (8). Deletion of MTCH2 in mouse embryonic
stem cells, fibroblasts and in vivo mouse models has been
shown to impede the recruitment of truncated BH3-interacting domain
death agonist (tBID) to mitochondria, resulting in reductions in
the activation of pro-apoptotic proteins, OMM permeabilization and
apoptosis (9). Furthermore, MTCH2
is involved in the maintenance of the normal mitochondrial membrane
potential and regulation of mitochondrial dynamics through its
enzyme activity; MTCH2 deficiency triggers mitochondrial
fragmentation, which contributes to mitochondrial dysfunction
(6,10). A previous study on breast cancer
suggests that MTCH2 is implicated in the invasion and dissemination
of cancer cells, as well as in the metabolic and immune response of
these cells (11). MTCH2 knockdown
was reported to impair the invasive and migratory capabilities of
glioma cells during malignant glioma progression, an effect that
was attributed to induced mitochondrial dysfunction characterized
by increased mitochondrial oxidative phosphorylation, causing
oxidative damage (12).
Mitochondrial dysfunction is associated with impaired ATP synthesis
and aberrant expression levels of claudins-1, 2 and 7, which
compromises the integrity of the intestinal barrier (13).
Claudins are a family of transmembrane tight
junction proteins that have a role in size-selective paracellular
permeability; claudins-2, 7, 10, 15 and 16 increase cellular cation
permeability, whereas claudins 4, 5, 8, 11, 14 and 18 decrease
cellular cation permeability (14,15).
Claudin-3 is a primary component of cell tight junctions (16,17).
Increased expression levels of claudin-3 have been implicated in
tumor metastasis and increase the malignant potential of cancer
cells (18). Epithelial cell shape
changes are promoted through the regulation of claudin-3 expression
levels (19). Increased expression
levels of claudin-3 have been associated with clinical pathological
stage, invasion depth and lymph node metastasis in colorectal
cancer (18,20). Increased claudin-3 expression levels
were associated with the stage and, lymphatic and distant
metastasis of gastric cancer, serving as an independent predictor
of poor prognosis of patients with gastric cancer (21). Knockdown of claudin-3 can
significantly inhibit cell proliferation and promote cell
apoptosis, and therefore has potential as a therapeutic target for
OC treatment (22).
Aminoacyl-transfer RNA (tRNA) synthetases (ARSs) are
enzymes that ligate their cognate amino acids to tRNAs for protein
synthesis (23). The multi-tRNA
synthetase complex has also been identified as a macromolecular ARS
complex in eukaryotes (24). ARSs
usually exist in free form or as multi-tRNA synthetase complexes,
which consist of three non-enzymatic ARS interacting
multifunctional proteins (AIMP1, AIMP2, and AIMP3) (25). AIMP2 is reported to have
anti-proliferative activity and promote cell death as a
pro-apoptotic factor (26).
Hexokinase 2 (HK2) is a key enzyme in glycolysis that catalyzes
glucose phosphorylation and the production of glucose-6-phosphate
(27). In previous cancer studies,
HK2 increased autophagolysosomal dependent degradation via
interactions with AIMP2, which thereby reduced the levels of
ionizing radiation-mediated apoptosis and increased the radiation
resistance of liver cancer cells (28). Furthermore, AIMP2 has been
identified as a potential risk factor in the progression of thyroid
papillary carcinoma (29). Using
the Gene Expression Profiling Interactive Analysis database, it has
been reported that the expression of MTCH2 was associated with
AIMP2 (30). Furthermore,
claudin-3, as a downstream factor of the Wnt/β-Catenin pathway, was
shown to regulate mitochondrial dysfunction (31,32).
Notably, MTCH2, AMIP2 and claudin-3 are associated
with the development of various types of tumors. The present study
thus aimed to determine the relationship between MTCH2, AMIP2 and
claudin-3 expression in OC tissue samples, and investigated the
precise role of MTCH2 in the development of OC and potential
molecular pathways, thereby providing a novel theoretical basis for
the treatment of OC.
Materials and methods
Bioinformatics analyses
The cBioPortal for Cancer Genomics (http://www.cbioportal.org/) was used to analyze the
relationship between mutation of the MTCH2 gene in OC and the
overall survival time of patients with OC by whole exome sequencing
(33). Using the cBioPortal
database, OC data from the Pan-Cancer Atlas and the Cancer Genome
Atlas were selected for analysis.
Cell culture
Human ovarian carcinoma SK-OV-3 cells were purchased
from Shanghai Zhongqiao Xinzhou Biotechnology Co., Ltd. (cat. no.
ZQ0074). Cells were cultured in RPMI-1640 medium (cat. no.
C11875500BT; Gibco; Thermo Fisher Scientific, Inc.), supplemented
with 15% fetal bovine serum (FBS; cat. no. G24-70500; Genial
Biologicals, Inc.) and 1% penicillin/streptomycin (cat. no. CA0075,
Leagene; Beijing Regen Biotechnology Co., Ltd.) at 37°C with 5%
CO2.
Transfection
The pcDNA3.1 cloning vector (cloning sites, NheI and
BamHI) was used to generate the MTCH2-overexpression (OE) plasmid,
which encodes the MTCH2 transcript (accession no. NM_001317231.2).
The plasmid and small interfering (si)RNAs were purchased from
Sangon Biotech Co., Ltd. The sequences of MTCH2 and
AIMP2 siRNAs used were as follows: MTCH siRNA sense
(S), 5′-UCCUCCAACAAUAGGACGAAATT-3′ and anti-sense (AS)
5′-UUUCGUCCUAUUGUUGGAGGATT-3′; AIMP2 siRNA1 S,
5′-GAUGCAGACUUGGAUGUAATT-3′ and AS, 5′-UUACAUCCAAGUCUGCAUCTT-3′;
AIMP2 siRNA2 S, 5′-GAUUCACUUUAAUUUGGAATT-3′ and AS,
5′-UUCCAAAUUAAAGUGAAUCTT-3′; AIMP2 siRNA3 S,
5′-AGUGCUUUGGAGAACAGAATT-3′ and AS 5′-UUCUGUUCUCCAAAGCACUTT-3′; and
negative control (NC) S, 5′-UUCUCCGAACGUGUCACGUTT-3′ and AS,
5′-ACGUGACACGUUCGGAGAATT-3′. SK-OV-3 cells were seeded into 6-well
cell culture plates. The OE transfection plasmid (1.25 µg/ml) and
siRNAs (50 pmol/ml) were separately transfected into SK-OV-3 cells
using the Lipo8000™ transfection reagent (cat. no. C0533; Beyotime
Institute of Biotechnology) at 37°C for 24 h. Co-transfection with
AIMP2 siRNA and MTCH2 siRNA or MTCH2-OE was performed
to study the downstream mechanism of MTCH2 (34). The control group comprises
untransfected cells. The efficiency of the transfection was
evaluated through western blotting. After 24 h, cells were
collected and used in the follow-up experiments.
Human tissue samples
Tumor tissue samples were collected from high-grade
serous ovarian carcinoma (HGSOC). The samples were collected in May
2021. Tumor tissues and normal tissues adjacent to tumor tissues
(≥4 cm from the tumor edge) (35)
were collected from 67 patients with HGSOC at The Fourth Hospital
of Hebei Medical University (Shijiazhuang, China). Patients with a
history of chemotherapy or radiotherapy were excluded from the
present study. Paired tumor tissues and adjacent normal tissues
were collected and stored in liquid nitrogen until further use. The
protocol was approved by the Ethics Committee of The Fourth
Hospital of Hebei Medical University (approval no. 2020166; March
14 2021; Shijiazhuang, China). All protocols were performed in
accordance with the Declaration of Helsinki.
Immunohistochemical staining
OC and adjacent normal tissue samples were fixed
using 10% formalin at room temperature for 3 h, embedded in
paraffin and sectioned to a 4-µm thickness. After dewaxing with
xylene and rehydrated in a decreasing concentration of ethanol,
antigen retrieval was performed in a microwave (100°C for 7 min).
Endogenous peroxidase activity was quenched with 3%
H2O2 for 12 min at 37°C and sections were
then blocked with 5% sheep serum (cat. no. ZLI-9056; OriGene
Technologies, Inc.) at room temperature for 10 min. After which,
the sections were incubated at 4°C overnight with primary
antibodies against MTCH2 (1:200; cat. no. 16888-1-AP; Proteintech
Group, Inc.) and AIMP2 (1:200; cat no. 10424-1-AP; Proteintech
Group, Inc.). The next day, the slides were incubated with
secondary antibodies (cat. no. PV-9000; OriGene Technologies, Inc.)
at 37°C for 20 min. Staining was performed using
3,3-diaminobenzidine (cat. no. ZLI-9019; OriGene Technologies,
Inc.) at room temperature for 5 min and sections were
counterstained using hematoxylin for 3 min. A fluorescence
microscope used to capture the images. Evaluation of the tissue
sample staining intensity was performed as previously described by
Wang et al (36). Sections
were scored according to the staining intensity as follows:
Negative staining, 0; weak positivity, 1; moderate positivity, 2;
and strong positivity, 3 points. Further scoring was performed
according to the proportion of the section with positive staining
as follows: 0–10%, 1; 10–50%, 2; 51–80%, 3; and >80%, 4 points.
Subsequently, the two scores were multiplied and the resulting
score ranged from 0 to 12. Scores from 0 to 3 were considered
negative and scores from 4 to 12 were considered positive. In
addition, the mean density was calculated using the following
formula: Mean density=IOD/area, where IOD indicates integrated
optical density value. The protein expression levels were
quantitatively analyzed using Image-Pro Plus software (version 6;
Media Cybernetics, Inc.).
Transwell migration assay
Initially, 300 µl Matrigel was used to coat the
upper chamber of a Transwell system (24-well plate; pore size, 8.0
µm) at 37°C for 3 h. SK-OV-3 cells were first cultured in
serum-free RPMI-1640 medium for 24 h. The next day, SK-OV-3 cells
(1×10⁵ cells/ml) were seeded into the upper chambers
with serum-free RPMI-1640 medium. RPMI-1640 medium supplemented
with 15% FBS and 1% penicillin/streptomycin was added into the
bottom of a 24-well plate and placed in an incubator for 48 h
(37°C, 5% CO2). Following this, 4% paraformaldehyde
(cat. no. DF0135; Leagene; Beijing Regen Biotechnology Co., Ltd.)
was used to fix the migrated cells for 10 min and 0.1% crystal
violet (cat. no. G1063; Beijing Solarbio Science & Technology
Co., Ltd.) was used to stain the cells for 20 min at room
temperature. Any residual cells that remained in the upper chambers
were gently removed using a cotton swab after staining. A CX31
inverted light microscope (Olympus Corporation) was used to image
randomly selected fields of view to evaluate the migrated
cells.
Wound healing assay
SK-OV-3 cells (3×10⁵ cells/well) were
seeded in 6-well plates and transfected with MTCH2-OE and
MTCH2 siRNA for 48 h according to the aforementioned method.
When the cell density reached ~90%, 200 µl pipette tips were used
to scratch two parallel lines in the central area where the cells
grew. PBS was used to wash each well twice, after which, the cells
were cultured for 48 h in serum-free RPMI-1640 medium. Images of
the scratched area were captured using a CX31 inverted light
microscope (Olympus Corporation) at 0 and 24 h. The images were
analyzed using the Image-Pro Plus software (version 6; Media
Cybernetics, Inc.). The cell migration distance was calculated as
follows: (width of the wound at 0 h-width of the wound at 24
h)/width of the wound at 0 h.
Detection of ATP production
ATP content was detected using an ATP fluorescent
probe pCMV-AT1.03 (cat. no. D2604, Beyotime Institute of
Biotechnology) which allowed ATP levels to be monitored within
living single cells in real time. SK-OV-3 cells (2×10⁵
cells/well) were seeded in 12-well plates and cultured at 37°C in
5% CO2 for 24 h. Next, 12 µl pCMV-AT1.03 was added to
each well and cultured for 24 h at 37°C. The cells were then imaged
at 24-h timepoints using a BX53 fluorescence microscope (Olympus
Corporation) and fluorescence intensities were calculated using
Image-Pro Plus software (version 6; Media Cybernetics, Inc.).
Mitochondrial activity detection
The mitochondrial network structure was evaluated
using Mito-Tracker Red CMXRos (cat. no. C1049B; Beyotime Institute
of Biotechnology) according to the manufacturer's instructions.
SK-OV-3 cells (1×10⁵ cells/well) were transfected as
aforementioned and cultured in 6-well plates for 24 h. The
Mito-Tracker Red CMXRos working solution was prepared by adding 1
µl of 200 µM Mito-Tracker Red CMXRos storage solution to 1 ml of
cell culture medium (final concentration, 200 nM) mixed well and
the cells were then incubated with this working solution for 45
min. The staining solution was then replaced with fresh culture
medium prior to imaging. Images were captured of living cells using
a fluorescence microscope (BX53; Olympus Corporation) and the
fluorescence intensities analyzed using Image-Pro Plus software
(version 6, Media Cybernetics).
EdU proliferation assay
The BeyoClick™ EdU-594 Cell Proliferation Assay kit
(cat. no. C0078S; Beyotime Institute of Biotechnology) was used to
detect the proliferation rate of OC cells, according to the
manufacturer's instructions. Briefly, SK-OV-3 cells
(1×10⁴ cells) were cultured in a cell incubator at 37°C
(5% CO2) for 24 h. Cells were treated with 10 µM of
prewarmed EdU working solution at 37°C for 2 h. Then, the cells
were fixed with 4% paraformaldehyde for 15 min at room temperature,
followed by rinsing three times with PBS solution containing 3% BSA
(3 min/wash). The cells were then incubated with PBS containing
0.3%Triton X-100 for 15 min at room temperature. Next, 0.5 ml Click
reaction solution was added and incubated in the dark for 30 min at
room temperature. The cells were counterstained with DAPI (10
µg/ml) at room temperature for 3 min and imaged using a BX53
fluorescence microscope (Olympus Corporation). The number of
positively stained proliferating cells were counted for analysis of
proliferation rate.
Caspase-3 activity and annexin V cell
apoptosis assay
Apoptosis was detected using Caspase-3 Activity and
Apoptosis Detection kit for Live Cells (cat. no. C1077S; Beyotime
Institute of Biotechnology) according to the manufacturer's
instructions. SK-OV-3 cells were washed with PBS, following which
194 µl annexin V-mCherry Binding Buffer and 5 µl Annexin V-mCherry
and 1 µl GreenNuc™ Caspase-3 Substrate (1 mM) were added, gently
mixed and incubated at room temperature in the dark for 30 min.
Images were captured using a BX53 fluorescence microscope (Olympus
Corporation). Annexin V-mCherry labels apoptotic cells with red
fluorescence and GreenNuc™ Caspase-3 Substrate labels the nuclei of
apoptotic cells with green fluorescence representing caspase-3
activity. The number of apoptotic cells was calculated as
follows=(number of apoptotic cells/number of total cells) ×100.
Cytoskeleton remodeling
SK-OV-3 cells (1×10⁵ cells) were spread
on slides, fixed with 3.7% formaldehyde in PBS solution for 20 min
at room temperature and then washed thrice with PBS containing 0.1%
Triton X-100 at room temperature (5 min/wash). Actin-Tracker Green
(cat. no. C2201S; Beyotime Institute of Biotechnology) was added
dropwise onto the slides and incubated in the dark at room
temperature for 60 min. Next, the cells were washed three times
with PBS containing 0.1% Triton X-100 at room temperature (5
min/wash), the plates were air-dried, counterstained with DAPI at
room temperature for 3 min and images were captured using a BX53
fluorescence microscope (Olympus Corporation). The images were
analyzed using the Image-Pro Plus software (version 6; Media
Cybernetics, Inc.).
Cellular immunofluorescence
SK-OV-3 cells (2×10⁵ cells) were fixed
using 4% paraformaldehyde at room temperature for 10 min,
permeabilized with 0.1% Triton-X-100 in PBS and blocked with goat
serum (cat. no. ZLI-9056; OriGene Technologies, Inc.). The cells
were then incubated with primary antibodies against MTCH2 (1:200;
cat no. 16888-1-AP; Proteintech Group, Inc.) and AIMP2 (1:100; cat
no. 10424-1-AP; Proteintech Group, Inc.) at 4°C overnight. Next,
using dilution buffer (cat. no. ZLI-9030; OriGene Technologies,
Inc.) to dilute the antibody, cells were incubated with Alexa
Fluor® 488 goat anti-rabbit IgG (1:100; cat. no.
ZF-0511; OriGene Technologies, Inc.) secondary antibodies was
performed at 37°C for 1 h. PBS was used to wash the section thrice
and DAPI was used to stain the nucleus at room temperature for 5
min. Images were captured using a BX53 fluorescence microscope
(Olympus Corporation). The fluorescence intensities were analyzed
using the Image-Pro Plus software (version 6; Media Cybernetics,
Inc.).
Co-immunoprecipitation (co-IP)
The cells were lysed with Lysis Buffer with Protease
Inhibitor Cocktail from the IP kit (cat. no. P2179M; Beyotime
Institute of Biotechnology). Lysed cells were centrifuged at 13,000
× g for 20 min at 4°C and the supernatant was collected, of which
50 µl was taken for use as the positive control input group. From
each sample, 2 µl was used to determine the concentration and the
remaining supernatant was stored for subsequent use. The antibodies
used for IP were MTCH2 (3 µg; cat no. 16456-1-AP; Proteintech
Group, Inc.) and AIMP2 (3 µg; cat. no. 10424-1-AP; Proteintech
Group, Inc.) and 3 µg of normal IgG was used as a negative control
group. Next, 100 µl Protein A+G magnetic beads (cat. no. P2179M;
Beyotime Institute of Biotechnology) were added and incubated with
antibodies and IgG on a shaker at 4°C for 2 h. The precipitate was
collected by centrifugation at 1,000 × g for 5 min at 4°C. The
500-µl cell lysates were added to protein A+G magnetic beads
conjugated with antibody or normal IgG on a shaker at 4°C overnight
to bind the proteins to the antibodies. The next day, the samples
were centrifuged at 1,000 × g for 5 min at 4°C and the supernatant
discarded. The precipitate was washed four times with PBS using 1
ml each time. The precipitate and the input (50 µl of the
supernatant after cell lysis) were boiled at 95°C for 5 min with 1×
loading buffer (cat. no. ZS306; Beijing Zoman Biotechnology Co.,
Ltd.). The samples were centrifuged at 1,000 × g for 5 min and the
supernatant was used as samples for MTCH2-IP and AIMP2-IP
experimental groups for western blotting.
Western blot assay
Total protein was extracted from cells using a Total
Protein Extraction kit (cat. no. KGP2100; Nanjing KeyGen Biotech
Co., Ltd.). The BCA protein quantification kit (cat. no. PT0001,
Leagene; Beijing Regen Biotechnology Co., Ltd.) was used to
quantify the concentrations of extracted total proteins. The
proteins were then separated by SDS-PAGE on a 9% gel and
transferred on to PVDF membranes. The membranes were blocked with
5% milk/TBST (0.05% Tween) for 1 h at room temperature to prevent
non-specific binding. The membranes were incubated with MTCH2
(1:1,000; cat. no. 16888-1-AP; Proteintech Group, Inc.), claudin-3
(1:1,000; cat. no. AF0129; Affinity Biosciences), AIMP2 (1:1,000;
cat. no. 10424-1-AP; Proteintech Group, Inc.) and β-actin (1:5000,
cat. no. AF7018; Affinity Biosciences) overnight at 4°C. Following
primary antibody incubation, the membranes were incubated with
horseradish peroxidase-conjugated secondary antibodies (cat. no.
ZB-2301; OriGene Technologies, Inc.) at room temperature for 1 h.
Protein bands were visualized using electrochemiluminescence
solution (cat. no. P1050; Applygen Technologies, Inc.). ImageJ
software (version 2.14.0; National Institutes of Health) was used
for data analysis.
Statistical analysis
Statistical analysis was conducted using SPSS
(version 27; IBM Corp.). Data were presented as mean ± standard
deviation. Paired Student's t-test was used to compare two groups.
Multiple groups were compared using a one-way ANOVA followed by
Bonferroni's post hoc test. Correlation analysis was performed
using Pearson correlation test. A survival analysis was performed
using Kapan-Meier analysis and log rank test. Contingency tables
were assessed using the χ2 test. Data presentation was
performed using the GraphPad Prism software (version 8; Dotmatics).
P<0.05 was considered to indicate a statistically significant
difference.
Results
MTCH2, claudin-3 and AIMP2 were
upregulated in OC tumor samples
The expression levels of MTCH2, AIMP2 and claudin-3
in OC and adjacent normal tissues were evaluated in tissue samples
from 67 patients with OC (median age, 57 years; range, 24-72
years). Immunohistochemical results showed significantly increased
expression levels of MTCH2, AIMP2 and claudin-3 in OC tissue
samples compared with in adjacent normal tissue samples (Fig. 1A-D), and the tumor samples were
scored). According to the immunohistochemical scoring criteria, in
OC tissues, 46 cases were positive for MTCH2 and 21 were negative;
42 cases were positive for AIMP2 and 25 were negative; and 43 cases
were positive for claudin-3 and 24 were negative (Fig. S1; Table
I). Pearson correlation analysis demonstrated a significant
positive correlation between MTCH2 expression levels and the
expression levels of both AIMP2 and claudin-3 (Table II). Subsequently, the relationship
between MTCH2 and the clinicopathological features of patients with
OC were assessed, and it was demonstrated that MTCH2 expression
levels were significantly associated with International Federation
of Gynecology and Obstetrics stage (37) and tumor differentiation (Table III). No significant difference in
overall survival time of patients with OC between the MTCH2
mutation group and the MTCH2 control group was detected (Fig. 1E).
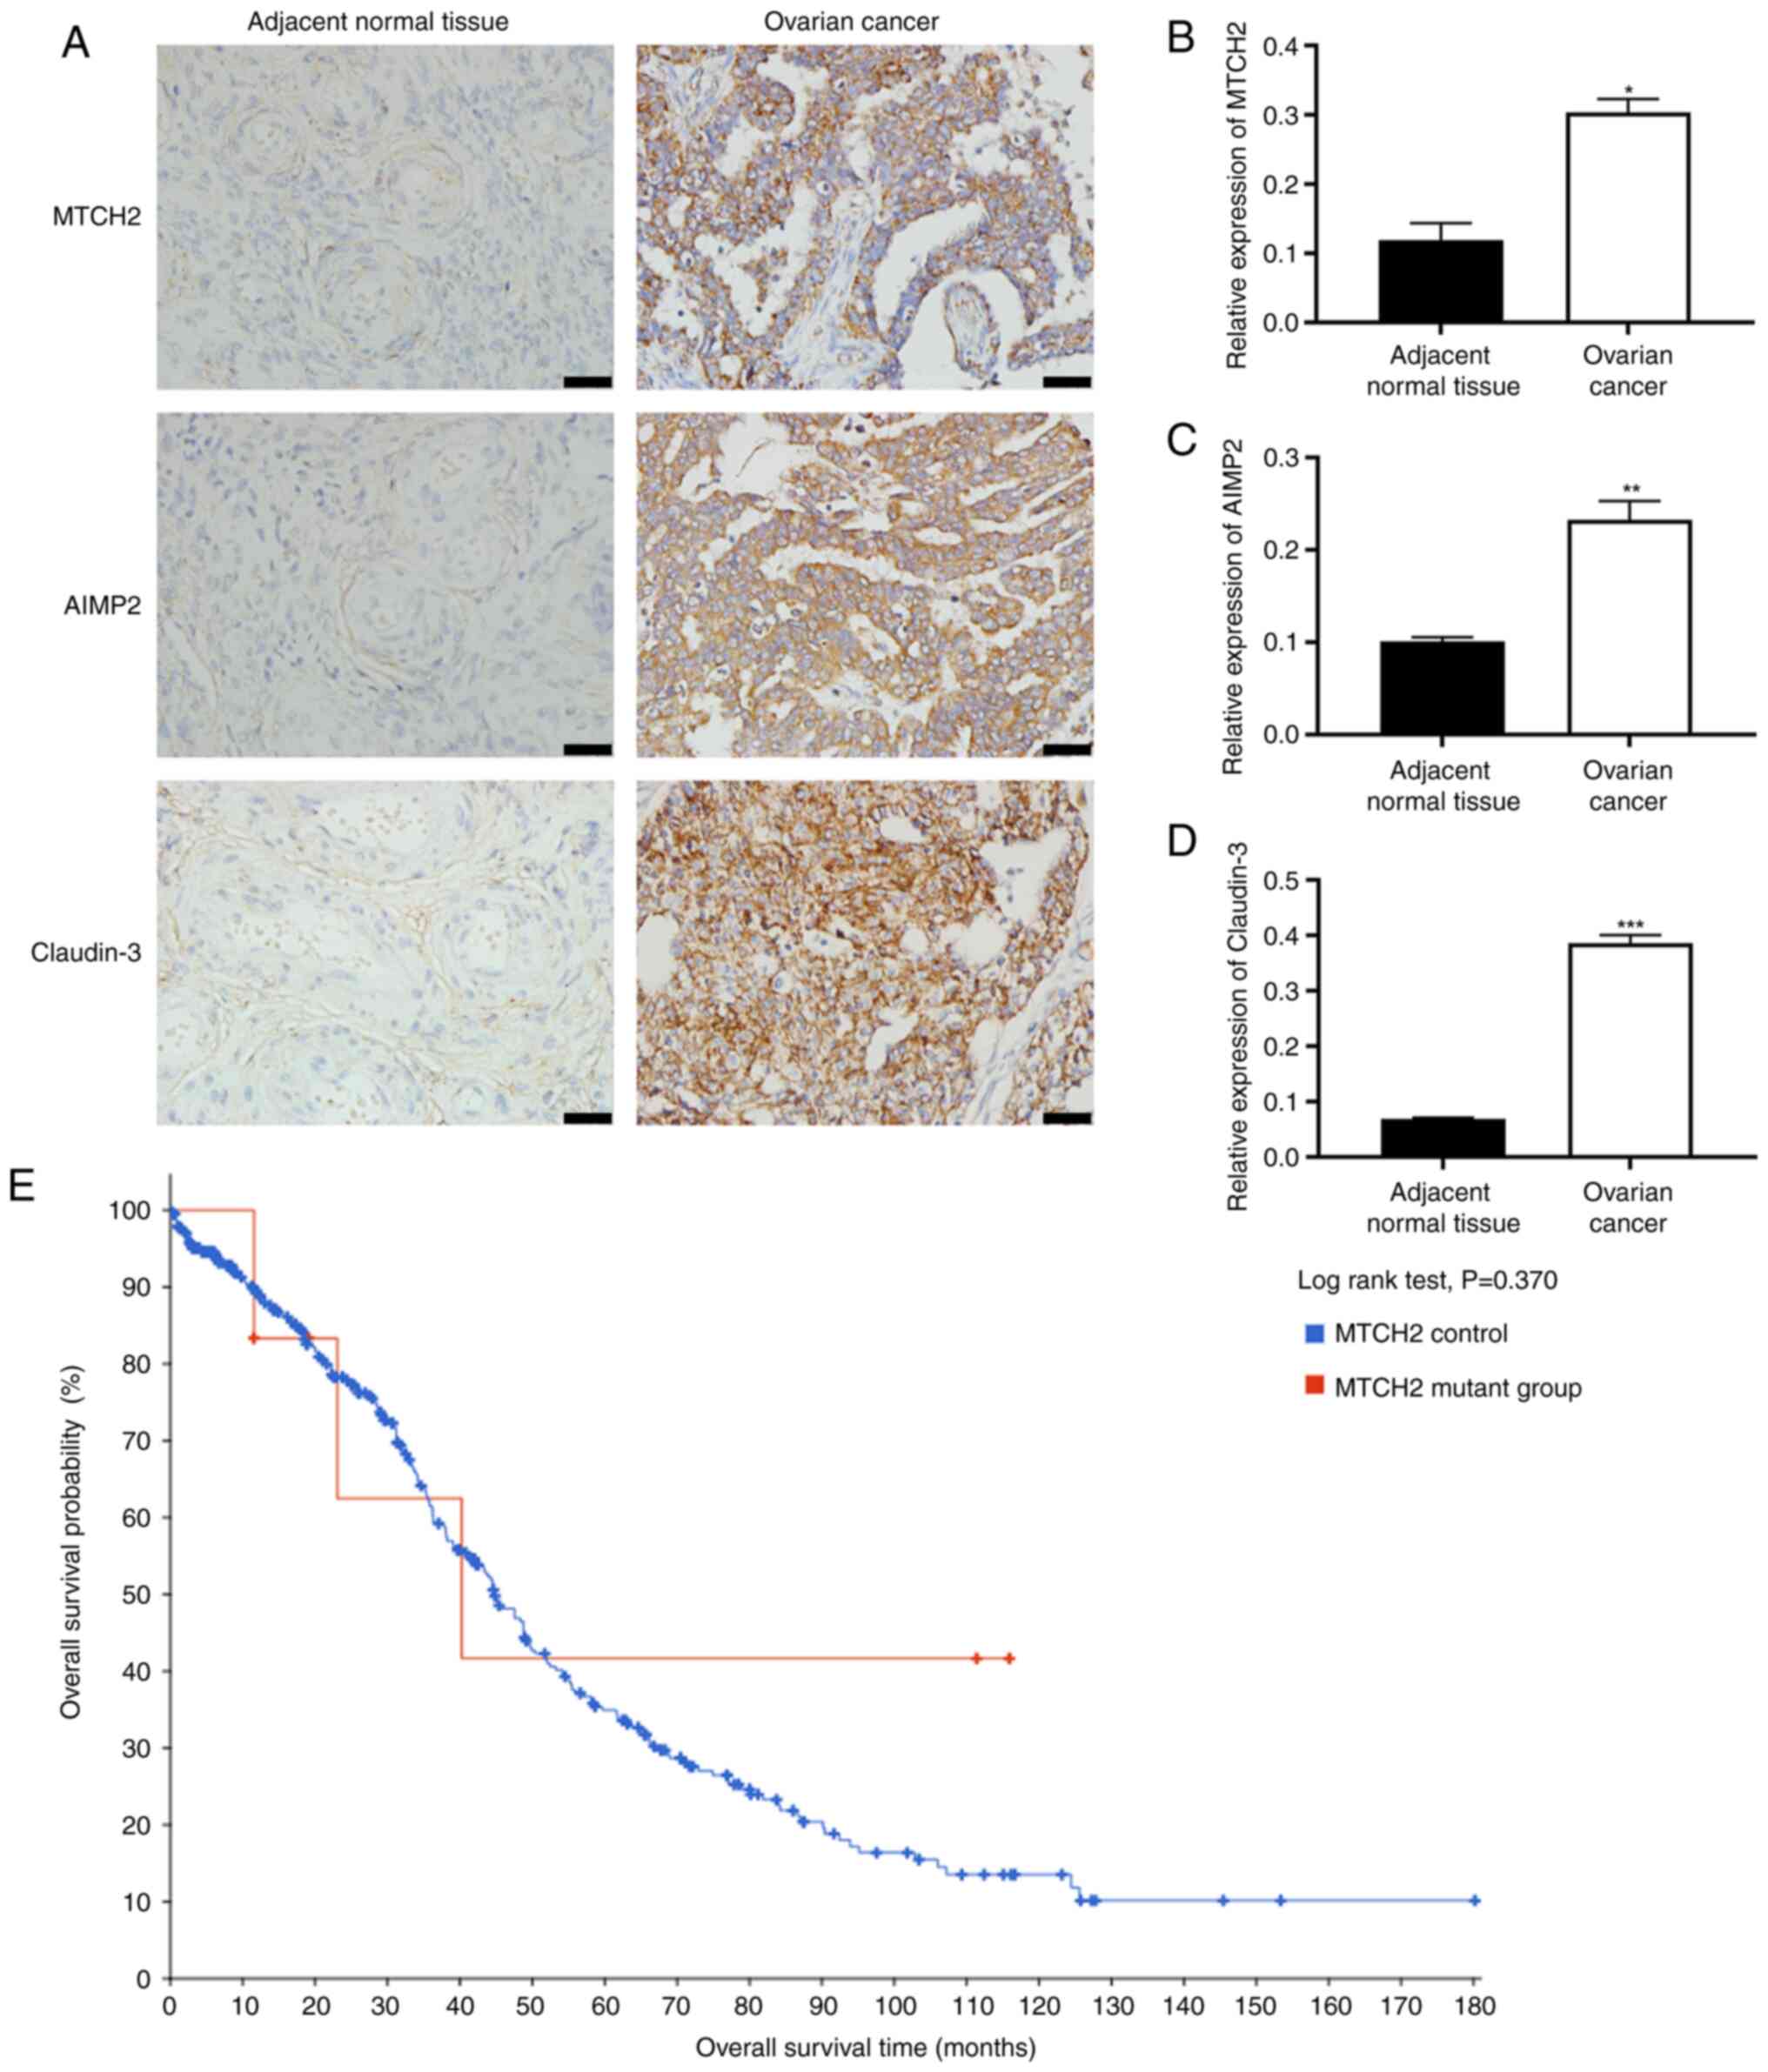 | Figure 1.Increased expression levels of MTCH2,
AIMP2 and claudin-3 in OC tissue samples. (A) Representative images
of immunohistochemical staining of MTCH2, AIMP2 and claudin-3
expression in OC and adjacent normal tissue samples. Scale bar, 40
µm; magnification, 400×. Quantification of the relative expression
levels of (B) MTCH2, (C) AIMP2 and (D) claudin-3 in OC and adjacent
normal tissue samples. (E) Data from cBioPortal was used to assess
the association between MTCH2 control and MTCH2 mutant groups and
the overall survival time of patients with OC. *P<0.05,
**P<0.01, ***P<0.001. OC, ovarian cancer; MTCH2,
mitochondrial carrier homology 2; AIMP2, aminoacyl transfer RNA
synthetase-interacting multifunctional protein 2. |
 | Table I.MTCH2, AIMP2 and claudin-3 expression
in adjacent normal tissues and ovarian cancer tissues. |
Table I.
MTCH2, AIMP2 and claudin-3 expression
in adjacent normal tissues and ovarian cancer tissues.
|
|
| MTCH2
expression | AIMP2
expression | Claudin-3
expression |
|---|
|
|
|
|
|
|
|---|
| Tissue | n | - | + | χ2
value | P-value | - | + | χ2
value | P-value | - | + | χ2
value | P-value |
|---|
| Normal | 67 | 53 | 14 | 30.905 | <0.001 | 50 | 17 | 18.927 | <0.001 | 47 | 20 | 15.848 | <0.001 |
| Ovarian cancer | 67 | 21 | 46 |
|
| 25 | 42 |
|
| 24 | 43 |
|
|
| Table II.Correlation of MTCH2 with claudin-3
and AIMP2 expression levels. |
Table II.
Correlation of MTCH2 with claudin-3
and AIMP2 expression levels.
| Factors | Pearson
correlation | P-value |
|---|
| MTCH2 and
claudin-3 | 0.507 | <0.001 |
| MTCH2 and
AIMP2 | 0.287 | 0.019 |
| Table III.Association between MTCH2 expression
and clinicopathological features in patients with ovarian
cancer. |
Table III.
Association between MTCH2 expression
and clinicopathological features in patients with ovarian
cancer.
| Clinical
parameters | Total patients,
n | MTCH2 positive,
n | MTCH2 negative,
n | P-value |
|---|
| Patients | 67 | 46 | 21 |
|
| Age, years |
|
|
| 0.953 |
|
≤60 | 45 | 31 | 14 |
|
|
>60 | 22 | 15 | 7 |
|
| Tumor size, cm |
|
|
| 0.831 |
| ≤5 | 18 | 12 | 6 |
|
|
>5 | 49 | 34 | 15 |
|
| FIGO stage |
|
|
| 0.014 |
|
I–II | 16 | 7 | 9 |
|
|
II–IV | 51 | 39 | 12 |
|
| Tumor
differentiation |
|
|
| 0.008 |
| G1 | 35 | 19 | 16 |
|
|
G2-G3 | 32 | 27 | 5 |
|
| Lymph node
metastasis |
|
|
| 0.929 |
|
Yes | 25 | 17 | 8 |
|
| No | 42 | 29 | 13 |
|
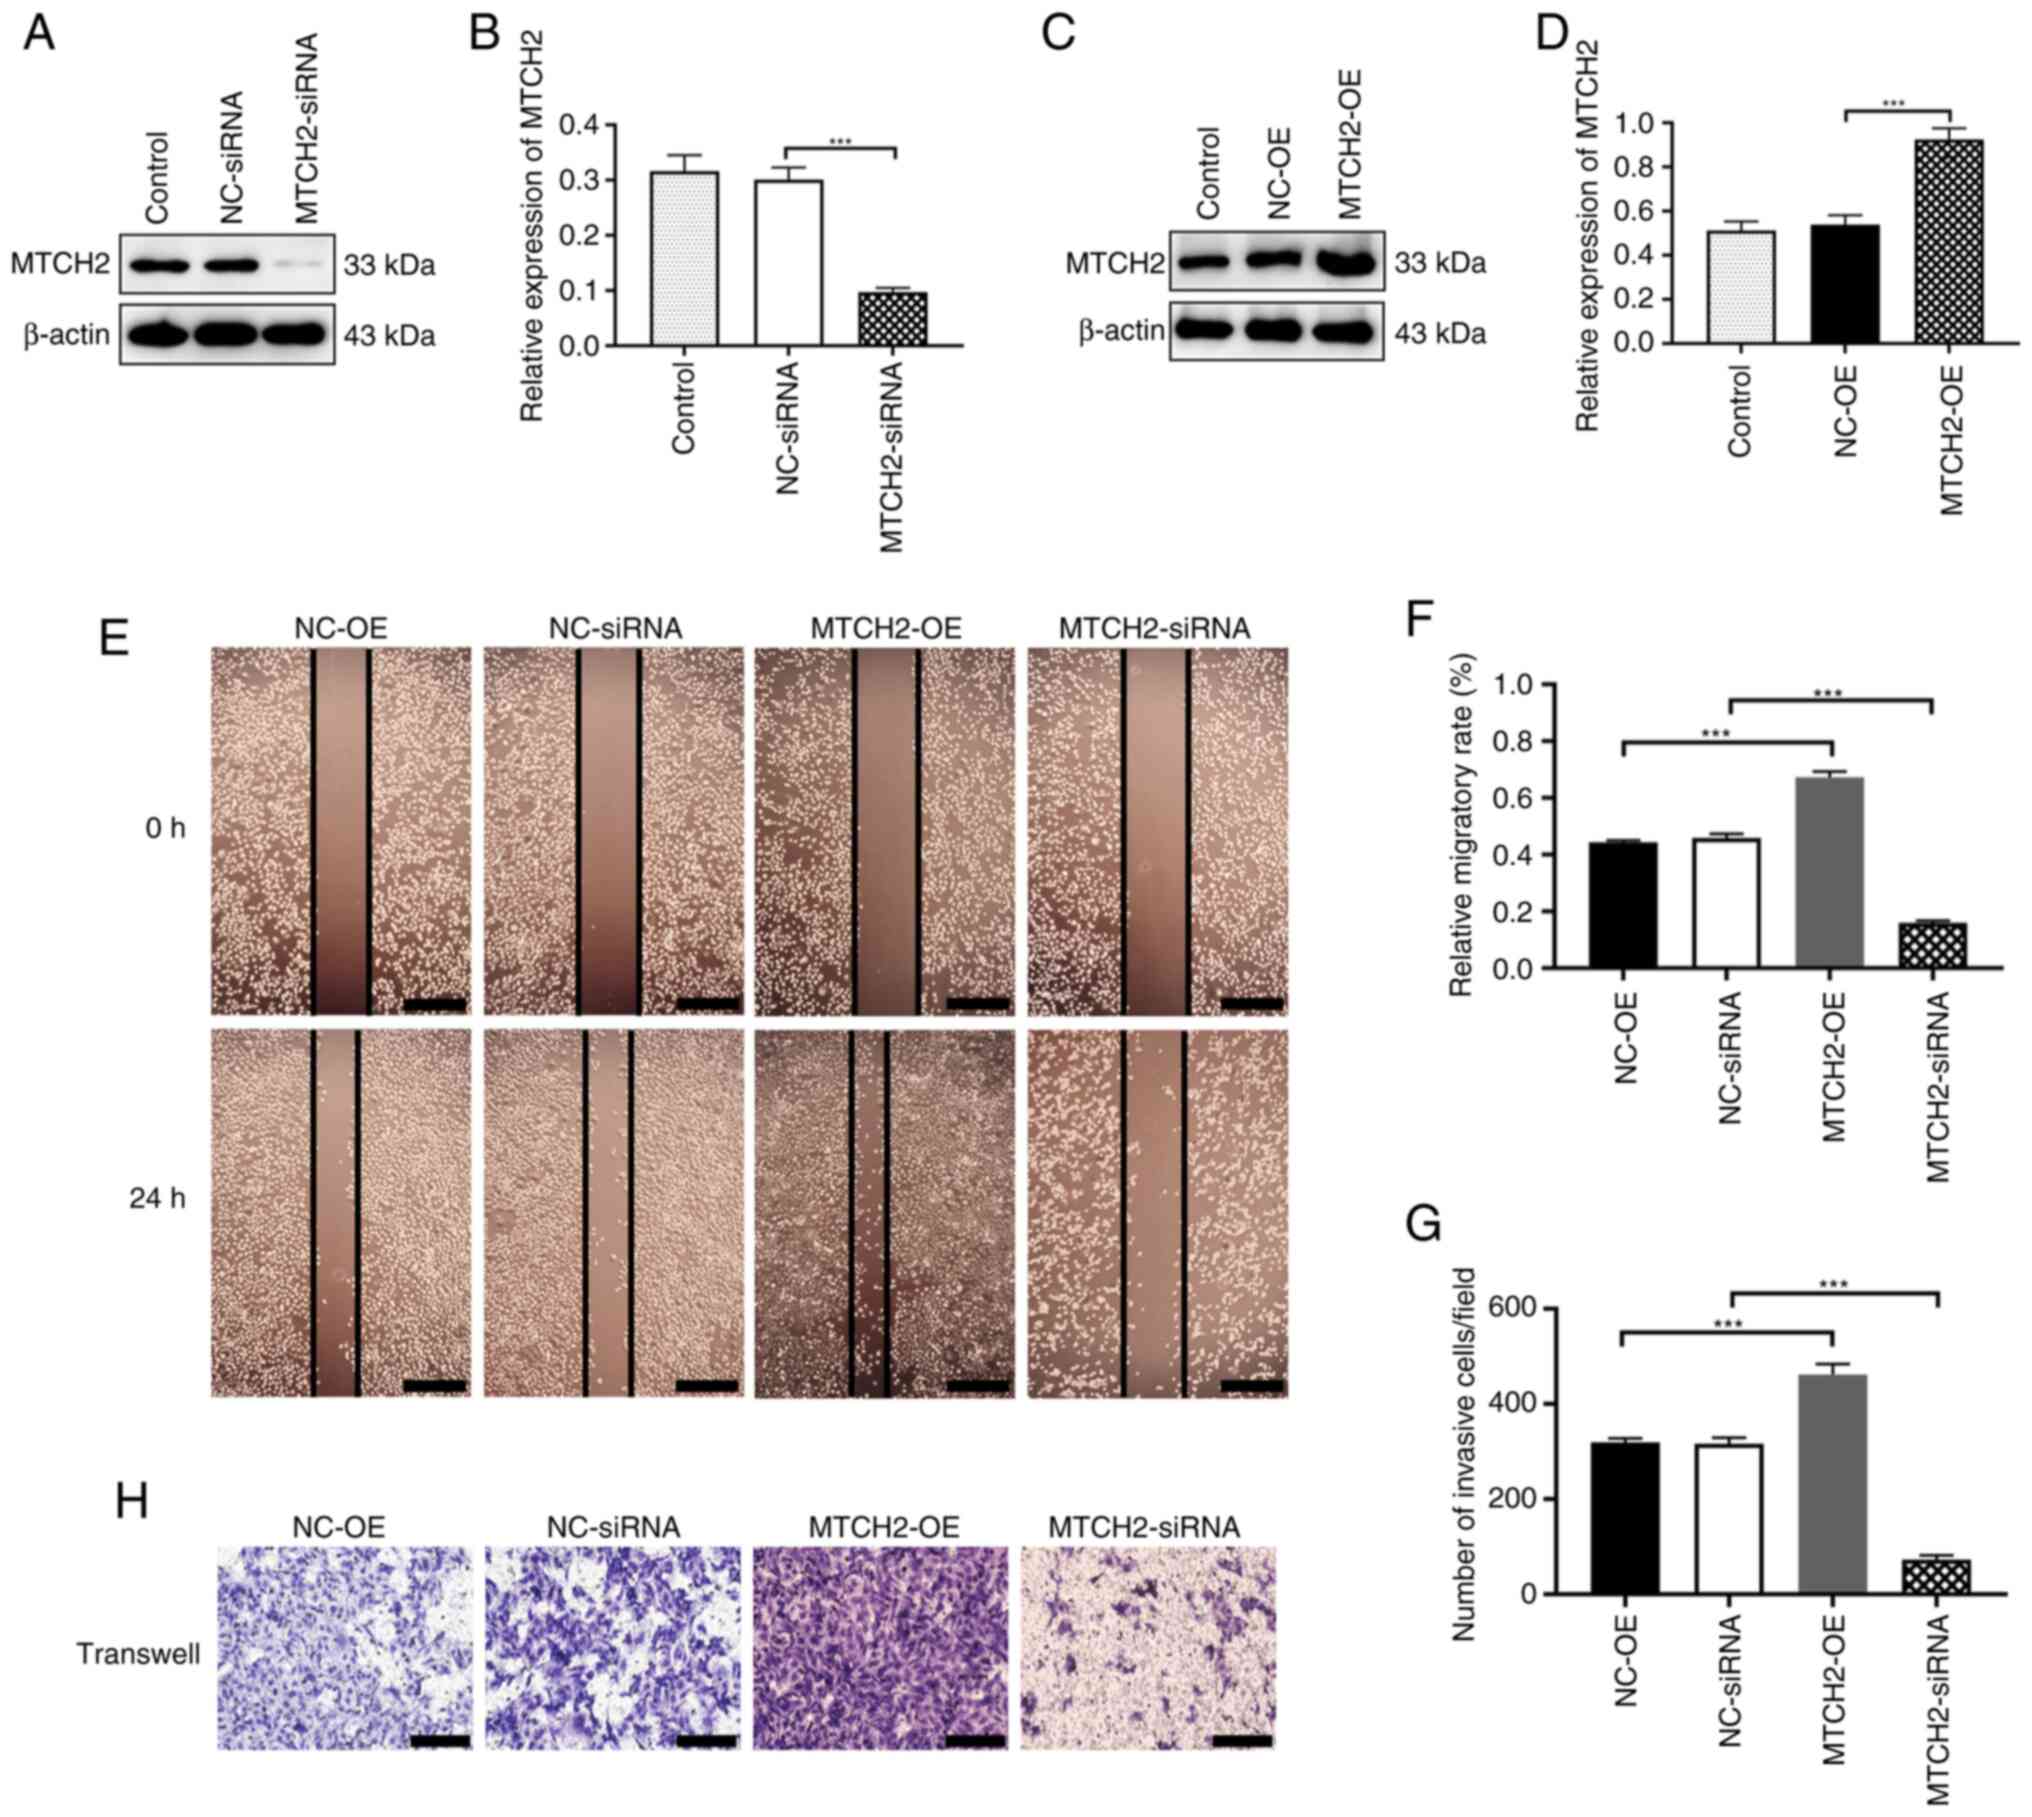
MTCH2 overexpression and knockdown
regulated OC cell migration and invasion
To further explore the role of MTCH2 in OC cells, an
MTCH2 overexpression plasmid and MTCH2 siRNA were
designed and synthesized. Western blotting was used to confirm the
transfection efficiency of the MTCH2-OE plasmid and MTCH2
siRNA in OC cells compared with the negative controls (Fig. 2A-D). The wound healing assay
demonstrated that, compared with the NC-OE group, the scratch area
of the MTCH2-OE group was significantly reduced at 24 h. By
contrast, the scratch area of the MTCH2 siRNA group was
significantly larger compared with the NC-siRNA group (Fig. 2E, F). Transwell assays demonstrated
that the number of migrating cells in the MTCH2-OE group were
significantly increased compared with the NC-OE group (P<0.001),
whereas the number of migrating cells were significantly decreased
in the MTCH2 siRNA group compared with the NC-siRNA group
(Fig. 2G, H).
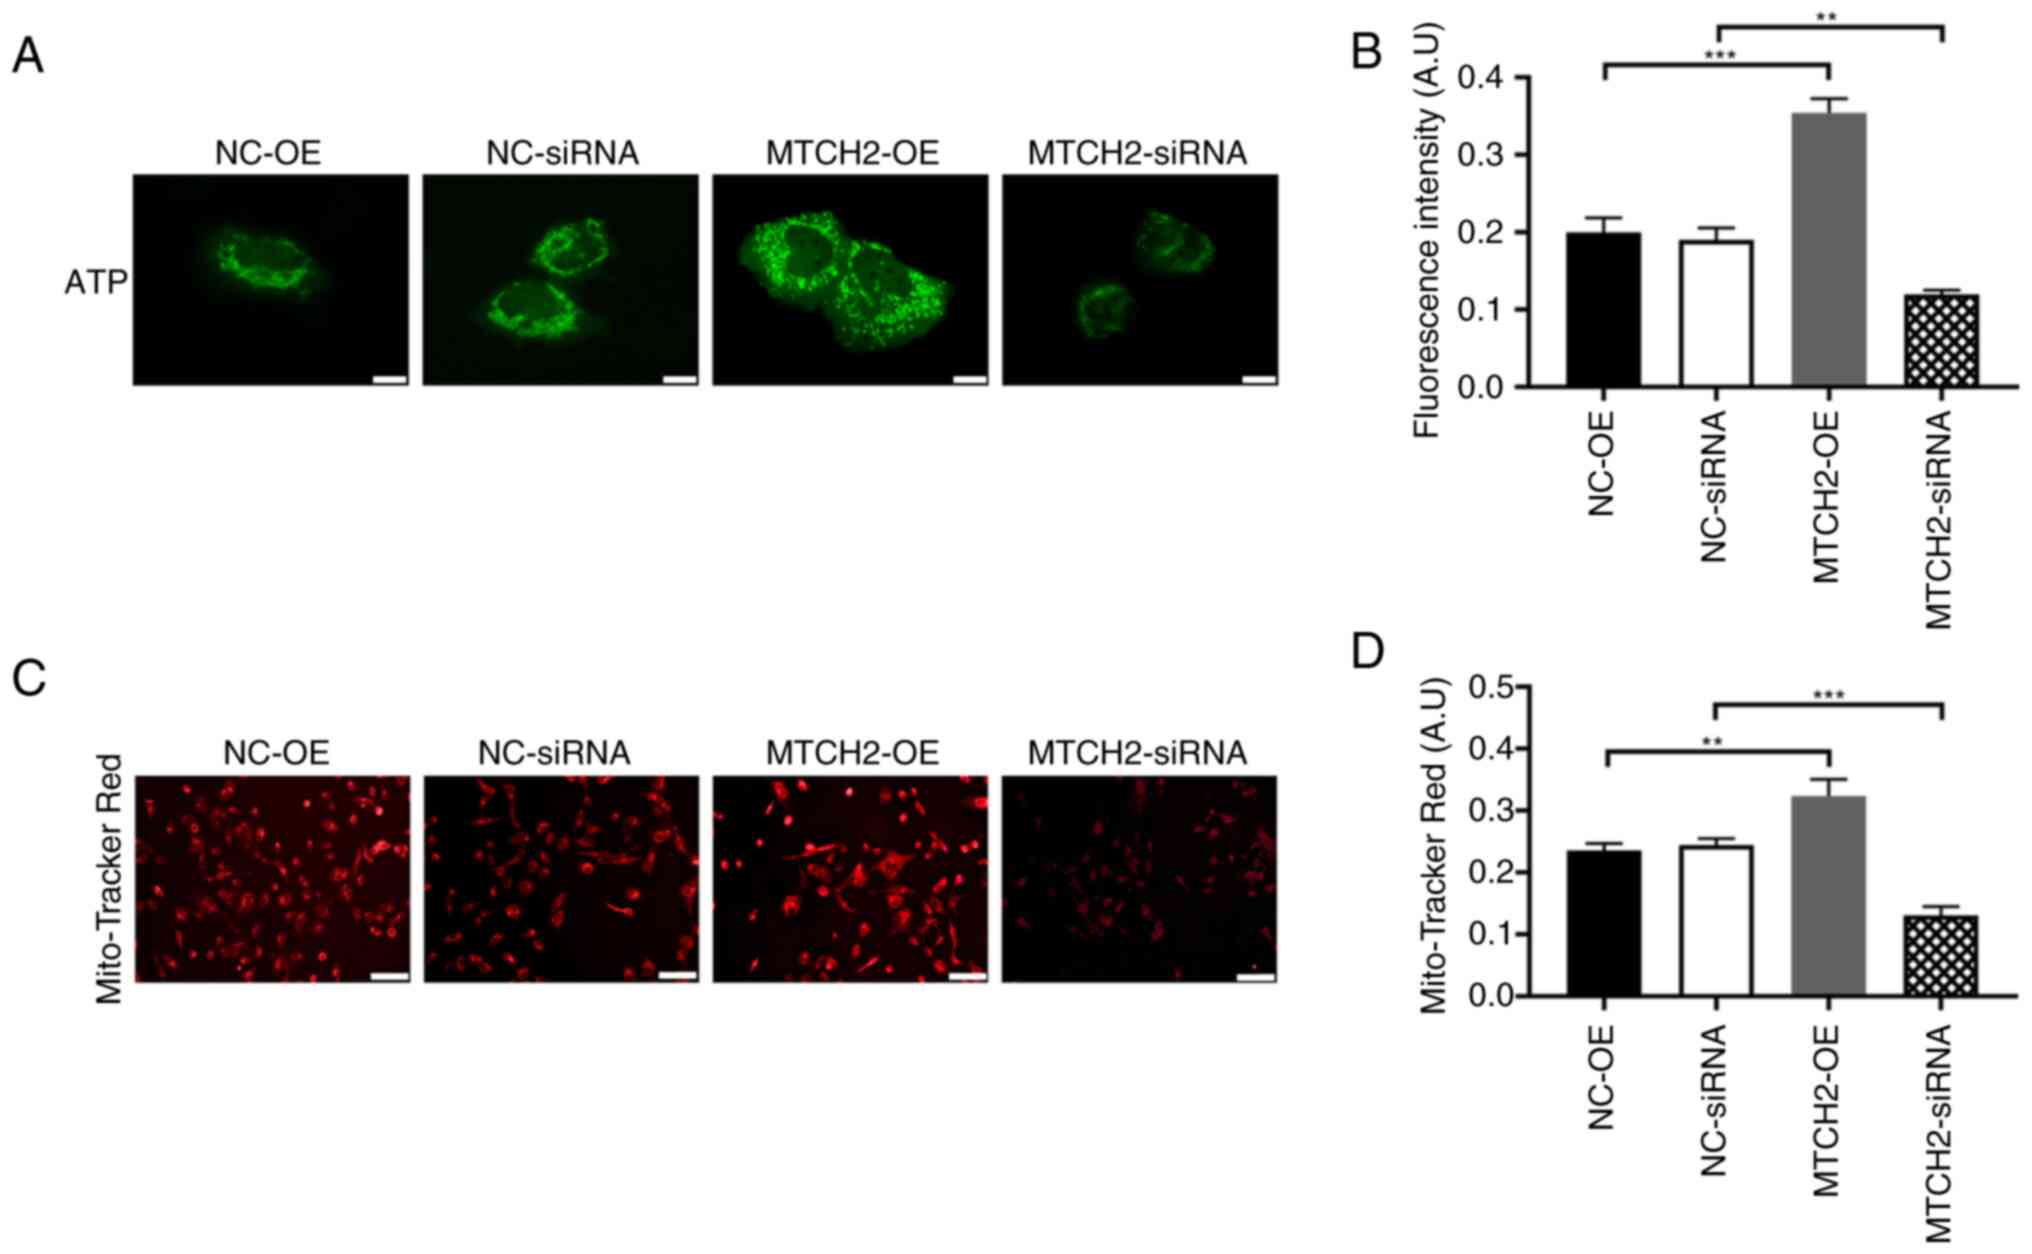
MTCH2 regulated OC cell energy
metabolism, cell proliferation and apoptosis
The ATP fluorescence probe assay demonstrated that
the fluorescence intensity of the MTCH2-OE group was significantly
increased compared with the NC-OE group, which represented
increased ATP production in the MTCH2-OE group. By contrast, the
fluorescence intensity significantly decreased in the MTCH2
siRNA group compared with the NC-siRNA group (P<0.01; Fig. 3A, B). MitoTracker Red CMXRos
staining of mitochondria demonstrated decreased mitochondrial
fluorescence in the MTCH2 siRNA group compared with the
NC-siRNA group, which indicated mitochondrial dysfunction (Fig. 3C, D). The proliferation of OC cells
was assessed through EdU staining. Significantly increased cell
proliferation was observed in the MTCH2-OE group compared with the
NC-OE group, whereas significantly decreased cell proliferation was
demonstrated in the MTCH2 siRNA group compared with the
NC-siRNA (Fig. 4A, B). The number
of apoptotic cells were significantly decreased in the MTCH2-OE
group compared with the NC-OE group, but were significantly
increased in the MTCH2 siRNA group compared with the
NC-siRNA group (P<0.001; Fig. 4C and
D).
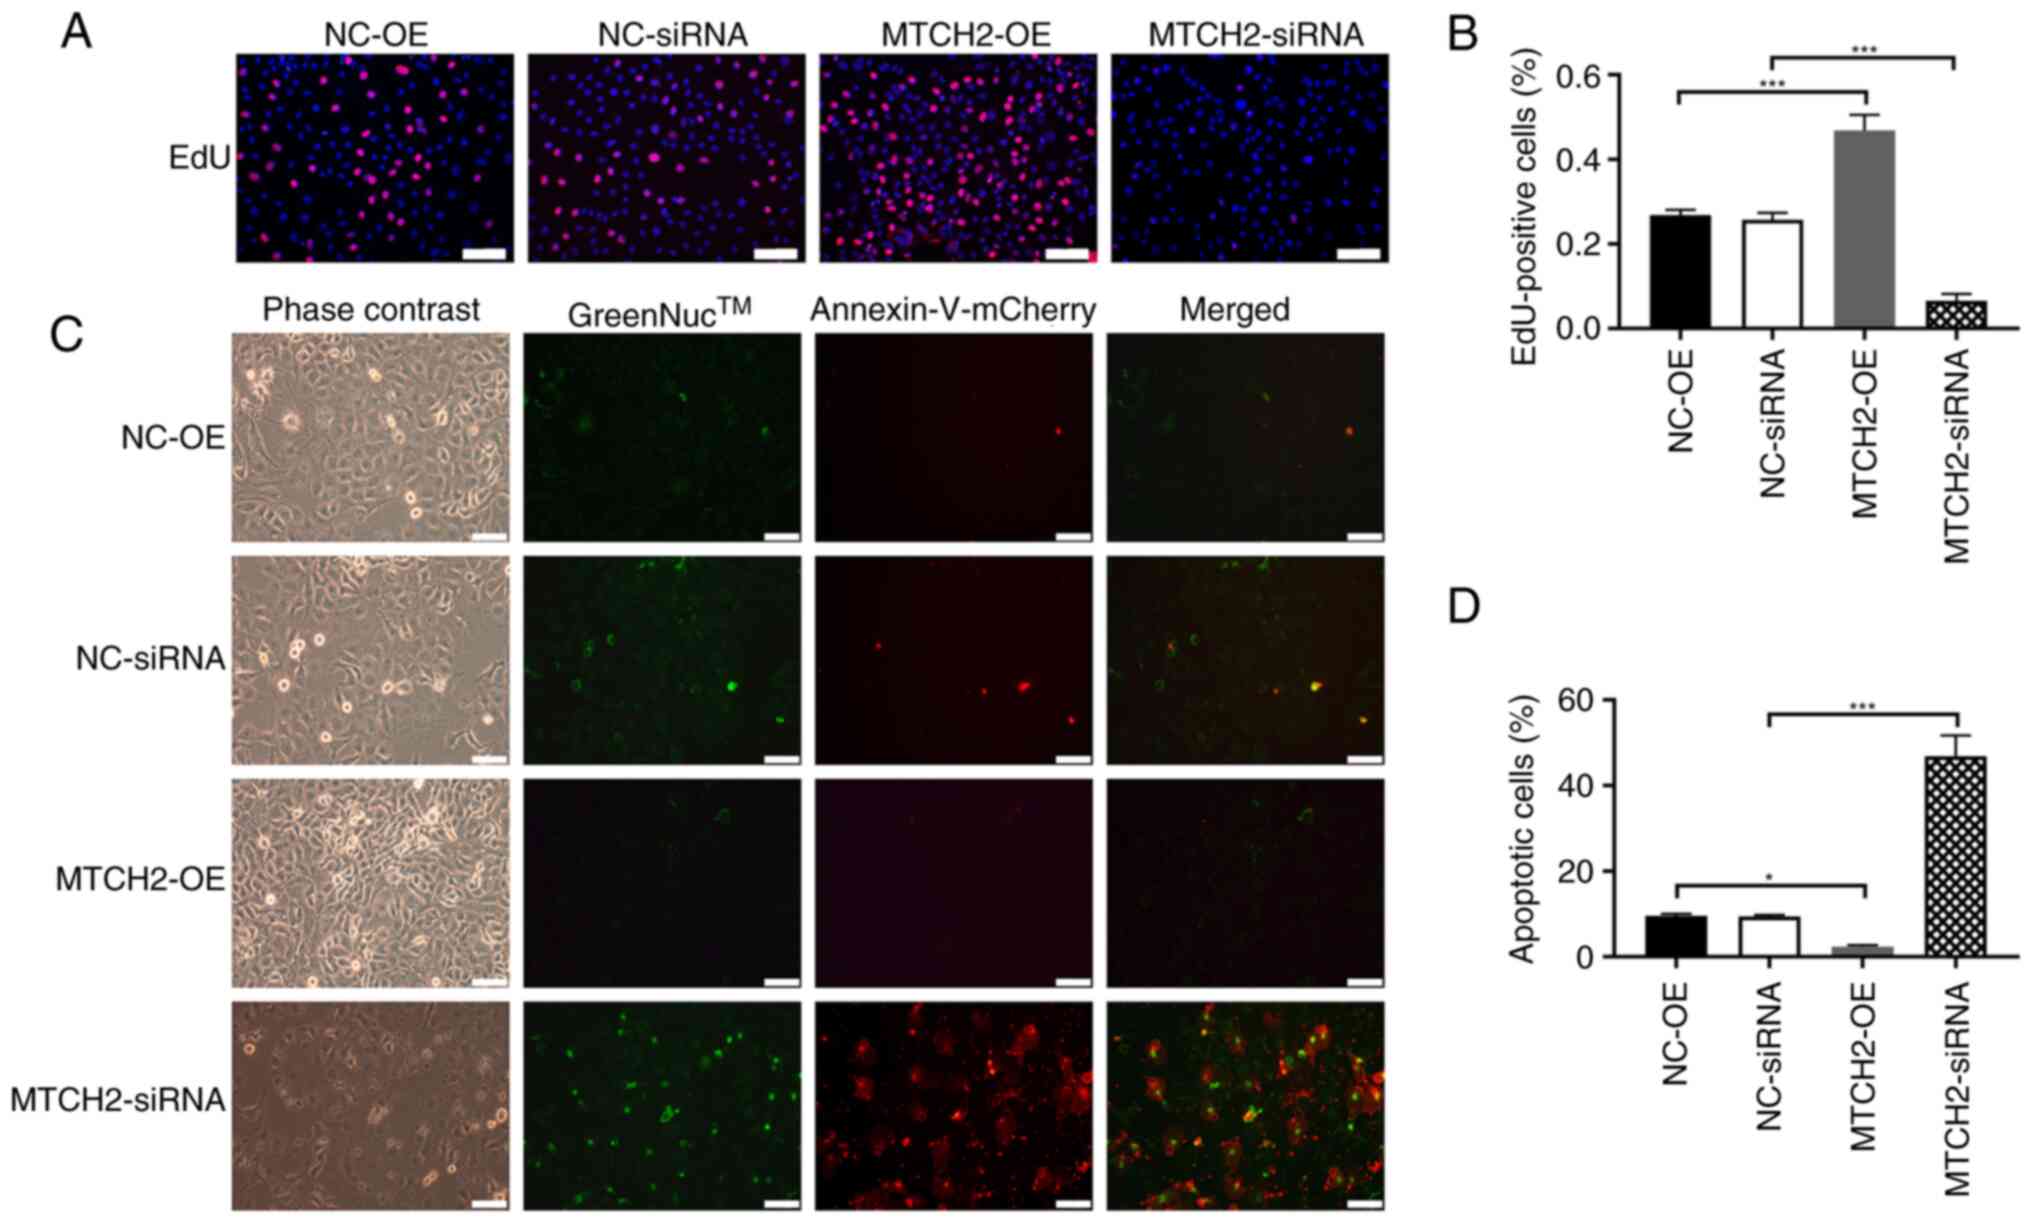 | Figure 4.MTCH2 knockdown and overexpression on
the proliferation and apoptosis of SK-OV3 cells. (A) Representative
images of EdU assay results, which indicated the proliferation of
SK-OV-3 cell following knockdown or overexpression of MTCH2. Scale
bar, 100 µm; magnification, 200×. (B) Quantification of the
EdU-positive cells in these groups. (C) Representative images of
GreenNuc™ caspase-3 activity and annexin V cell apoptosis assay in
SK-OV-3 cells transfected with MTCH2-OE and MTCH2-siRNA
compared with NC-OE and NC-siRNA, respectively and (D)
quantification of the apoptotic cells in these groups. Scale bar,
100 µm; magnification, 200×. *P<0.05 and ***P<0.001. EdU,
5-ethynyl-2′-deoxyuridine; MTCH2, mitochondrial carrier homology 2;
AIMP2, aminoacyl transfer RNA synthetase-interacting
multifunctional protein 2; OE, overexpression; NC, negative
control; siRNA, small interfering RNA. |
MTCH2 regulated cytoskeletal
remodeling and the expression levels of claudin-3 and AIMP2
Transfection with MTCH2-OE in SK-OV-3 cells
demonstrated a significant increase in the fluorescence intensity
of microfilaments, filamentous feet and pseudopodia compared with
the NC-OE group. By contrast, the fluorescence intensity
significantly decreased in the MTCH2 siRNA group compared
with the NC-siRNA group (Fig. 5A,
B). Immunofluorescence and western blot analyses showed that,
compared with the NC-OE group, the expression levels of claudin-3
and AIMP2 were significantly increased in the MTCH2-OE group, and
were significantly reduced in the MTCH2 siRNA group compared
with that in the NC-siRNA group (Fig.
5C-I).
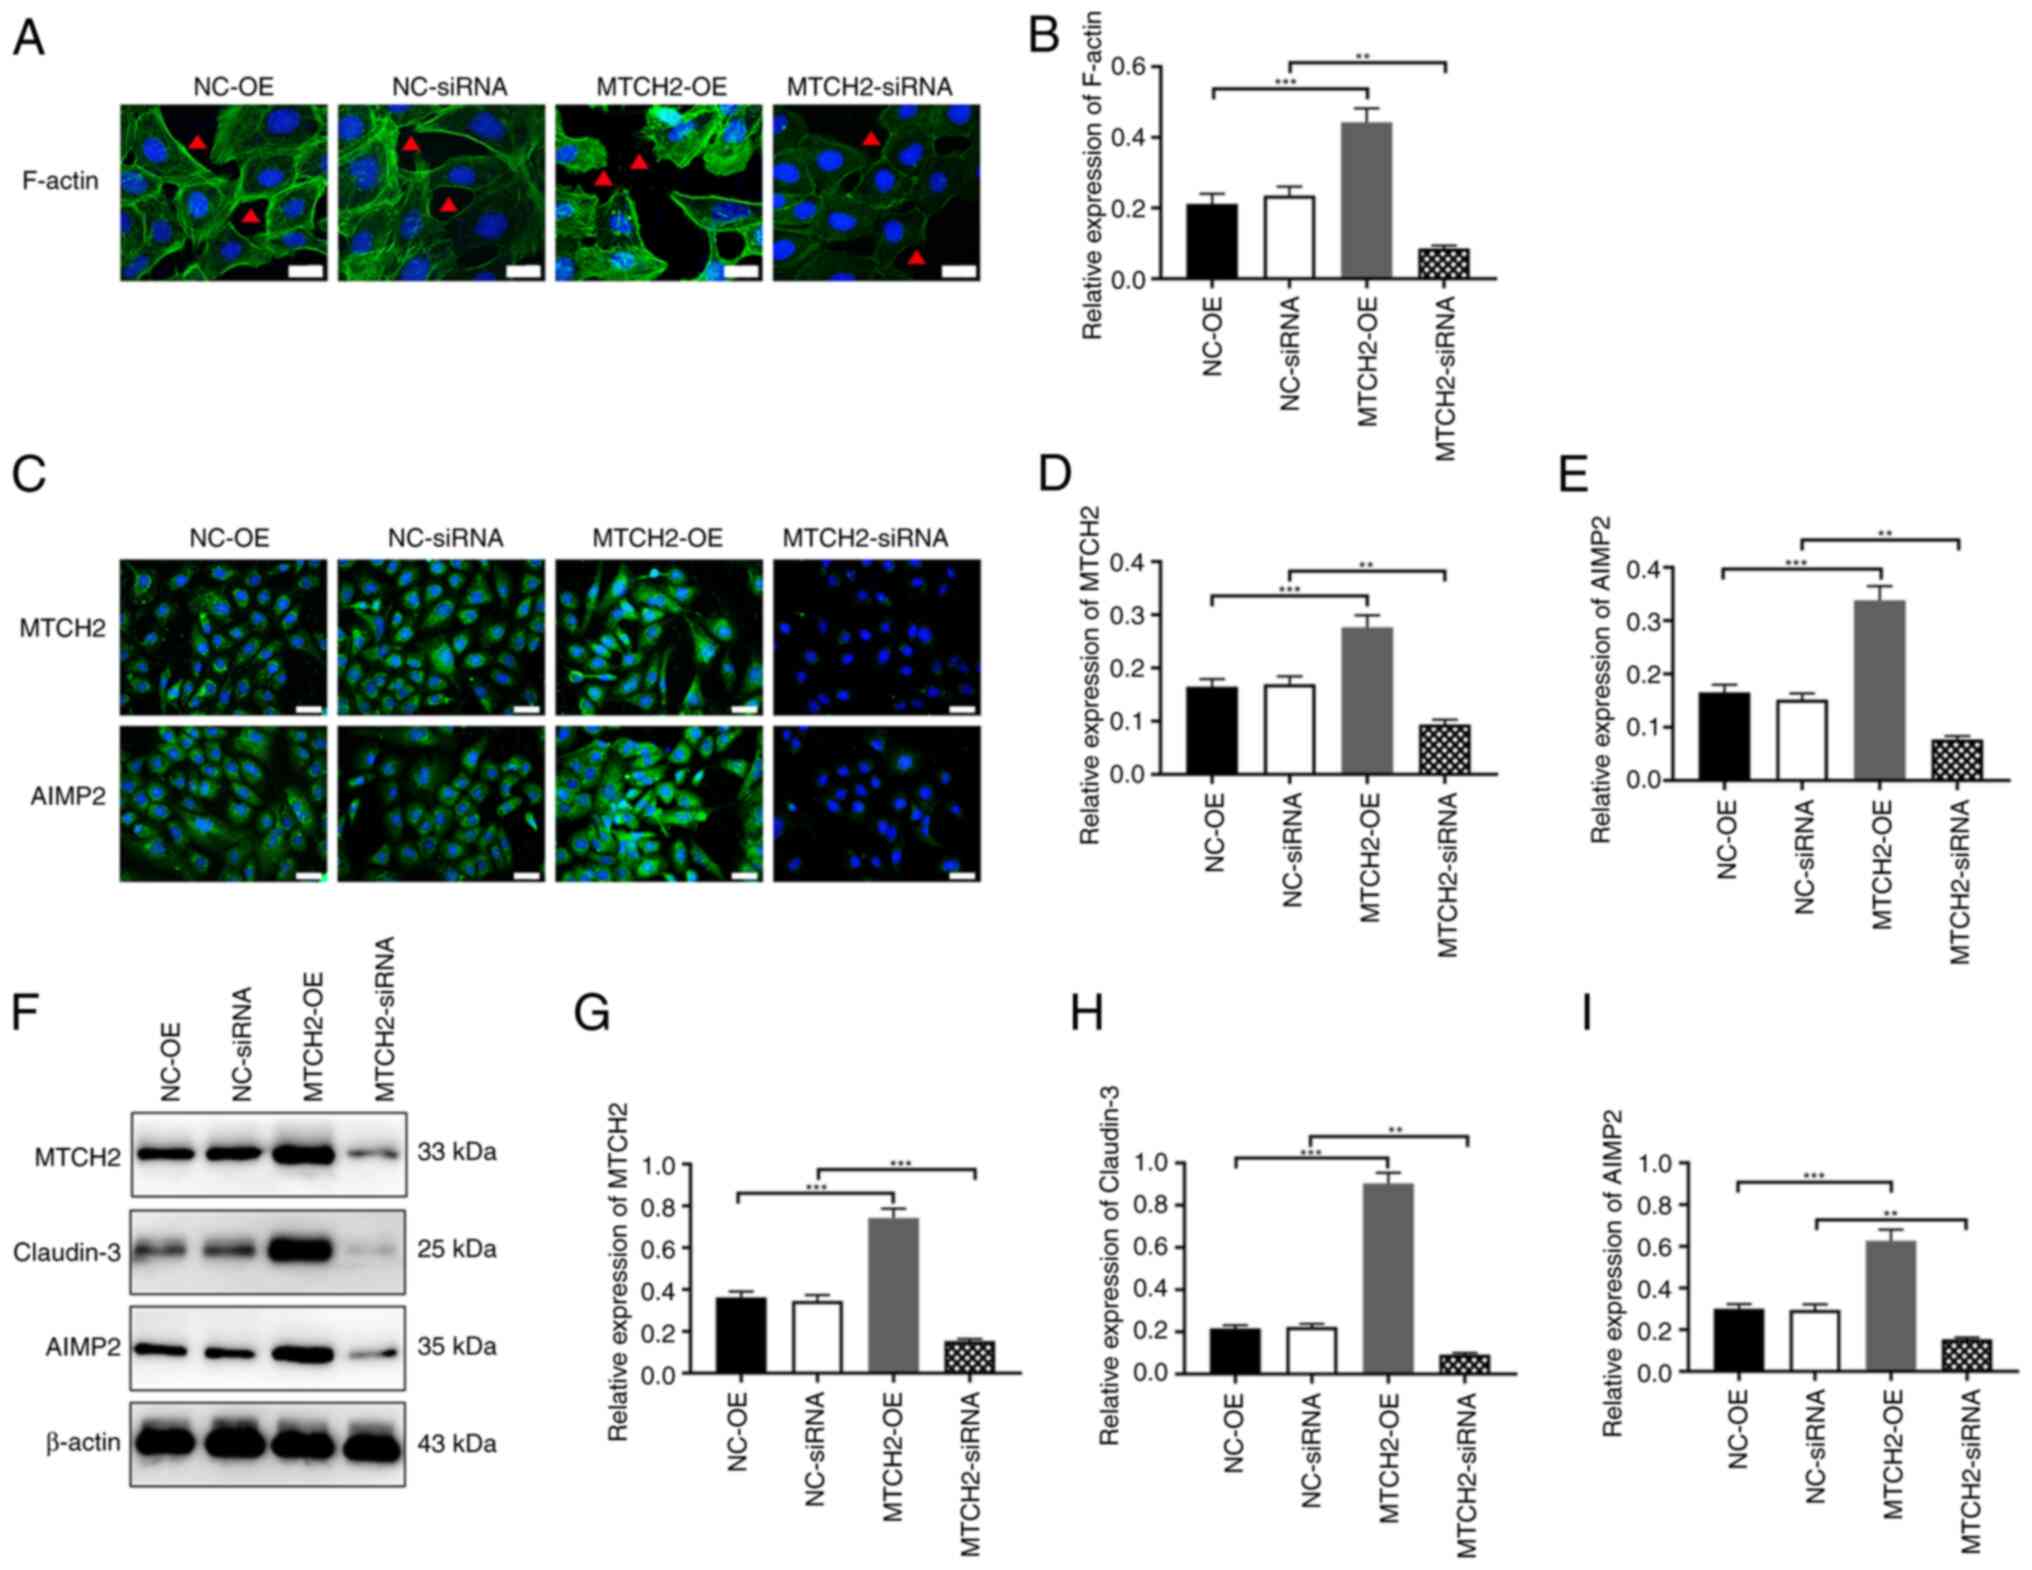 | Figure 5.MTCH2 regulated cytoskeletal
remodeling and expression levels of claudin-3 and AIMP2. (A and B)
Representative images of the cytoskeleton assay to evaluate the
expression of F-actin in SK-OV-3 cells following knockdown or
overexpression of MTCH2. The red triangle indicates changes in
pseudopodia. Scale bar, 20 µm, magnification, 400×. (C-E)
Representative immunofluorescent images to assess the expression
levels of MTCH2 and AIMP2 following knockdown or overexpression of
MTCH2. Scale bar, 40 µm; magnification, 400×. (F-I) Western blots
to assess the expression levels of MTCH2, claudin-3 and AIMP2 in
SK-OV-3 cells following knockdown or overexpression of MTCH2.
**P<0.01 and ***P<0.001. MTCH2, mitochondrial carrier
homology 2; AIMP2, aminoacyl transfer RNA synthetase-interacting
multifunctional protein 2; OE, overexpression; NC, negative
control. |
MTCH2 regulated claudin-3 expression
levels through AIMP2
To evaluate the pathways involved in MTCH2-mediated
OC cell metastasis, a number of AIMP2 siRNA sequences were
designed and synthesized. Western blotting was used to assess the
transfection efficacy of AIMP2 siRNA. Compared with
NC-siRNA, the transfection effects of AIMP2 siRNA2 and AIMP2 siRNA3
were notably better than AIMP2 siRNA1. The results of western
blotting revealed that the inhibitory effect of AIMP2 siRNA2 on
claudin-3 was markedly stronger than that of AIMP2 siRNA3
therefore, AIMP2 siRNA2 was chosen as the interference
sequence for use in subsequent experiments (Figs. 6C and D and S2). The expression levels of claudin-3
were significantly decreased in the AIMP2 siRNA group
compared with the NC-siRNA group. However, there was no significant
regulatory effect on MTCH2 expression levels upon AIMP2 knockdown
by AIMP2 siRNA. Transfection of AIMP2 siRNA with the
MTCH2-OE plasmid in OC cells could not restore the expression
levels of AIMP2 and claudin-3 to the NC-siRNA group levels, which
indicated that knockdown AIMP2 blocked the regulatory effect of
MTCH2 on these targets (Figs.
6E-H). Co-immunoprecipitation demonstrated that MTCH2 interacts
with both claudin-3 and AIMP2 (Fig. 6A
and B).
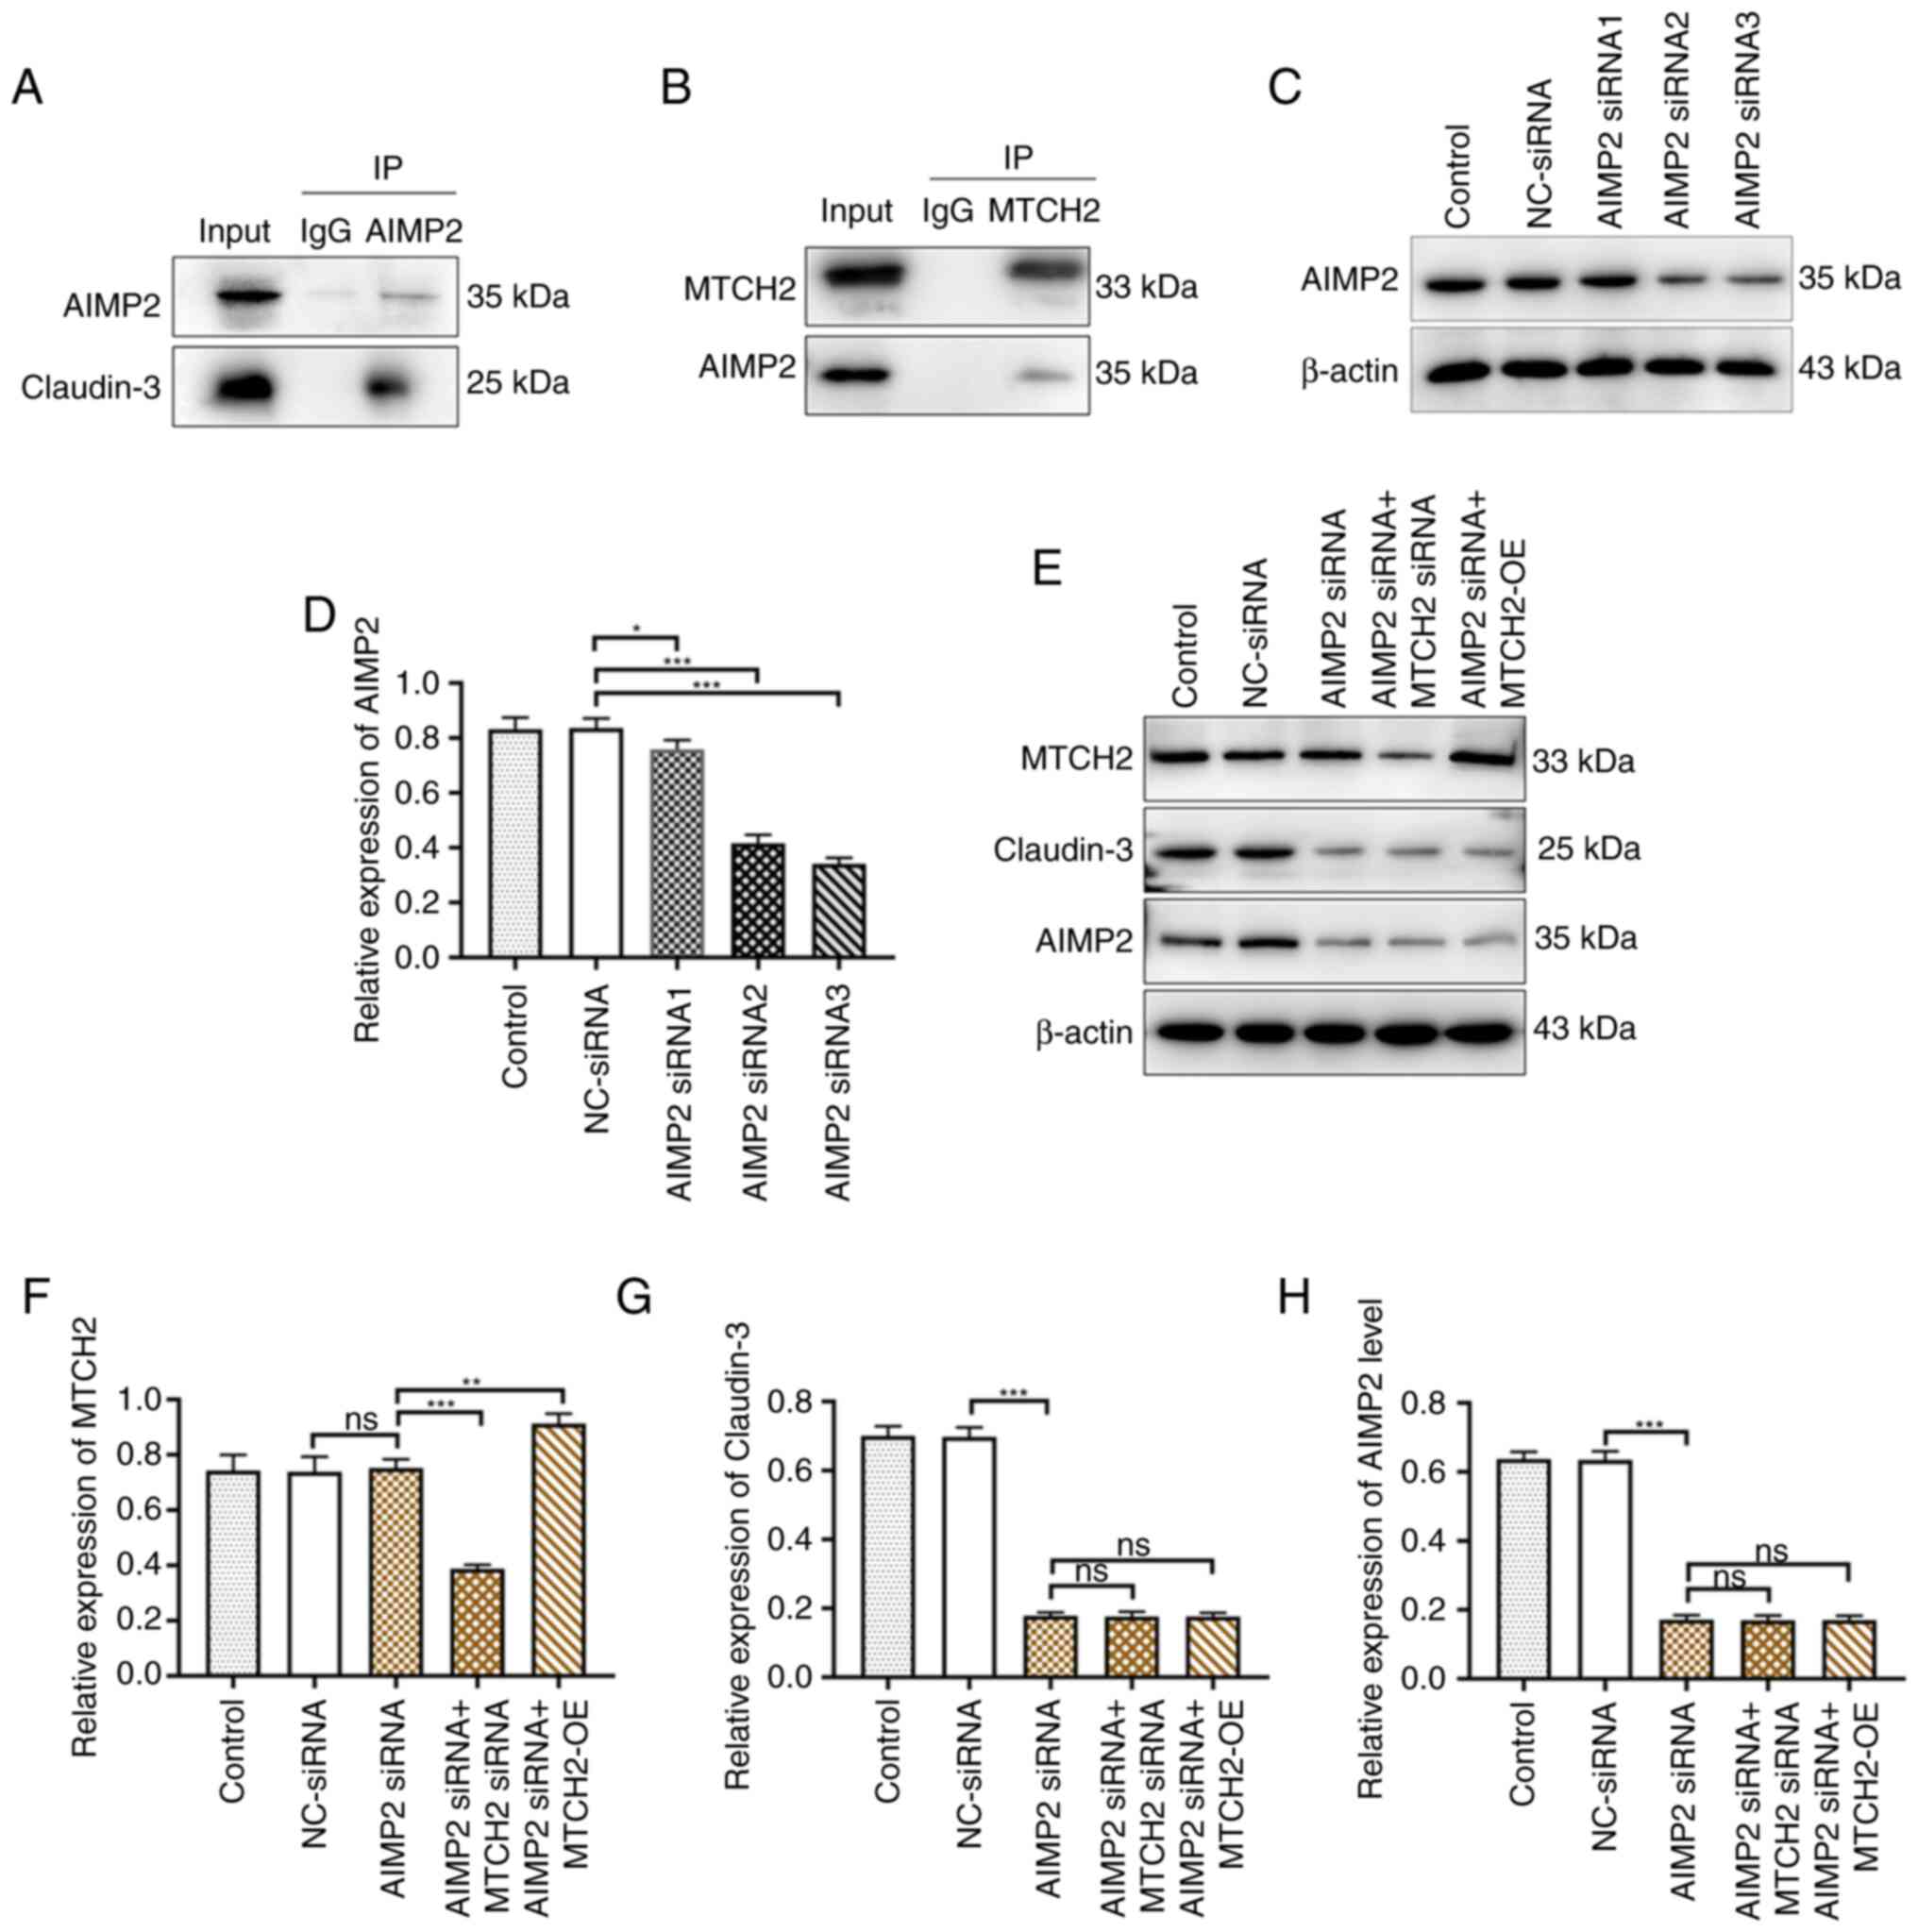 | Figure 6.MTCH2 regulated claudin-3 expression
levels through AIMP2. (A and B) Co-IP assay verified the binding
between MTCH2 and AIMP2 in SK-OV-3 cells. (C and D) The efficiency
of AIMP2 knockdown was validated using western blotting. (E) The
expression levels of (F) MTCH2, (G) claudin-3 and (H) AIMP2 were
detected by western blot following the transfection of NC-siRNA,
AIMP2 siRNA, AIMP2 siRNA2, AIMP2 siRNA +
MTCH2 siRNA and AIMP2 siRNA + MTCH2-OE. *P<0.05,
**P<0.01 and ***P<0.001. IP, immunoprecipitation; MTCH2,
mitochondrial carrier homology 2; AIMP2, aminoacyl transfer RNA
synthetase-interacting multifunctional protein 2; OE,
overexpression; NC, negative control; ns, not significant; siRNA,
small interfering RNA. |
Discussion
Mitochondrial dysfunction can lead to limited ATP
production, adversely affecting cellular function; therefore,
mitochondrial function has become a focal point of research in
cancer therapy (38). Additionally,
it has been reported that proteins related to the OMM are
upregulated in tumor cells (39).
Proteins incorporated into the OMM are essential for mitochondrial
function, and a malfunctioning OMM is implicated in the mechanisms
underlying cancer metastasis development (40). MTCH2 serves as an insertion enzyme
for OMM proteins, which facilitates the entry of various proteins.
It is involved in lipid biosynthesis, energy metabolism and
mitochondrial division and fusion (6). Claudins are a family of transmembrane
tight-linking proteins. Claudin-3 is a highly tissue-specific
protein that serves roles in cytoskeletal remodeling and in the
early and differential diagnosis in oral squamous cell carcinoma
(41). AIMP2 is a scaffold subunit
that is part of the polyaminoacyl-tRNA synthase complex and has
functions in cellular energy metabolism, protein biosynthesis and
apoptosis (28). The present study
demonstrated a significant increase in MTCH2, AIMP2 and claudin-3
expression levels in OC tissue samples. Moreover, the expression
levels of MTCH2 were significantly positively associated with AIMP2
and claudin-3 expression levels Overexpression of MTCH2 promoted
the proliferation, invasion and migration of SK-OV-3 cells. By
contrast, knockdown of MTCH2 decreased ATP production in SK-OV-3
cells, induced mitochondrial dysfunction, and promoted cytoskeletal
remodeling and apoptosis. The aforementioned results of the present
study indicated that MTCH2 knockdown can reduce the protein
expression levels of AIMP2 and claudin-3 in OC cells and therefore,
could potentially inhibit cancer progression.
It has been reported that MTCH2 is highly expressed
in malignant glioma, and its inhibition in glioma cells reduces
cell migration and invasion (12).
A previous study demonstrated the functional role of MTCH2
in acute myeloid leukemia (AML), reporting that MTCH2 inhibition
could reduce tumor growth and induce AML cell differentiation
(42). In the present study,
increased expression levels of MTCH2 were demonstrated in OC
tissues and knockdown of MTCH2 resulted in significantly decreased
cell migration and invasion, which suggested that MTCH2 may act as
a tumor-promoting factor in the development of OC. It has been
reported that MTCH2 is associated with apoptosis involving tBID
(43,44). Zhou et al (45) demonstrated that silicon dioxide
nanoparticles suppressed the expression of microRNA-450b-3p through
the modulation of MTCH2 in spermatocyte cells, which led to
mitochondria-activated apoptosis signaling and subsequent
apoptosis. In the present study, knockdown of MTCH2 inhibited cell
proliferation and promoted apoptosis. Therefore, it could be
suggested that MTCH2 represents a key regulatory pathway in OC
malignancies.
MTCH2 serves major roles in the biology of neuronal
cells as it regulates mitochondrial metabolism, motility, calcium
buffering and ATP production (46).
The knockdown of MTCH2 in hippocampal neurons results in defects in
mitochondrial motility and calcium handling (46). MTCH2 is located in the OMM, where it
functions to preserve the structure and function of mitochondria.
For instance, the loss of MTCH2 increased the levels of oxidative
phosphorylation (47), ATP, NADH
and reactive oxygen species (48),
markers associated with mitochondrial activity. Additionally, loss
of MTCH2 leads to mitochondrial elongation (49), increased mitochondrial size,
decreased motility and increased oxidative stress (12). Collectively, this suggests that
MTCH2 functions as a central regulator of mitochondrial and overall
body energy metabolism. The present study demonstrated that MTCH2
can regulate ATP production and affect mitochondrial function. This
further suggests that MTCH2 influences the progression of OC
through the modulation of mitochondrial function and energy
metabolism. In a previous study of liver cancer, MTCH2 was reported
to mediate the signal crosstalk between nucleus and mitochondria,
disrupt transport signals and was associated with uncontrolled
mitochondrial activity, which led to tumor metabolic reprogramming
(50). While the present study
substantiates the prevailing understanding of MTCH2 involvement in
cancer progression through its modulation of mitochondrial function
and energy metabolism, the significance of cytoskeletal
rearrangements in the multifaceted landscape of neoplastic
transformation was also taken into consideration. The present study
enriched the current understanding of the role of MTCH2 in cancer,
but also demonstrated the potential of targeting cytoskeleton
remodeling as a therapeutic strategy for MTCH2 driven malignant
tumors.
Previous research has demonstrated that a
cytoskeletal network formed of several unbranched-chain actin
filaments surrounds the mitochondria in cells, suggesting a new
mechanistic model of mitochondrial activity and cytoskeletal
remodeling (51). In the present
study, overexpression of MTCH2 promoted the lengthening of
pseudopodia, which further demonstrated the role of MTCH2 in
promoting the malignant biological behavior of OC cells. It could
be suggested that the abnormal expression of MTCH2 may directly or
indirectly affect cytoskeletal remodeling and mediate cancer cell
metastasis. Transmission electron microscopy could be used to
verify this in the future.
Claudin-3 serves a diverse and integral role in
maintaining the structural and functional integrity of epithelial
cells, governing cell polarity, transcriptional regulation,
proliferative capacity, differentiation, metabolic homeostasis and
immune-inflammatory responses (52). It is frequently dysregulated in OC,
where increased expression levels of claudin-3 have been causally
linked to disease progression, the emergence of distant metastases
and the acquisition of drug resistance phenotypes (53). Additionally, increased claudin-3
expression levels have been implicated in the malignant
transformation of colorectal cancer cells (54). It has been reported that the
expression of claudin-3 mRNA and protein is significantly higher in
gastric cancer tissues and metastatic tissues than in normal
gastric mucosa tissues. (55).
Knockdown of claudin-3 inhibited the growth of OC xenografts and
promoted benign tumor differentiation (56). Downregulation of Claudin-3 was
reported to promote tumor cell apoptosis, inhibit tumor cell
proliferation, reduce microvascular density and thus serve an
antitumor role (57). Given the
selective upregulation of claudin-3 in OC, claudin-3 has emerged as
a potential biomarker for early detection (58). The tissue-specificity and intricate
molecular signaling networks within cells likely contribute to the
biological functions of claudin-3 (59). In the present study, MTCH2 knockdown
significantly downregulated claudin-3 expression, which suggested
that, in addition to its autonomous oncogenic properties, claudin-3
is under the regulatory control of MTCH2. This finding implicates
MTCH2 as a modulator of claudin-3 expression levels and could
thereby influence the progression of tumor cells.
AIMP2 has emerged as a potent prognostic marker
inversely correlated with patient survival, as dysregulation of
AIMP2 expression levels have been reported across a number of types
of tumors. Targeted suppression of AIMP2 has been shown to
attenuate the migratory capabilities and proliferation of breast
cancer cells (60). Moreover,
knockdown of AIMP2 expression inhibited EMT, cell invasion,
cell migration and tumor growth (55). As a pivotal signaling hub and a
robust predictor of adverse outcomes in AML progression (61), AIMP2 has potential as a therapeutic
target in cancer treatments. In the present study, MTCH2 knockdown
led to downregulation of AIMP2 expression levels. AIMP2 knockout
did not affect the expression of MTCH2, but significantly decreased
the expression of claudin-3, which blocked the regulation of MTCH2
on mitochondrial function. It could be suggested that AIMP2 may be
a downstream factor of MTCH2. Moreover, co-immunoprecipitation data
demonstrated a tripartite interaction among these proteins, which
suggested that MTCH2 could have a regulatory effect on claudin-3
via AIMP2. It was further demonstrated through knocking down AIMP2
that the interference of AIMP2 siRNA2 on claudin-3 was more obvious
than that of AIMP2 siRNA3, which may be due to differences in the
interference sequences.
The present study validated the translational
relevance of MTCH2 in advanced serous OC tissues and the ovarian
endometrioid cancer cell model, represented by the SK-OV-3 cell
line. The present study aimed to verify the research value of MTCH2
in HGSOC tissues and the SK-OV-3 cell line. A limitation of the
present study was that investigation of MTCH2 functional mechanisms
were restricted to the SK-OV-3 model, therefore the results of the
present study could not be generalized across different types of
OC. Hence, validation using cell lines derived from diverse tissue
origins is vital, as it would provide a foundation for future
investigation of the role of MTCH2 in other types of OC. As the
present experimental results were only confirmed in an in
vitro cell model and in vivo animal experiments are
currently limited, subcutaneous transplanted tumor models could be
used in the future to further investigate the roles of MTCH2 in
mechanisms of cancer drug resistance.
The results of the present study indicated that
MTCH2 knockdown induced mitochondrial dysfunction, decreased ATP
production and promoted apoptosis. MTCH2 regulated claudin-3
through AIMP2 to mediate the progression of OC cells and AIMP2
knockdown inhibited the effect of MTCH2, which indicated that MTCH2
as a novel target for the treatment of OC and provides further
insight for the treatment of OC metastasis.
Supplementary Material
Supporting Data
Acknowledgements
Not applicable.
Funding
This work was supported by the Project of Hebei Medical Science
Research (grant no. 20210129) and the Natural Science Foundation of
Hebei Province (grant no. H2020206223).
Availability of data and materials
The data generated in the present study may be
requested from the corresponding author.
Authors' contributions
GS was responsible for study design. YS and CoL
performed the experiments. BS and ChL analyzed the data. JS, PX and
ZZ contributed to data interpretation, conceived the study and
modified the manuscript. GS and PX confirm the authenticity of all
the raw data. All authors read and approved the final
manuscript.
Ethics approval and consent to
participate
The protocol was approved by the Ethics Committee of
The Fourth Hospital of Hebei Medical University (ethical approval
no. 2020166; Shijiazhuang, China). Each patient signed a written
informed consent form.
Patient consent for publication
Not applicable.
Competing interests
The authors declare that they have no competing
interests.
References
|
1
|
Siegel RL, Giaquinto AN and Jemal A:
Cancer statistics. CA Cancer J Clin. 74:12–49. 2024. View Article : Google Scholar : PubMed/NCBI
|
|
2
|
Xiao Y, Bi M, Guo H and Li M: Multi-omics
approaches for biomarker discovery in early ovarian cancer
diagnosis. EBioMedicine. 79:1040012022. View Article : Google Scholar : PubMed/NCBI
|
|
3
|
Yang C, Xia BR, Zhang ZC, Zhang YJ, Lou G
and Jin WL: Immunotherapy for ovarian cancer: Adjuvant,
combination, and neoadjuvant. Front Immunol. 11:5778692020.
View Article : Google Scholar : PubMed/NCBI
|
|
4
|
Tsibulak I, Zeimet AG and Marth C: Hopes
and failures in front-line ovarian cancer therapy. Crit Rev Oncol
Hematol. 143:14–19. 2019. View Article : Google Scholar : PubMed/NCBI
|
|
5
|
Spinelli JB and Haigis MC: The
multifaceted contributions of mitochondria to cellular metabolism.
Nat Cell Biol. 20:745–754. 2018. View Article : Google Scholar : PubMed/NCBI
|
|
6
|
Guna A, Stevens TA, Inglis AJ, Replogle
JM, Esantsi TK, Muthukumar G, Shaffer KCL, Wang ML, Pogson AN,
Jones JJ, et al: MTCH2 is a mitochondrial outer membrane protein
insertase. Science. 378:317–322. 2022. View Article : Google Scholar : PubMed/NCBI
|
|
7
|
Goldman A, Mullokandov M, Zaltsman Y,
Regev L, Levin-Zaidman S and Gross A: MTCH2 cooperates with MFN2
and lysophosphatidic acid synthesis to sustain mitochondrial
fusion. EMBO Rep. 25:45–67. 2023. View Article : Google Scholar : PubMed/NCBI
|
|
8
|
Rottiers V, Francisco A, Platov M,
Zaltsman Y, Ruggiero A, Lee SS, Gross A and Libert S: MTCH2 is a
conserved regulator of lipid homeostasis. Obesity (Silver Spring).
25:616–625. 2017. View Article : Google Scholar : PubMed/NCBI
|
|
9
|
Robinson AJ, Kunji ER and Gross A:
Mitochondrial carrier homolog 2 (MTCH2): The recruitment and
evolution of a mitochondrial carrier protein to a critical player
in apoptosis. Exp Cell Res. 318:1316–1323. 2012. View Article : Google Scholar : PubMed/NCBI
|
|
10
|
Manjunath LE, Singh A, Sahoo S, Mishra A,
Padmarajan J, Basavaraju CG and Eswarappa SM: Stop codon
read-through of mammalian MTCH2 leading to an unstable isoform
regulates mitochondrial membrane potential. J Biol Chem.
295:17009–17026. 2020. View Article : Google Scholar : PubMed/NCBI
|
|
11
|
Kisaki CY, Arcos SSS, Montoni F, Da Silva
Santos W, Calacina HM, Lima IF, Cajado-Carvalho D, Ferro ES,
Nishiyama-Jr MY and Iwai LK: Bothrops jararaca snake venom
modulates key cancer-related proteins in breast tumor cell lines.
Toxins (Basel). 13:5192021. View Article : Google Scholar : PubMed/NCBI
|
|
12
|
Yuan Q, Yang W, Zhang S, Li T, Zuo M, Zhou
X, Li J, Li M, Xia X, Chen M and Liu Y: Inhibition of mitochondrial
carrier homolog 2 (MTCH2) suppresses tumor invasion and enhances
sensitivity to temozolomide in malignant glioma. Mol Med. 27:72021.
View Article : Google Scholar : PubMed/NCBI
|
|
13
|
JanssenDuijghuijsen LM, Grefte S, de Boer
VCJ, Zeper L, van Dartel DAM, van Der Stelt I,
Bekkenkamp-Grovenstein M, van Norren K, Wichers HJ and Keijer J:
Mitochondrial ATP depletion disrupts Caco-2 monolayer integrity and
internalizes claudin 7. Front Physiol. 8:7942017. View Article : Google Scholar : PubMed/NCBI
|
|
14
|
Hana C, Dar NN, Venegas MG and Vulfovich
M: Claudins in cancer: A current and future therapeutic target. Int
J Mol Sci. 25:46342024. View Article : Google Scholar : PubMed/NCBI
|
|
15
|
Zihni C, Mills C, Matter K and Balda MS:
Tight junctions: From simple barriers to multifunctional molecular
gates. Nat Rev Mol Cell Biol. 17:564–580. 2016. View Article : Google Scholar : PubMed/NCBI
|
|
16
|
Lin X, Shang X, Manorek G and Howell SB:
Regulation of the epithelial-mesenchymal transition by claudin-3
and claudin-4. PLoS One. 8:e674962013. View Article : Google Scholar : PubMed/NCBI
|
|
17
|
Jung H, Jun KH, Jung JH, Chin HM and Park
WB: The expression of claudin-1, claudin-2, claudin-3, and
claudin-4 in gastric cancer tissue. J Surg Res. 167:e185–e191.
2011. View Article : Google Scholar : PubMed/NCBI
|
|
18
|
Li JY, Xie F, Xu XP, Ma JJ, Zhou DC, Liao
Y, Tang J, Xie Q, Bai L and Nan QZ: Claudin-3 expression in
colorectal carcinoma and its significance. Nan Fang Yi Ke Da Xue
Xue Bao. 37:63–67. 2017.(In Chinese). PubMed/NCBI
|
|
19
|
Senga K, Mostov KE, Mitaka T, Miyajima A
and Tanimizu N: Grainyhead-like 2 regulates epithelial
morphogenesis by establishing functional tight junctions through
the organization of a molecular network among claudin3, claudin4,
and Rab25. Mol Biol Cell. 23:2845–2855. 2012. View Article : Google Scholar : PubMed/NCBI
|
|
20
|
Yang L and Zhang W, Li M, Dam J, Huang K,
Wang Y, Qiu Z, Sun T, Chen P, Zhang Z and Zhang W: Evaluation of
the prognostic relevance of differential claudin gene expression
highlights claudin-4 as being suppressed by TGFβ1 inhibitor in
colorectal cancer. Front Genet. 13:7830162022. View Article : Google Scholar : PubMed/NCBI
|
|
21
|
Wang H and Yang X: The expression patterns
of tight junction protein claudin-1, −3, and −4 in human gastric
neoplasms and adjacent non-neoplastic tissues. Int J Clin Exp
Pathol. 8:881–887. 2015.PubMed/NCBI
|
|
22
|
Oh S, Yang H, Oh HR, Seo MR, Lee CH, Kim
YH, Choi JY, Kim NY, Cheon GJ, Kang KW, et al: Visualization of a
novel human monoclonal antibody against Claudin-3 for targeting
ovarian cancer. Nucl Med Biol. 114–115. 135–142. 2022.
|
|
23
|
Yu YC, Han JM and Kim S: Aminoacyl-tRNA
synthetases and amino acid signaling. Biochim Biophys Acta Mol Cell
Res. 1868:1188892021. View Article : Google Scholar : PubMed/NCBI
|
|
24
|
Hyeon DY, Kim JH, Ahn TJ, Cho Y, Hwang D
and Kim S: Evolution of the multi-tRNA synthetase complex and its
role in cancer. J Biol Chem. 294:5340–5351. 2019. View Article : Google Scholar : PubMed/NCBI
|
|
25
|
Zhou Z, Sun B, Huang S, Yu D and Zhang X:
Roles of aminoacyl-tRNA synthetase-interacting multi-functional
proteins in physiology and cancer. Cell Death Dis. 11:5792020.
View Article : Google Scholar : PubMed/NCBI
|
|
26
|
Mazaheri M, Yavari M, Marzouni HZ, Stufano
A, Lovreglio P, S'amore S and Jahantigh HR: Case report: Mutation
in AIMP2/P38, the scaffold for the multi-trna synthetase complex,
and association with progressive neurodevelopmental disorders.
Front Genet. 13:8169872022. View Article : Google Scholar : PubMed/NCBI
|
|
27
|
Xu D, Shao F, Bian X, Meng Y, Liang T and
Lu Z: The evolving landscape of noncanonical functions of metabolic
enzymes in cancer and other pathologies. Cell Metab. 33:33–50.
2021. View Article : Google Scholar : PubMed/NCBI
|
|
28
|
Zheng Y, Zhan Y, Zhang Y, Zhang Y, Liu Y,
Xie Y, Sun Y, Qian J, Ding Y, Ding Y and Fang Y: Hexokinase 2
confers radio-resistance in hepatocellular carcinoma by promoting
autophagy-dependent degradation of AIMP2. Cell Death Dis.
14:4882023. View Article : Google Scholar : PubMed/NCBI
|
|
29
|
Li W, Wang T, Fu G, Xu Y, Zhang N, Han L
and Yang M: The allelic regulation of tumor suppressor ADARB2 in
papillary thyroid carcinoma. Endocr Relat Cancer. 30:e2201892023.
View Article : Google Scholar : PubMed/NCBI
|
|
30
|
Yum MK, Kang JS, Lee AE, Jo YW, Seo JY,
Kim HA, Kim YY, Seong J, Lee EB, Kim JH, et al: AIMP2 controls
intestinal stem cell compartments and tumorigenesis by modulating
Wnt/β-catenin signaling. Cancer Res. 76:4559–4568. 2016. View Article : Google Scholar : PubMed/NCBI
|
|
31
|
Miao J, Liu J, Niu J, Zhang Y, Shen W, Luo
C, Liu Y, Li C, Li H, Yang P, et al: Wnt/β-catenin/RAS signaling
mediates age-related renal fibrosis and is associated with
mitochondrial dysfunction. Aging Cell. 18:e130042019. View Article : Google Scholar : PubMed/NCBI
|
|
32
|
Dias MC, Coisne C, Lazarevic I, Baden P,
Hata M, Iwamoto N, Francisco DMF, Vanlandewijck M, He L, Baier FA,
et al: Claudin-3-deficient C57BL/6J mice display intact brain
barriers. Sci Rep. 9:2032019. View Article : Google Scholar
|
|
33
|
Gao J, Aksoy BA, Dogrusoz U, Dresdner G,
Gross B, Sumer SO, Sun Y, Jacobsen A, Sinha R, Larsson E, et al:
Integrative analysis of complex cancer genomics and clinical
profiles using the cBioPortal. Sci Signal. 6:pl12013. View Article : Google Scholar : PubMed/NCBI
|
|
34
|
Liao L, Liu M, Gao Y, Wei X, Yin Y, Gao L
and Zhou R: The long noncoding RNA TARID regulates the
CXCL3/ERK/MAPK pathway in trophoblasts and is associated with
preeclampsia. Reprod Biol Endocrinol. 20:1592022. View Article : Google Scholar : PubMed/NCBI
|
|
35
|
Li W, Lin J, Huang J, Chen Z, Sheng Q,
Yang F, Yang X and Cui X: MicroRNA-409-5p inhibits cell
proliferation, and induces G(2)/M phase arrest and apoptosis by
targeting DLGAP5 in ovarian cancer cells. Oncol Lett. 24:2612022.
View Article : Google Scholar : PubMed/NCBI
|
|
36
|
Wang X, Song X, Cheng G, Zhang J, Dong L,
Bai J, Luo D, Xiong Y, Li S, Liu F, et al: The regulatory mechanism
and biological significance of mitochondrial calcium uniporter in
the migration, invasion, angiogenesis and growth of gastric cancer.
Onco Targets Ther. 13:11781–11794. 2020. View Article : Google Scholar : PubMed/NCBI
|
|
37
|
Berek JS, Renz M, Kehoe S, Kumar L and
Friedlander M: Cancer of the ovary, fallopian tube, and peritoneum:
2021 update. Int J Gynaecol Obstet. 155 (Suppl 1):S61–S85. 2021.
View Article : Google Scholar
|
|
38
|
Lee C, Park SH and Yoon SK: Genetic
mutations affecting mitochondrial function in cancer drug
resistance. Genes Genomics. 45:261–270. 2023. View Article : Google Scholar : PubMed/NCBI
|
|
39
|
Colpman P, Dasgupta A and Archer SL: The
role of mitochondrial dynamics and mitotic fission in regulating
the cell cycle in cancer and pulmonary arterial hypertension:
Implications for dynamin-related protein 1 and Mitofusin2 in
hyperproliferative diseases. Cells. 12:18972023. View Article : Google Scholar : PubMed/NCBI
|
|
40
|
Marciniak SJ, Chambers JE and Ron D:
Pharmacological targeting of endoplasmic reticulum stress in
disease. Nat Rev Drug Discov. 21:115–140. 2022. View Article : Google Scholar : PubMed/NCBI
|
|
41
|
Zejc T, Piontek J, Schulzke JD, Fromm M,
Ervens J and Rosenthal R: Clinical significance of claudin
expression in oral squamous cell carcinoma. Int J Mol Sci.
23:112342022. View Article : Google Scholar : PubMed/NCBI
|
|
42
|
Khan DH, Mullokandov M, Wu Y, Voisin V,
Gronda M, Hurren R, Wang X, Maclean N, Jeyaraju DV, Jitkova Y, et
al: Mitochondrial carrier homolog 2 is necessary for AML survival.
Blood. 136:81–92. 2020. View Article : Google Scholar : PubMed/NCBI
|
|
43
|
Cogliati S and Scorrano L: A BID on
mitochondria with MTCH2. Cell Res. 20:863–865. 2010. View Article : Google Scholar : PubMed/NCBI
|
|
44
|
Zaltsman Y, Shachnai L, Yivgi-Ohana N,
Schwarz M, Maryanovich M, Houtkooper RH, Vaz FM, De Leonardis F,
Fiermonte G, Palmieri F, et al: MTCH2/MIMP is a major facilitator
of tBID recruitment to mitochondria. Nat Cell Biol. 12:553–562.
2010. View Article : Google Scholar : PubMed/NCBI
|
|
45
|
Zhou G, Liu J, Li X, Sang Y, Zhang Y, Gao
L, Wang J, Yu Y, Ge W, Sun Z and Zhou X: Silica nanoparticles
inducing the apoptosis via microRNA-450b-3p targeting MTCH2 in mice
and spermatocyte cell. Environ Pollut. 277:1167712021. View Article : Google Scholar : PubMed/NCBI
|
|
46
|
Ruggiero A, Aloni E, Korkotian E, Zaltsman
Y, Oni-Biton E, Kuperman Y, Tsoory M, Shachnai L, Levin-Zaidman S,
Brenner O, et al: Loss of forebrain MTCH2 decreases mitochondria
motility and calcium handling and impairs hippocampal-dependent
cognitive functions. Sci Rep. 7:444012017. View Article : Google Scholar : PubMed/NCBI
|
|
47
|
Buzaglo-Azriel L, Kuperman Y, Tsoory M,
Zaltsman Y, Shachnai L, Zaidman SL, Bassat E, Michailovici I,
Sarver A, Tzahor E, et al: Loss of muscle MTCH2 increases
whole-body energy utilization and protects from diet-induced
obesity. Cell Rep. 14:1602–1610. 2016. View Article : Google Scholar : PubMed/NCBI
|
|
48
|
Maryanovich M, Zaltsman Y, Ruggiero A,
Goldman A, Shachnai L, Zaidman SL, Porat Z, Golan K, Lapidot T and
Gross A: An MTCH2 pathway repressing mitochondria metabolism
regulates haematopoietic stem cell fate. Nat Commun. 6:79012015.
View Article : Google Scholar : PubMed/NCBI
|
|
49
|
Bahat A, Goldman A, Zaltsman Y, Khan DH,
Halperin C, Amzallag E, Krupalnik V, Mullokandov M, Silberman A,
Erez A, et al: MTCH2-mediated mitochondrial fusion drives exit from
naïve pluripotency in embryonic stem cells. Nat Commun. 9:51322018.
View Article : Google Scholar : PubMed/NCBI
|
|
50
|
Zhao Y, Zhou L, Li H, Sun T, Wen X, Li X,
Meng Y, Li Y, Liu M, Liu S, et al: Nuclear-encoded lncRNA MALAT1
epigenetically controls metabolic reprogramming in HCC cells
through the mitophagy pathway. Mol Ther Nucleic Acids. 23:264–276.
2021. View Article : Google Scholar : PubMed/NCBI
|
|
51
|
Yang C and Svitkina TM: Ultrastructure and
dynamics of the actin-myosin II cytoskeleton during mitochondrial
fission. Nat Cell Biol. 21:603–613. 2019. View Article : Google Scholar : PubMed/NCBI
|
|
52
|
Nakamura S, Irie K, Tanaka H, Nishikawa K,
Suzuki H, Saitoh Y, Tamura A, Tsukita S and Fujiyoshi Y:
Morphologic determinant of tight junctions revealed by claudin-3
structures. Nat Commun. 10:8162019. View Article : Google Scholar : PubMed/NCBI
|
|
53
|
Kim WS, Kim H, Joo MK, Choi BI, Yoo AY,
Park JJ, Lee BJ, Kim SH and Chun HJ: High expression of claudin-4
is associated with synchronous tumors in patients with early
gastric cancer. J Clin Med. 11:35502022. View Article : Google Scholar : PubMed/NCBI
|
|
54
|
De Souza WF, Fortunato-Miranda N, Robbs
BK, De Araujo WM, De-Freitas-Junior JC, Bastos LG, Viola JP and
Morgado-Díaz JA: Claudin-3 overexpression increases the malignant
potential of colorectal cancer cells: Roles of ERK1/2 and PI3K-Akt
as modulators of EGFR signaling. PloS One. 8:e749942013. View Article : Google Scholar : PubMed/NCBI
|
|
55
|
Hashimoto I and Oshima T: Claudins and
gastric cancer: An overview. Cancers (Basel). 14:2902022.
View Article : Google Scholar : PubMed/NCBI
|
|
56
|
Huang YH, Bao Y, Peng W, Goldberg M, Love
K, Bumcrot DA, Cole G, Langer R, Anderson DG and Sawicki JA:
Claudin-3 gene silencing with siRNA suppresses ovarian tumor growth
and metastasis. Proc Natl Acad Sci USA. 106:3426–3430. 2009.
View Article : Google Scholar : PubMed/NCBI
|
|
57
|
He ZY, Wei XW, Luo M, Luo ST, Yang Y, Yu
YY, Chen Y, Ma CC, Liang X, Guo FC, et al: Folate-linked lipoplexes
for short hairpin RNA targeting claudin-3 delivery in ovarian
cancer xenografts. J Control Release. 172:679–689. 2013. View Article : Google Scholar : PubMed/NCBI
|
|
58
|
Choi YL, Kim J, Kwon MJ, Choi JS, Kim TJ,
Bae DS, Koh SS, In YH, Park YW, Kim SH, et al: Expression profile
of tight junction protein claudin 3 and claudin 4 in ovarian serous
adenocarcinoma with prognostic correlation. Histol Histopathol.
22:1185–1195. 2007.PubMed/NCBI
|
|
59
|
Lei N, Cheng Y, Wan J, Blasig R, Li A, Bai
Y, Haseloff RF, Blasig IE, Zhu L and Qin Z: Claudin-3 inhibits
tumor-induced lymphangiogenesis via regulating the PI3K signaling
pathway in lymphatic endothelial cells. Sci Rep. 12:174402022.
View Article : Google Scholar : PubMed/NCBI
|
|
60
|
Qiu J, Zhou T, Wang D, Hong W, Qian D,
Meng X and Liu X: Pan-cancer analysis identifies AIMP2 as a
potential biomarker for breast cancer. Curr Genomics. 24:307–329.
2023. View Article : Google Scholar : PubMed/NCBI
|
|
61
|
Ku J, Kim R, Kim D, Kim D, Song S, Lee K,
Lee N, Kim M, Yoon SS, Kwon NH, et al: Single-cell analysis of
AIMP2 splice variants informs on drug sensitivity and prognosis in
hematologic cancer. Commun Biol. 3:6302020. View Article : Google Scholar : PubMed/NCBI
|