Introduction
Uveal melanoma (UM) is the most common primary
intraocular malignancy in adults (1). UM typically arises from choroidal
melanocytes (90%) and melanocytes in the ciliary body (6%) or iris
(4%) (2). UM is a highly malignant
and lethal tumor, with ~50% of patients dying within a decade of
diagnosis owing to its high risk of metastasis (3,4).
Patients with metastasis have a poor prognosis, and the treatment
of metastatic UM remains challenging owing to a lack of
understanding of the biological characteristics of this disease
(5). To address this issue,
metastasis doubling times have been calculated, and it has been
hypothesized that primary UM cells start to spread several years
before diagnosis and initial treatment (6). Genetic characteristics linked to UM
include mutations in the G protein subunit α (GNA)Q,
GNA11 or eukaryotic translation initiation factor 1A X-linked
genes (7). Alterations in gene
expression associated with the occurrence of UM have also been
demonstrated. For instance, loss of chromosome 3 and mutations in
the BRCA1 associated protein 1 (BAP1) and splicing factor 3b
subunit 1 genes frequently increase the risk of metastasis, and
BAP1 is a tumor suppressor gene (8). In general, 1–2% of patients with UM
carry germline alterations in the BAP1 gene (9). UM tissue comprises not only tumor
cells but also an array of diverse immune cells (10). There is a notable increase in the
presence of a distinct type (M2-type macrophages) of immune cells
in UM, which accelerate tumor growth through angiogenesis and
immunosuppression as a significant role of immune responses in the
process of UM metastasis (10,11).
One area of significance in cancer research is
single-cell sequencing, an innovative technique that provides
high-resolution insights into the cellular composition of tumor
tissues, thus enabling the exploration of the rich landscape of
cell-to-cell communication within the tumor microenvironment
(12). Some UM studies based on
single-cell sequencing have shown tumor heterogeneity and varying
gene expression patterns. For instance, Pandiani et al
(13) found that hes family bHLH
transcription factor 6 was an effective target for inhibiting UM
progression. In addition, Durante et al (14) reported that lymphocyte activating 3
was a potential candidate for immune checkpoint blockade in
patients with high-risk UM. Cell communication plays an essential
role in the progression of cellular malignancies, as the ability of
invasive cells to communicate and influence their surroundings
determines the metastatic potential and subsequent impact of the
disease (15). However, the
cell-cell communication nexus within UM remains largely unexplored.
This research requires a concerted effort to unravel the complex
connections among mRNAs, micro (mi)RNAs and long non-coding
(lnc)RNAs in a cancer type that is rare yet impactful, and which
affects the uvea of the eye.
At present, UM is typically treated with radiation
therapy, laser therapy, local resection and enucleation,
chemotherapy and immunotherapy; however, none of these methods have
shown satisfactory results (16,17).
Furthermore, while immunotherapy with checkpoint inhibition (such
as anti-cytotoxic T-lymphocyte associated protein 4 and programmed
cell death protein 1/programmed death-ligand 1 inhibitors) showed
promising results in treating cutaneous melanoma, it did not appear
to be as effective for UM (17,18).
Thus, an improved insight into the molecular and genetic profiles
of UM is essential to facilitate the detection of new prognostic
biomarkers and to develop new treatment modalities specific for
patients with UM.
The present study aimed to identify new feature
genes involved in the occurrence of UM and provide deeper insights
into the mechanism of UM, including subtype clusters,
ligand-receptor interactions, immune infiltration, co-expressed UM
genes and competing endogenous (ce)RNA networks, through analysis
of single-cell sequencing data. In vitro assays were also
performed to verify the biofunctions of the identified key
genes.
Materials and methods
Data acquisition
A total of 80 samples with processed raw mRNA
expression data from UM were downloaded from The Cancer Genome
Atlas (TCGA) database (https://portal.gdc.cancer.gov/projects/TCGA-UVM)
(19). TCGA database is currently
the largest cancer genomics database and stores various types of
cancer-related data, including gene expression, miRNA expression,
copy number and DNA methylation data (20). The GSE138433 dataset was downloaded
from the National Center for Biotechnology Information (NCBI) Gene
Expression Omnibus (GEO; http://www.ncbi.nlm.nih.gov/geo/info/datasets.html)
public database, which contained melanoma-related data for
single-cell analysis (13). This
dataset consisted of 6 samples. Briefly, the GEO database is a gene
expression database created and maintained by the NCBI in the
United States (21).
Single-cell analysis processing
First, the ‘Seurat’ package (v4; http://satijalab.org/seurat) (22) was employed to load the expression
profile, followed by filtering out low-expressed genes using the
criteria: nFeature_RNA >100 and percent.mt <5. Data were
standardized, normalized and subjected to a principal component
analysis (PCA). The ElbowPlot method identified the optimal number
of principal components (PCs) as 13. Subsequently, data integration
was performed among the samples using the ‘harmony’ package.
Further analysis involved FindNeighbors, FindClusters and the
t-distributed Stochastic Neighbor Embedding (t-SNE) method to
visualize the spatial relationships between clusters with a
specified resolution of 0.8.
The clusters were annotated using the ‘celldex’
(v1.0.0) and ‘SingleR’ packages (v1.4.1) (https://bioconductor.org/books/release/SingleRBook/sc-mode.html),
revealing associations with crucial cells in disease occurrence.
Finally, the FindAllMarkers function, with the logfc.threshold set
to 1 and min.pct set to 0.25, was used to extract the marker genes
for each cell subtype from the single-cell expression profile. Gene
filtering criteria, including p_val_adj <0.01 and
|avg_log2FoldChange|>1, was applied to identify significantly
differentially expressed genes, serving as unique markers for each
cell subtype.
Analysis of the interactions between
ligands and receptors
CellPhoneDB (v4.0.0; https://github.com/ventolab/CellphoneDB) (23) is an openly available, curated
repository of receptors, ligands and their interactions (24). Ligands and receptors consist of
subunits that accurately represent heteromeric complexes. The
ligand-receptor database, CellPhoneDB, is integrated with UniProt,
Ensembl, PDB, IUPHAR and other resources. CellPhoneDB collectively
stores 978 proteins, enabling a comprehensive and systematic
analysis of communication molecules in cells and facilitating the
study of intercellular communication and signaling networks in
different cell types. A significance analysis of ligand-receptor
relationships for features in the single-cell expression profiles
was performed using the statistical_analysis function of the
CellPhoneDB software package. The cluster labels of all cells were
randomly permuted 1,000 times, and the average expression level of
receptors within clusters and the average expression level of
ligands within interacting clusters were determined. This generated
a null distribution (also known as the Bernoulli distribution or
binomial distribution) for each receptor-ligand pair in every
pairwise comparison between two cell types. Finally, notable
ligand-receptor pairs were selected for visualization.
Gene functional enrichment and
protein-protein interaction (PPI) analyses
Functional annotation was performed on notable gene
sets using the Metascape database (www.metascape.org) and the ‘clusterProfiler’ package
(v3.18.1; http://bioconductor.org/packages/release/bioc/html/clusterProfiler.html)
(25) to comprehensively explore
the functional relevance of these gene sets. Gene Ontology (GO;
http://metascape.org/gp/index.html)
and Kyoto Encyclopedia of Genes and Genomes (KEGG; http://metascape.org/gp/index.html) analyses were
performed for specific genes. A minimum overlap of ≥3 and P≤0.01
were considered to indicate statistical significance. PPIs were
analyzed using Cytoscape software (3.9.1; http://cytoscape.org/) (26).
Random survival forest of selected key
genes
Feature selection was performed using the
‘randomForestSRC’ package (v3.2.1; http://cran.r-project.org/web/packages/randomForestSRC/index.html)
(27). Additionally, the random
survival forest algorithm (v3.6.4) was used to rank the importance
of prognosis-related genes (nrep=1,000, indicating 1,000 iterations
in the Monte Carlo simulation). Genes with relative importance
>0.5 were identified as the final marker genes.
Immune infiltration analysis
The CIBERSORT algorithm (‘CIBERSORT’ R package;
v1.03; http://cibersortx.stanford.edu/) (28) was utilized to analyze RNA-sequencing
data from different patient subgroups. This algorithm was used to
infer the relative proportions of 22 immune-infiltrating cell
types. A Pearson correlation analysis between gene expression
levels and immune cell abundance was further performed. P<0.05
was considered to indicate a statistically significant
difference.
Drug sensitivity analysis
Using the Genomics of Drug Sensitivity in Cancer
(GDSC) database (https://www.cancerrxgene.org/), the R package
‘pRRophetic (v0.5) was employed to predict the chemosensitivity of
each tumor sample. Regression analysis was employed to obtain
half-maximal inhibitory concentration estimates for specific
chemotherapy drugs, and 10-fold cross-validation was performed
using the GDSC training set to assess the accuracy of the
regression and prediction. Default values were selected for all
parameters, including using ‘combat’ to remove batch effects and
averaging duplicate gene expression values.
Gene Set Enrichment Analysis
(GSEA)
GSEA of the expression profiles of patients with UM
was performed using the GSEA tool (http://www.broadinstitute.org/gsea). This analysis was
performed to identify the pathways enriched by differentially
expressed genes between the high- and low-expression groups,
distinguished by the median expression value of each key gene. Gene
sets were filtered based on maximum and minimum gene set sizes of
500 and 15 genes, respectively. After 100 permutations, enriched
gene sets were obtained based on P<0.05 and a false discovery
rate of 0.25.
Construction of the nomogram and
calibration curve
Overall survival (OS) curves were generated using
the Kaplan-Meier (KM) method. Risk scores for each sample were
calculated using the Cox proportional hazards model. Samples were
divided into high-risk and low-risk groups based on the median risk
score. A two-stage weighted test using the R package, ‘TSHRC’
(29), was then performed to
validate the significance between the high-risk and low-risk
groups.
Correlations between UM-related genes
and feature genes
UM-related genes were obtained from the GeneCards
database (https://www.genecards.org/) and then
the expression levels of the top 20 genes with relevance score were
compared with the expression levels of key genes. Analysis of the
expression level of key genes and UM-related genes at the single
cell level was also applied for comparison.
Construction of a lncRNA-miRNA-mRNA
related ceRNA network
A potential lncRNA-miRNA-mRNA network was predicted
using the miRWalk (http://mirwalk.umm.uni-heidelberg.de/) and ENCORI
databases (https://rnasysu.com/encori/) and further validated
using both the TargetScan (https://www.targetscan.org/vert_80/) and miRDB
databases (https://mirdb.org/). Finally, ceRNA
networks based on differentially expressed genes were constructed
and visualized using Cytoscape software (version 3.9.1; http://cytoscape.org/) (26).
Cell culture and treatment
All experiments were performed in compliance with
the Association for Research in Vision and Ophthalmology
(https://www.arvo.org/About/policies/). The human UM
C918 cell line (originated from choroid) was purchased from
American Type Culture Collection (also termed MP41; cat. no.
CRL-3297). C918 cells were cultured in fresh Dulbecco's Modified
Eagle Medium/Nutrient Mixture F-12 (cat. no. 11320033; Thermo
Fisher Scientific, Inc.) supplemented with 10% fetal bovine serum
(cat. no. 10099141C; Thermo Fisher Scientific, Inc.) and 1%
penicillin-streptomycin solution (cat. no. 15140122; Thermo Fisher
Scientific, Inc.) at 37°C and 5% CO2 in a suitable
incubator. For gene knockdown, small interfering (si)RNA duplexes
targeting human genes [SEC14-like lipid binding 1 (SEC14L1),
plexin D1 (PLXND1), tropomyosin 4 (TPM4) or
GNAI2] and a control siRNA were designed and synthesized by
Guangzhou RiboBio Co., Ltd. The C918 cells were seeded in 12-well
plates at a density of 1×10⁵ cells/ml. When the cells
reached a 50–60% confluency, the SEC14L1, PLXND1, TPM4,
GNAI2 or control siRNA (100 nmol/l) were transfected by
riboFECT CP Transfection Kit (cat. no. C10511-05; Guangzhou RiboBio
Co., Ltd.) according to the manufacturer's instructions. At 24 h
post transfection, the cells were harvested and the knockdown
efficiencies of SEC14L1, PLXND1, TPM4 and GNAI2 were
evaluated using reverse transcription-quantitative polymerase chain
reaction (RT-qPCR). The siRNA sequences of the target genes and the
negative control are shown in Table
I.
 | Table I.Small interfering RNA sequences used
in the present study. |
Table I.
Small interfering RNA sequences used
in the present study.
| Gene | Sequence,
5′-3′ |
|---|
| GNAI2 | Sense:
GGACCUGAAUAAGCGCAAA |
|
| Anti-sense:
UUUGCGCUUAUUCAGGUCC |
| TPM4 | Sense:
UGCUGAAUUUGCAGAGAGA |
|
| Anti-sense:
UCUCUCUGCAAAUUCAGCA |
| SEC14L1 | Sense:
GCUGGAUUACAUCGACAAA |
|
| Anti-sense:
UUUGUCGAUGUAAUCCAGC |
| PLXND1 | Sense:
CCAUGAGUCUCAUAGACAA |
|
| Anti-sense:
UUGUCUAUGAGACUCAUGG |
| Negative | Sense:
UUCUCCGAACGUGUCACGU |
| control | Anti-sense:
ACGUGACACGUUCGGAGAA |
RNA extraction and RT-qPCR
Briefly, total RNA was extracted from different
siRNA-treated C918 cells using TRIzol reagent (cat. no. 15596026;
Thermo Fisher Scientific, Inc.). The RNA concentration was measured
using a NanoDrop 2000 spectrophotometer (Thermo Fisher Scientific,
Inc.). gDNA was erased at 42°C for 3 min and the first-strand cDNA
was reverse transcribed from 1 µg total RNA at 42°C for 15 min
followed by 95°C for 3 min using the KR106 FastQuant RT Kit with
gDNA Eraser (cat. no. KR106-03; Tiangen Biotech Co., Ltd.).
Subsequently, qPCR was performed using a QuantiNova SYBR Green PCR
kit (cat. no. 208054; Qiagen GmbH) according to the manufacturer's
instructions. The qPCR primer sequences are shown in Table II. The housekeeping gene, GAPDH,
was used per sample for normalization of the data using
2−ΔΔCq (30).
| Table II.Primer sequences used in reverse
transcription-quantitative PCR. |
Table II.
Primer sequences used in reverse
transcription-quantitative PCR.
| Gene | Primer sequences,
5′-3′ |
|---|
| GNAI2 | Forward:
CACCGCCGAGGAGCAAGG |
|
| Reverse:
CTCCAGGTCGTTCAGGTAGTAGG |
| TPM4 | Forward:
CCCTCAACCGACGCATCCAG |
|
| Reverse:
TCACCTTCATTCCTCTCTCACTCTC |
| SEC14L1 | Forward:
GCTGGAGAACGAAGACCTGAAG |
|
| Reverse:
GACTGACGAGGCATCCACAATC |
| TBX2 | Forward:
GCTGACCAACAACATCTCTGACAAG |
|
| Reverse:
AGGTGCGGAAGGTGCTGTAAG |
| PLXND1 | Forward:
GCCATCAAGCAGCAAATCAACAAG |
|
| Reverse:
CCGCAGCAGCCACTCCTC |
| GAPDH | Forward:
CGACCACTTTGTCAAGCTCA |
|
| Reverse:
AGGGGAGATTCAGTGTGGTG |
Cell Counting Kit-8 (CCK-8) assay
C918 cells were treated as aforementioned then
incubated with the CCK-8 reagent (cat. no. CK04-100T; Dojindo
Laboratories, Inc.) at 37°C for 2 h. The absorbance at 450 nm was
measured using a spectrophotometer (Synergy H1 Hybrid Reader;
BioTek; Agilent Technologies, Inc.). The cell viability of each
group was calculated according to the manufacturer's
instructions.
Gap closure assay
C918 cells were seeded at a density of
1×10⁵/ml cells on each side of the double-well culture
inserts (cat. no. 80209; Ibidi GmbH) in a 24-well plate. After
attachment, cells were respectively treated with control,
PLXND1 and GNAI2 siRNA (100 nmol/l); 48 h
post-transfection, the culture inserts were removed, and the cells
were washed with PBS. The cells (in medium containing 1% FBS) were
then allowed to migrate for a further 20 h. Cell migration was
observed using an Olympus IX-73 microscope equipped with a color
camera for light microscopy (Olympus Corporation). The gap closure
rate of each group was evaluated by ImageJ software (v1.52a;
National Institutes of Health).
Statistical analysis
All statistical analyses were performed using R
language (https://cran.r-project.org/; v
4.1.3). Unpaired student's t-test was used for comparisons between
two groups. For multiple comparisons, ANOVA followed by the
Dunnett's test was applied. All data are presented as the mean ±
SD. P<0.05 was considered to indicate a statistically
significant difference.
Results
Single-cell sample subtype clustering
and annotation analysis
A total of 19,441 cells with nFeature_RNA >100
and percent.mt <5 were included in the analysis (Fig. S1A and B). nfeatures=3,000 was set
to merge batches of samples for subsequent analysis and to display
the expression of genes in the samples (Fig. S1C). The top 10 genes with the
highest standardized variance were then labeled (Fig. S1C). Through PCA (dimensionality
reduction analysis) of the 10 genes, different scores were observed
across different dimensions (Fig. S1D
and E). However, when performing the PCA among samples, the
overall differences were not significant (Fig. S1F). Based on ElbowPlot, the optimal
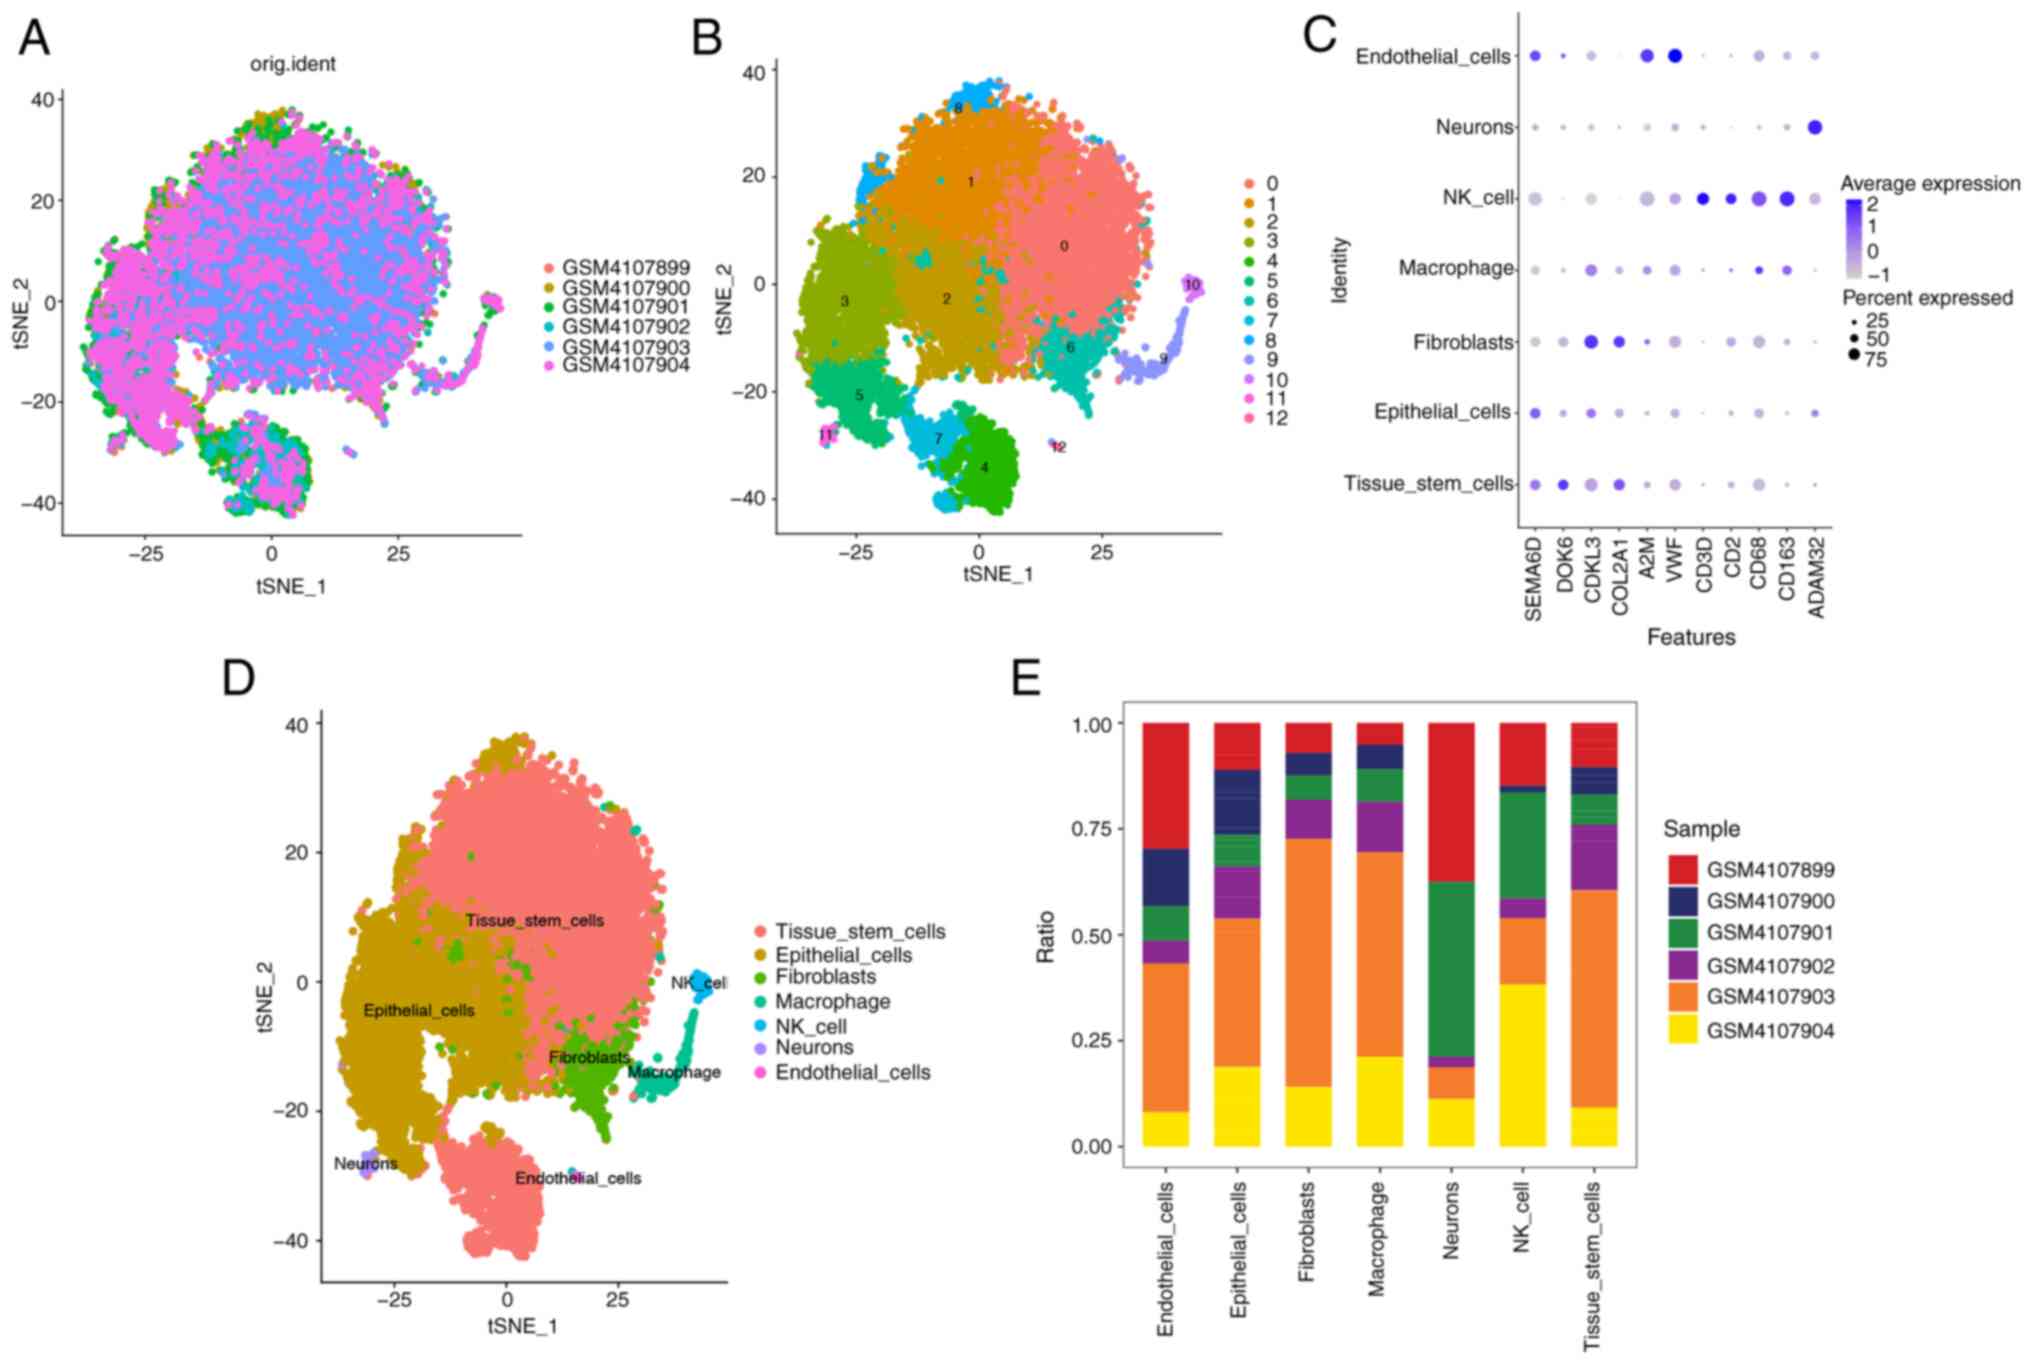
number of PCs was determined to be 13 (Fig. S1G). Multi-sample integration of the
single-cell samples using Seurat showed a small batch effect
(Fig. 1A). A total of 13 subtypes
were identified using t-SNE (Fig.
1B). Significant differences in the expression levels of
numerous genes were observed among the subtypes. The dot plot
visualization of the cell types were annotated manually to
complement the results obtained from SingleR and showed that
machine learning-based annotation significantly outperformed manual
annotation in distinguishing various cell types (Fig. 1C). Using the R package SingleR to
annotate each subtype, the 13 clusters were annotated into the
following cell categories: ‘Tissue_stem_cells’, ‘Epithelial_cells’,
‘Fibroblasts’, ‘Macrophage’, ‘NK_cell’, ‘Neurons’ and
‘Endothelial_cells’ (Fig. 1D and
E). Finally, using the FindAllMarkers function, 678 cell
subtype marker genes were extracted from the single-cell expression
profile (Table SI).
Analysis of receptor-ligand
relationships and enriched pathways
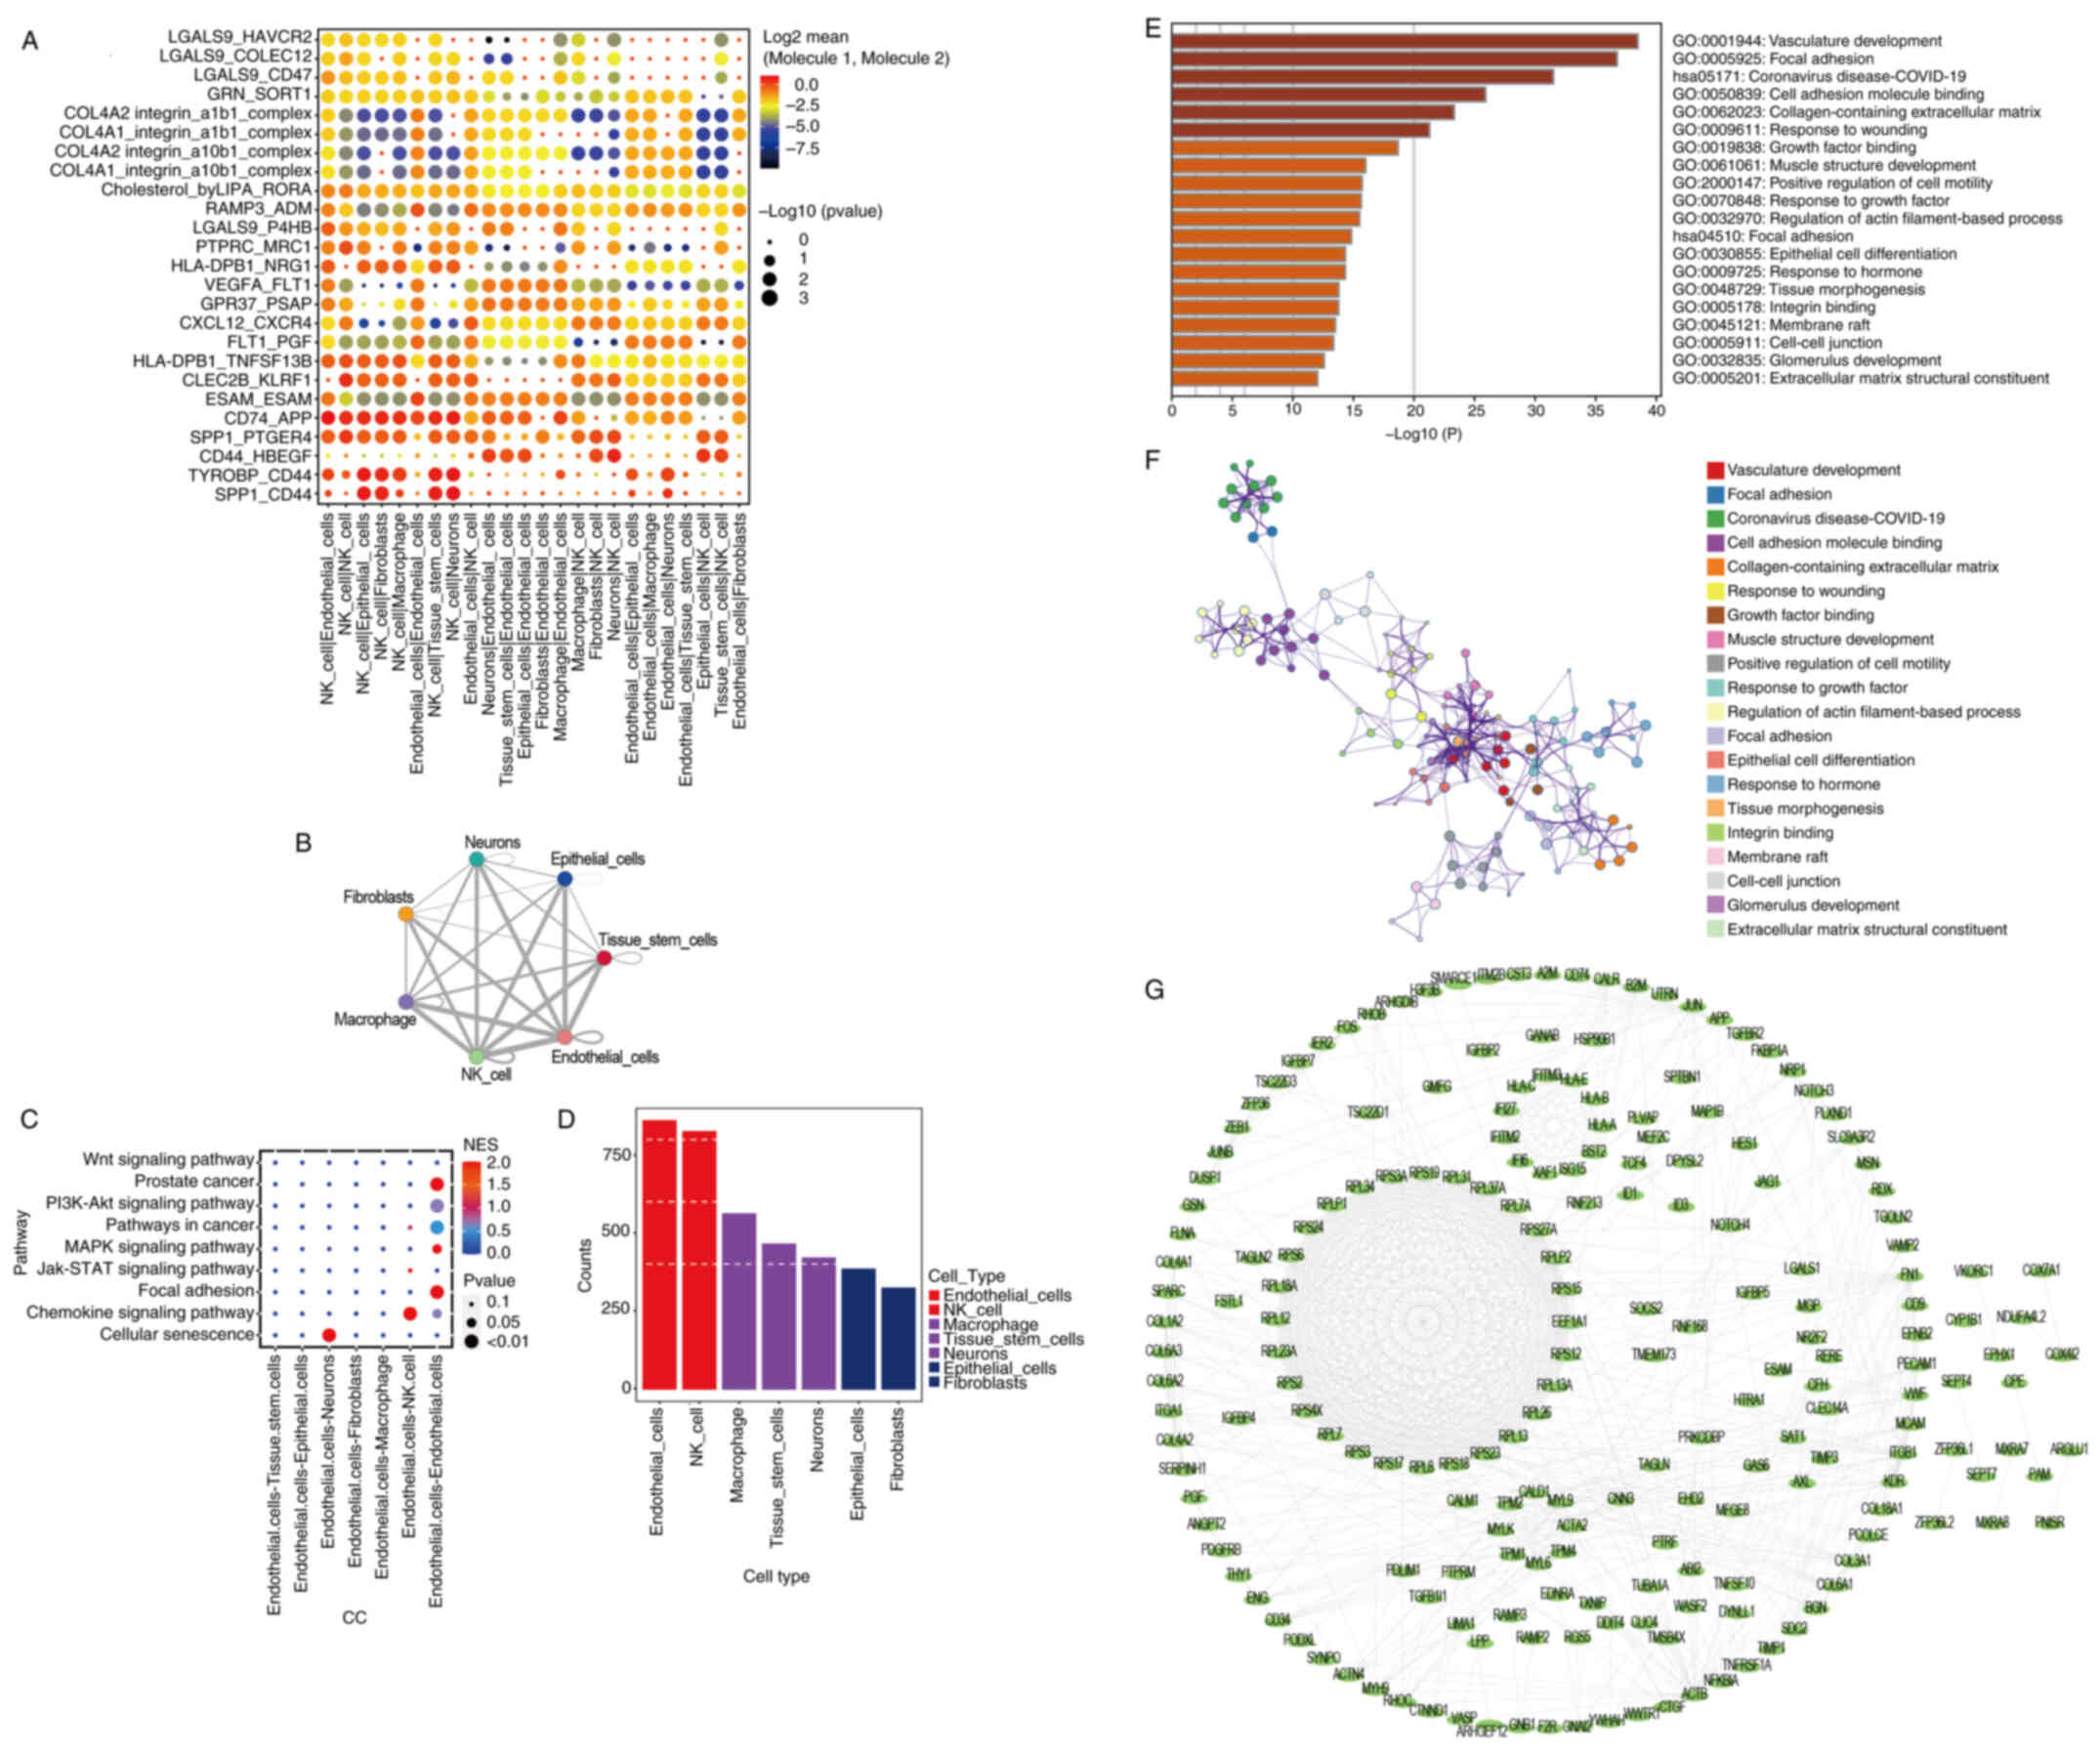
Significant ligand-receptor pairs were selected for
display, and the interactions in ‘NK_cell|Endothelial_cells’,
‘Neurons|Endothelial_cells’, ‘CD74_APP’ and ‘SPP1_PTGER4’ were the
most significant (Fig. 2A). In
addition, there were large numbers of potential ligand-receptor
pairs among ‘Macrophages’, ‘NK_cell’, ‘Endothelial_cells’ and other
cell types (Fig. 2B). With respect
to cell-cell communication, the cellular senescence pathway was
positively correlated with ‘Endothelial.cells-neurons’ (P<0.01;
Fig. 2C). As observed in the
heatmap shown in Fig. S2, the
neurons mainly originated from progenitor cells and cones, while
endothelial cells had diverse sources including capillary,
lymphatic, vascular and venous origins. The count of
ligand-receptor gene pairs corresponding to each cell group
indicated that the Endothelial_cells subtype had the highest number
of interaction relationships among all cell subtypes (Fig. 2D). Using the Metascape database,
pathway analysis of 299 marker genes from the Endothelial_cell
subtype showed significant enrichment in several pathways. These
included ‘vasculature development’, ‘focal adhesion’ and ‘cell
adhesion molecule binding’ (Fig. 2E and
F). Additionally, PPI network analysis of the genes within this
marker gene set (Fig. 2G) showed
that complex protein interactions existed in patients with UM.
Random survival forest analysis of key
genes
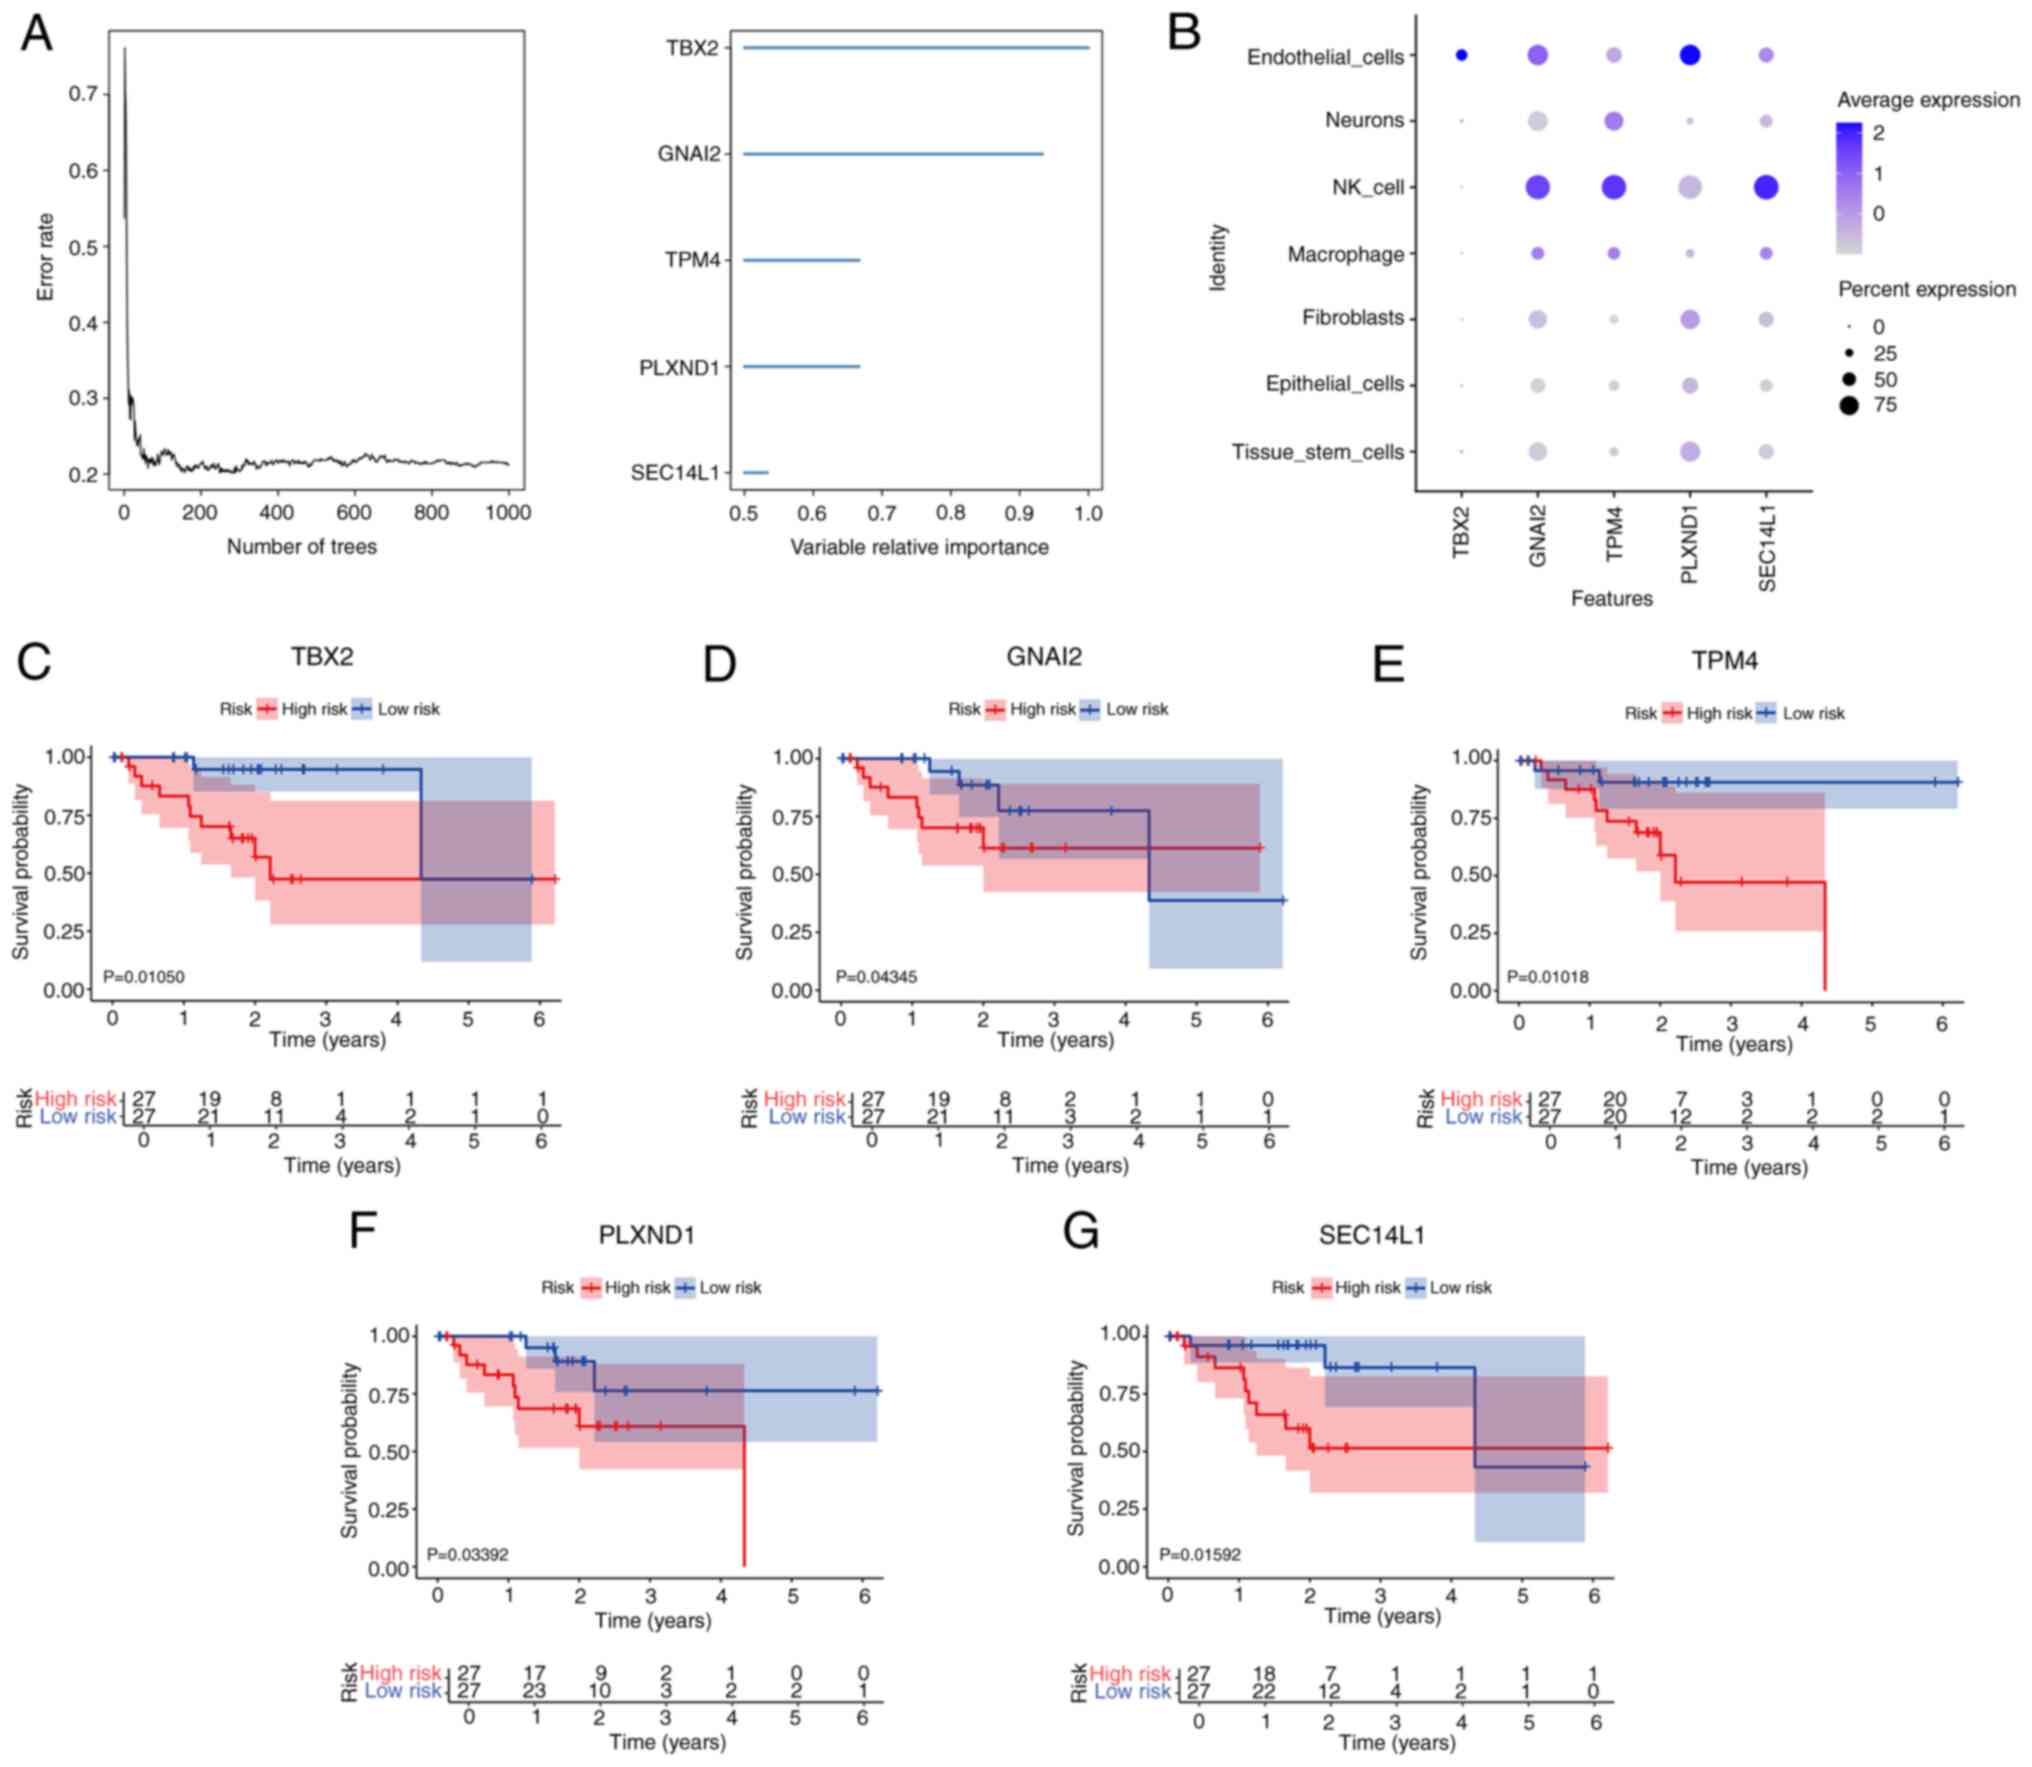
To further identify the key genes in the marker gene
set that influenced UM, a random survival forest analysis was
conducted using the TCGA-UM cohort. Based on a relative importance
of >0.5, 5 genes that met the selection threshold were
identified as the final markers (Fig.
3A). Excepting T-Box transcription factor 2 (TBX2), the
key genes had high expression levels in NK cells (Fig. 3B). Furthermore, neither NK cells nor
macrophages showed high expression of TBX2 (Fig. 3B). In the KM survival analysis, all
5 genes showed significant results in the TCGA-UM cohort, with the
following order of significance: TBX2, TPM4, PLXND1, GNAI2
and SEC14L1. Specifically, high expression levels of
TBX2, GNAI2, TPM4, PLXND1 and SEC14L1 were associated
with a longer OS time in UM (all P<0.05; Fig. 3C-G).
Immune microenvironment analysis of
key genes
The tumor immune microenvironment is typically
composed of tumor-associated fibroblasts, immune cells,
extracellular matrix, various growth factors, inflammatory factors
and specific physical and chemical characteristics, as well as
cancer cells themselves (31). The
immune microenvironment significantly affects the diagnosis,
survival outcome and clinical treatment sensitivity of tumors. The
relative percentage of different immune cell types in each sample
was shown in Fig. 4A. There were
multiple significant correlations among these immune cells,
indicating complex biological interactions among inflammatory cells
(Fig. 4B). PLXND1 expression
was most significantly positively correlated with monocytes and
negatively correlated with plasma cells (both P<0.01; Fig. 4C). TPM4 expression was most
significantly positively correlated with follicular helper T cells
and negatively correlated with M2 macrophages (both P<0.01;
Fig. 4C). GNAI2 expression
was most significantly positively correlated with monocytes
(P<0.01; Fig. 4C). TBX2
expression was most significantly positively correlated with
resting CD4 memory T cells and negatively correlated with M0
macrophages (both P<0.01; Fig.
4C). Correlations were also observed between these key genes
and different immune factors, including immune modulators,
chemokines, major histocompatibility complex and cell receptors
based on the TISIDB database (Fig.
4D). Notably, the expression level of TPM4 was
significantly positively correlated with almost all immune factors.
By contrast, the expression level of PLXND1 was negatively
correlated with most immune factors.
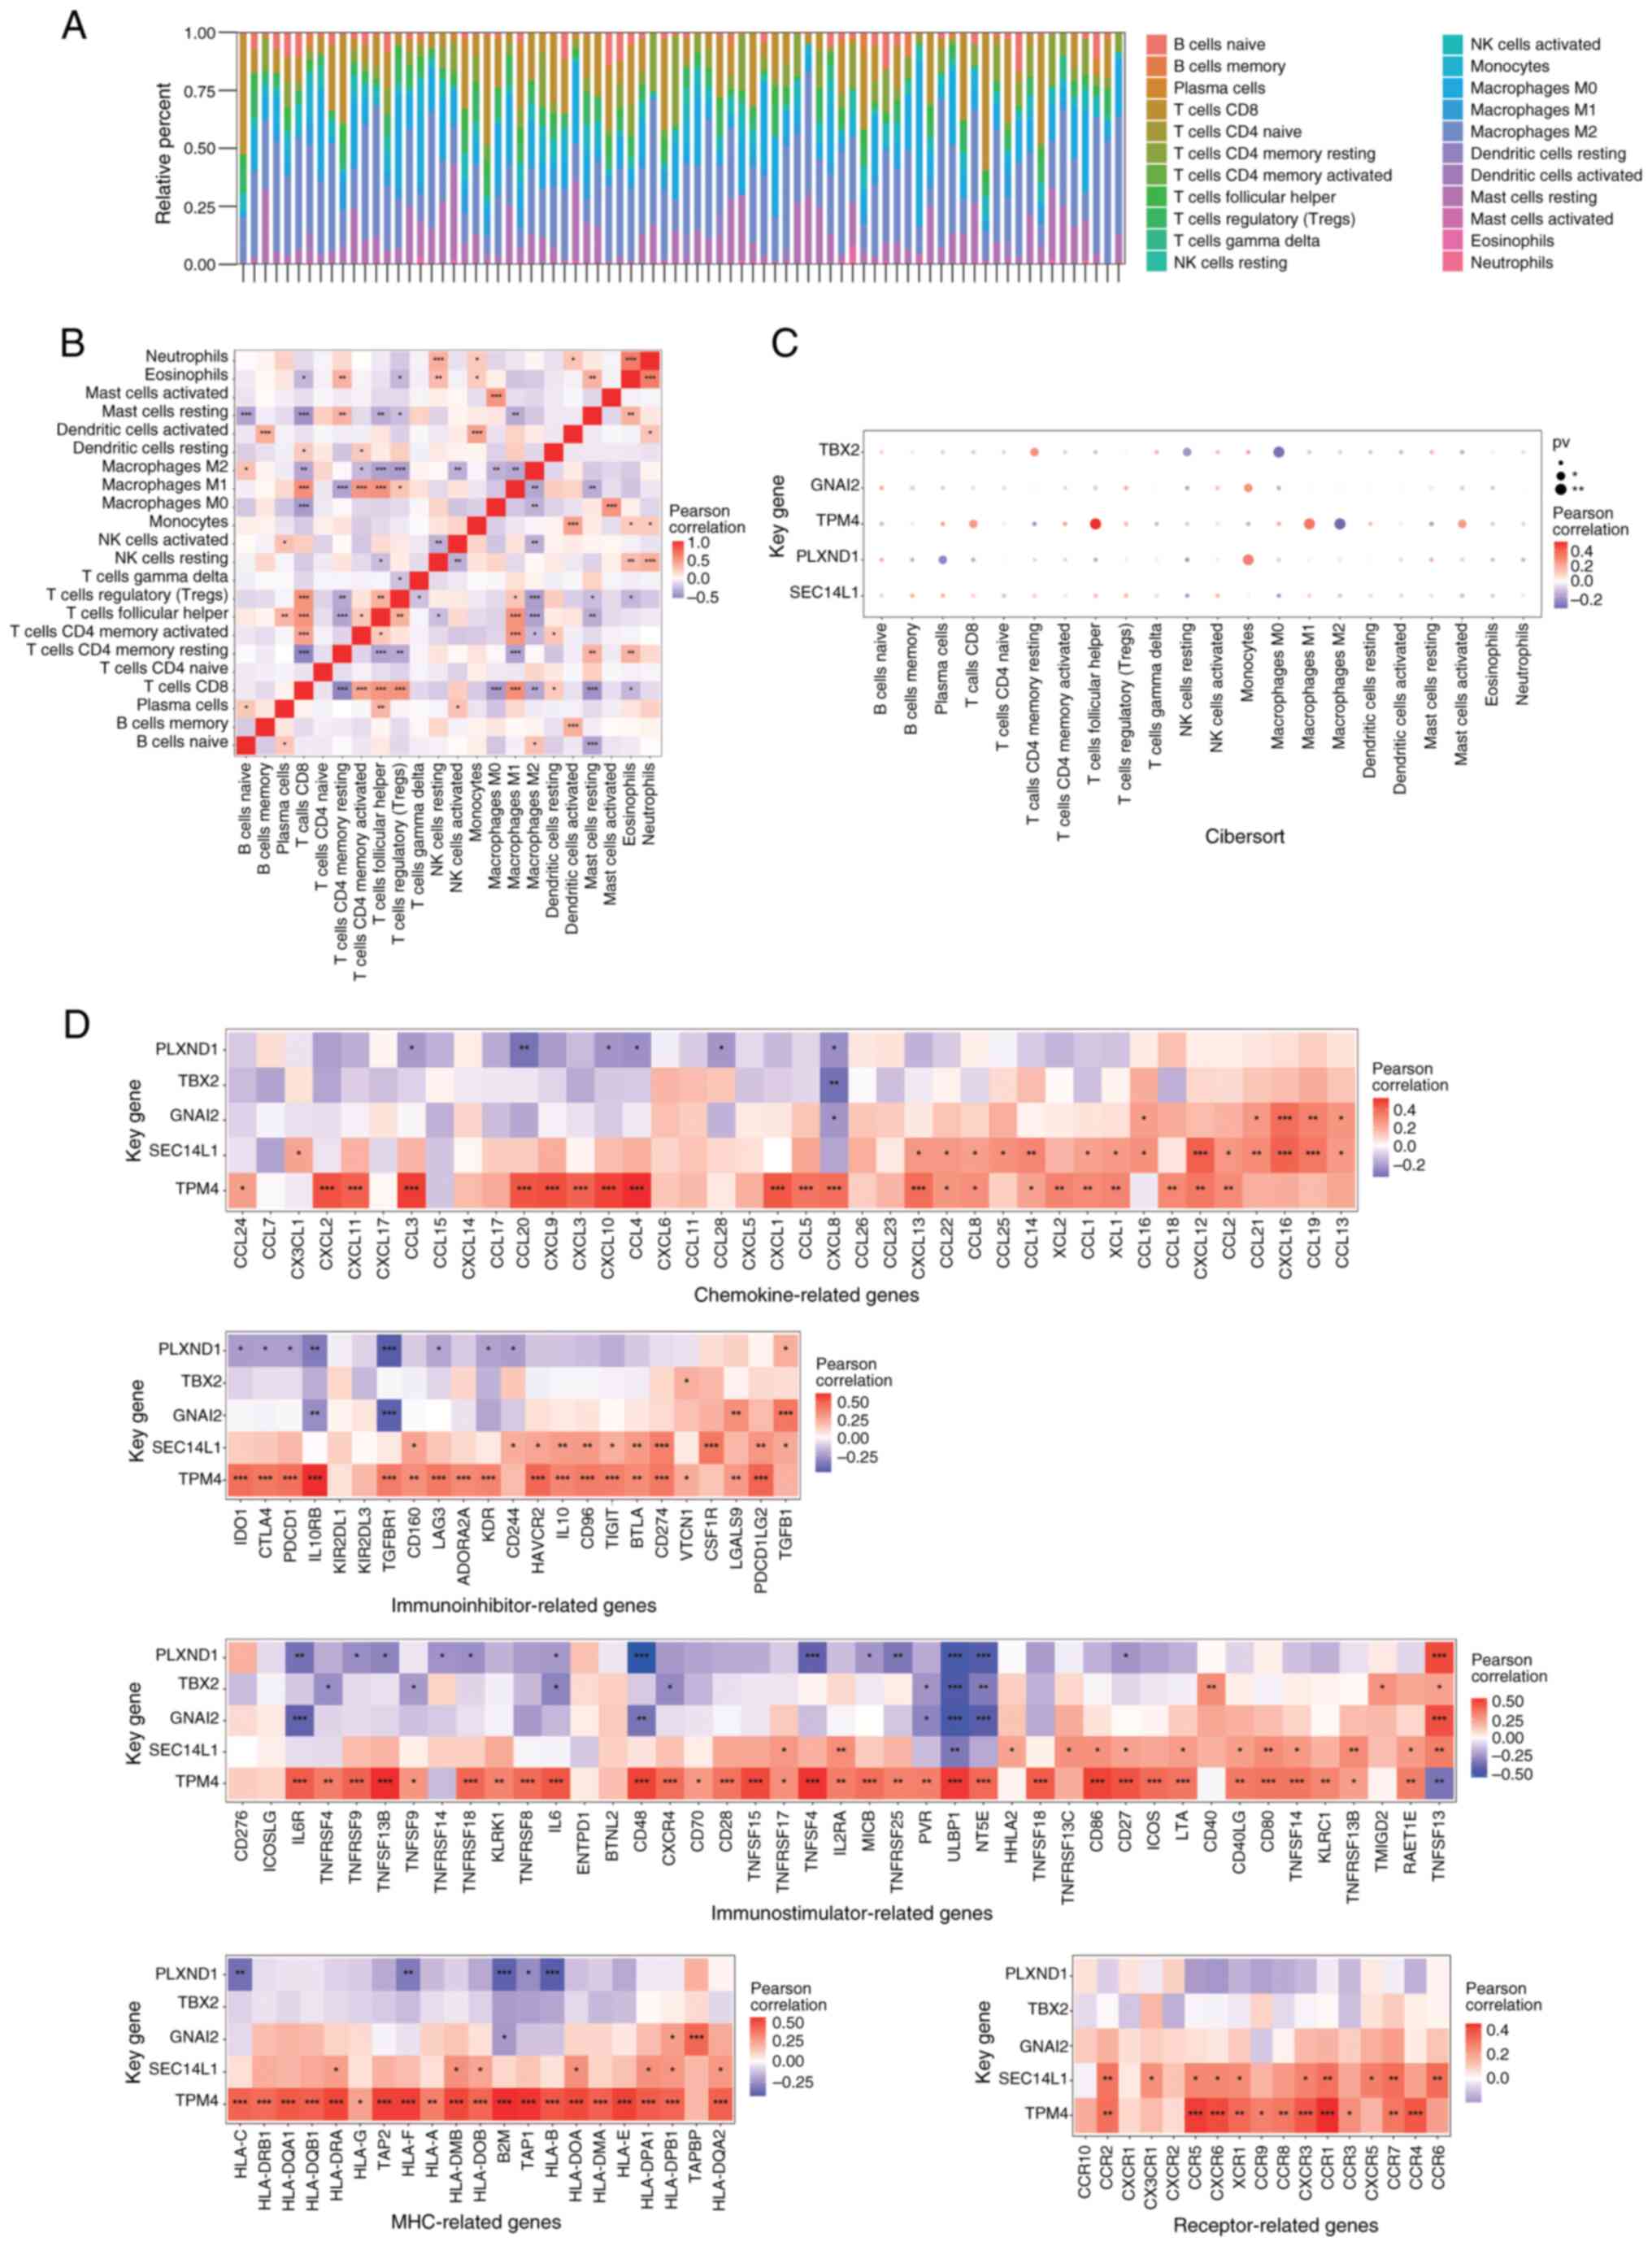 | Figure 4.Immune infiltration in uveal melanoma
(TCGA-UVM dataset). (A) Immune cell content of each sample. (B)
Immune cell correlation map. (C) Relationship between key genes and
immune cells. (D) Correlations between key genes and immune-factor
(chemokines, immunoinhibitors, immunostimulators, MHC and
receptors) related genes. GNAI2, G protein subunit α I2; MHC, major
histocompatibility complex; NK, natural killer; PLXND1, plexin D1;
pv, P-value; SEC14L1, SEC14-like lipid binding 1; TBX2, T-Box
transcription factor 2; TPM4, tropomyosin 4. |
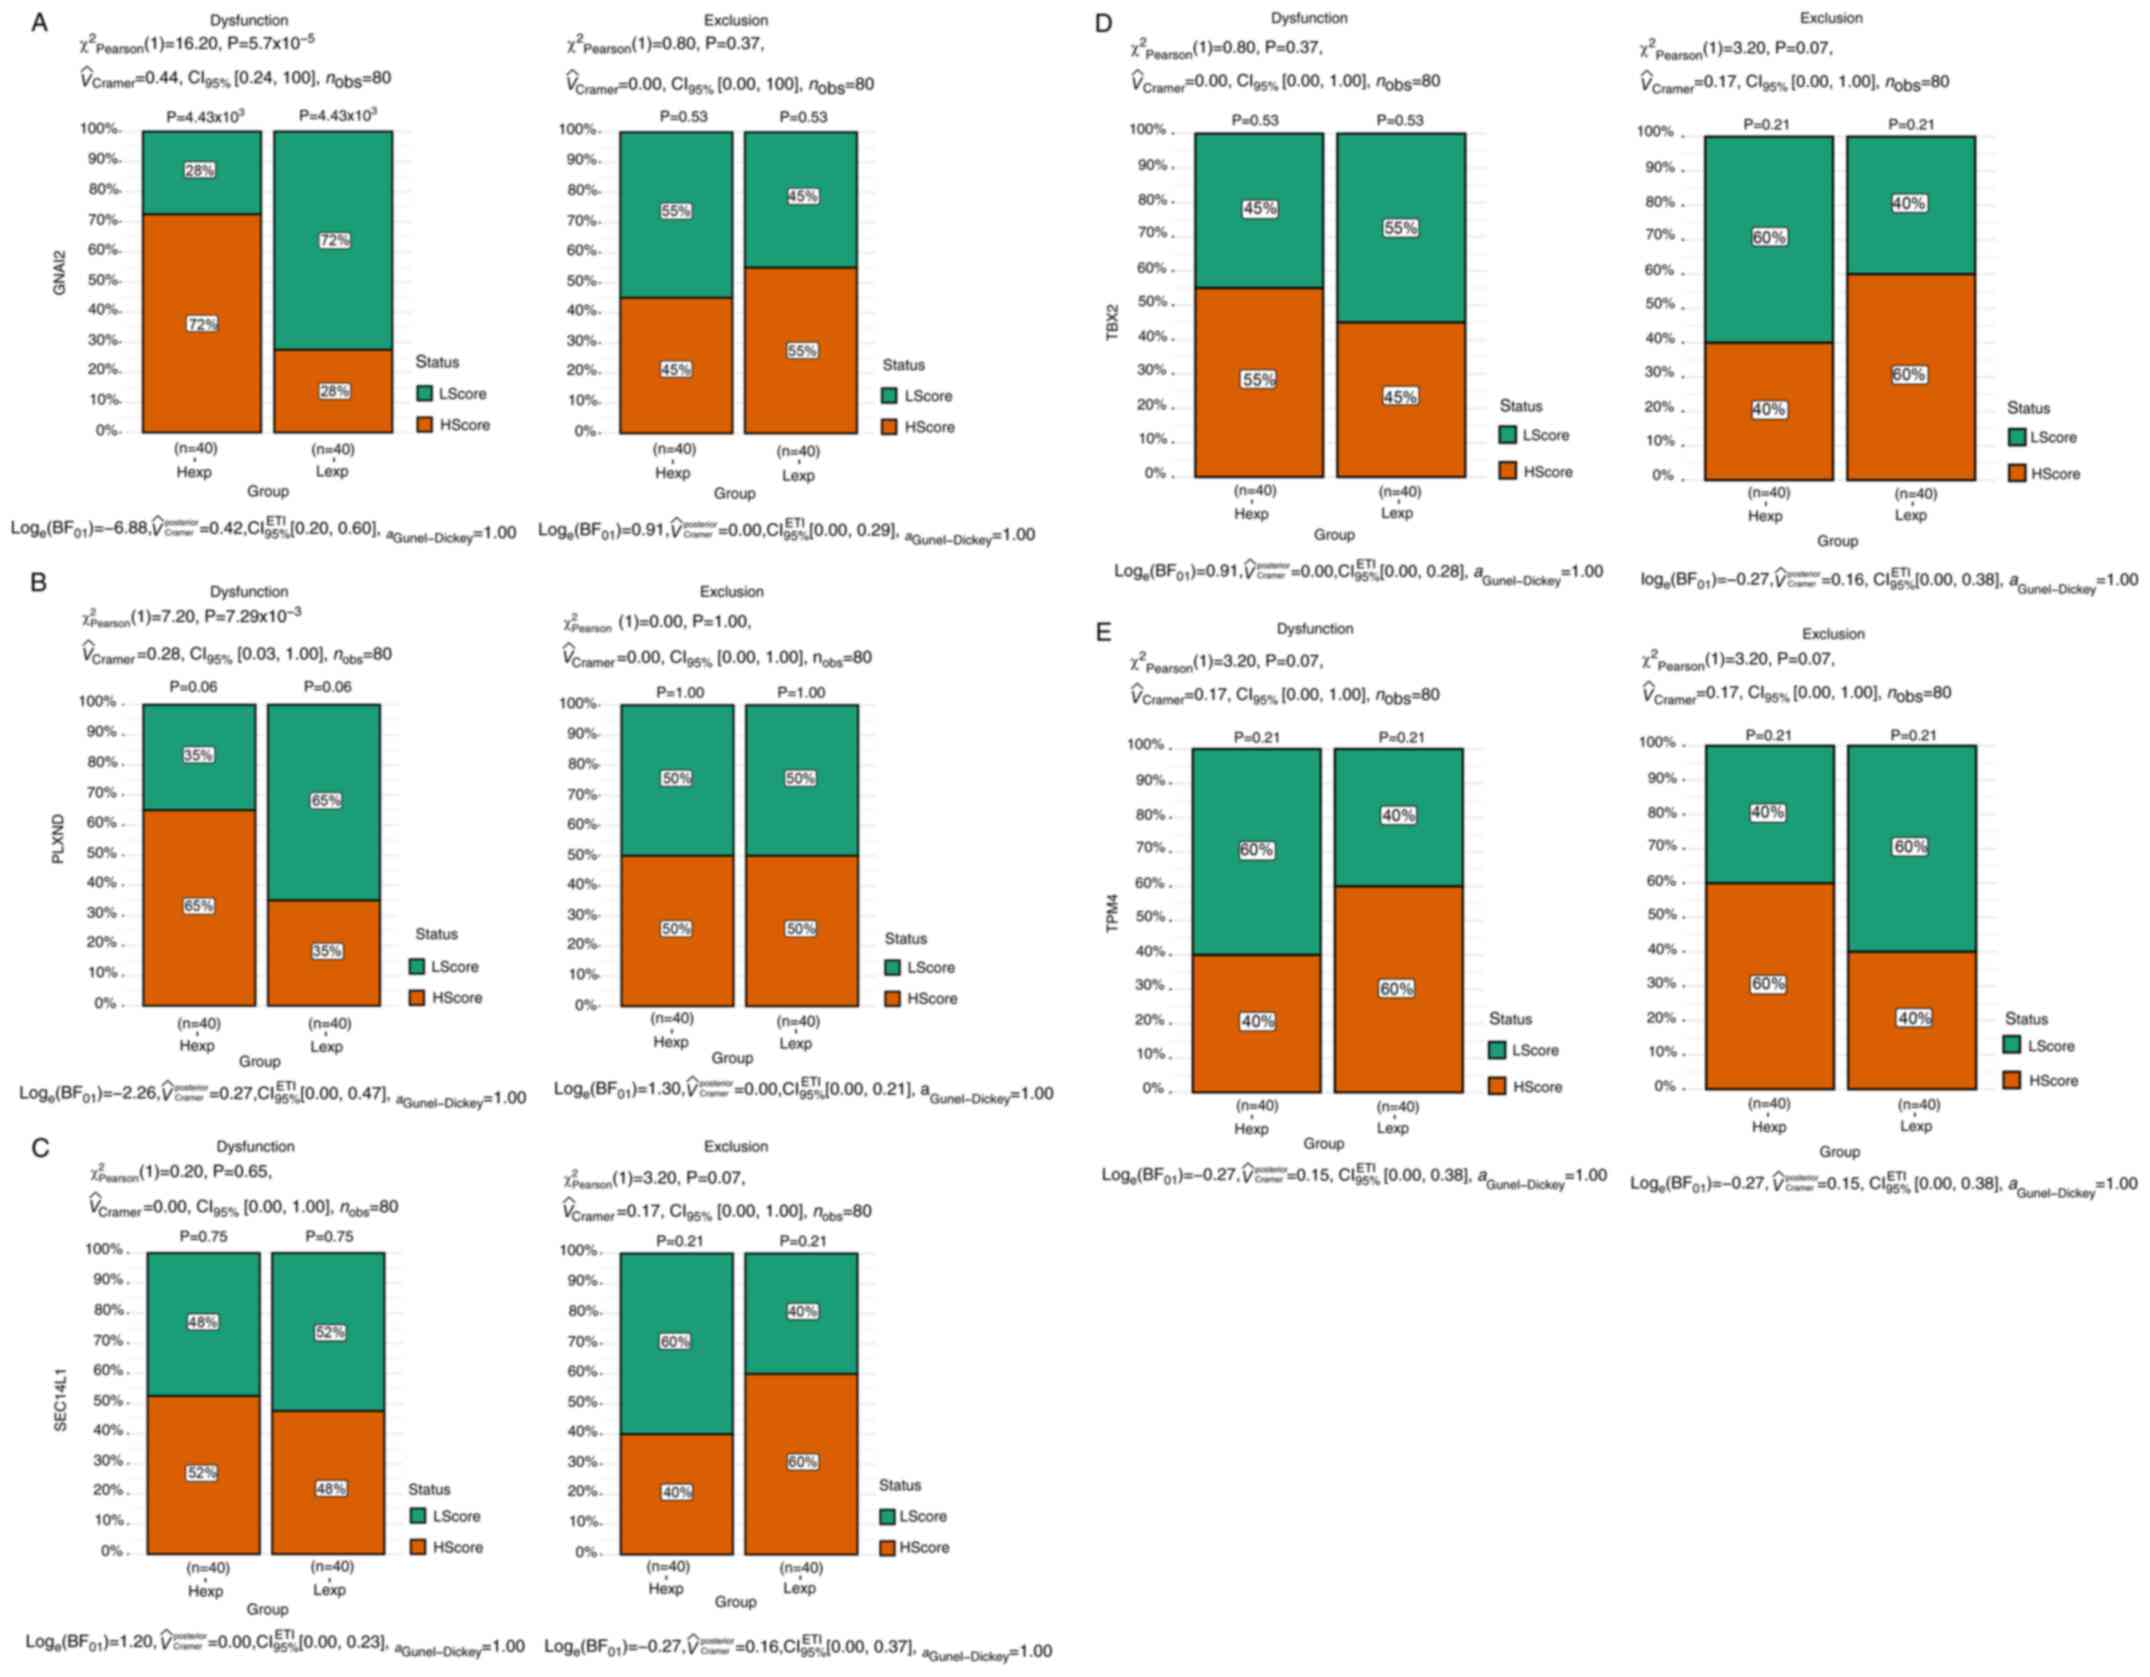
Analysis of tumor immune dysfunction and exclusion
showed differences between the high and low expression groups (with
the median value as the cut-off for grouping). A significant
difference in the dysfunction level between the high and low
expression groups was only found for GNAI2 (P<0.001;
Fig. 5A). In the exclusion and
dysfunction analyses, the H-score group referred to samples with
scores higher than the median score and the L-score group referred
to samples with scores lower than the median score.
With respect to the relationship between key genes
and the sensitivity to common chemotherapy drugs, the expression
levels of the key genes were significantly correlated with
sensitivity to bexarotene, bicalutamide, docetaxel, bryostatin.1,
JNK inhibitor VIII, lenalidomide, mitomycin C and sunitinib
(Fig. S3).
Specific signaling pathways associated
with key genes
Certain highly significant pathways enriched in the
key genes are shown in Fig. 6. The
GNAI2 gene was enriched in pathways such as ‘chromosome
organization involved in meiotic cell cycle’ and ‘high density
lipoprotein particle assembly’ in the GO analysis and in pathways
such as ‘acute myeloid leukemia’ and ‘basal cell carcinoma’ in the
KEGG analysis (Fig. 6A and B). The
PLXND1 gene was enriched in pathways such as ‘growth plate
cartilage chondrocyte differentiation’ and ‘positive regulation of
oxidative stress induced cell death’ in the GO analysis and in
pathways such as ‘basal cell carcinoma’ and ‘cell cycle’ in the
KEGG analysis (Fig. 6C and D). The
SEC14L1 gene was enriched in pathways such as ‘aerobic
electron transport chain’ and ‘ATP synthesis coupled electron
transport’ in the GO analysis and in pathways such as ‘acute
myeloid leukemia’ and ‘glycosaminoglycan biosynthesis chondroitin
sulfate’ in the KEGG analysis (Fig. 6E
and F). The TBX2 gene was enriched in pathways such as
‘establishment of protein localization to chromosome’ and
‘formation of extrachromosomal circular DNA’ in the GO analysis and
in pathways such as ‘glyoxylate and dicarboxylate metabolism’ and
‘histidine metabolism’ in the KEGG analysis (Fig. 6G and H). The TPM4 gene was
enriched in pathways such as ‘cell redox homeostasis’ and ‘cellular
response to ionizing radiation’ in the GO analysis and in pathways
such as ‘cytosolic DNA sensing pathway’ and ‘drug metabolism
cytochrome P450’ in the KEGG analysis (Fig. 6I and J). These signaling pathways
influenced the progression of UM.
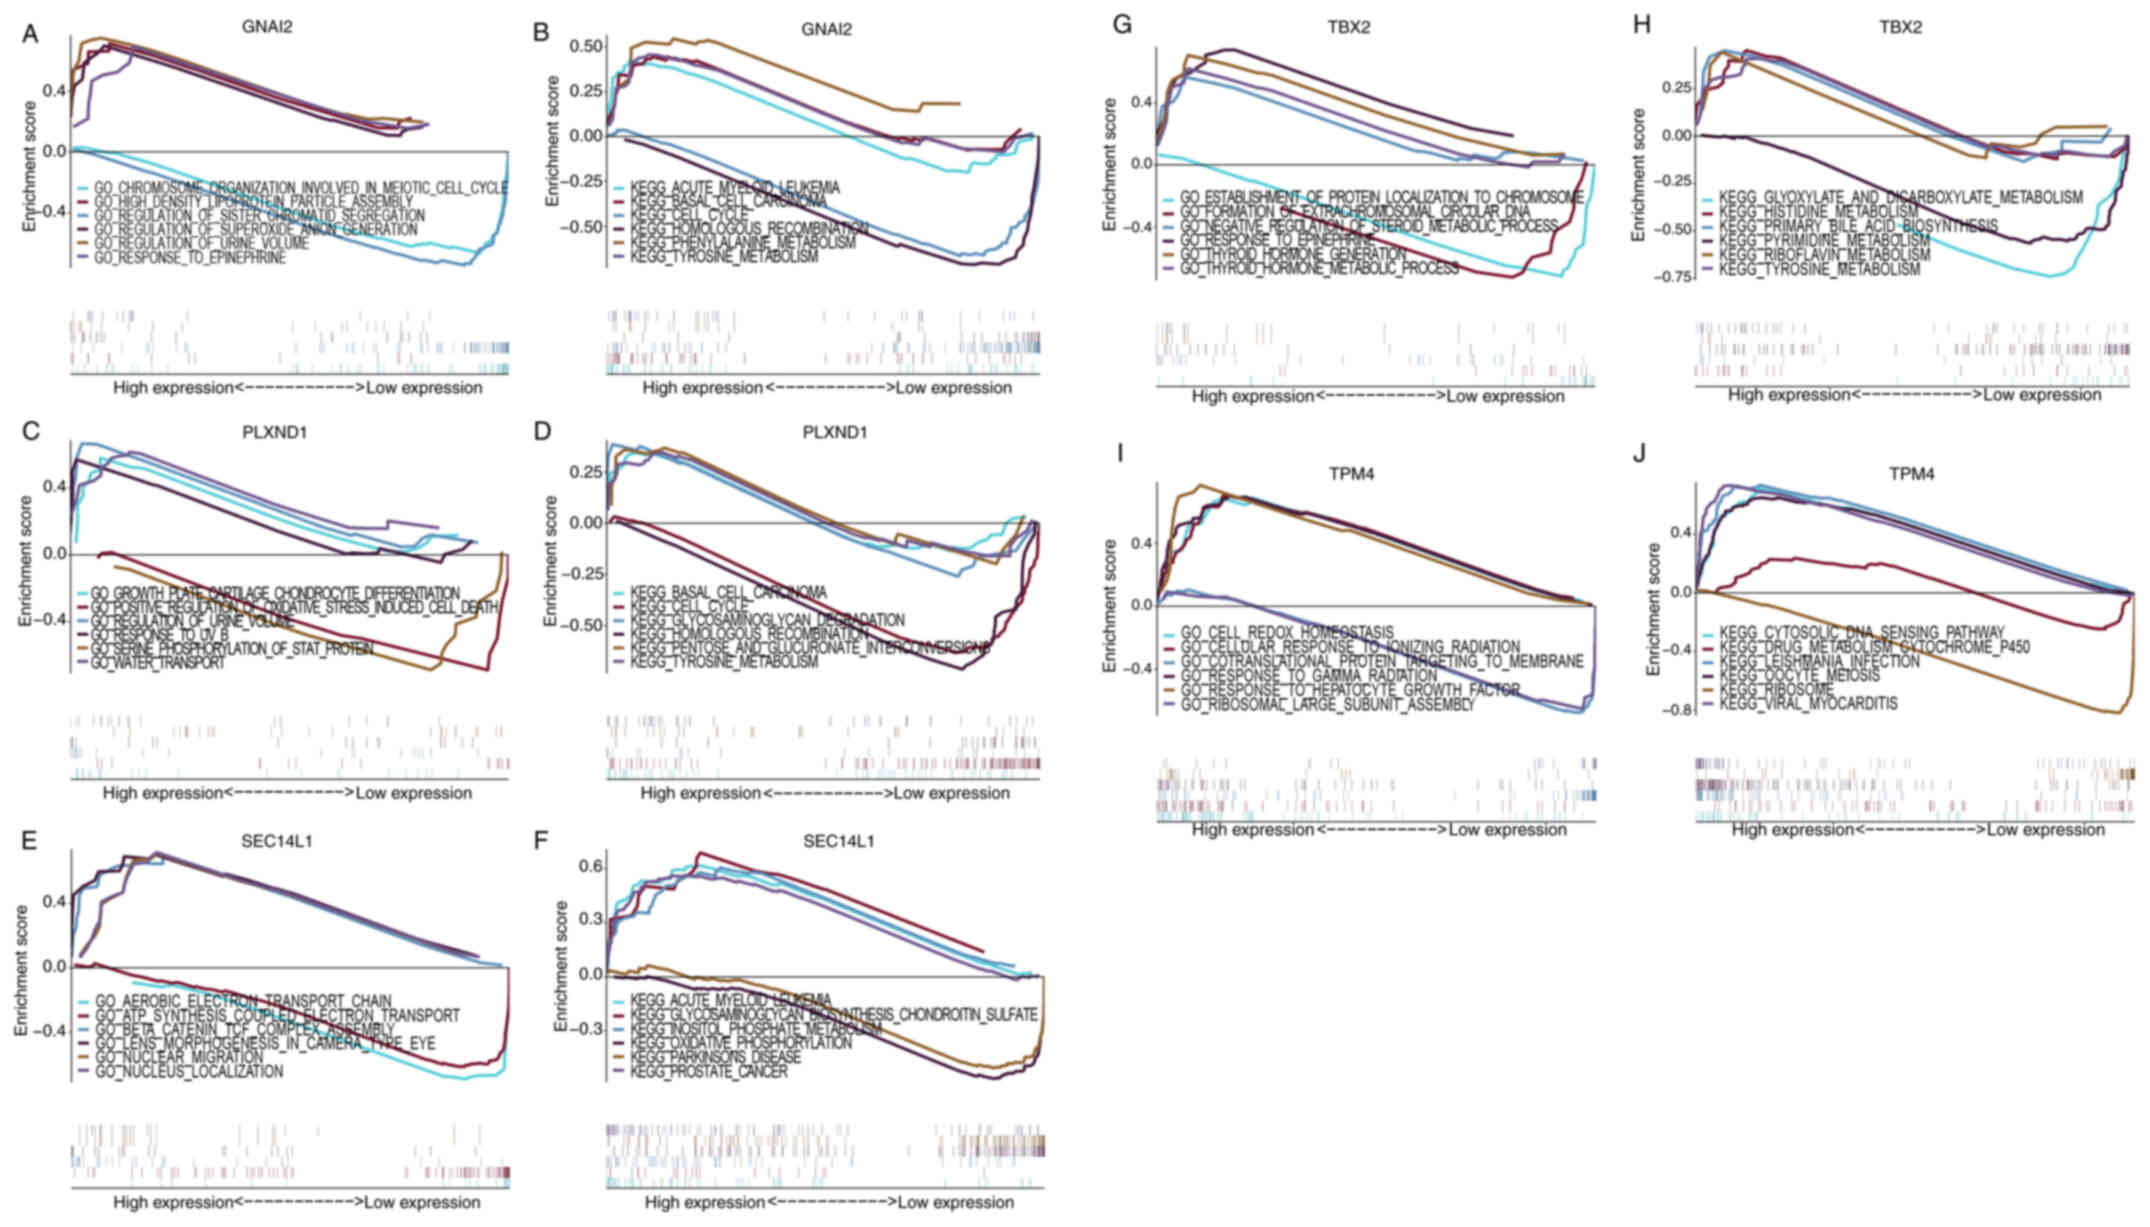 | Figure 6.Specific signaling pathways enriched
by key genes. GO and KEGG analysis of (A and B) GNAI2, (C
and D) PLXND1, (E and F) SEC14L1, (G and H)
TBX2 and (I and J) of TPM4. GNAI2, G protein subunit
α I2; GO, Gene Ontology; KEGG, Kyoto Encyclopedia of Genes and
Genomes; PLXND1, plexin D1; SEC14L1, SEC14-like lipid binding 1;
TBX2, T-Box transcription factor 2; TPM4, tropomyosin 4. |
Performance of the nomogram and
calibration curve
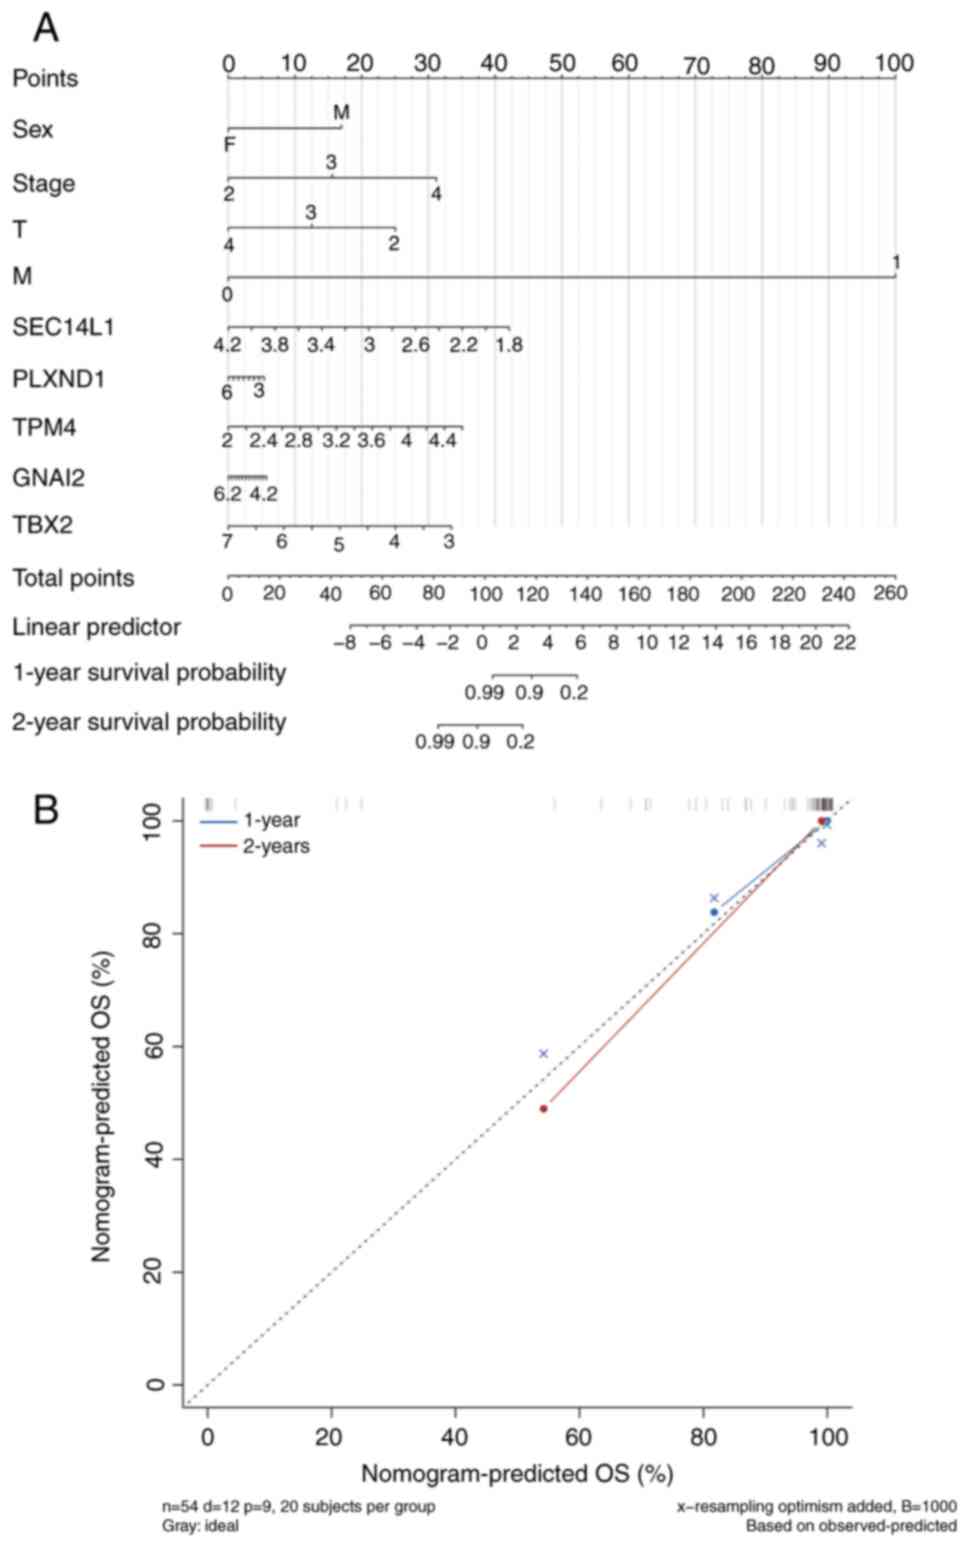
The expression levels of key genes were visualized
in the form of column charts based on the results of the regression
analysis. Regression analysis showed that the values of different
clinical indicators of UM and the expression distribution of key
genes contributed to the scoring process to varying degrees in all
samples (Fig. 7A). Furthermore,
predictive analysis was performed for 1-year and 2-year survival
periods, and the predicted OS rate aligned well with the observed
OS (Fig. 7B). However, the
predicted OS rate for the 3-year and 5-year period was not
constructed due to the poor curve fitting (Fig. S4).
Correlations between the expression
levels of the key genes and UM-related genes
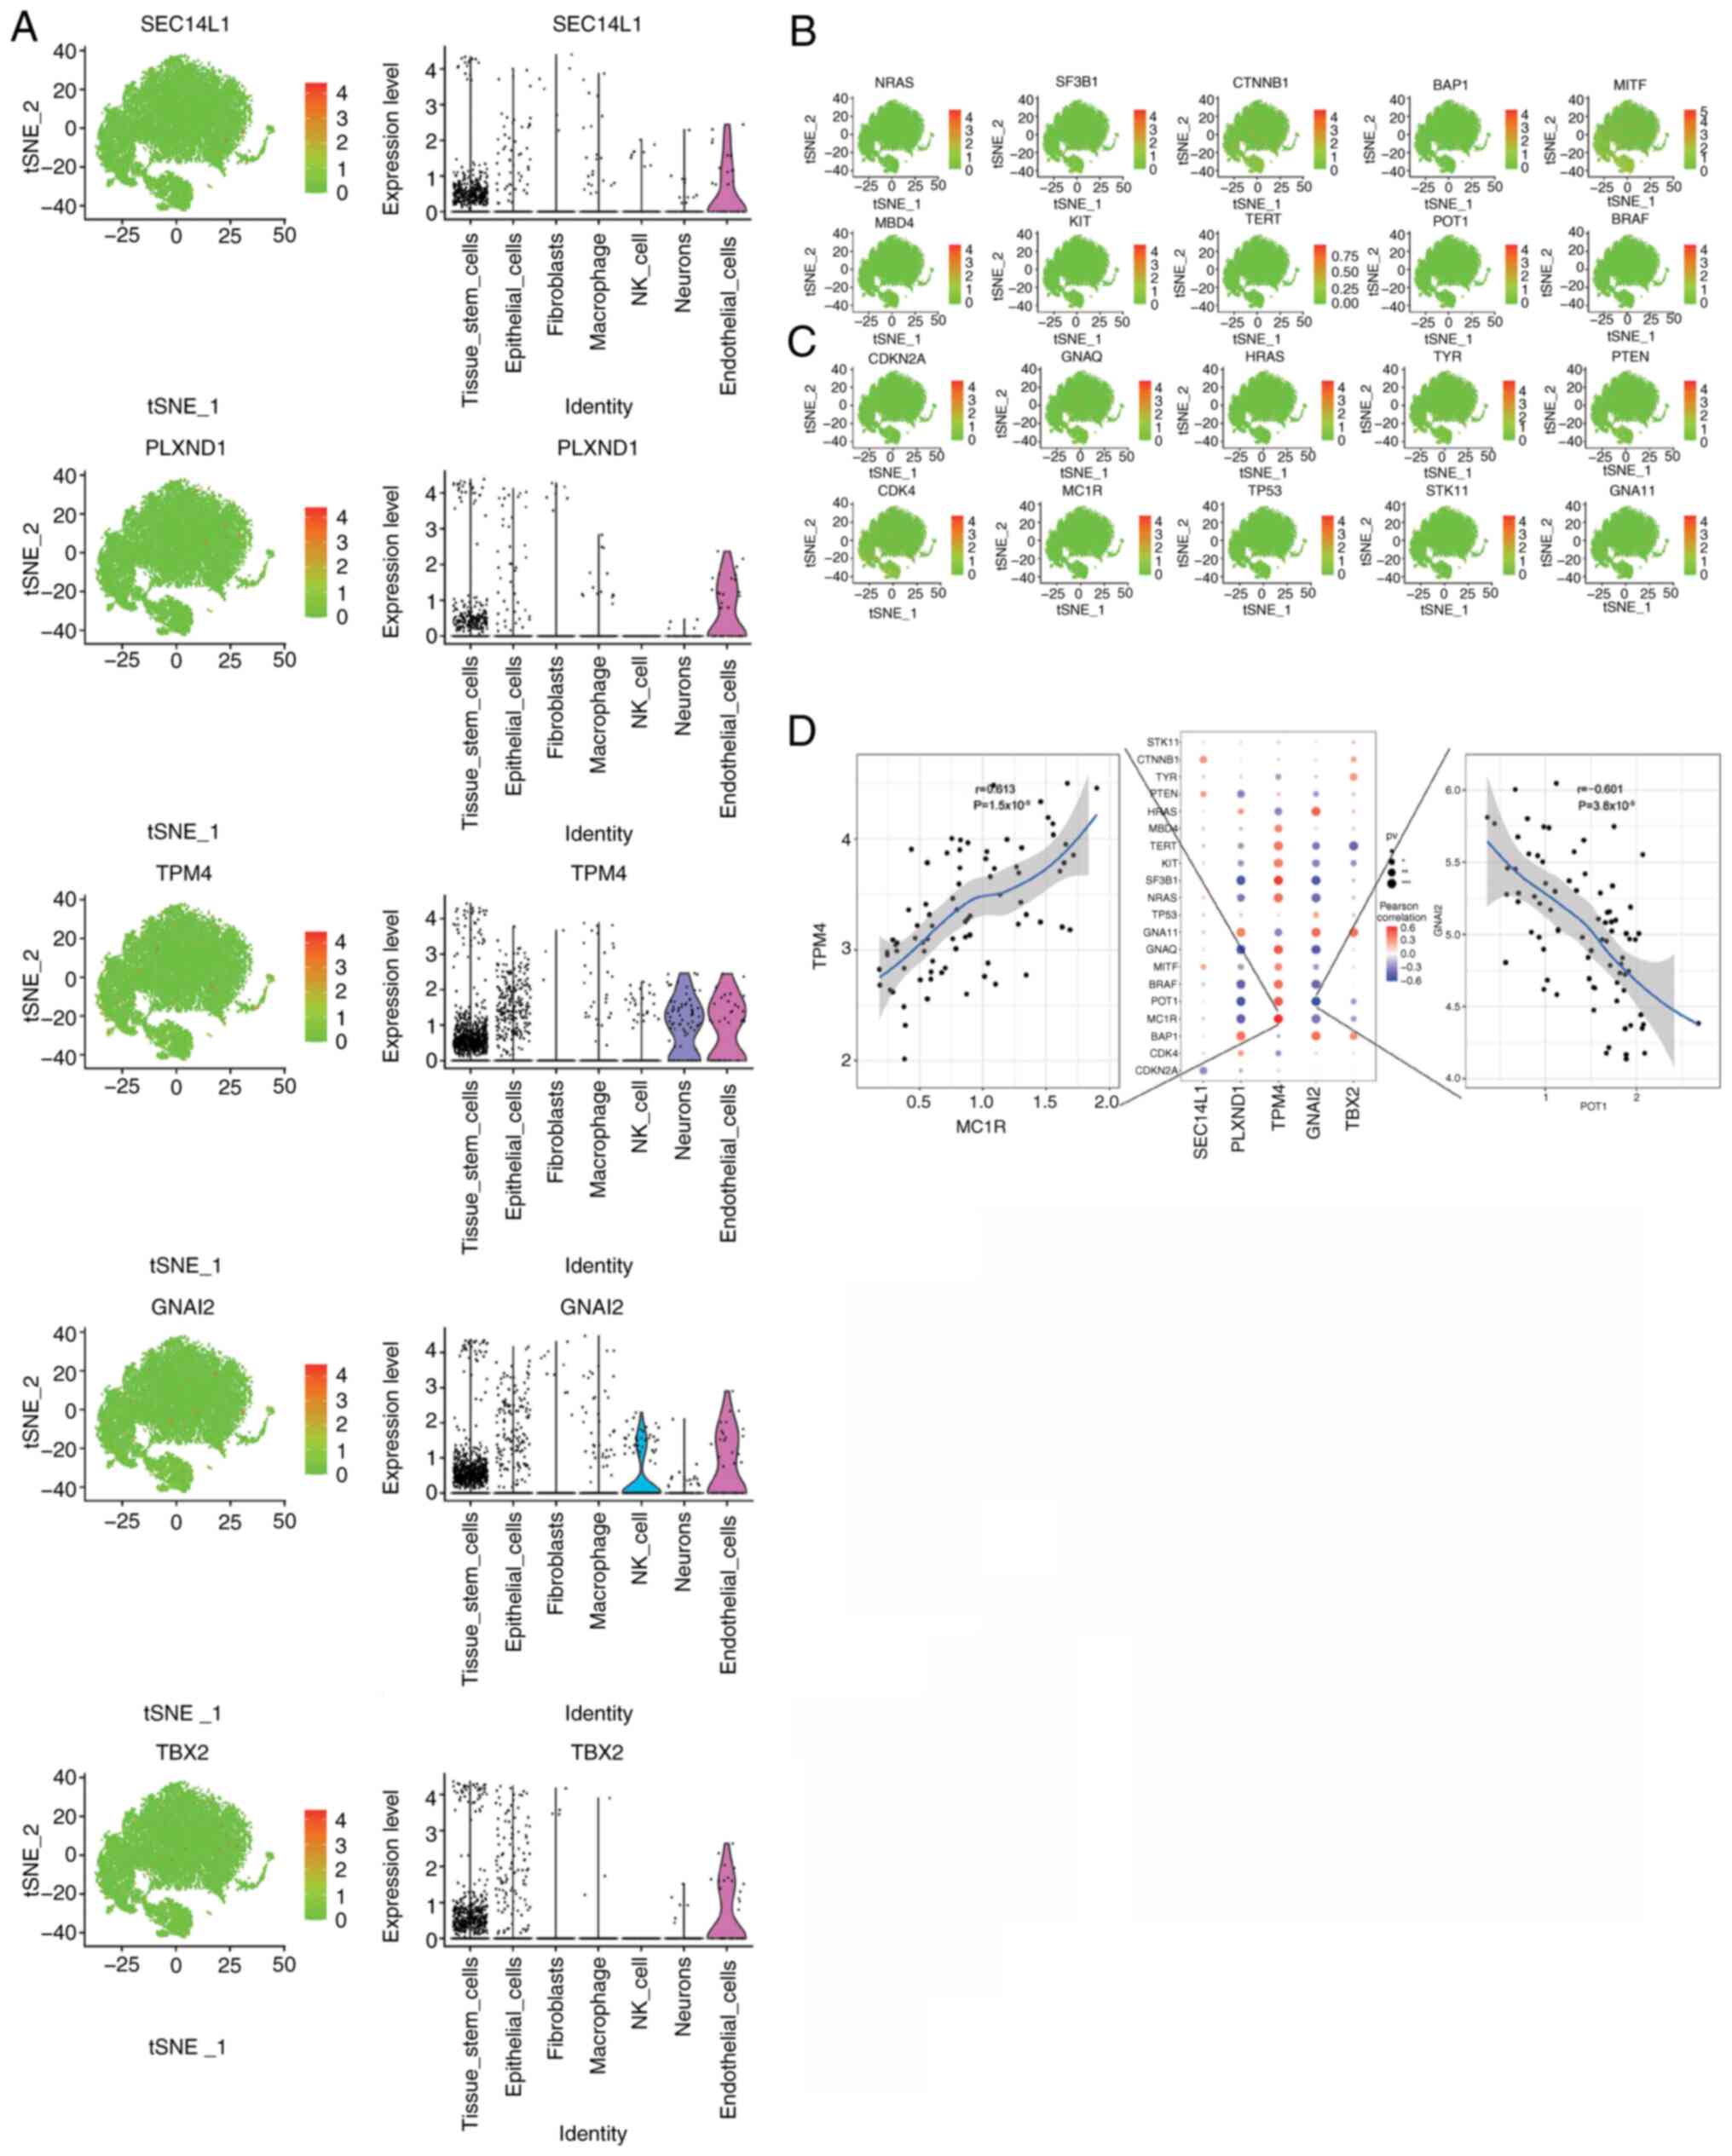
A total of 2,312 disease-related genes associated
with UM were obtained from the GeneCards database. Analysis of the
expression levels of the 5 key genes in different clusters
(Fig. 8A) and the expression levels
of the top 20 disease-related genes, based on their relevance
scores from the GeneCards database, (Fig. 8B and C) showed a significant
correlation between the expression levels of the key genes and
multiple UM-related genes (Fig.
8D). Notably, the expression level of TPM4 had a
significant positive correlation with that of melanocortin 1
receptor (r=0.613, P<0.001; Fig.
8D), and the expression level of GNAI2 had a significant
negative correlation with that of protection of telomeres protein 1
(r=−0.601, P<0.001; Fig. 8D).
The correlations of TPM4 and UM-related genes were mostly
opposite to that of GNAI2 and UM-related genes (Fig. 8D). However, the correlations of
PLXND1 and GNAI2 with UM-related genes were more
consistent (Fig. 8D). Additionally,
when the expression of key and UM-related genes were analyzed at
the single-cell level, these key genes were co-expressed with a
number of UM-related genes (Fig.
S5).
ceRNA network analysis of the key
genes
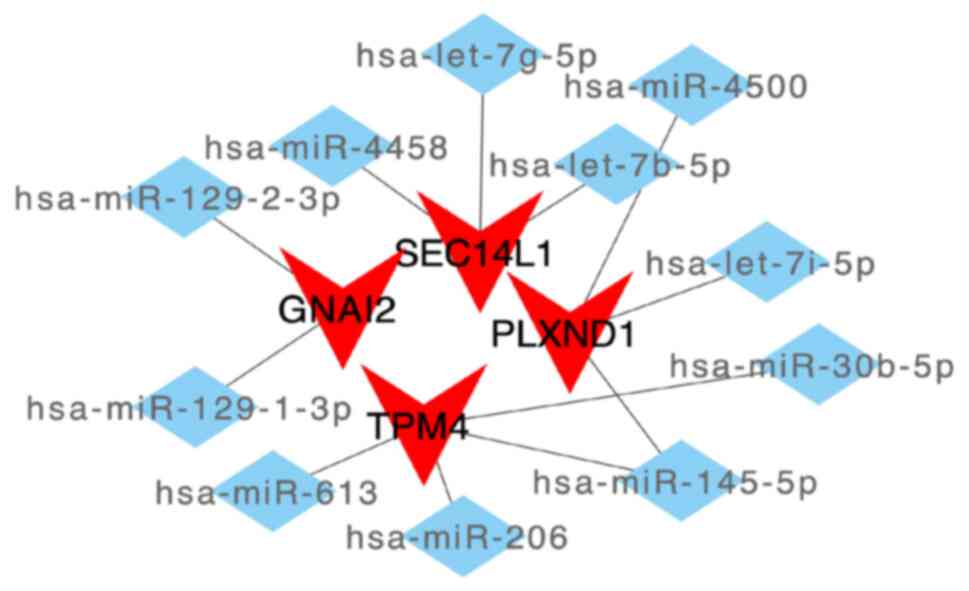
First, extracting mRNA-miRNA interaction pairs
related to the 5 key mRNAs from the miRWalk database resulted in
1,414 miRNAs. Only 41 mRNA-miRNA interaction pairs that were
detectable in both the TargetScan and miRDB databases (including 4
mRNAs and 11 miRNAs) were then retained. Based on these miRNAs, the
interacting lncRNAs were further predicted, resulting in 2,936
predicted interaction pairs (including 11 miRNAs and 1,071
lncRNAs). Finally, a ceRNA network, which involved 4 mRNAs and 11
miRNAs (Fig. 9) with 1,071 lncRNAs
(Fig. S6), was constructed using
Cytoscape.
In vitro biofunction of PLXND1 and
GNAI2 in C918 cells
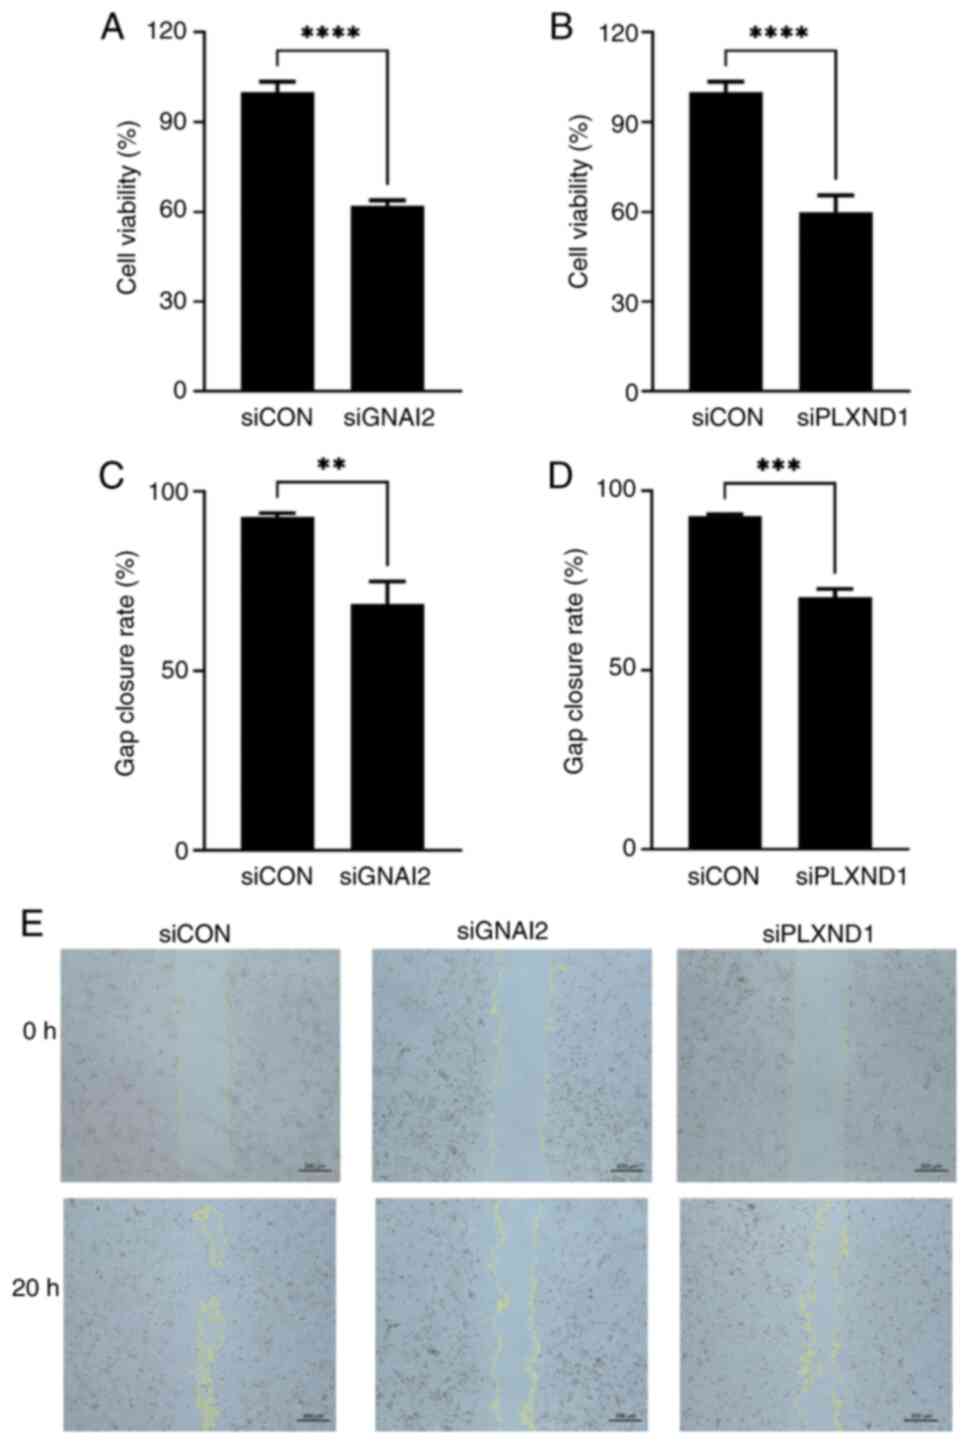
Firstly, the endogenous transcription level of
feature genes in C918 cells were tested. The mean quantification
cycle values of PLXND1, TBX2, SEC14L1, GNAI2 and TPM4
were 25.3, 32.3, 25.1, 22.2, and 23.2, respectively (Fig. S7A). TBX2 was excluded from
the subsequent siRNA knockdown experiments owing to its low native
expression, with a CT >30 compared with GAPDH
(P<0.0001; Fig. S7A).
SEC14L1 and TPM4 were also not tested in the further
experiments due to the low knockdown efficiency (<50%) of the
respective siRNAs compared with the negative control (P<0.01 and
P<0.001, respectively; Fig. S7D and
E). The PLXND1 and GNAI2 siRNAs were selected for
CCK-8 and gap closure assays due to their high silencing
efficiencies (>50%; Fig. S7B and
C). The cell viabilities of the PLXND1 and GNAI2
knockdown groups were 59.8% and 62.1%, respectively, which were
significantly lower than those of the siRNA control group (both
P<0.0001; Fig. 10A and B). In
the gap closure assay, the closure rate was significantly lower in
the PLX1 (70.3%; P<0.001; Fig. 10D) and GNAI2 (68.7%;
P<0.01; Fig. 10C) knockdown
groups compared with the control group (92.9%). Representative
images of the gap closure assay are shown in Fig. 10E.
Discussion
The present study, by analyzing single-cell data and
annotating endothelial cells, showed that endothelial cells
exhibited the most extensive cellular communication. Notably, these
cells had significant roles in various biological processes in UM,
particularly in vascular development. The findings of the present
study will not only enhance the understanding of the pathobiology
of UM at the cellular level but will also aid in the discovery of
novel pathways and therapeutic targets for this malignancy.
Endothelial cells play a crucial role in the
development of UM. García-Mulero et al (32) used the ESTIMATE algorithm to analyze
TCGA data and found a close association among endothelial cells,
fibroblasts (stromal cells), immune cells (especially cytotoxic
cells) and adverse prognoses from UM recurrence. Although
endothelial cells only account for 4–18% of ocular cells (depending
on the tissue) (33), they play a
pivotal role in UM progression and metastasis by orchestrating
intricate interactions within the tumor microenvironment (34). UM arises in highly vascularized
tissue, indicating a significant involvement of endothelial cells
in its pathogenesis (35).
Endothelial cells are key factors of angiogenesis, a process
crucial for tumor growth and dissemination. Furthermore, through
the secretion of angiocrine factors, endothelial cells not only
regulate angiogenesis but also modulate tumor cell behavior, immune
response and stromal remodeling (36). The aforementioned findings show that
endothelial cells engage in extensive crosstalk with other cell
types, including tumor cells, immune cells and fibroblasts, to
promote tumor growth, invasion and metastasis. Additionally,
endothelial cells may facilitate tumor cell intravasation into the
bloodstream by participating in vascular mimicry and interacting
with tumor cells during this process (37). The high number of cell
communications identified in endothelial cells underscores their
essential role in driving UM progression through angiogenesis,
microenvironmental interactions and response to pro-angiogenic
signals secreted by tumor cells (38). In normal conditions, endothelial
cells are situated on the vascular wall and act as barriers
preventing cell entry or exit from the bloodstream (38). Epithelial-to-mesenchymal transition
(EMT) is a process in which epithelial cells lose cell adhesion and
polarity and transform into mesenchymal-like cells (39,40).
Vascular endothelial cells also participate in regulating cancer
cells, thereby enhancing their invasive and migratory capabilities.
A study has indicated that vascular endothelial cells induce EMT in
human pancreatic, lung and murine mammary gland cancer cell lines
by continuously secreting TGFβ1 and TGFβ2
(41). Cancer cells overcome the
endothelial barrier by altering their vascular system. During the
migration of mesenchymal cancer cells towards blood vessels, they
may undergo passive transendothelial migration through endothelial
cells owing to the highly leaky nature of tumor vessels (42).
To the best of our knowledge, this is the first
study to identify that the SEC14L1, TPM4, TBX2, PLXND1 and
GNAI2 genes are associated with UM prognosis. The KM
survival analysis demonstrated significant differences in the
expression levels of these 5 genes between the high and low
expression groups in the TCGA-UM cohort. SEC14L1 has been
reported as a prognostic factor in both breast cancer and prostate
cancer (43,44). TPM4 has been reported as a
prospective marker for diagnosis, treatment outcome, and a small
molecular drugs target for pan-cancer treatment, including in
gastric cancer treatment (45).
Consistent results were obtained in the present study. TPM4
expression was positively correlated with almost all immune factors
in contrast to that of other genes. This indicated the essential
role of TPM4 in immune infiltration and the progression of
UM.
TBX2 and TBX3, members of the T-box
transcription factor family, are upregulated in various cancer
types, including melanoma, breast, liver, lung, pancreatic, ovarian
and cervical cancer (46). As the
master regulator of the type 1 immune response, TBX21 is
also upregulated in the leukocytes of peripheral blood in patients
with late-onset Alzheimer's disease (47). PLXND1 knockdown significantly
reduces cell migration and invasion and inhibits EMT in colorectal
cancer (48). The activation of
PLXND1 in dorsal root ganglion cells increases the migratory
and invasive activities of pancreatic cancer cells and a loss of
neural PLXND1 reduces the innervation of orthotopic
pancreatic ductal adenocarcinoma and metastasis in mice (49). In addition, PLXND1 can impair
endocardial endothelial autophagy via mediating calcium
dyshomeostasis in atrial fibrillation and is a mechanosensor in
endothelial cells (50,51). It is well known that the GNAQ
and GNA11 genes are mutated in 80–90% of UM in a mutually
exclusive pattern (52). These
genes encode the α subunits of the heterotrimeric G proteins, Gq
and G11, commonly termed the Gq/11 (Gq/G11) family (52). The typical function of Gq/G11 is to
activate intracellular signaling pathways in response to activation
of the cell surface G protein-coupled receptors (53,54).
However, GNAI2 encodes the α-2 subunit of guanine
nucleotide-binding protein G(i) involved in the regulation of
adenylate cyclase and transcriptome in ovarian cancer (55), and is a critical regulator of
oncogenesis and an upstream driver of cancer progression in ovarian
cancer (56). In addition, a
protein biomarker study using liquid biopsy revealed a negative
correlation between GNAI2 and the survival of patients with
cholangiocarcinoma (57). The
aforementioned findings showed notable differences in the
biofunction and encoding proteins between the Gq/G11 family and
GNAI2. Thus, we consider that the mutation of GNAI2
is a new variant. Consistently, in the present study, the results
of the in vitro experiments demonstrated a significant
reduction in cell viability and gap closure rate after
PLXND1 and GNAI2 knockdown. This indicated that
PLXND1 and GNAI2 may serve as potential diagnostic
markers and therapeutic targets for UM. Furthermore, these genes
and their co-expressions were significantly correlated with
disease-related genes, validating the reliability of the study
findings and demonstrating complex genetic interactions in UM.
A crucial aspect addressed in the present study was
the strong relationship between the tumor microenvironment and
notable aspects of disease understanding, such as diagnosis,
survival outcome and treatment sensitivity. Previous studies have
shown the abundance of several tumor-infiltrating immune cells, T
cells and dendritic cells in UM (58,59). A
previous study reported a positive correlation between the risk
score of UM and the levels of immune cell infiltration, including
CD4+ T cells, B cells, NK cells, dendritic cells and
macrophages (60). Notably, the
findings of the present study further revealed that certain genes
were significantly correlated with specific immune cells; for
instance, PLXND1 was associated with monocytes and
TPM4 was associated with follicular helper T cells. Combined
with the significant role of GNAI2 in immune dysfunction,
these findings implied the potential value of key genes in UM
immunotherapy. Examining the molecular landscape of a disease can
significantly contribute to refining current methods and
strengthening individualized medicine (61). This underscores that personalized
medicine is the future of disease treatment in a world where
generalized treatments are becoming less desirable and effective.
Furthermore, the accurate prediction of the 1 and 2-year OS rate
using key genes and clinical information in the present study
illustrated the clinical value of these key genes in predicting the
prognosis of patients with UM.
Recent experimental evidence suggests that lncRNAs
serve as ceRNAs, bind to miRNAs to modulate miRNA-induced gene
silencing, act as natural miRNA sponges, regulate gene expression
and play crucial roles in human diseases including UM (62–64).
In the present study, a ceRNA network specific for UM was
constructed. The findings highlighted the complex nature of UM,
combining with the functional roles of various mRNAs, miRNAs and
lncRNAs. The intricate network of these molecules along with the
heterogeneous nature of the disease presents a challenging scenario
for the design of therapeutic strategies. Thus, in the present
study, the cell communication mechanisms among UM were initially
elucidated using single-cell and TCGA data and key genes associated
with prognosis were identified. Although the present study has
reported notable findings, it also has limitations, particularly
the lack of in vivo verification and examination of detailed
molecular mechanisms. Further research is needed to elucidate the
molecular mechanisms of UM.
In summary, the results of the present study
revealed the communication between endothelial cells and other cell
types, elucidating the molecular mechanisms underlying UM. The
identification of key genes (SEC14L1, PLXND1, TPM4, GNAI2
and TBX2) in UM prompted further analyses. In vitro
assays confirmed the functional significance of PLXND1 and
GNAI2, with the knockdown of these genes decreasing cell
viability and delaying cell migration. We consider that these
findings will not only enhance the understanding of the
pathobiology of UM at the cellular level but will also serve to
reveal novel pathways and therapeutic targets in the treatment of
this mucosal cancer.
Supplementary Material
Supporting Data
Supporting Data
Acknowledgements
Not applicable.
Funding
The present study was sponsored by the National Natural Science
Foundation of China (grant nos. 82201147 and 82171020).
Availability of data and materials
The data generated in the present study may be
requested from the corresponding author.
Authors' contributions
NL contributed to investigation (bioinformatics
analysis), writing (original draft) and validation (bioinformatics
database). JW contributed to investigation (bioinformatics
database), writing (original draft) and formal analysis. YD
contributed to investigation (in vitro experiments) and
writing (original draft). YF, ZL and JG contributed to formal
analysis and validation (bioinformatics analysis). JC contributed
to conceptualization and supervision. JX contributed to
conceptualization, writing (review and editing), supervision and
funding acquirement. All authors read and approved to the final
version of the manuscript. NL, JW and JC confirm the authenticity
of all the raw data.
Ethics approval and consent to
participate
All experiments were performed in compliance with
the Association for Research in Vision and Ophthalmology, and the
experimental protocols were evaluated and approved by the Ethical
Committee of Eye and ENT Hospital, Fudan University (Shanghai,
China; approval no. ky2012-037).
Patient consent for publication
Not applicable.
Competing interests
The authors declare that they have no competing
interests.
References
|
1
|
McLaughlin CC, Wu XC, Jemal A, Martin HJ,
Roche LM and Chen VW: Incidence of noncutaneous melanomas in the
U.S. Cancer. 103:1000–1007. 2005. View Article : Google Scholar : PubMed/NCBI
|
|
2
|
Shields CL, Furuta M, Thangappan A, Nagori
S, Mashayekhi A, Lally DR, Kelly CC, Rudich DS, Nagori AV, Wakade
OA, et al: Metastasis of uveal melanoma millimeter-by-millimeter in
8033 consecutive eyes. Arch Ophthalmol. 127:989–998. 2009.
View Article : Google Scholar : PubMed/NCBI
|
|
3
|
Damato B: Ocular treatment of choroidal
melanoma in relation to the prevention of metastatic death-A
personal view. Prog Retin Eye Res. 66:187–199. 2018. View Article : Google Scholar : PubMed/NCBI
|
|
4
|
Damato B, Eleuteri A, Azzam FGT and
Coupland SE: Estimating prognosis for survival after treatment of
choroidal melanoma. Prog Retina Eye Res. 30:285–295. 2011.
View Article : Google Scholar : PubMed/NCBI
|
|
5
|
Sun S, Shi R, Xu L and Sun F:
Identification of heterogeneity and prognostic key genes associated
with uveal melanoma using single-cell RNA-sequencing technology.
Melanoma Res. 32:18–26. 2022. View Article : Google Scholar : PubMed/NCBI
|
|
6
|
Eskelin S, Pyrhönen S, Summanen P,
Hahka-Kemppinen M and Kivel T: Tumor doubling times in metastatic
malignant melanoma of the uvea: Tumor progression before and after
treatment. Ophthalmology. 107:1443–1449. 2000. View Article : Google Scholar : PubMed/NCBI
|
|
7
|
Hou C, Xiao L, Ren X, Tang F, Guo B, Zeng
W, Liang C and Yan N: Mutations of GNAQ, GNA11, SF3B1, EIF1AX,
PLCB4 and CYSLTR in uveal melanoma in Chinese patients. Ophthalmic
Res. 63:358–368. 2020. View Article : Google Scholar : PubMed/NCBI
|
|
8
|
Robertson AG, Shih J, Yau C, Gibb EA, Oba
J, Mungall KL, Hess JM, Uzunangelov V, Walter V, Danilova L, et al:
Integrative analysis identifies four molecular and clinical subsets
in uveal melanoma. Cancer Cell. 32:204–220. 2017. View Article : Google Scholar : PubMed/NCBI
|
|
9
|
Gupta MP, Lane AM, Deangelis MM, Mayne K,
Crabtree M, Gragoudas ES and Kim IK: Clinical characteristics of
uveal melanoma in patients with germline BAP1 mutations. JAMA
Ophthalmol. 133:881–887. 2015. View Article : Google Scholar : PubMed/NCBI
|
|
10
|
Jager MJ, Ly LV, El Filali M and Madigan
MC: Macrophages in uveal melanoma and in experimental ocular tumor
models: Friends or foes? Prog Retin Eye Res. 30:129–146. 2011.
View Article : Google Scholar : PubMed/NCBI
|
|
11
|
Rossi E, Schinzari G, Zizzari IG, Maiorano
BA, Pagliara MM, Sammarco MG, Fiorentino V, Petrone G, Cassano A,
Rindi G, et al: Immunological backbone of uveal melanoma: Is there
a rationale for immunotherapy? Cancers (Basel). 11:10552019.
View Article : Google Scholar : PubMed/NCBI
|
|
12
|
Zhang Y, Wang D, Peng M, Tang L, Ouyang J,
Xiong F, Guo C, Tang Y, Zhou Y, Liao Q, et al: Single-cell RNA
sequencing in cancer research. J Exp Clin Cancer Res. 40:812021.
View Article : Google Scholar : PubMed/NCBI
|
|
13
|
Pandiani C, Strub T, Nottet N, Cheli Y,
Gambi G, Bille K, Husser C, Dalmasso M, Béranger G, Lassalle S, et
al: Single-cell RNA sequencing reveals intratumoral heterogeneity
in primary uveal melanomas and identifies HES6 as a driver of the
metastatic disease. Cell Death Differ. 28:1990–2000. 2021.
View Article : Google Scholar : PubMed/NCBI
|
|
14
|
Durante MA, Rodriguez DA, Kurtenbach S,
Kuznetsov JN, Sanchez MI, Decatur CL, Snyder H, Feun LG,
Livingstone AS and Harbour JW: Single-cell analysis reveals new
evolutionary complexity in uveal melanoma. Nat Commun. 11:4962020.
View Article : Google Scholar : PubMed/NCBI
|
|
15
|
Schwager SC, Taufalele PV and
Reinhart-King CA: Cell-cell mechanical communication in cancer.
Cell Mol Bioeng. 12:1–14. 2019. View Article : Google Scholar : PubMed/NCBI
|
|
16
|
Bai H, Bosch JJ and Heindl LM: Current
management of uveal melanoma: A review. Clin Exp Ophthalmol.
51:484–494. 2023. View Article : Google Scholar : PubMed/NCBI
|
|
17
|
Kaštelan S, Antunica AG, Oresković LB,
Pelčić G, Kasun E and Hat K: Immunotherapy for uveal
melanoma-Current knowledge and perspectives. Curr Med Chem.
27:1350–1366. 2020. View Article : Google Scholar : PubMed/NCBI
|
|
18
|
Oliva M, Rullan AJ and Piulats JM: Uveal
melanoma as a target for immune-therapy. Ann Transl Med. 4:1722016.
View Article : Google Scholar : PubMed/NCBI
|
|
19
|
Tomczak K, Czerwińska P and Wiznerowicz M:
The cancer genome atlas (TCGA): An immeasurable source of
knowledge. Contemp Oncol (Pozn). 19:A68–A77. 2015.PubMed/NCBI
|
|
20
|
Weinstein JN, Collisson EA, Mills GB, Shaw
KR, Ozenberger BA, Ellrott K, Shmulevich I, Sander C and Stuart JM;
Cancer Genome Atlas Research Network, : The cancer genome atlas
pan-cancer analysis project. Nat Genet. 45:1113–1120. 2013.
View Article : Google Scholar : PubMed/NCBI
|
|
21
|
Davis S and Meltzer PS: GEOquery: A bridge
between the gene expression omnibus (GEO) and bioconductor.
Bioinformatics. 23:1846–1847. 2007. View Article : Google Scholar : PubMed/NCBI
|
|
22
|
Hao Y, Hao S, Andersen-Nissen E, Mauck WM
III, Zheng S, Butler MJ, Lee A, Wilk AJ, Darby C, Zager M, et al:
Integrated analysis of multimodal single-cell data. Cell.
184:3573–3587.e29. 2021. View Article : Google Scholar : PubMed/NCBI
|
|
23
|
Garcia-Alonso L, Lorenzi V, Mazzeo CI,
Alves-Lopes JP, Roberts K, Sancho-Serra C, Engelbert J, Marečková
M, Gruhn WH, Botting RA, et al: Single-cell roadmap of human
gonadal development. Nature. 607:540–547. 2022. View Article : Google Scholar : PubMed/NCBI
|
|
24
|
Efremova M, Vento-Tormo M, Teichmann SA
and Vento-Tormo R: CellPhoneDB: Inferring cell-cell communication
from combined expression of multi-subunit ligand-receptor
complexes. Nat Protoc. 15:1484–1506. 2020. View Article : Google Scholar : PubMed/NCBI
|
|
25
|
Yu G, Wang LG, Han Y and He QY:
ClusterProfiler: An R package for comparing biological themes among
gene clusters. OMICS. 16:284–287. 2012. View Article : Google Scholar : PubMed/NCBI
|
|
26
|
Shannon P, Markiel A, Ozier O, Baliga NS,
Wang JT, Ramage D, Amin N, Schwikowski B and Ideker T: Cytoscape: A
software environment for integrated models of biomolecular
interaction networks. Genome Res. 13:2498–2504. 2003. View Article : Google Scholar : PubMed/NCBI
|
|
27
|
Ishwaran H, Kogalur UB, Blackstone EH and
Lauer MS: Random survival forests. 2008. View Article : Google Scholar
|
|
28
|
Newman AM, Steen CB, Liu CL, Gentles AJ,
Chaudhuri AA, Scherer F, Khodadoust MS, Esfahani MS, Luca BA,
Steiner D, et al: Determining cell type abundance and expression
from bulk tissues with digital cytometry. Nat Biotechnol.
37:773–782. 2019. View Article : Google Scholar : PubMed/NCBI
|
|
29
|
Li H, Han D, Hou Y, Chen H and Chen Z:
Statistical inference methods for two crossing survival curves: A
comparison of methods. PLoS One. 10:e01167742015. View Article : Google Scholar : PubMed/NCBI
|
|
30
|
Livak KJ and Schmittgen TD: Analysis of
relative gene expression data using real-time quantitative PCR and
the 2(−Delta Delta C(T)) Method. Methods. 25:402–408. 2001.
View Article : Google Scholar : PubMed/NCBI
|
|
31
|
Neophytou CM, Panagi M, Stylianopoulos T
and Papageorgis P: The role of tumor microenvironment in cancer
metastasis: Molecular mechanisms and therapeutic opportunities.
Cancers (Basel). 13:20532021. View Article : Google Scholar : PubMed/NCBI
|
|
32
|
García-Mulero S, Alonso MH, Del Carpio LP,
Sanz-Pamplona R and Piulats JM: Additive role of immune system
infiltration and angiogenesis in uveal melanoma progression. Int J
Mol Sci. 22:26692021. View Article : Google Scholar : PubMed/NCBI
|
|
33
|
Voigt AP, Mullin NK, Stone EM, Tucker BA,
Scheetz TE and Mullins RF: Single-cell RNA sequencing in vision
research: Insights into human retinal health and disease. Prog
Retin Eye Res. 83:1009342021. View Article : Google Scholar : PubMed/NCBI
|
|
34
|
Castet F, Garcia-Mulero S, Sanz-Pamplona
R, Cuellar A, Casanovas O, Caminal JM and Piulats JM: Uveal
melanoma, angiogenesis and immunotherapy, is there any hope?
Cancers (Basel). 11:8342019. View Article : Google Scholar : PubMed/NCBI
|
|
35
|
Notting IC, Missotten GS, Sijmons B,
Boonman ZF, Keunen JE and van der Pluijm G: Angiogenic profile of
uveal melanoma. Curr Eye Res. 31:775–785. 2006. View Article : Google Scholar : PubMed/NCBI
|
|
36
|
Potente M and Mäkinen T: Vascular
heterogeneity and specialization in development and disease. Nat
Rev Mol Cell Biol. 18:477–494. 2017. View Article : Google Scholar : PubMed/NCBI
|
|
37
|
Hanahan D and Weinberg RA: Hallmarks of
cancer: The next generation. Cell. 144:646–674. 2011. View Article : Google Scholar : PubMed/NCBI
|
|
38
|
Krüger-Genge A, Blocki A, Franke RP and
Jung F: Vascular endothelial cell biology: An update. Int J Mol
Sci. 20:44112019. View Article : Google Scholar : PubMed/NCBI
|
|
39
|
Thiery JP, Acloque H, Huang RY and Nieto
MA: Epithelial-mesenchymal transitions in development and disease.
Cell. 139:871–890. 2009. View Article : Google Scholar : PubMed/NCBI
|
|
40
|
Nieto MA: The ins and outs of the
epithelial to mesenchymal transition in health and disease. Annu
Rev Cell Dev Biol. 27:347–376. 2011. View Article : Google Scholar : PubMed/NCBI
|
|
41
|
Kimura C, Hayashi M, Mizuno Y and Oike M:
Endothelium-dependent epithelial-mesenchymal transition of tumor
cells: Exclusive roles of transforming growth factor β1 and β2.
Biochim Biophys Acta. 1830:4470–4481. 2013. View Article : Google Scholar : PubMed/NCBI
|
|
42
|
Shenoy AK and Lu J: Cancer cells remodel
themselves and vasculature to overcome the endothelial barrier.
Cancer Lett. 380:534–544. 2016. View Article : Google Scholar : PubMed/NCBI
|
|
43
|
Sonbul SN, Aleskandarany MA, Kurozumi S,
Joseph C, Toss MS, Diez-Rodriguez M, Diez-Rodriguez M, Nolan CC,
Mukherjee A, Martin S, et al: Saccharomyces cerevisiae-like 1
(SEC14L1) is a prognostic factor in breast cancer associated with
lymphovascular invasion. Mod Pathol. 31:1675–1682. 2018. View Article : Google Scholar : PubMed/NCBI
|
|
44
|
Agell L, Hernández S, Nonell L, Lorenzo M,
Puigdecanet E, de Muga S, Juanpere N, Bermudo R, Fernández PL,
Lorente JA, et al: A 12-gene expression signature is associated
with aggressive histological in prostate cancer: SEC14L1 and TCEB1
genes are potential markers of progression. Am J Pathol.
181:1585–1594. 2012. View Article : Google Scholar : PubMed/NCBI
|
|
45
|
Guo Q, Zhao L, Yan N, Li Y, Guo C, Dang S,
Shen X, Han J and Luo Y: Integrated pan-cancer analysis and
experimental verification of the roles of tropomyosin 4 in gastric
cancer. Front Immunol. 14:11480562023. View Article : Google Scholar : PubMed/NCBI
|
|
46
|
Lu J, Li XP, Dong Q, Kung HF and He ML:
TBX2 and TBX3: The special value for anticancer drug targets.
Biochim Biophys Acta. 1806:268–274. 2010.PubMed/NCBI
|
|
47
|
Fatemi Langroudi SR, Zeinaly M and Ajamian
F: TBX21, the Master regulator of the type 1 immune response,
overexpresses in the leukocytes of peripheral blood in patients
with late-onset Alzheimer's disease. Immun Ageing. 20:592023.
View Article : Google Scholar : PubMed/NCBI
|
|
48
|
Hagihara K, Haraguchi N, Nishimura J,
Yasueda A, Fujino S, Ogino T, Takahashi H, Miyoshi N, Uemura M,
Matsuda C, et al: PLXND1/SEMA3E promotes epithelial-mesenchymal
transition partly via the PI3k/AKT-signaling pathway and induces
heterogenity in colorectal cancer. Ann Surg Oncol. 29:7435–7445.
2022. View Article : Google Scholar : PubMed/NCBI
|
|
49
|
Jurcak NR, Rucki AA, Muth S, Thompson E,
Sharma R, Ding D, Zhu Q, Eshleman JR, Anders RA, Jaffeeet EM, et
al: Axon guidance molecules promote perineural invasion and
metastasis of orthotopic pancreatic tumors in mice.
Gastroenterology. 157:838–850.e6. 2019. View Article : Google Scholar : PubMed/NCBI
|
|
50
|
Sun M, Chen Z, Song Y, Zhang B, Yang J and
Tan H: PLXND1-mediated calcium dyshomeostasis impairs endocardial
endothelial autophagy in atrial fibrillation. Front Physiol.
13:9604802022. View Article : Google Scholar : PubMed/NCBI
|
|
51
|
Mehta V, Pang KL, Rozbesky D, Nather K,
Keen A, Lachowski D, Kong Y, Karia D, Ameismeier M, Huang J, et al:
The guidance receptor plexin D1 is a mechanosensor in endothelial
cells. Nature. 578:290–295. 2020. View Article : Google Scholar : PubMed/NCBI
|
|
52
|
Silva-Rodríguez P, Fernández-Díaz D, Bande
M, Pardo M, Loidi L and Blanco-Teijeiro MJ: GNAQ and
GNA11 Genes: A Comprehensive review on oncogenesis,
prognosis and therapeutic opportunities in uveal melanoma. Cancers
(Basel). 14:30662022. View Article : Google Scholar : PubMed/NCBI
|
|
53
|
Gilman AG: G proteins: Transducers of
receptor-generated signals. Annu Rev Biochem. 56:615–649. 1987.
View Article : Google Scholar : PubMed/NCBI
|
|
54
|
Rodbell M: Nobel Lecture. Signal
transduction: Evolution of an idea. Biosci Rep. 15:117–133. 1995.
View Article : Google Scholar : PubMed/NCBI
|
|
55
|
Ha JH, Jayaraman M, Yan M, Dhanasekaran P,
Isidoro C, Song YS and Dhanasekaran DN: GNAi2/gip2-regulated
transcriptome and its therapeutic significance in ovarian cancer.
Biomolecules. 11:12112021. View Article : Google Scholar : PubMed/NCBI
|
|
56
|
Raymond JR Jr, Appleton KM, Pierce JY and
Peterson YK: Suppression of GNAI2 message in ovarian cancer. J
Ovarian Res. 7:62014. View Article : Google Scholar : PubMed/NCBI
|
|
57
|
Lapitz A, Azkargorta M, Milkiewicz P,
Olaizola P, Zhuravleva E, Grimsrud MM, Schramm C, Arbelaiz A,
O'Rourke CJ, Casta AL, et al: Liquid biopsy-based protein
biomarkers for risk prediction, early diagnosis, and
prognostication of cholangiocarcinoma. J Hepatol. 79:93–108. 2023.
View Article : Google Scholar : PubMed/NCBI
|
|
58
|
Polak ME, Borthwick NJ, Johnson P,
Hungerford JL, Higgins B, Di Palma S, JagerM J and Cree IA:
Presence and phenotype of dendritic cells in uveal melanoma. Br J
Ophthalmol. 91:971–976. 2007. View Article : Google Scholar : PubMed/NCBI
|
|
59
|
de Waard-Siebinga I, Hilders CG, Hansen
BE, van Delft JL and Jager MJ: HLA expression and
tumor-infiltrating immune cells in uveal melanoma. Graefes Arch
Clin Exp Ophthalmol. 234:34–42. 1996. View Article : Google Scholar : PubMed/NCBI
|
|
60
|
Wang W, Zhao H and Wang S: Identification
of a novel immune-related gene signature for prognosis and the
tumor microenvironment in patients with uveal melanoma combining
single-cell and bulk sequencing data. Front Immunol.
14:10990712023. View Article : Google Scholar : PubMed/NCBI
|
|
61
|
Seth R, Messersmith H, Kaur V, Kirkwood
JM, Kudchadkar R, McQuade JL, Provenzano A, Swami U, Weber J,
Alluri KC, et al: Systemic therapy for melanoma: ASCO Guideline. J
Clin Oncol. 38:3947–3970. 2020. View Article : Google Scholar : PubMed/NCBI
|
|
62
|
Qi Y, Cui Q, Zhang W, Yao R, Xu D and
Zhang F: Long non-coding RNA GAS5 targeting microRNA-21 to suppress
the invasion and epithelial-mesenchymal transition of uveal
melanoma. Cancer Manag Res. 12:12259–12267. 2020. View Article : Google Scholar : PubMed/NCBI
|
|
63
|
Tay Y, Rinn J and Pandolfi PP: The
multilayered complexity of ceRNA crosstalk and competition. Nature.
505:344–352. 2014. View Article : Google Scholar : PubMed/NCBI
|
|
64
|
Barbagallo C, Di Maria A, Alecci A,
Barbagallo D, Alaimo S, Colarossi L, Ferro A, Di Pietro C, Purrello
M, Pulvirenti A and Ragusa M: VECTOR: An integrated correlation
network database for the identification of CeRNA axes in uveal
melanoma. Genes (Basel). 12:10042021. View Article : Google Scholar : PubMed/NCBI
|