Introduction
Thyroid cancer (THCA) is the most common endocrine
malignancy of the head and neck globally, with a steadily
increasing global incidence. It accounts for ~1% of all systemic
malignant tumors (1,2). THCA comprises four pathological types:
Papillary carcinoma, follicular carcinoma, undifferentiated
carcinoma and medullary carcinoma (3,4).
Papillary carcinoma, the most prevalent type, is characterized by
low malignancy and a favorable prognosis (5). In the early stages, THCA frequently
presents no noticeable symptoms or signs (6). However, in the advanced stages,
hoarseness, dyspnea and compression of the sympathetic nerve can
induce Horner syndrome. The etiology of THCA is not yet fully
understood, but it is presently believed to result from the
synergistic interaction of several carcinogenic factors, such as
dietary practices, obesity and radiation exposure (7).
Most patients with THCA have a favorable outcome due
to modern comprehensive treatments that include surgery, the use of
radioactive iodine (RAI) thyroid ablation and thyroid stimulating
hormone (TSH) suppression (8).
Nevertheless, a considerable number of patients exhibit
insensitivity to RAI ablation and TSH suppression (9) and there is still a lack of standard
treatment for highly aggressive and poorly differentiated tumors,
which often progress to advanced tumors (10).
With the advancing comprehension of the tumor
microenvironment (TME), immunotherapy has attracted increasing
attention and demonstrated remarkable efficacy in combating several
cancers. The programmed cell death protein 1/programmed
death-ligand (PD-L)1 inhibitor pembrolizumab, known to improve the
overall survival of patients with THCA, especially those with
increased PD-L1 receptor expression, has been approved as a
first-line treatment for THCA (11–13).
Moreover, patients with THCA, particularly those with
undifferentiated carcinoma, exhibit a dismal 5-year survival rate
(14). Hence, there exists a
pressing necessity to thoroughly investigate the intricacies of the
TME and discover novel molecular targeted therapies and
immunotherapies for addressing these aggressive tumors.
Several studies have reported gene mutations in
THCA, with BRAF V600E being the most prevalent mutation, occurring
in up to 58.5% of cases (15,16).
Mutations in RAS and P53 genes are also frequently observed in THCA
(17). Furthermore, in recent
years, the advancement of next-generation high-throughput
sequencing technologies has led to the accumulation of extensive
genetic data and clinical information within several public
databases, including the Cancer Genome Atlas (TCGA) (18,19).
This sets the groundwork for deepening the understanding of the
molecular mechanisms of cancer and the biological roles of key
genes through bioinformatics techniques and experimental
validation.
Fibronectin 1 (FN1) encodes a glycoprotein present
in soluble dimeric form in plasma and as dimers or multimers on the
cell surface and extracellular matrix (ECM). FN1 serves a key role
in cell adhesion, growth, differentiation and migration, including
in wound healing and embryonic development, host defense, blood
clotting and metastasis (20). FN1
is deposited into the ECM of tumor cells and then forms
fibronectin-fibronectin complexes, which have been reported to
promote tumor angiogenesis, proliferation and metastasis (21). FN1 has also been reported to promote
cell migration in esophageal squamous cell carcinoma, oral squamous
cell carcinoma, nasopharyngeal carcinoma, colorectal cancer,
ovarian cancer and renal cell carcinoma (22–26).
Moreover, previous studies have reported that FN1 is involved in
natural killer (NK) cell-produced interferon-γ mediated by the
NKp46 receptor, thereby controlling tumor architecture and
metastasis (27). However, the
relationship between FN1 expression and clinical factors and
prognosis in THCA has not been previously reported, to the best of
our knowledge, and so it is necessary to validate and elucidate the
role of FN1 in THCA. Therefore, the present study aimed to identify
potential gene biomarkers, offering new insights into therapeutic
targets for THCA.
Materials and methods
Data acquisition from the TCGA,
Genotype-Tissue Expression (GTEx) and Gene Expression Omnibus (GEO)
databases
Gene expression data, clinical data and survival
information for THCA and normal tissues were retrieved from the
Genomics Data Commons TCGA THCA and the GTEx databases (https://xenabrowser.net/datapages/). The
retrieved clinical data is presented in Table SI. In total, 509 samples of THCA
and 337 samples of normal thyroid tissues were obtained from the
TCGA and GTEx databases. The validation cohorts, consisting of
complete expression profile data (GSE33630 and GSE54958), were
obtained from the GEO database (https://www.ncbi.nlm.nih.gov/gds).
Identification and analysis of
differentially expressed genes (DEGs)
Bioinformatics analysis was performed using RStudio
software (Posit Software, PBC; version 1.4.1103) and the
Bioconductor suite of packages (version 3.18; http://bioconductor.org/install/). The gene
expression data was normalized and DEGs were determined using the R
limma package (version 3.58.2) (https://www.bioconductor.org/packages/release/bioc/html/limma.html)
(28,29). Significant DEGs were selected based
on the criteria of P<0.05 and log fold change (FC)>1
(30,31).
Weighted gene co-expression network
analysis (WGCNA)
The analysis of gene co-expression networks was
performed using the WGCNA R package (version 1.72.3; http://cran.r-project.org/web/packages/WGCNA/index.html)
(32). The scale-free and average
connectivity analyses were executed on modules with diverse power
values using the PickSoftThreshold function, setting the soft
threshold power to 8. Following this, the intramodular connectivity
among genes displaying comparable expression profiles was
calculated using the topological overlap dissimilarity measure.
Finally, the dynamic hybrid cutting method was used to construct a
hierarchical clustering tree and to detect co-expressed gene
modules.
Construction of protein-protein
interaction (PPI) network and identification of hub genes
The STRING database (http://www.string-db.org/) was used to construct a PPI
network of candidate genes (33).
Genes meeting the minimum confidence score of ≥0.5 for differential
expression were selected to construct a comprehensive network
model, which was then visualized using Cytoscape software (version
3.10; http://cytoscape.org/). Using the
Cytoscape plugin cytoHubba, the top five key genes were predicted
based on the network maximal clique centrality algorithm.
Functional and pathway enrichment
analyses
Gene Ontology (GO) and Kyoto Encyclopedia of Genes
and Genomes (KEGG) enrichment analyses were performed on the
candidate hub genes of THCA using the R packages clusterProfiler
(version 3.42.2; http://www.bioconductor.org/packages/release/bioc/html/clusterProfiler.html)
(34). These analyses aimed to
assess the biological functions and key signaling pathways
associated with the identified hub genes. The GO enrichment
analysis was comprehensively performed across three domains:
Biological processes (BP), cellular components (CC) and molecular
functions (MF) (35). Gene set
enrichment analysis (GSEA) was performed using the R package GSEA
(version 4.1.2; http://bioconductor.org/packages/release/bioc/html/GSEABase.html),
with a significance threshold set at a false discovery rate of
<0.25 and P<0.05.
Immunoinfiltration analysis
The analysis of immune cell infiltration was
performed using the single-sample GSEA algorithm (36). A total of 28 different types of gene
sets that characterize immune cells were compared and the Gene Set
Variation Analysis R package (version 3.42.2; http://www.bioconductor.org/packages/release/bioc/html/GSVA.html)
was used to transform sample gene expression values into enrichment
fractions, thereby deriving the relative abundance of immune cells
(37).
Patient and tissue samples
The study procedures were approved by the Ethics
Committee of the Second Affiliated Hospital of Zhejiang University
School of Medicine (Hangzhou, China) and the present study adhered
to the ethical principles outlined in The Declaration of Helsinki.
The inclusion criteria of the study consisted of the following: i)
Presence of a primary thyroid tumor; ii) histopathological
diagnosis of THCA; and iii) availability of complete clinical
records. Conversely, the exclusion criteria were as follows: i)
Presence of autoimmune disorders or infectious diseases; ii)
presence of other malignant tumors; and iii) history of prior
immunosuppressive treatments. Patient follow-up started at August
2020 and continued until November 2023, where the conclusive
determination of survival or death marked the endpoint for overall
survival. A total of 103 patients with THCA, specifically 32 with
papillary carcinoma, 30 with follicular carcinoma, 35 with
medullary carcinoma and 6 with undifferentiated carcinoma, were
selected for the present study. These patients had previously
undergone surgical resection at the Second Affiliated Hospital,
School of Medicine, Zhejiang University. The medullary and
undifferentiated carcinoma samples of THCA and their corresponding
medical information were collected. Furthermore, 103 THCA tissues
and their corresponding adjacent paracancerous tissues were
obtained from the Department of Pathology, Second Affiliated
Hospital, School of Medicine, Zhejiang University. These tissues
were the same as those collected from the 103 patients enrolled in
the present study.
Reverse transcription
(RT)-quantitative (q)PCR
Total RNA was isolated utilizing the
TRIzol™ reagent (Invitrogen™; Thermo Fisher
Scientific, Inc.). The synthesis of complementary DNA (cDNA) was
performed using the PrimeScript™ RT kit (cat. no.
RR055A; Takara Biotechnology, Co., Ltd.). Reverse transcription was
performed at 37°C for 15 min, followed by heating at 85°C for 5
sec. Quantitative PCR was performed using Sybr Green fluorophore
(Vazyme; cat. no. Q311-02/03). The PCR protocol involved initial
denaturation at 95°C for 15 sec, followed by 40 cycles of 95°C for
15 sec and 60°C for 60 sec. Gene expression changes were assessed
using the 2−ΔΔCq method. The primers were synthesized by
Hangzhou Qingke Biotechnology Co., Ltd. and their sequences are
listed in Table SII.
Immunohistochemistry
The tissue was fixed overnight in a 4%
paraformaldehyde solution at room temperature. Following fixation,
the sample underwent dehydration through a series of ethanol
solutions, followed by treatment with xylene for tissue
transparency. Subsequently, the tissue was immersed in paraffin at
65°C and embedded in paraffin wax. Thin sections (2.5 µm thick)
were sliced from the paraffin block and mounted onto glass slides.
Tissue sections mounted on glass microscope slides were
deparaffinized in xylene and rehydrated in graded alcohols.
Subsequently, the tissue sections were boiled for 15 min in 10 mM
citric acid buffer (pH 6.0) for antigen retrieval. After the
sections were cooled to room temperature, they were incubated with
3% H2O2 for 15 min at 37°C to block
endogenous peroxidase activity. The sections were then blocked with
5% goat serum (Scientific Phygene®; Fuzhou Phygene
Biotechnology Co., Ltd.) for 45 min at room temperature, and
incubated with FN1 primary antibodies (1:1,000; Abcam; cat. no.
ab2413) overnight at 4°C. Subsequently, the sections were incubated
with, including goat anti-rabbit IgG secondary antibodies (1:1,000;
Abcam; cat. no. ab150077) for 30 min at room temperature. Finally,
the substrate color was developed using a diaminobenzidine
substrate kit (Abcam; cat. no. ab64238), and the sections were
counterstained with hematoxylin for 30 sec at room temperature.
Images were captured using a light microscope (Nikon Corporation)
and the immunohistochemistry results were quantified using ImageJ
software (version 1.8.0; National Institutes of Health).
Clinical statistical analysis of
prognosis and assessment of FN1 expression
The progression-free interval (PFI) of the
prognostic parameters were assessed using patient data from TCGA
within the clinical interpretation module of the Xiantao platform
(https://www.xiantaozi.com/). The median
value served as the threshold to categorize the FN1 gene expression
groups into low and high categories.
Statistical analysis
In the analysis of clinical variables, age, T stage,
N stage, M stage, histological type, primary neoplasm focus type,
and FN1 expression were chosen for univariate Cox regression
analysis. Kaplan-Meier methods were employed to assess the
progression-free interval (PFI) of these prognostic factors. The
association between clinical-pathological characteristics and FN1
gene expression was assessed using the Wilcoxon rank-sum test in
conjunction with logistic regression. Furthermore, a multivariate
Cox regression model was used to evaluate the impact of FN1 gene
expression on survival probability and other clinical variables.
The Wilcoxon rank-sum test was used for comparing two groups and
one-way analysis of variance (ANOVA) was used to compare multiple
groups, followed by Tukey's post hoc test for pairwise comparisons.
Correlation analyses were performed using Spearman's rank
correlation coefficient and distance correlation methodologies.
Fisher's exact test or the χ2 test were used to assess
statistical significance for categorical variables between two
groups. Statistical P-values were two-sided, with P<0.05
considered to indicate a statistically significant difference. Data
processing was performed using R software, (version 4.2.0;
http://www.r-project.org/).
Results
Genomic differences between normal
thyroid and THCA tissues
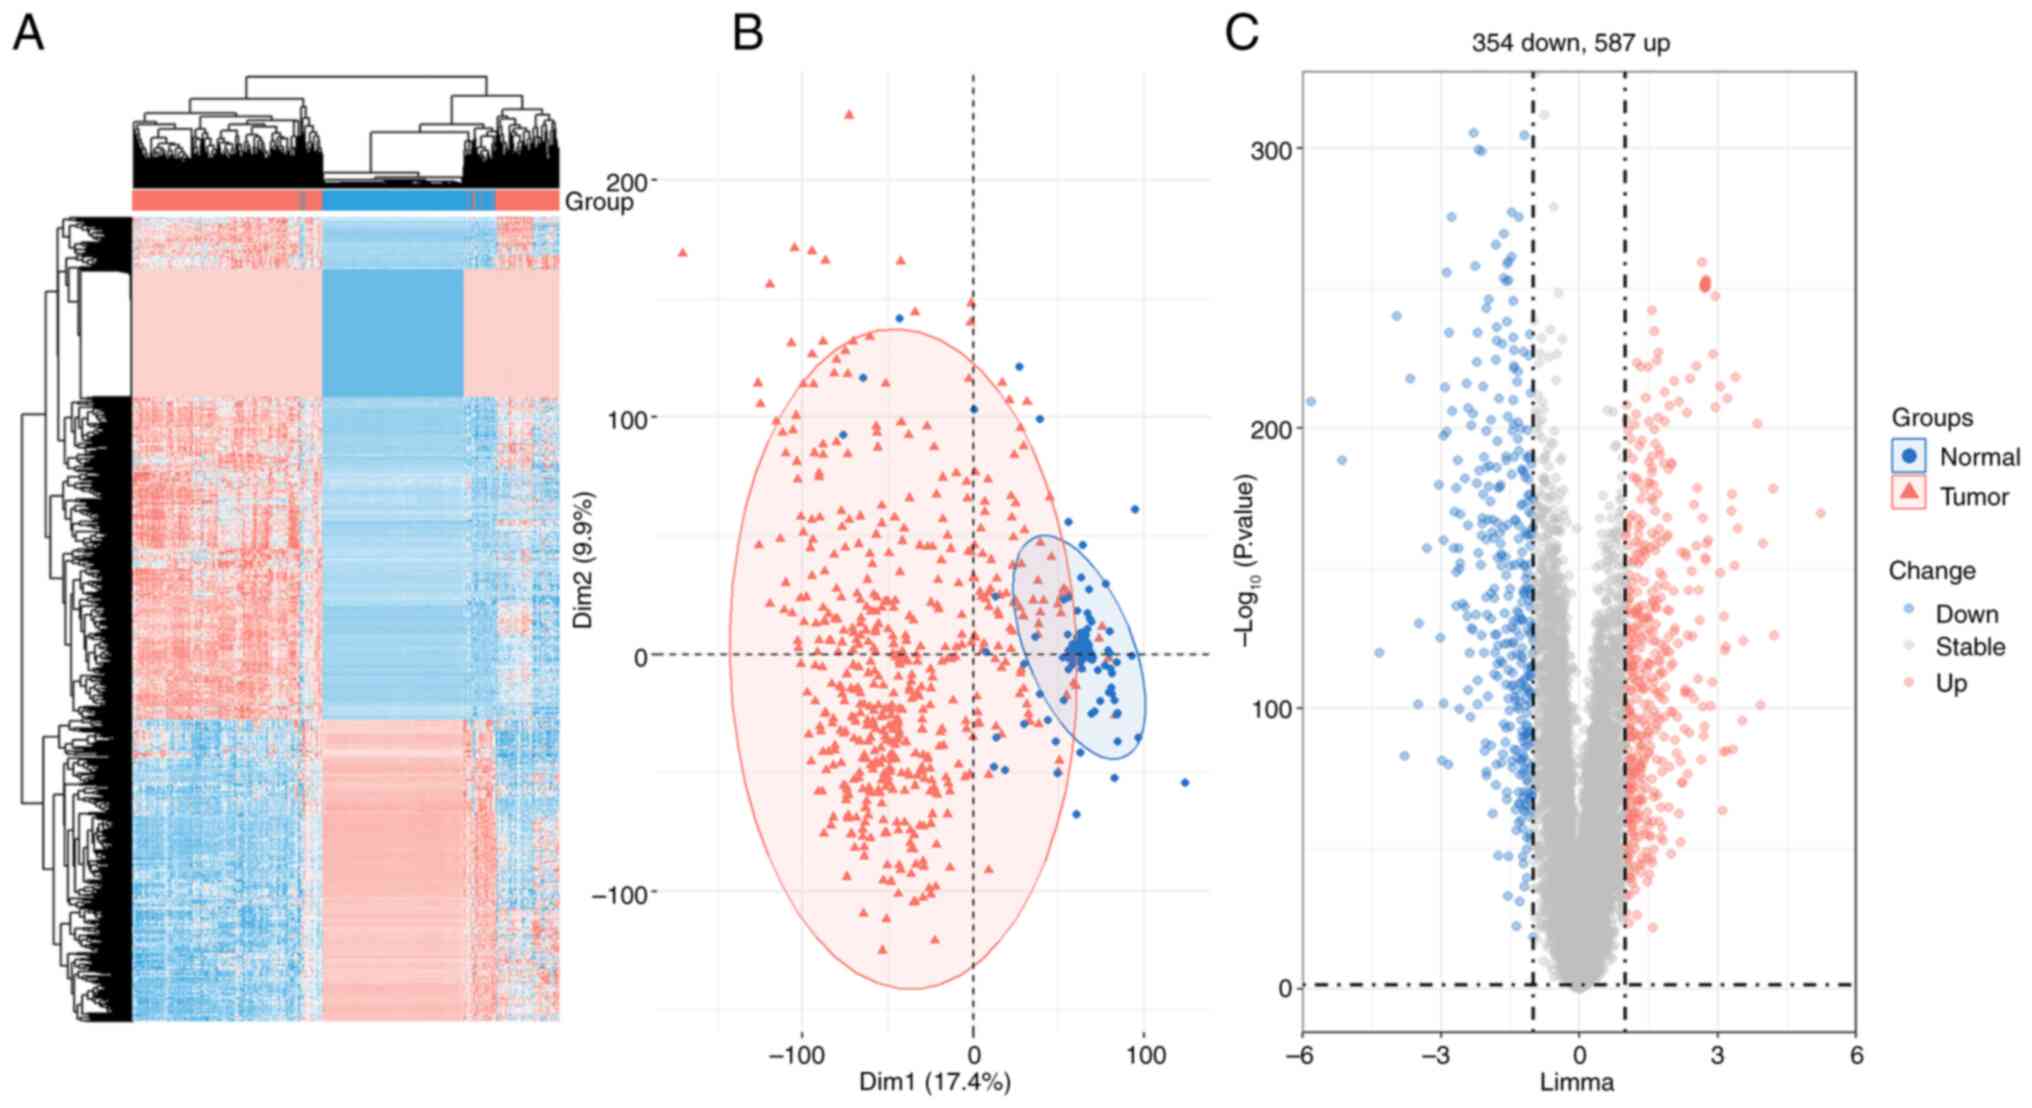
Based on 337 normal samples and 509 tumor samples
from the TCGA and GTEx datasets, systematic clustering demonstrated
the genomic differences between the normal tissues and THCA tissues
(Fig. 1A). Principal component
analysis (PCA) revealed a marked separation between the control
group and the tumor group, but the similarity between the two
groups was small (Fig. 1B). The
volcano map of DEGs included 587 upregulated genes and 354
downregulated genes in THCA tissues compared with paired normal
tissues (Fig. 1C). 941 genes in
THCA samples were revealed to have significantly different
expressions in comparison with normal samples (P<0.05 and logFC
>1) (Fig. 1C).
Identification of THCA-related modules
by WGCNA
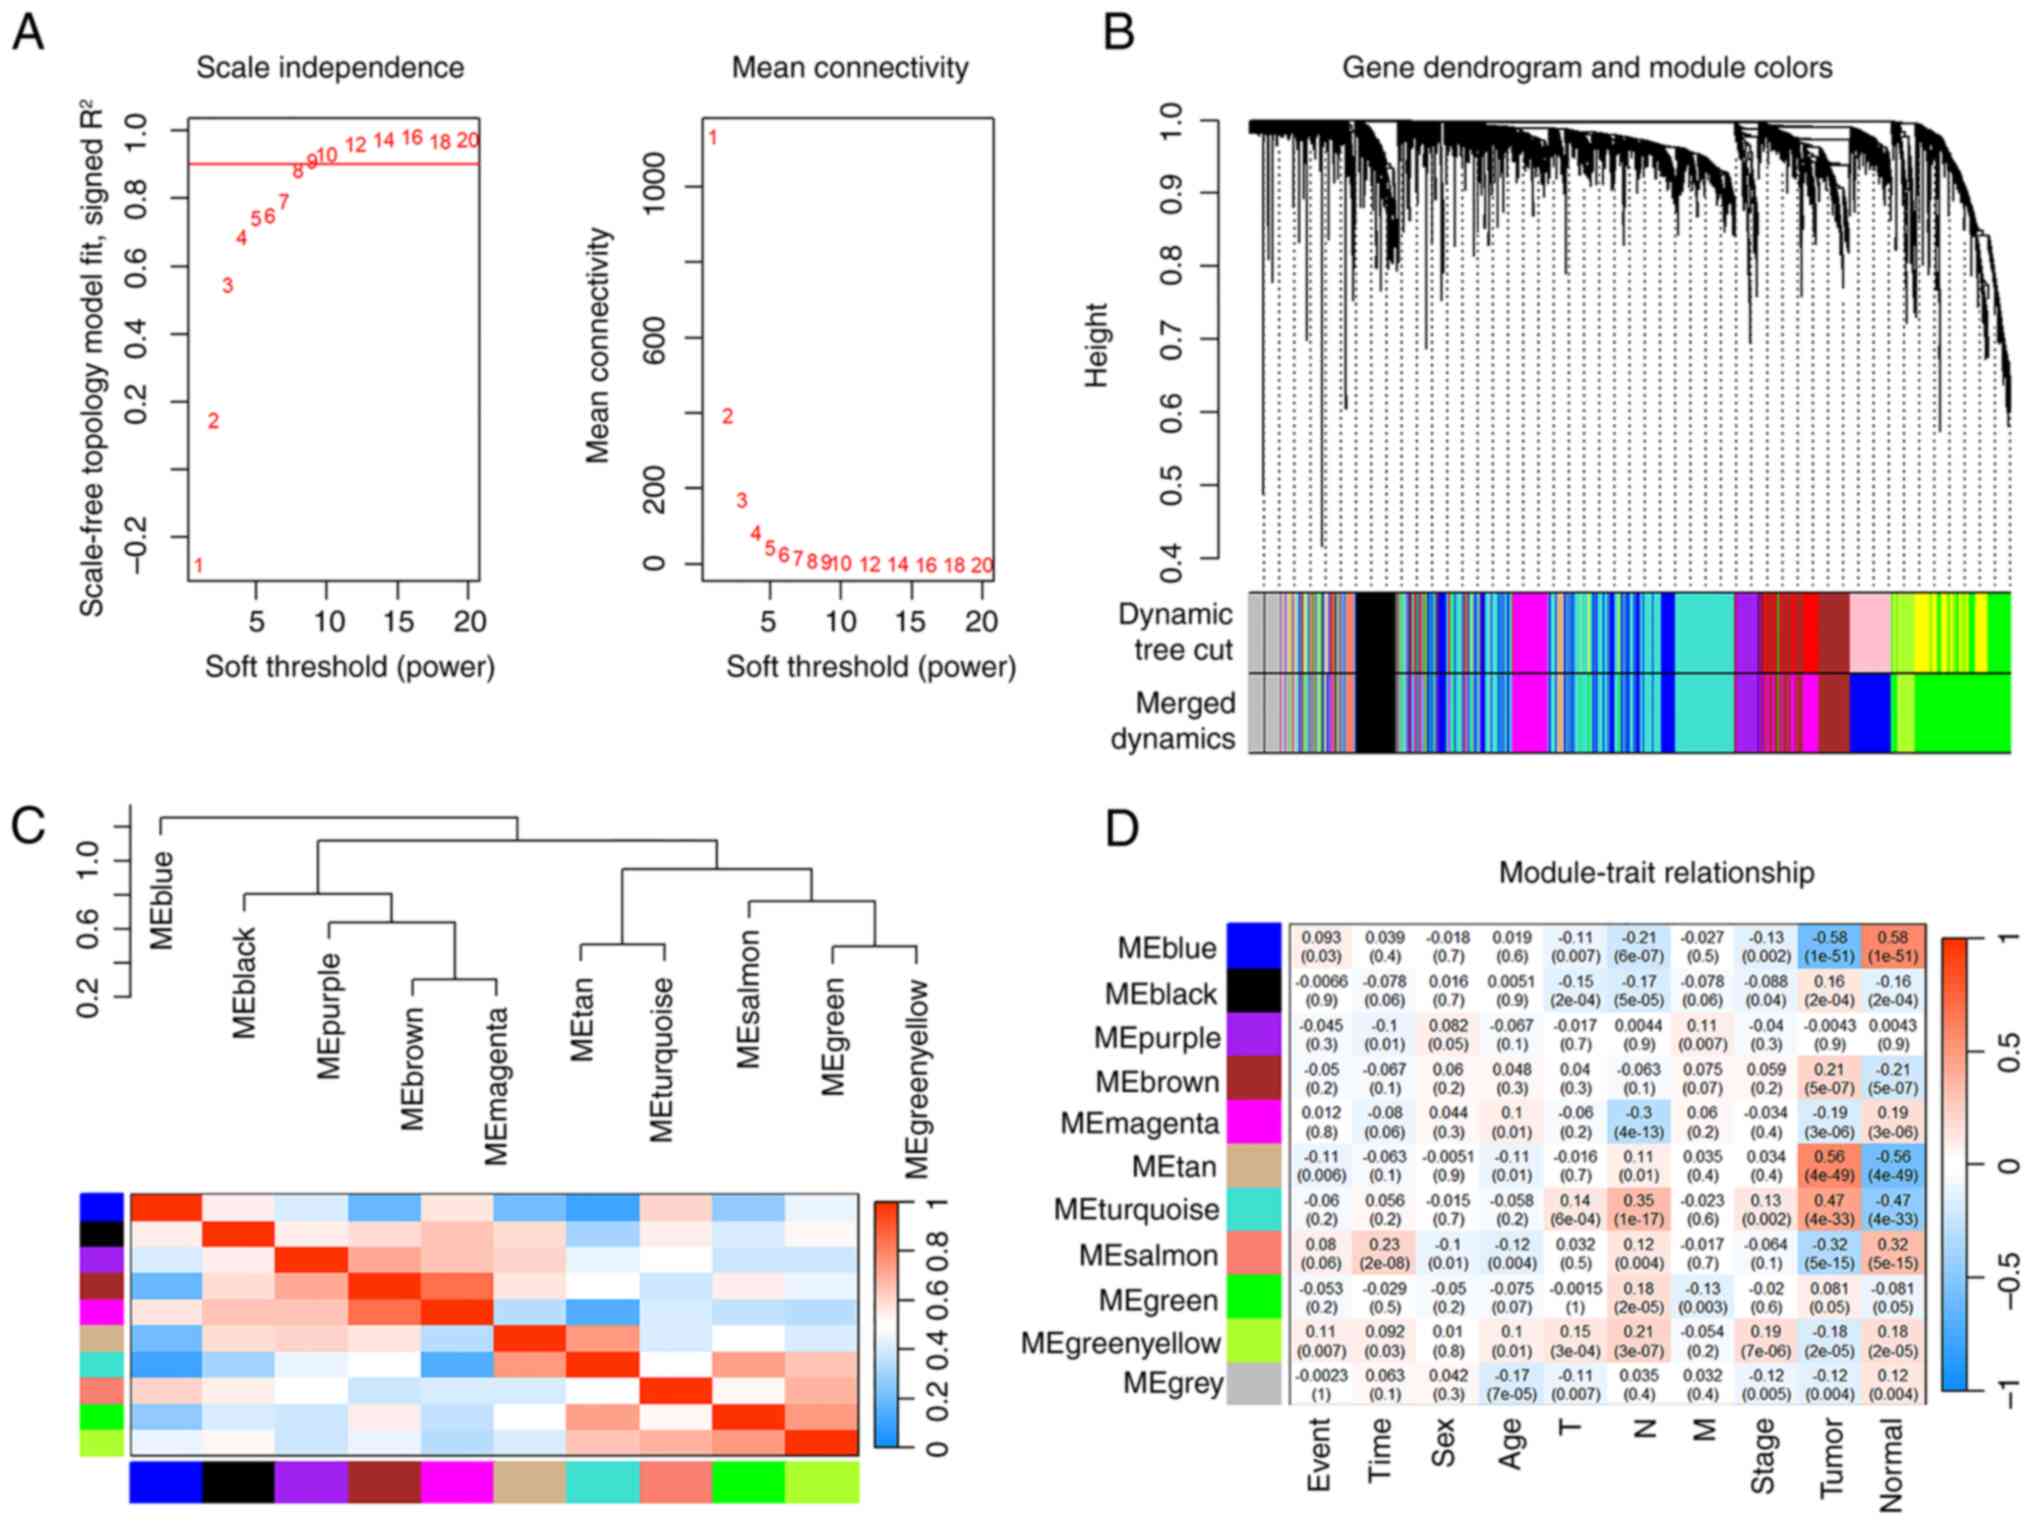
Genes within a common functional group exhibit
similar expression patterns and share expression regulation
mechanisms (38). Therefore, a
weighted gene co-expression network was created using the
RNA-sequencing count data from the TCGA-THCA and GTEx datasets. The
power of β=8 was chosen for soft-thresholding (Fig. 2A). Ultimately, 11 modules were
selected using average hierarchical clustering and dynamic tree
clipping methods (Fig. 2B). The
correlations between the 11 modules is demonstrated in Fig. 2C. Moreover, modular trait diagrams
were created to analyze the correlation between gene modules and
clinical features in THCA (Fig.
2D). The two modules with the highest correlation with tumors
were MEtan and MEturquoise in TCGA-THCA (Fig. 2D).
Intersection of DEGs and co-expression
module genes (CEMGs)
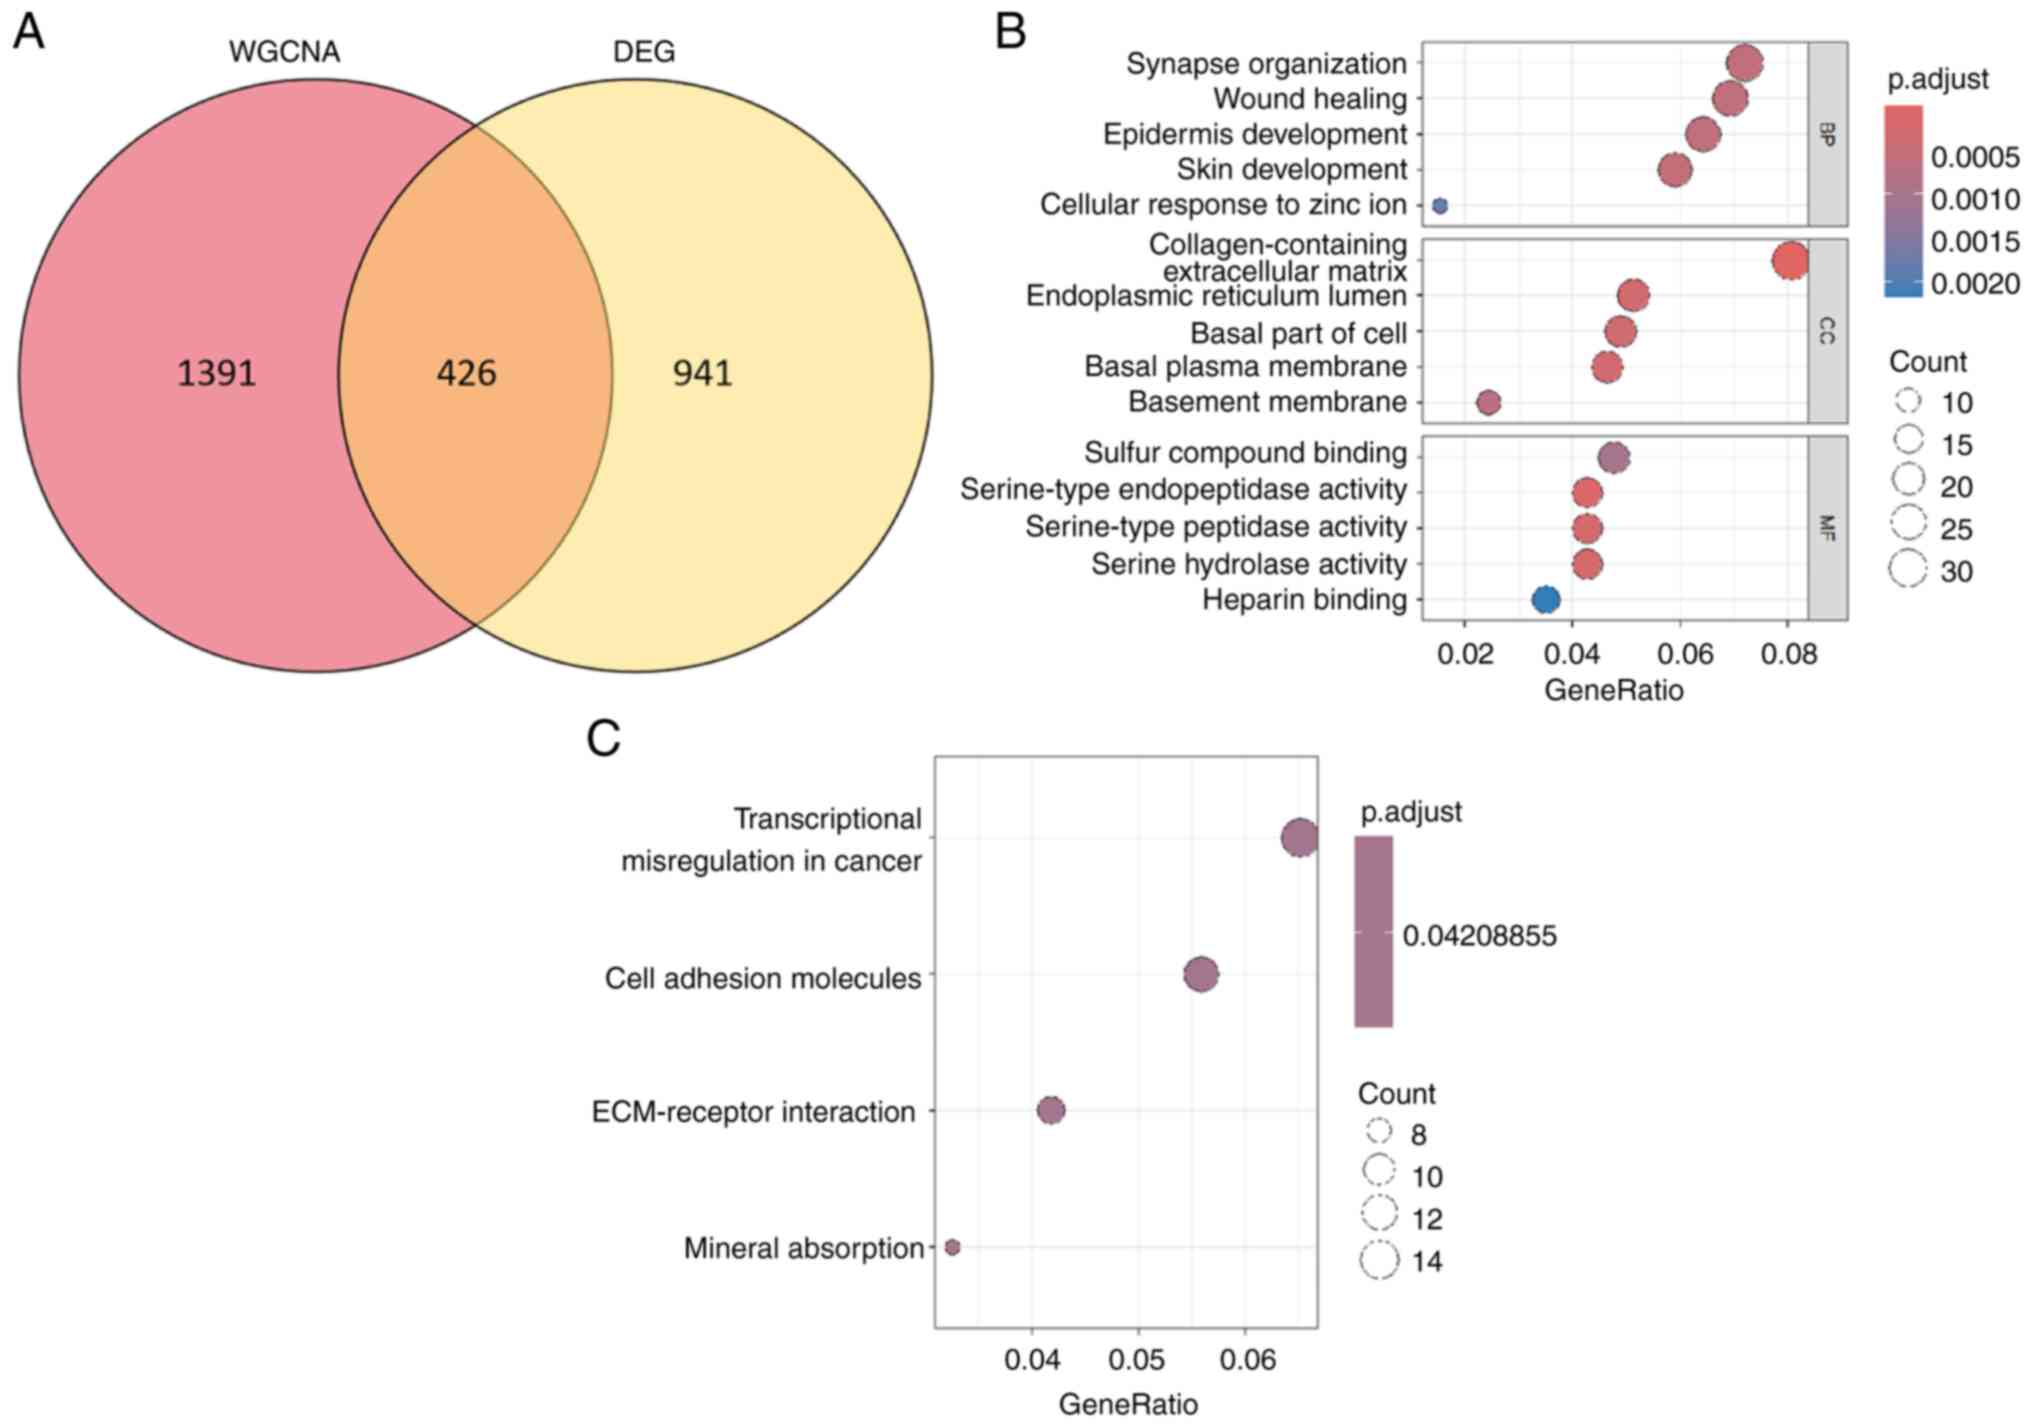
A total of 426 overlapping genes were identified
between the DEGs and the top two most relevant CEMGs. These genes
have been identified as candidate hub genes for THCA and were
subsequently used in further analyses (Fig. 3A and Table SIII).
Enrichment analyses of the 426
overlapping genes
The BP category was enriched with GO terms that
predominantly encompassed synapse organization, wound healing,
epidermis development and skin development (Fig. 3B). Within the CC category, the
enriched terms primarily encompassed collagen-containing ECM,
endoplasmic reticulum lumen, basal part of the cell and basal
plasma membrane. Furthermore, in the MF category, the enriched
terms predominantly consisted of sulfur compound binding,
serine-type endopeptidase activity, serine-type peptidase activity
and serine hydrolase activity. Additionally, KEGG pathway analysis
revealed significant enrichments in transcriptional misregulation
in cancer, cell adhesion molecules and ECM-receptor interaction
(Fig. 3C).
Identifying hub genes in the PPI
network
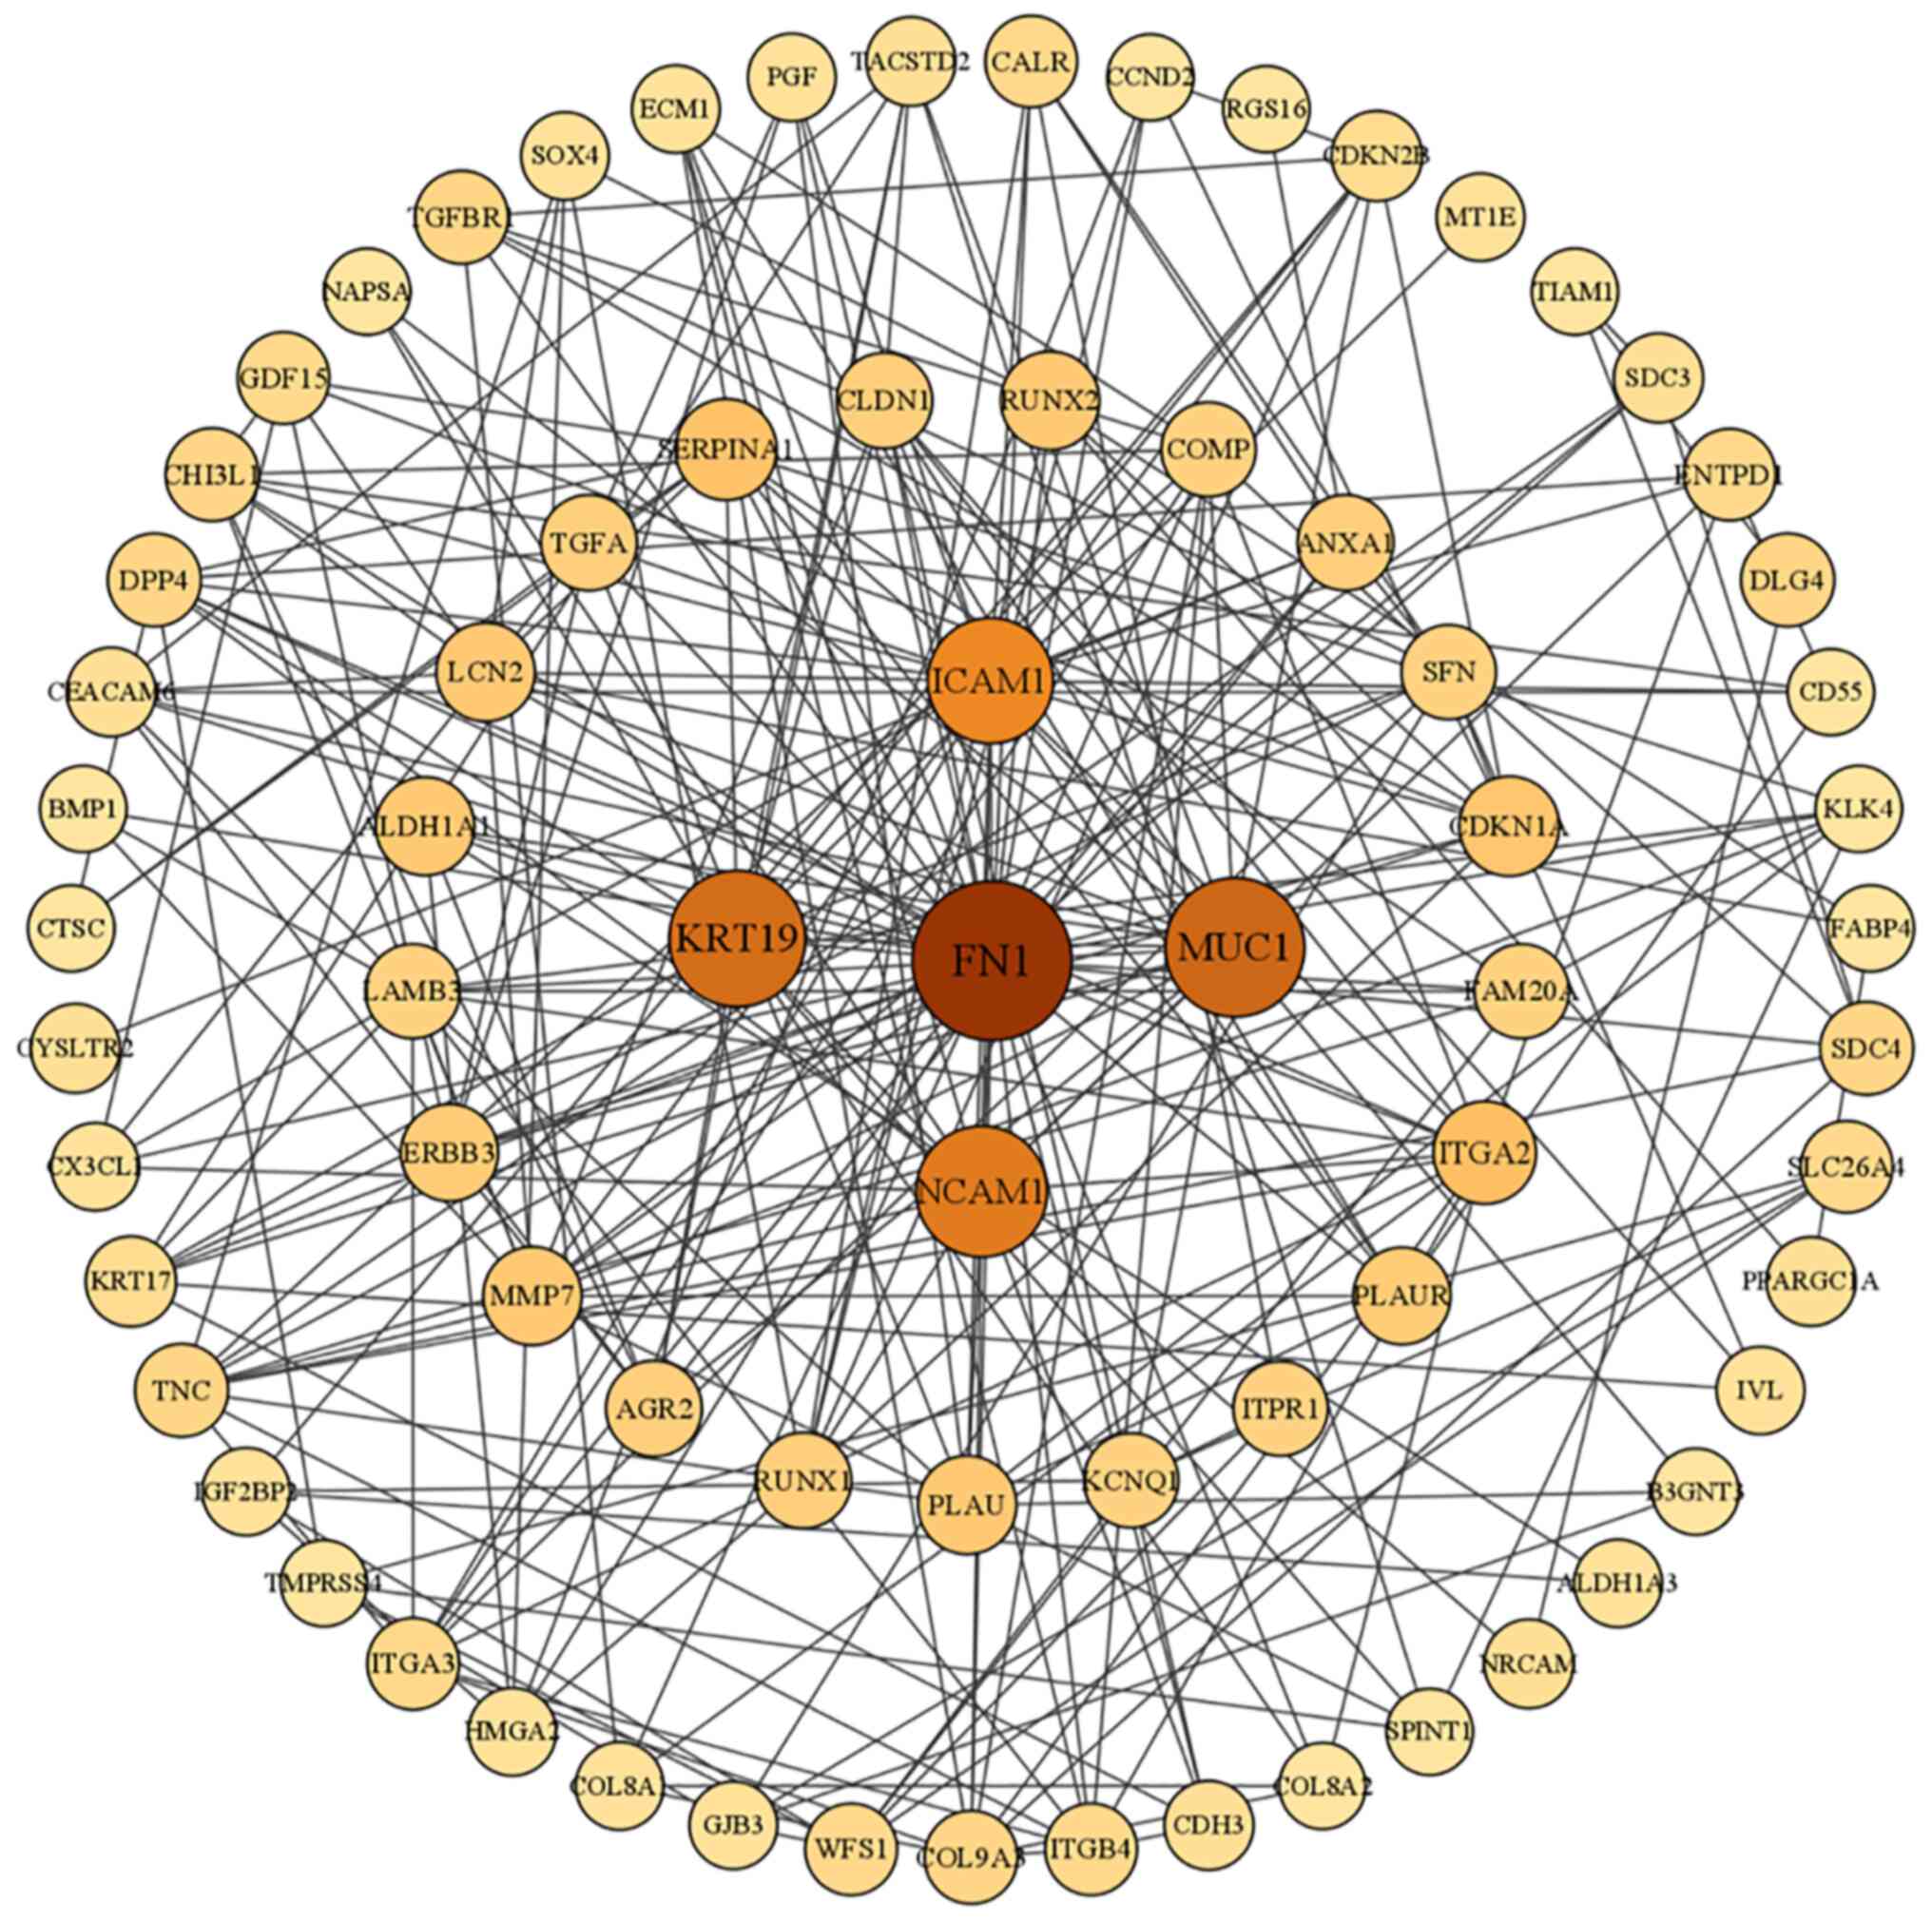
A PPI network was established to assess the
interconnections among the protein-encoding DEGs associated with
THCA. Among these DEGs, the foremost five genes, namely FN1,
mucin-1 (MUC1), keratin (KRT) 19, intracellular adhesion molecule 1
(ICAM1) and neural cell adhesion molecule (NCAM1), were identified
as key molecules due to their notable connectivity (Fig. 4).
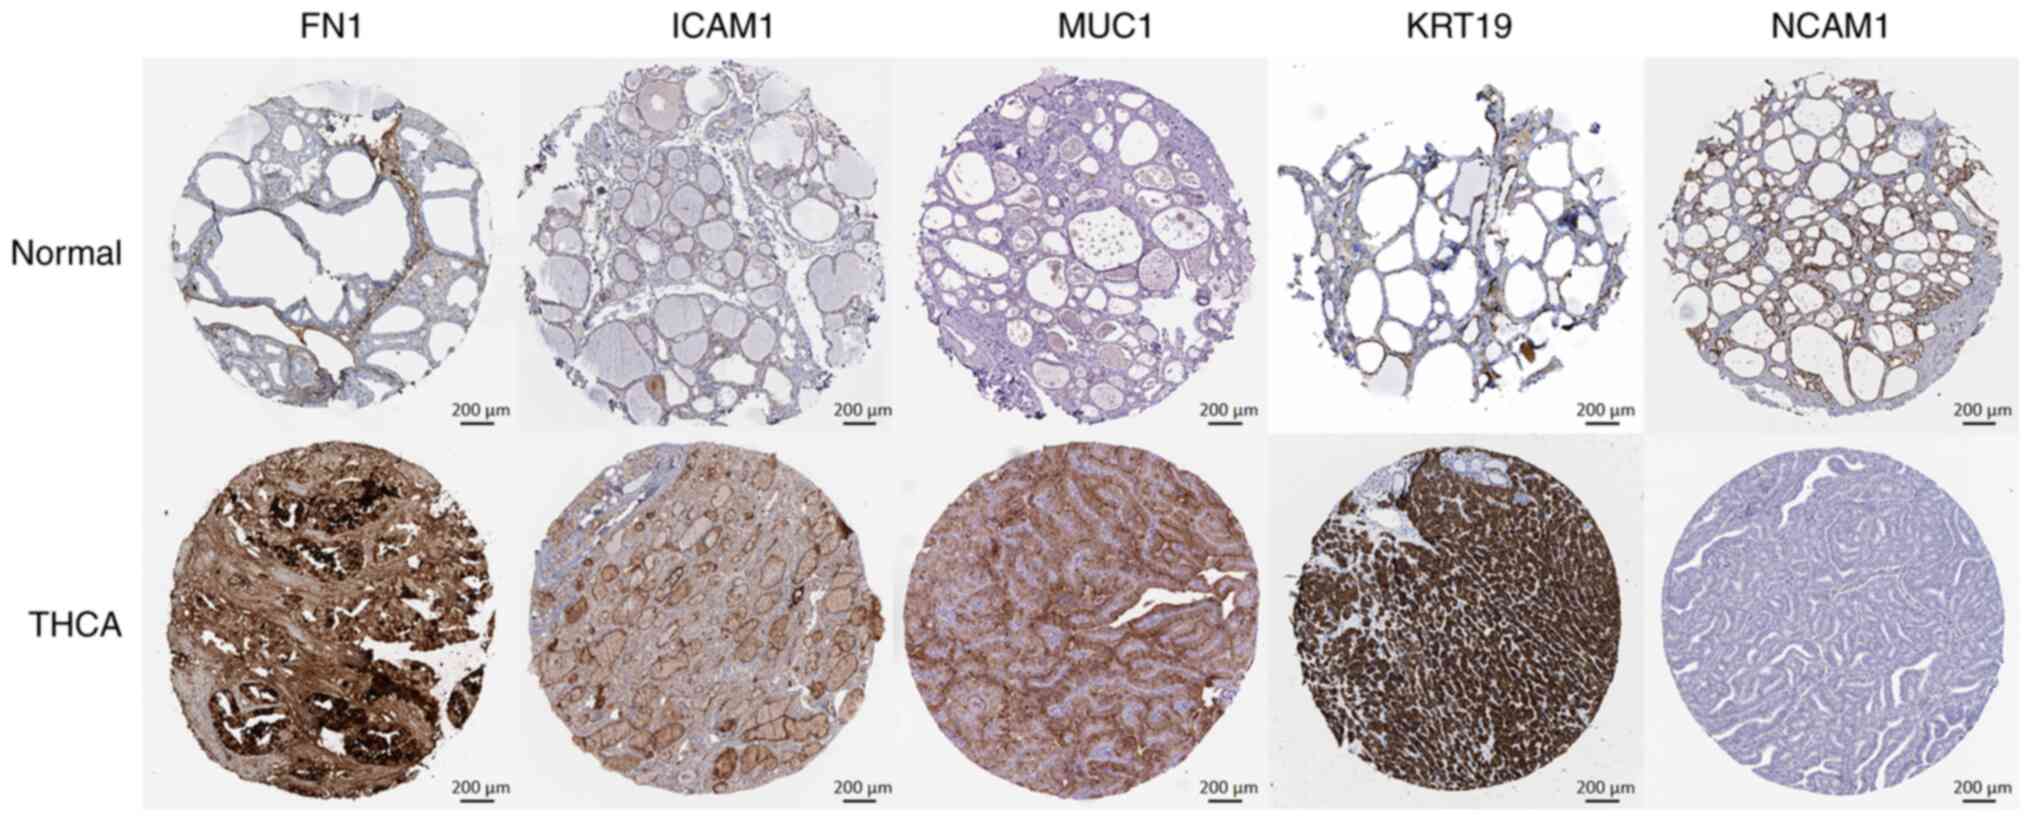
Validation of protein and
gene-expression levels of THCA-related hub genes
Immunohistochemistry staining outcomes for five key
genes were derived from the Human Protein Atlas (HPA) database
(https://www.proteinatlas.org/). In
comparison with the normal group, the protein expression levels of
FN1, MUC1, KRT19 and ICAM1 were markedly augmented in the tumor
group. Conversely, the expression of NCAM1 was notably
downregulated in the tumor samples (Fig. 5). These findings highlight the
differences in the expression of selected target genes between
normal and tumor tissues. Furthermore, the expression of these key
molecules within THCA tissues was significantly increased compared
with that in normal tissues (Fig. 6A
and B). Furthermore, Spearman's correlation analyses revealed
significant positive correlations between these key molecules
(Fig. 6C and D). The mRNA
expression levels of the five genes in the external validation
datasets (GSE33630 and GSE54958) also demonstrated similar findings
to those in TCGA (Fig. 6E and F).
Moreover, to assess the mRNA expression variations of key molecules
between normal and THCA tissues in patients, FN1, ICAM1, KRT19,
MUC1, and NCAM1 levels were assessed using RT-qPCR. The results
revealed that, compared with in normal tissues, the mRNA expression
levels of FN1, ICAM1, KRT19 and MUC1 were significantly increased,
whilst NCAM1 expression was significantly decreased, in THCA
tissues (Fig. 6G).
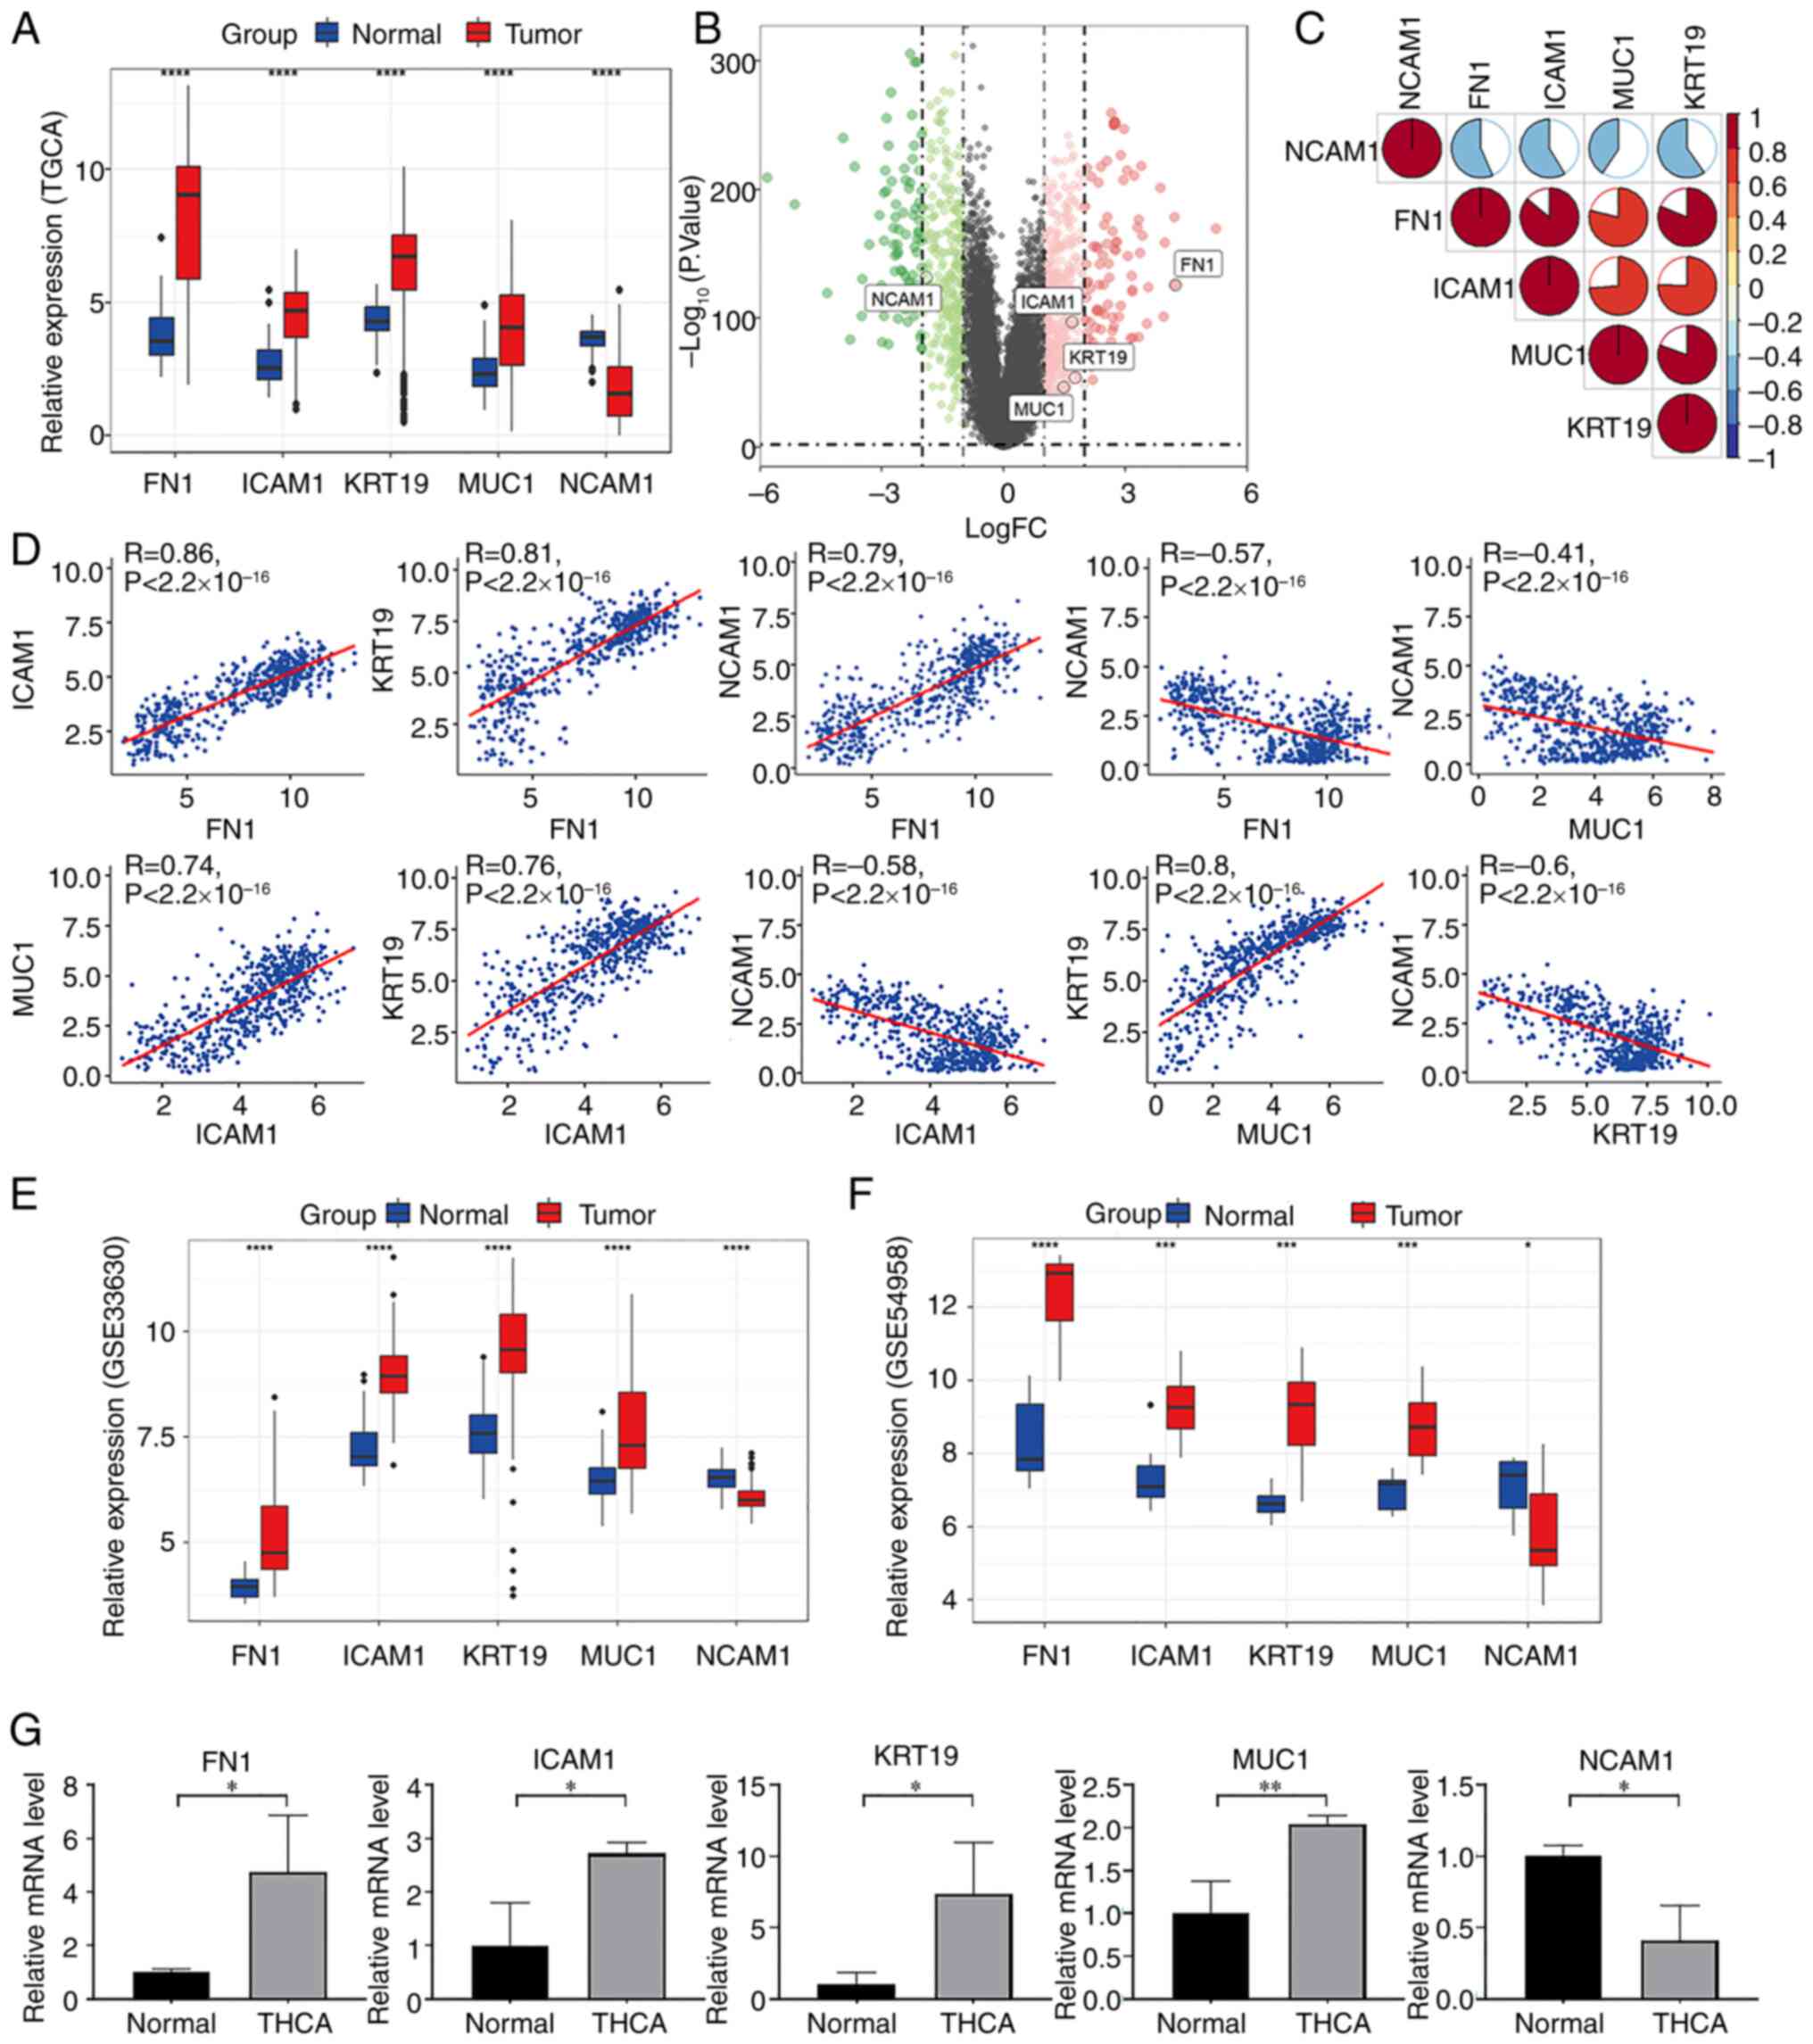 | Figure 6.Identification of pivotal molecules
in THCA. (A) Gene expression patterns of the target genes in THCA.
(B) Volcano plot of significantly upregulated (red) and
downregulated (green) genes. (C) The mRNA expression levels of FN1,
ICAM1, KRT19, MUC1 and NCAM1 were found to be correlated. (D) The
mRNA expression levels of FN1, ICAM1, KRT19 and MUC1 were
positively correlated. By contrast, NCAM1 was negatively correlated
with them. (E) The mRNA expression levels of FN1, ICAM1, KRT19 and
MUC1 were notably higher in THCA tissues than in normal tissues in
dataset GSE33630. Conversely, NCAM1 showed reduced expression. (F)
The mRNA expression levels of FN1, ICAM1, KRT19 and MUC1 were
significantly elevated in THCA tissues compared with normal tissues
in dataset GSE54958. By contrast, NCAM1 exhibited decreased
expression. (G) Expression levels of key molecules detected by
reverse transcription-quantitative PCR. *P<0.05; **P<0.01;
***P<0.001; ****P<0.0001. THCA, thyroid cancer; FN1,
fibronectin 1; ICAM1, intracellular adhesion molecule 1; MUC1,
mucin-1; KRT16, keratin 19; NCAM1, neural cell adhesion molecule;
TCGA, The Cancer Genome Atlas; FC, fold change; |
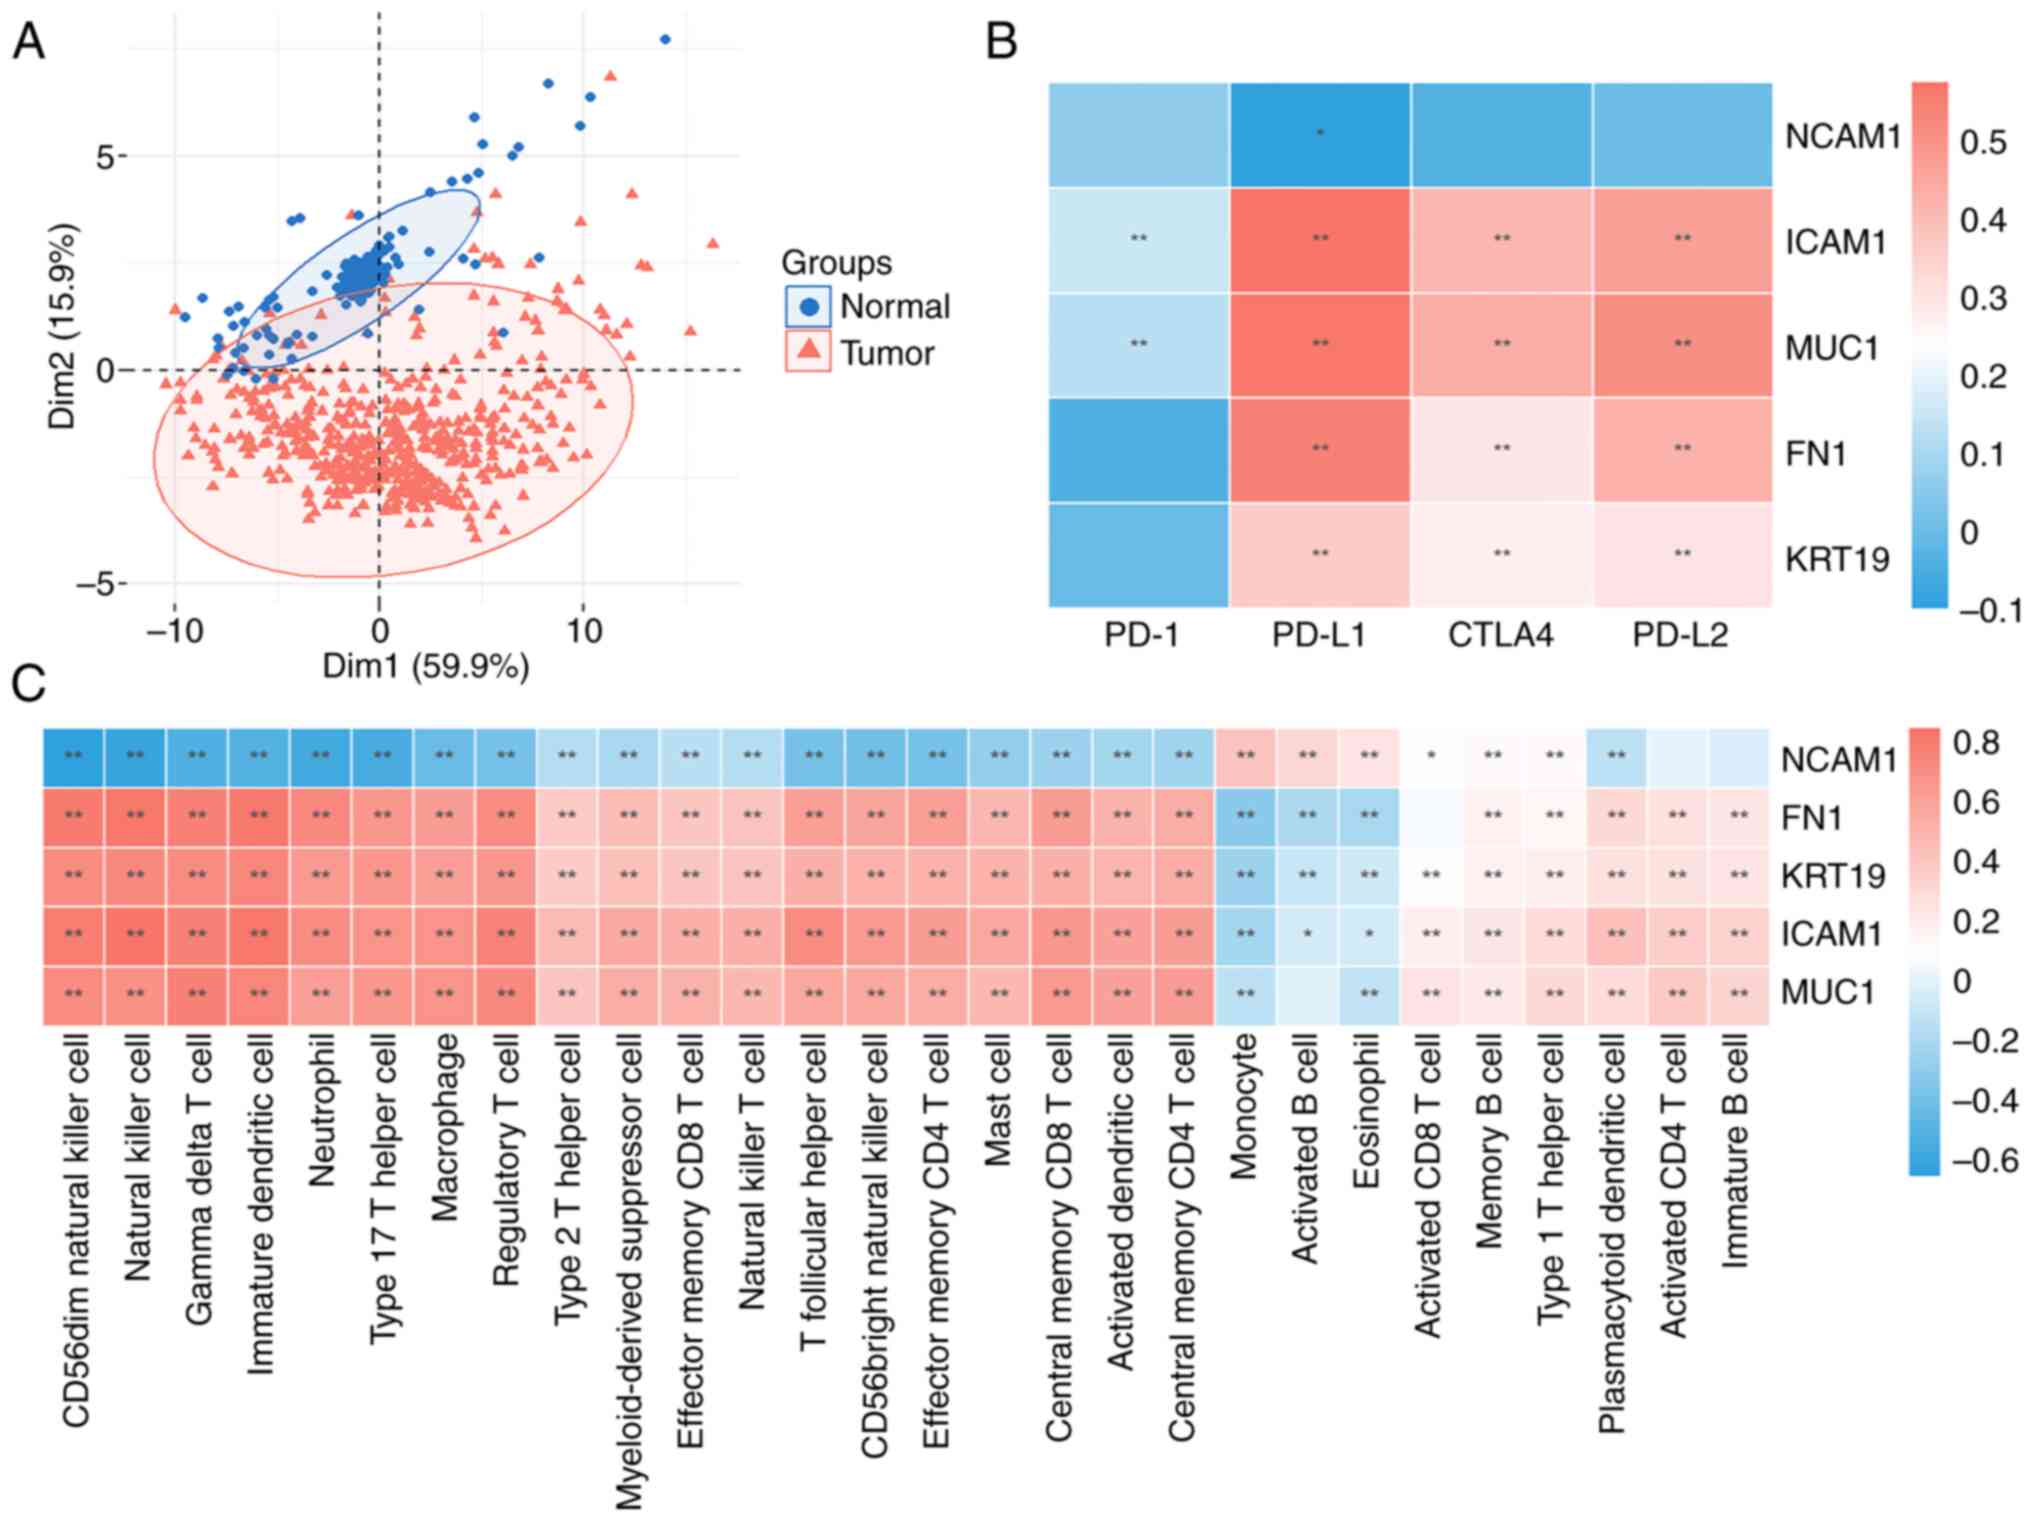
Evaluation of TME immune cell
infiltration characterization
To assess of the roles of the identified key
molecules in TME immune cell infiltration, correlation analyses
were performed between key genes, TME-infiltrating cells and immune
checkpoint inhibitors. Using the PCA algorithm, unique enrichments
of immune cell populations were revealed within the two groups
(Fig. 7A). FN1, MUC1, KRT19 and
ICAM1 were significantly correlated with an upregulation of immune
checkpoint proteins including, PD-L1, PD-L2 and cytotoxic
T-lymphocyte associated protein 4. These findings indicate
significant upregulation of most immune checkpoint proteins in the
tumor group, suggesting a potential association between THCA and a
suppressive TME (Fig. 7B).
Similarly, the results demonstrated a significant correlation with
a decrease in FN1, MUC1, KRT19 and ICAM1 within immune infiltration
in monocytes, activated B cells and eosinophils, with a notable
increase in other immune cell subtypes too. In contrast, NCAM1
demonstrated an inverse pattern (Fig.
7C).
Association of FN1 expression with
clinical parameters and the prognostic relevance of FN1
expression
A higher tumor (T) stage, node (N) stage,
pathological stage, extrathyroidal extension and PFI event was
significantly associated with increased levels of FN1 expression
(Fig. 8A-E). Similarly, increased
FN1 expression was significantly associated with an unfavorable
(PFI) outcome (Fig. 8F). Comparable
results were obtained using Fisher's exact test or the
χ2 test (Table I).
Moreover, the univariate analysis of FN1 expression revealed a
significant association between FN1 expression and clinical
parameters, specifically T stage, N stage, pathological stage and
histological type (Table II).
These findings demonstrate a relationship between FN1 expression,
clinical characteristics and the prognosis of patients with
THCA.
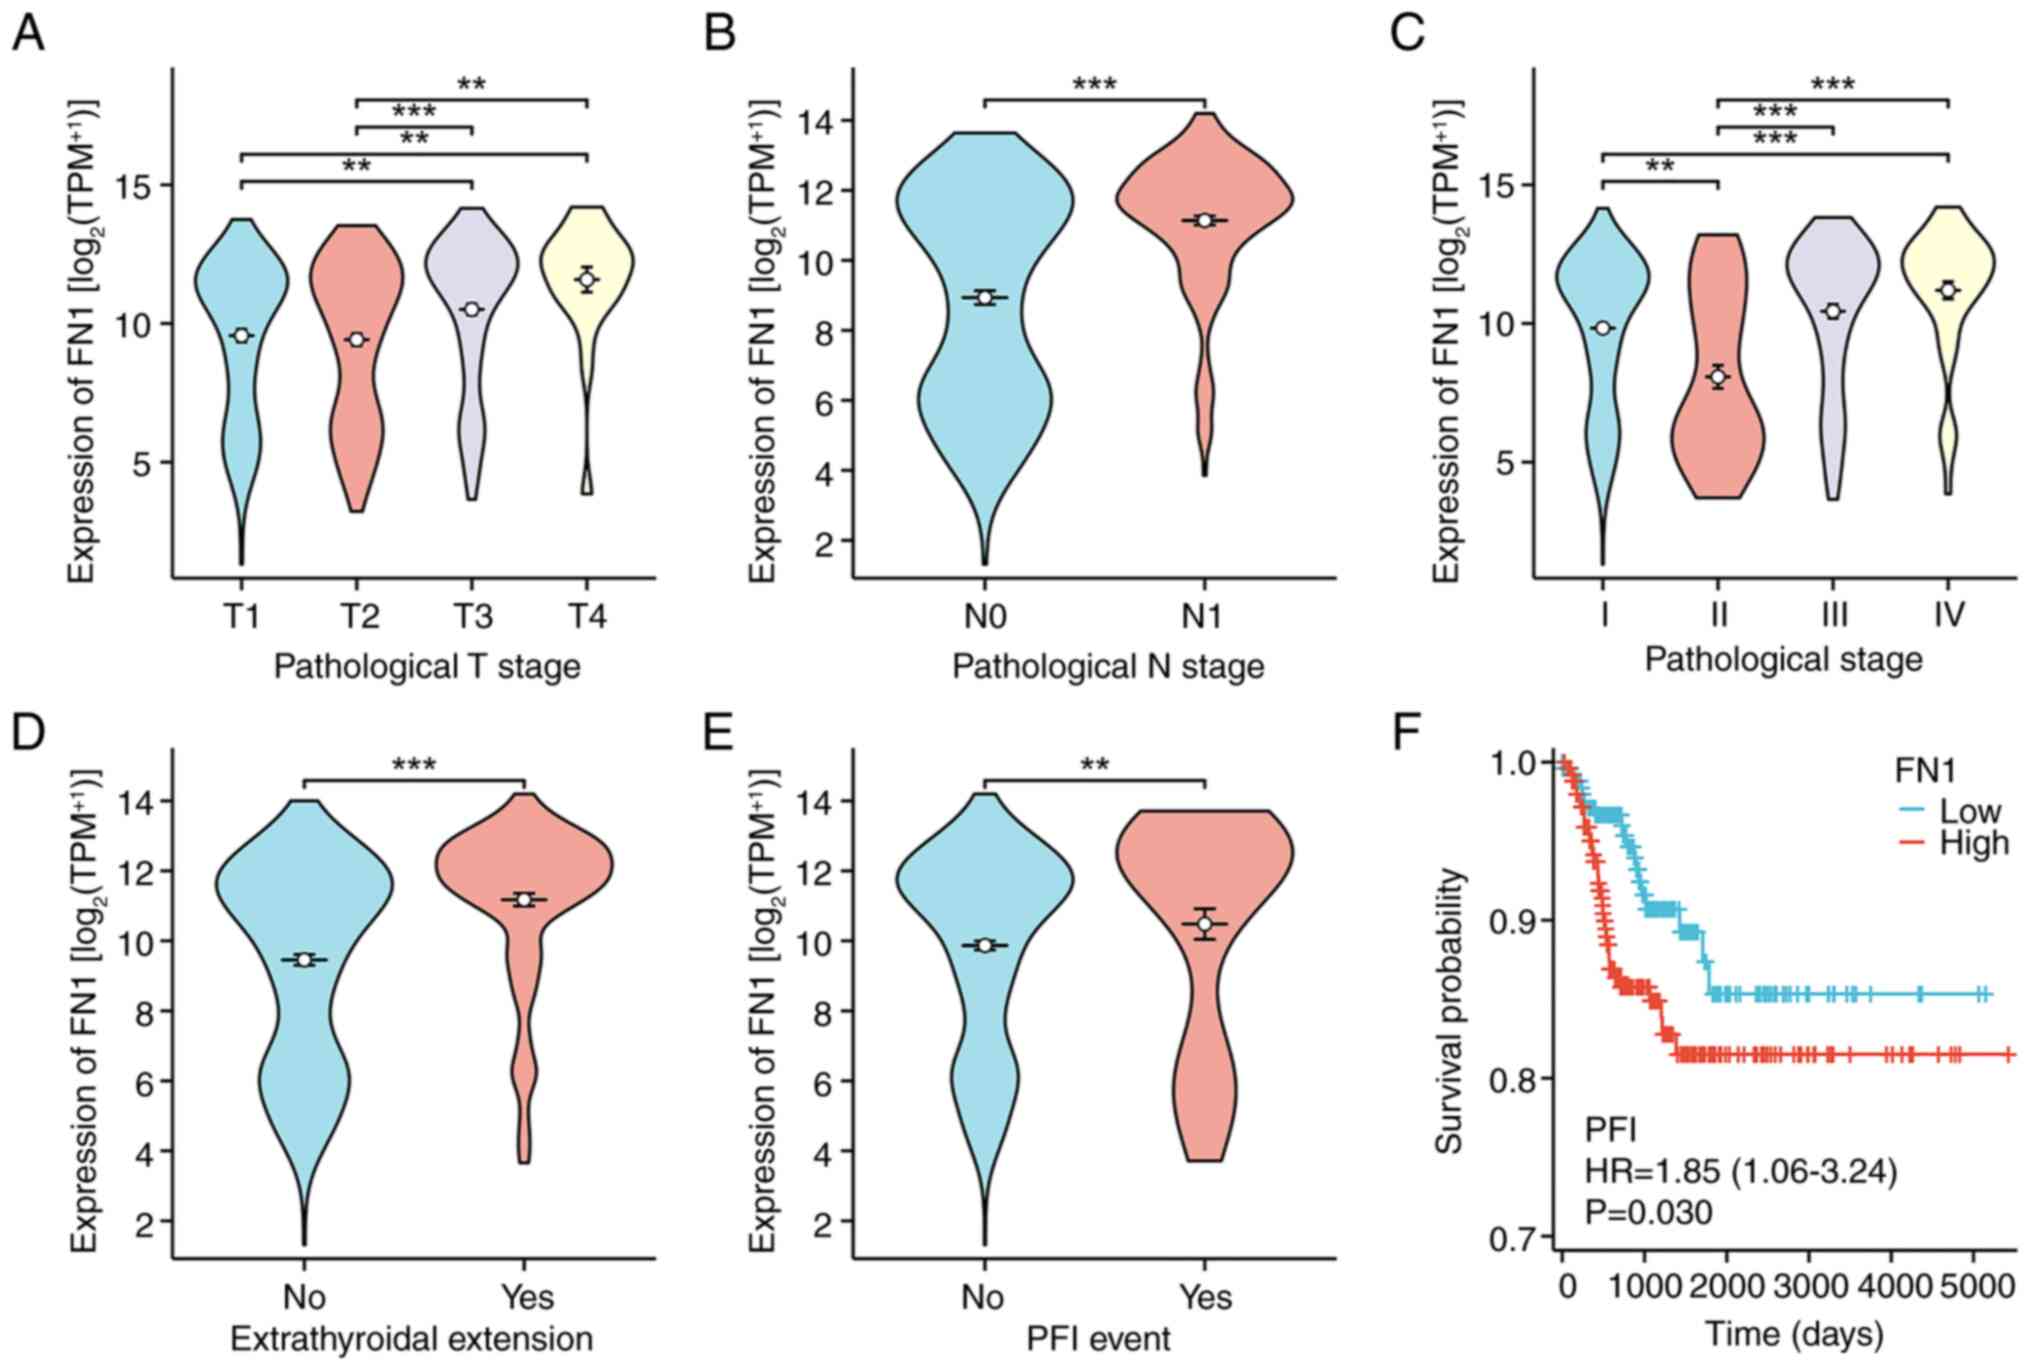 | Figure 8.Association between FN1 expression
and the clinical-pathological parameters of thyroid cancer, and FN1
expression prognostic analysis. Association between FN1 expression
and (A) T stage, (B) N stage, (C) pathological stage, (D)
extrathyroidal extension and (E) PFI event. (F) Patients with high
FN1 expression had unfavorable prognosis indicators. **P<0.01;
***P<0.001. ns, no statistical difference; FN1, fibronectin 1;
T, tumor; N, node; PFI, progression-free interval; TPM, transcripts
per million; HR, hazard ratio. |
 | Table I.Association between fibronectin 1
expression with clinicopathological characteristics in patients
with thyroid cancer. |
Table I.
Association between fibronectin 1
expression with clinicopathological characteristics in patients
with thyroid cancer.
| Characteristic | Low FN1 expression
(n=256) | High FN1 expression
(n=256) | P-value |
|---|
| Pathologic T
stage |
|
|
<0.001a |
| T1 | 81 (15.9) | 62 (12.2) |
|
| T2 | 99 (19.4) | 70 (13.7) |
|
| T3 | 67 (13.1) | 108 (21.2) |
|
| T4 | 8 (1.6) | 15 (2.9) |
|
| Pathologic N
stage |
|
|
<0.001a |
| N0 | 146 (31.6) | 83 (18.0) |
|
| N1 | 79 (17.1) | 154 (33.3) |
|
| Pathologic M
stage |
|
| 0.324b |
| M0 | 128 (43.4) | 158 (53.6) |
|
| M1 | 6 (2.0) | 3 (1.0) |
|
| Pathologic
stage |
|
|
<0.001a |
| I | 151 (29.6) | 137 (26.9) |
|
| II | 39 (7.6) | 13 (2.5) |
|
|
III | 46 (9.1) | 67 (13.1) |
|
| IV | 19 (3.7) | 38 (7.5) |
|
| OS event |
|
| 0.611a |
|
Alive | 249 (48.6) | 247 (48.2) |
|
|
Dead | 7 (1.4) | 9 (1.8) |
|
| Age |
|
| 0.929a |
| ≤45
years | 121 (23.6) | 122 (23.8) |
|
| >45
years | 135 (26.4) | 134 (26.2) |
|
| Table II.Logistic regression analysis of
fibronectin 1 expression. |
Table II.
Logistic regression analysis of
fibronectin 1 expression.
| Characteristic | Total (n) | OR (95% CI) | P-value |
|---|
| Pathological T
stage (T3 and T4 vs. T1 and T2) | 510 | 2.236
(1.553–3.220) | <0.001 |
| Pathological N
stage (N1 vs. N0) | 462 | 3.429
(2.340–5.026) | <0.001 |
| Pathological M
stage (M1 vs. M0) | 295 | 0.405
(0.099–1.651) | 0.208 |
| Pathological stage
(Stage III and IV vs. stage I and II) | 510 | 2.046
(1.405–2.981) | <0.001 |
| Age (>45 years
vs. ≤45 years) | 512 | 0.984
(0.696–1.393) | 0.929 |
| Histological type
(Other and tall cell vs. classical and follicular) | 512 | 4.491
(2.116–9.533) | <0.001 |
| Primary neoplasm
focus type (Unifocal vs. multifocal) | 502 | 1.153
(0.811–1.637) | 0.428 |
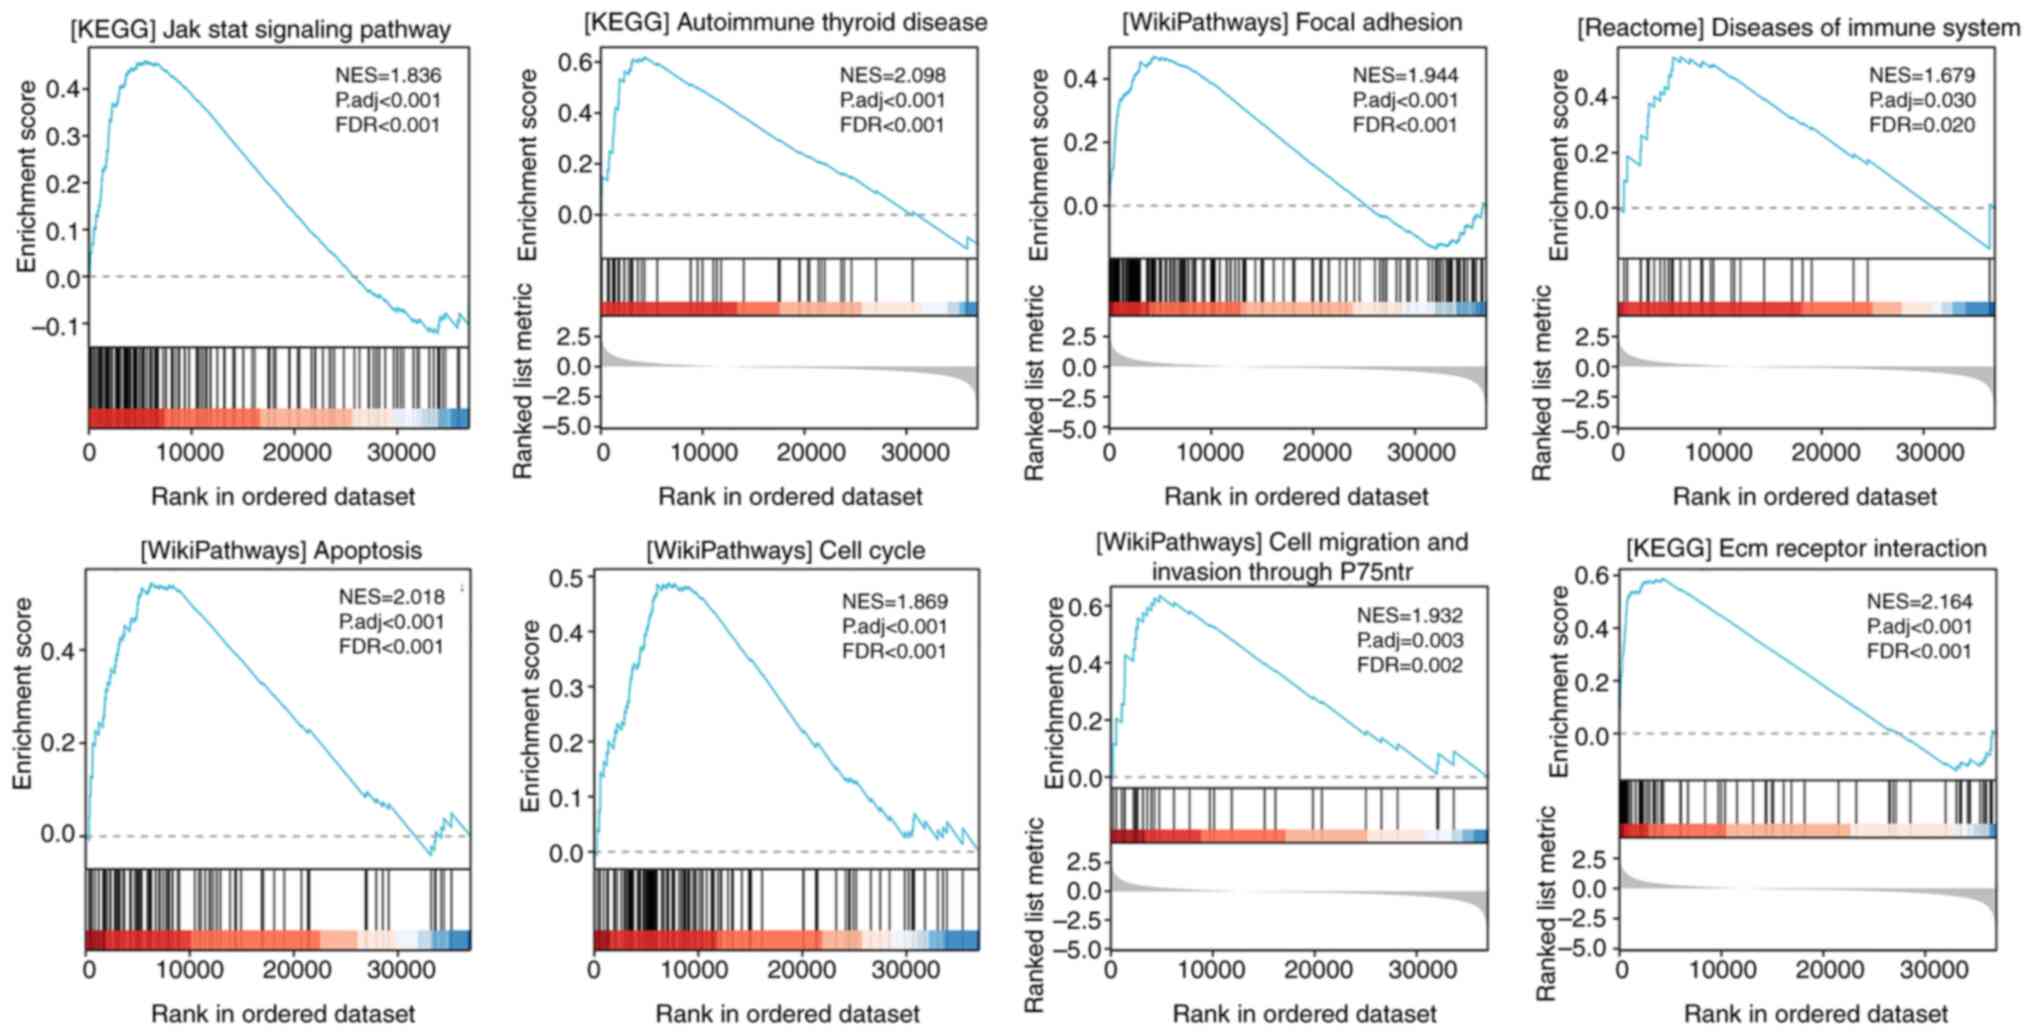
GSEA of the FN1 gene expression
Using TCGA gene expression data, GSEA was performed
to determine the biological and functional pathways between high-
and low-FN1 gene expression groups. Based on the normalized
enrichment scores, the enrichment signaling pathway that was
determined to be the most relevant for FN1 gene expression was
chosen (Fig. 9). The GSEA analysis
revealed that the high FN1 gene expression phenotype was
significantly and predominantly concentrated in the Jak Stat
signaling pathway, autoimmune thyroid disease, focal adhesion,
disease of the immune system, cell cycle, apoptosis, cell migration
and invasion, and ECM receptor interaction. The findings indicate
that FN1 likely serves a significant role in the progression of
THCA.
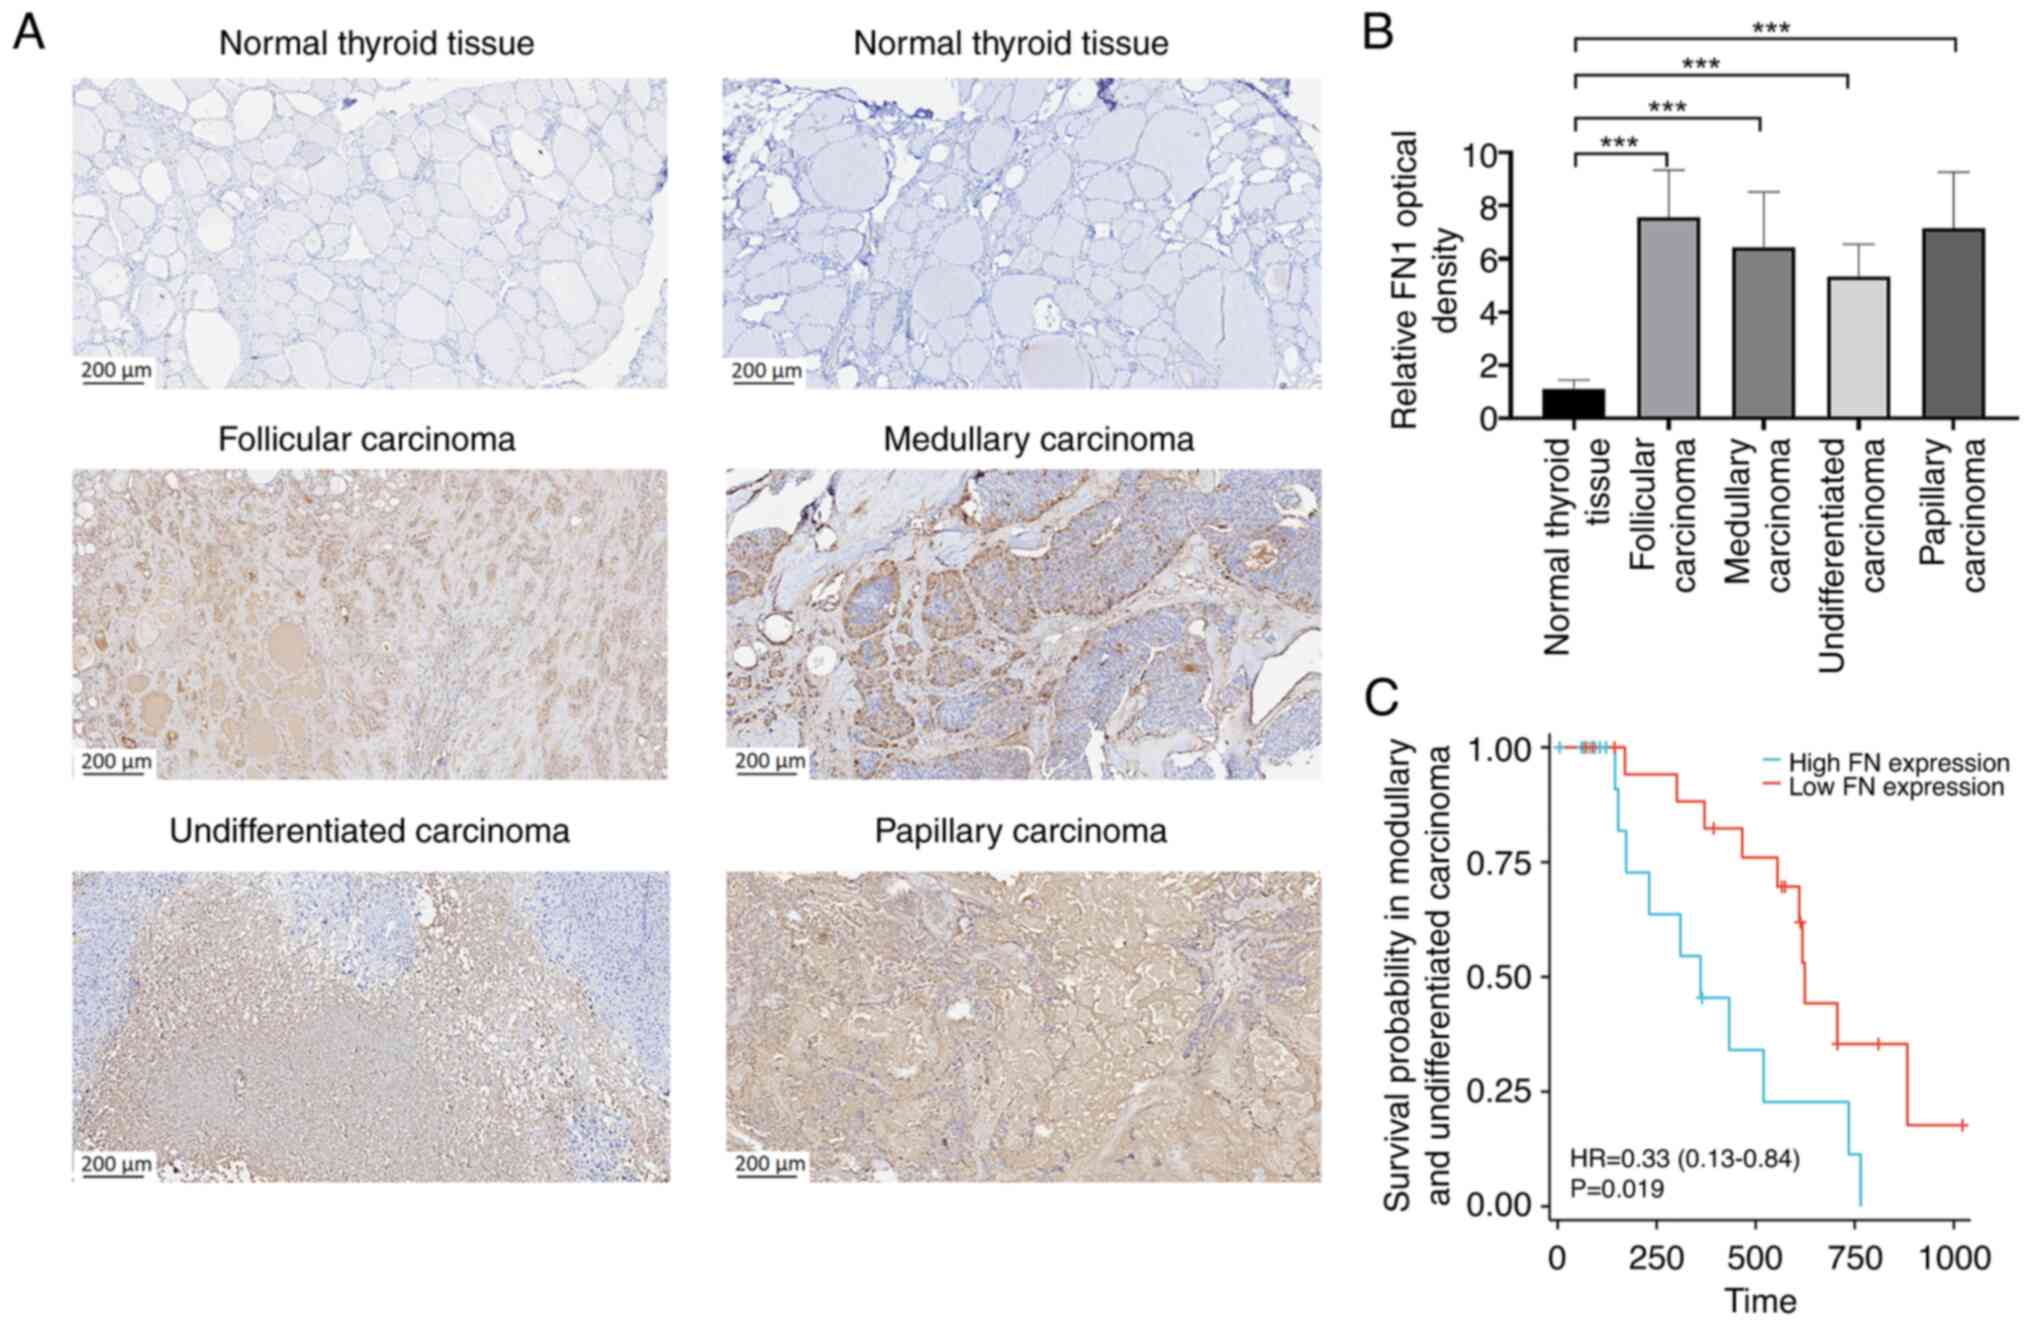
Experimental assessment of FN1 protein
expression
FN1 serves a crucial role in cell adhesion and
migration processes across several biological events, including
embryo development, wound healing, blood clotting, host defense,
metastasis and cell proliferation (39). To assess the variations in the mRNA
and protein expression of FN1 between paracancerous tissue and THCA
tissues, the expression levels of THCA was evaluated in tissues
using immunohistochemistry. A total of four types of THCA were
assessed and the resulted and demonstrated that FN1 expression
levels were significantly higher in THCA tissues compared with
their adjacent counterparts (Fig. 10A
and B).
FN1 prognostic significance
Patients with papillary carcinoma and follicular
carcinoma were excluded due to their favorable prognosis. The
prognostic value of FN1 was evaluated using Kaplan-Meier survival
analysis. Patients diagnosed with THCA with low FN1 expression
levels demonstrated a significant survival advantage compared with
those with high FN1 expression levels (Fig. 10C). This suggests that FN1 has
potential prognostic significance in THCA, and may serve as a
therapeutic target for THCA treatment.
Discussion
The current standard approach for comprehensive
treatment of THCA involves a multifaceted strategy that combines
surgery, thyroid hormone therapy and internal radiotherapy
(40). However, the poor prognosis
of THCA can be attributed to several factors, such as advanced
clinical stage upon diagnosis and the limited availability of
molecular biomarkers. Thus, there is an urgent need to identify new
prognostic biomarkers and therapeutic targets in the field of
cancer research.
The present study demonstrated that FN1 was highly
expressed in THCA, with a logFC value of 4.22 and P<0.001.
Previous studies have highlighted the notable role of
epithelial-mesenchymal transition (EMT) in regulating THCA cell
invasion and metastasis (41,42).
FN1 is recognized as a biomarker for EMT and serves a crucial role
in cell adhesion and migration (43). Additionally, research suggests an
association between immune cell infiltration, immune markers and
FN1 expression in THCA, indicating the potential role of FN1 in
tumor immunology and its potential usefulness as a cancer biomarker
(44). In recent years, numerous
studies have highlighted the role of FN1 in tumor immune regulation
(45–47). However, a comprehensive
understanding of its role in the development of THCA remains
elusive. In the present study, FN1 was identified as a potent
biomarker for predicting the prognosis of THCA, closely associated
with immune cell infiltration in solid tumors. These findings offer
novel insights into the potential role of FN1 in THCA for further
investigation.
Furthermore, the present study assessed the
expression of FN1 and its significantly associated gene
transcription data in thyroid tumors. The expression of FN1 in both
paired and unpaired THCA samples revealed substantial upregulation.
Furthermore, as proteins serve as the ultimate functional units in
biology, immunohistochemical analysis was performed. In several
types of THCA, FN1 expression was notably higher than in normal
thyroid tissues, with expression observed in both the nucleus and
cytoplasm. Immunohistochemical results from the HPA database
further corroborated the reliability of the obtained data.
The present study also evaluated the clinical
significance of FN1 in a cohort of patients with THCA, assessed the
relationship between FN1 protein levels and clinicopathological
characteristics, and confirmed the clinical utility of FN1.
Analysis of clinical data demonstrated a significant correlation
between FN1 expression levels and the T-stage of patients with
THCA. Patients at advanced T-stages exhibited progressively
elevated FN1 expression, aligning with findings in gastric cancer
progression (48). Patients with
medullary and undifferentiated carcinoma who exhibited low FN1
expression had prolonged survival compared with individuals with
high expression levels. Consistent with previous findings in
gastric cancer, breast cancer and skull base chordoma, these
results collectively suggest the involvement of FN1 as an oncogene
in the progression of malignant tumors, leading to a worse
prognosis (45,48,49).
This indicates that FN1 can serve as an independent prognostic
indicator for overall survival. Therefore, the present study
provides valuable insights and practical implications by proposing
FN1 as a promising molecular marker for THCA, thus improving the
clinical management of patients with THCA in the future.
Moreover, the present study explored genes that are
significantly associated with FN1 expression in THCA. The findings
revealed abnormal expression of these genes, indicating their
direct or indirect involvement in a regulatory network with FN1,
influencing the onset and progression of THCA. The present study
used integrated bioinformatics methods, specifically WGCNA and DEG
analysis, to identify a comprehensive set of 426 candidate hub
genes that exhibited overlapping characteristics. By constructing a
PPI network and applying rigorous analysis techniques, the top five
hub genes were successfully pinpointed: FN1, MUC1, KRT19, ICAM1 and
NCAM1. The interaction between MUC1 and adhesion molecules enables
cancer cells to exploit advantageous mechanisms for invasion and
metastasis (50,51). Therefore, MUC1 serves a pivotal role
in maintaining epithelial cell homeostasis as well as driving
cancer progression. KRTs are integral components of the cellular
framework, engaging in interactions with several cellular proteins
such as kinases, receptors, adaptors and effectors (52,53).
These interactions initiate signaling networks that govern crucial
cellular processes, including cell migration, invasion, metastasis,
cell cycle progression and apoptosis. ICAM1 is actively involved in
the immune process and inflammatory response within the body
(54). Additionally, it serves a
crucial role in mediating the adhesion of tumor cells to other cell
types and the ECM by binding with specific ligands. This mechanism
allows tumor cells to evade immune surveillance, facilitating their
invasion and metastasis. Sasca et al (55) reported that the inhibition of MEK1/2
enhances the susceptibility of acute myeloid leukemia (AML) blasts
to genotoxic agents, suggesting that NCAM1 can serve as a useful
biomarker for guiding AML treatment. These findings indicate that
the activation of FN1 may be closely associated with immune
evasion, invasion and metastasis, and collectively endow tumor
cells with the ability to resist harsh environmental
conditions.
GSEA was also performed to enhance comprehension of
FN1 function and its associated activation pathways. The GSEA
analysis revealed the involvement of FN1 in regulating the
malignant phenotype of THCA, as well as its participation in
pathways linked with cell adhesion molecules, tight junctions and
ECM-receptor interactions associated with the migratory and
invasive functions of tumor cells. Notably, FN1 extensively
influences immune-related pathways, suggesting its role as an
oncogene in modulating the immune microenvironment of tumors. Based
on these pivotal findings, the correlation between FN1 and
immune-infiltrating cells was subsequently assessed. FN1 was
demonstrated to significantly impact immune cell infiltration
within solid tumors, with the high-expression group of FN1 showing
marked increases in NK, CD4T and CD8T cells compared with the
low-expression group. NK cells, being innate immune cells, possess
the ability to directly recognize tissues expressing major
histocompatibility complex class I molecules and eliminate foreign
or stressed target cells, including those affected by viral
infections, aging or cancer transformations (56). These findings suggest that FN1 plays
a pivotal regulatory role in malignant solid tumors, promoting
tumor progression. Additionally, FN1 shows widespread expression in
immune cells within the tumor microenvironment (TME).
However, whilst the present study has identified FN1
as a promising therapeutic target for THCA, involved in immune
microenvironment regulation and closely linked with prognosis, it
is not without limitations. Firstly, the precise mechanism through
which FN1 modulates immune cells in the TME necessitates validation
through a series of meticulously designed experiments. Moreover,
the use of FN1 as a prognostic marker for THCA requires
confirmation in clinical applications from bench to bedside.
Nevertheless, the findings of the present study emphasize future
research directions aimed at providing potential insights into the
development of new treatment modalities for THCA.
In conclusion, FN1 is upregulated in advanced THCA,
which may affect THCA progression via key molecular functions and
pathways. The acquired data suggest that FN1 is a powerful and
promising biomarker for predicting THCA prognosis.
Supplementary Material
Supporting Data
Supporting Data
Supporting Data
Acknowledgements
Not applicable.
Funding
The present work was supported by Zhejiang Provincial Medical
and Health Science and Technology Project (grant no.
2024KY1089).
Availability of data and materials
The data generated in the present study may be
requested from the corresponding author.
Authors' contributions
HP, ZL and FL undertook the research, analyzed the
data and wrote the paper. JZ, TX and YH helped to analyzed the
data. YY and BS designed the research and revised the paper. YY and
BS confirm the authenticity of all the raw data. All authors have
read and approved the final manuscript.
Ethics approval and consent to
participate
Ethical approval for the study was granted by the
Clinical Research Ethics Committee of The Second Affiliated
Hospital, Zhejiang University School of Medicine (Hangzhou, China;
approval nos. 2024-0005 and 2020-0559). Informed consent was waived
by the Ethics Committee. All methods were performed in accordance
with relevant guidelines and regulations.
Patient consent for publication
Not applicable.
Competing interests
The authors declare that they have no competing
interests.
References
|
1
|
Zhou YL, Zheng C, Chen YT and Chen XM:
Underexpression of INPPL1 is associated with aggressive
clinicopathologic characteristics in papillary thyroid carcinoma.
Onco Targets Ther. 11:7725–7731. 2018. View Article : Google Scholar : PubMed/NCBI
|
|
2
|
Cabanillas ME, McFadden DG and Durante C:
Thyroid cancer. Lancet. 388:2783–2795. 2016. View Article : Google Scholar : PubMed/NCBI
|
|
3
|
Ge J, Wang J, Wang H, Jiang X, Liao Q,
Gong Q, Mo Y, Li X, Li G, Xiong W, et al: The BRAF V600E mutation
is a predictor of the effect of radioiodine therapy in papillary
thyroid cancer. J Cancer. 11:932–939. 2020. View Article : Google Scholar : PubMed/NCBI
|
|
4
|
Ma T, Wang R, Zhou X, Liu L, Pan A, Wang H
and Huang L: Case reports of collision and composite carcinomas of
the thyroid: An insight into their origin and clinical
significance. BMC Endocr Disord. 23:1732023. View Article : Google Scholar : PubMed/NCBI
|
|
5
|
Wan Y, Zhang X, Leng H, Yin W, Zeng W and
Zhang C: Identifying hub genes of papillary thyroid carcinoma in
the TCGA and GEO database using bioinformatics analysis. PeerJ.
8:e91202020. View Article : Google Scholar : PubMed/NCBI
|
|
6
|
Ejiofor EU, Ishebe JE, Benjamin I, Okon
GA, Gber TE and Louis H: Exploring the potential of single-metals
(Cu, Ni, Zn) Decorated Al12N12 nanostructures
as sensors for flutamide anticancer drug. Heliyon. 9:e206822023.
View Article : Google Scholar : PubMed/NCBI
|
|
7
|
Feng G, Chen C and Luo Y: PRMT1
accelerates cell proliferation, migration, and tumor growth by
upregulating ZEB1/H4r3me2as in thyroid carcinoma. Oncol Rep.
50:2102023. View Article : Google Scholar : PubMed/NCBI
|
|
8
|
Xu W, Wang L, An Y and Ye J: Expression of
WD repeat domain 5 (WDR5) is associated with progression and
reduced prognosis in papillary thyroid carcinoma. Med Sci Monit.
25:3762–3770. 2019. View Article : Google Scholar : PubMed/NCBI
|
|
9
|
Liu X, Huang Z, He X, Zheng X, Jia Q, Tan
J, Fan Y, Lou C and Meng Z: Blood prognostic predictors of
treatment response for patients with papillary thyroid cancer.
Biosci Rep. 40:BSR202025442020. View Article : Google Scholar : PubMed/NCBI
|
|
10
|
Liao Z, Cheng Y, Zhang H, Jin X, Sun H,
Wang Y and Yan J: A novel prognostic signature and immune
microenvironment characteristics associated with disulfidptosis in
papillary thyroid carcinoma based on Single-Cell RNA sequencing.
Front Cell Dev Biol. 11:13083522023. View Article : Google Scholar : PubMed/NCBI
|
|
11
|
Soll D, Bischoff P, Frisch A, Jensen M,
Karadeniz Z, Mogl MT, Horst D, Penzkofer T, Spranger J, Keilholz U
and Mai K: First effectiveness data of lenvatinib and pembrolizumab
as First-Line therapy in advanced anaplastic thyroid cancer: A
retrospective cohort study. BMC Endocr Disord. 24:252024.
View Article : Google Scholar : PubMed/NCBI
|
|
12
|
Tan JSH, Tay TKY, Ong EHW, Fehlings M, Tan
DS, Sukma NB, Chen EX, Sng JH, Yip CSP, Lim KH, et al:
Combinatorial hypofractionated radiotherapy and pembrolizumab in
anaplastic thyroid cancer. Eur Thyroid J. 13:e2301442024.
View Article : Google Scholar : PubMed/NCBI
|
|
13
|
Oh DY, Algazi A, Capdevila J, Longo F,
Miller W Jr, Chun Bing JT, Bonilla CE, Chung HC, Guren TK, Lin CC,
et al: Efficacy and safety of pembrolizumab monotherapy in patients
with advanced thyroid cancer in the phase 2 KEYNOTE-158 study.
Cancer. 129:1195–1204. 2023. View Article : Google Scholar : PubMed/NCBI
|
|
14
|
Yi PQ, Nie FF, Fan YB, Yu WW, Hu CS, Guo
XM and Fu J: Intraoperative radiotherapy for the treatment of
thyroid cancer: A pilot study. Oncotarget. 8:29355–29360. 2017.
View Article : Google Scholar : PubMed/NCBI
|
|
15
|
Lan X, Bao H, Ge X, Cao J, Fan X, Zhang Q,
Liu K, Zhang X, Tan Z, Zheng C, et al: Genomic landscape of
metastatic papillary thyroid carcinoma and novel biomarkers for
predicting distant metastasis. Cancer Sci. 111:2163–2173. 2020.
View Article : Google Scholar : PubMed/NCBI
|
|
16
|
Suzuki S, Bogdanova TI, Saenko VA,
Hashimoto Y, Ito M, Iwadate M, Rogounovitch TI, Tronko MD and
Yamashita S: Histopathological analysis of papillary thyroid
carcinoma detected during ultrasound screening examinations in
fukushima. Cancer Sci. 110:817–827. 2019. View Article : Google Scholar : PubMed/NCBI
|
|
17
|
Ohno K, Shibata T and Ito KI: Epidermal
growth factor receptor activation confers resistance to lenvatinib
in thyroid cancer cells. Cancer Sci. 113:3193–3210. 2022.
View Article : Google Scholar : PubMed/NCBI
|
|
18
|
Yu Y and Tian X: Analysis of genes
associated with prognosis of lung adenocarcinoma based on GEO and
TCGA databases. Medicine (Baltimore). 99:e201832020. View Article : Google Scholar : PubMed/NCBI
|
|
19
|
Silva JCF, Carvalho TFM, Basso MF, Deguchi
M, Pereira WA, Sobrinho RR, Vidigal PMP, Brustolini OJB, Silva FF,
Dal-Bianco M, et al: Geminivirus data warehouse: A database
enriched with machine learning approaches. BMC Bioinformatics.
18:2402017. View Article : Google Scholar : PubMed/NCBI
|
|
20
|
Pankov R and Yamada KM: Fibronectin at a
glance. J Cell Sci. 115:3861–3863. 2002. View Article : Google Scholar : PubMed/NCBI
|
|
21
|
Malik G, Knowles LM, Dhir R, Xu S, Yang S,
Ruoslahti E and Pilch J: Plasma fibronectin promotes lung
metastasis by contributions to fibrin clots and tumor cell
invasion. Cancer Res. 70:4327–4334. 2010. View Article : Google Scholar : PubMed/NCBI
|
|
22
|
Xiao J, Yang W, Xu B, Zhu H, Zou J, Su C,
Rong J, Wang T and Chen Z: Expression of fibronectin in esophageal
squamous cell carcinoma and its role in migration. BMC Cancer.
18:9762018. View Article : Google Scholar : PubMed/NCBI
|
|
23
|
Cai X, Liu C, Zhang TN, Zhu YW, Dong X and
Xue P: Down-regulation of FN1 inhibits colorectal carcinogenesis by
suppressing proliferation, migration, and invasion. J Cell Biochem.
119:4717–4728. 2018. View Article : Google Scholar : PubMed/NCBI
|
|
24
|
Nakagawa Y, Nakayama H, Nagata M, Yoshida
R, Kawahara K, Hirosue A, Tanaka T, Yuno A, Matsuoka Y, Kojima T,
et al: Overexpression of fibronectin confers cell adhesion-mediated
drug resistance (CAM-DR) against 5-FU in oral squamous cell
carcinoma cells. Int J Oncol. 44:1376–1384. 2014. View Article : Google Scholar : PubMed/NCBI
|
|
25
|
Wang J, Deng L, Huang J, Cai R, Zhu X, Liu
F, Wang Q, Zhang J and Zheng Y: High expression of fibronectin 1
suppresses apoptosis through the NF-κB pathway and is associated
with migration in nasopharyngeal carcinoma. Am J Transl Res.
9:4502–4511. 2017.PubMed/NCBI
|
|
26
|
Waalkes S, Atschekzei F, Kramer MW,
Hennenlotter J, Vetter G, Becker JU, Stenzl A, Merseburger AS,
Schrader AJ, Kuczyk MA and Serth J: Fibronectin 1 mRNA expression
correlates with advanced disease in renal cancer. BMC Cancer.
10:5032010. View Article : Google Scholar : PubMed/NCBI
|
|
27
|
Glasner A, Levi A, Enk J, Isaacson B,
Viukov S, Orlanski S, Scope A, Neuman T, Enk CD, Hanna JH, et al:
NKp46 Receptor-Mediated Interferon-γ production by natural killer
cells increases fibronectin 1 to alter tumor architecture and
control metastasis. Immunity. 48:107–119.e4. 2018. View Article : Google Scholar : PubMed/NCBI
|
|
28
|
Chen W, Wang J, Shi J, Yang X, Yang P,
Wang N, Yang S, Xie T, Yang H, Zhang M, et al: Longevity effect of
liuwei dihuang in both caenorhabditis elegans and aged mice. Aging
Dis. 10:578–591. 2019. View Article : Google Scholar : PubMed/NCBI
|
|
29
|
Cao J, Huang M, Guo L, Zhu L, Hou J, Zhang
L, Pero A, Ng S, El Gaamouch F, Elder G, et al: Microrna-195
rescues Apoe4-Induced cognitive deficits and lysosomal defects in
Alzheimer's disease pathogenesis. Mol Psychiatry. 26:4687–4701.
2021. View Article : Google Scholar : PubMed/NCBI
|
|
30
|
Wu C, Qi X, Qiu Z, Deng G and Zhong L: Low
expression of KIF20A suppresses cell proliferation, promotes
chemosensitivity and is associated with better prognosis in HCC.
Aging (Albany NY). 13:22148–22163. 2021. View Article : Google Scholar : PubMed/NCBI
|
|
31
|
Shi Y, Liu W, Yang Y, Ci Y and Shi L:
Exploration of the shared molecular mechanisms between COVID-19 and
neurodegenerative diseases through bioinformatic analysis. Int J
Mol Sci. 24:48392023. View Article : Google Scholar : PubMed/NCBI
|
|
32
|
Shi J, Shui D, Su S, Xiong Z and Zai W:
Gene enrichment and co-expression analysis shed light on
transcriptional responses to Ralstonia solanacearum in tomato. BMC
Genomics. 24:1592023. View Article : Google Scholar : PubMed/NCBI
|
|
33
|
Li M, Wang K, Zhang Y, Fan M, Li A, Zhou
J, Yang T, Shi P, Li D, Zhang G, et al: Ferroptosis-Related genes
in bronchoalveolar lavage fluid serves as prognostic biomarkers for
idiopathic pulmonary fibrosis. Front Med (Lausanne). 8:6939592021.
View Article : Google Scholar : PubMed/NCBI
|
|
34
|
Yi X, Wan Y, Cao W, Peng K, Li X and Liao
W: Identification of four novel prognostic biomarkers and
construction of two nomograms in adrenocortical carcinoma: A
Multi-Omics data study via bioinformatics and machine learning
methods. Front Mol Biosci. 9:8780732022. View Article : Google Scholar : PubMed/NCBI
|
|
35
|
Yu J, Zhang H, Zhang Y and Zhang X:
Integrated analysis of the altered lncRNA, microRNA, and mRNA
expression in HBV-Positive hepatocellular carcinoma. Life (Basel).
12:7012022.PubMed/NCBI
|
|
36
|
Zhou J, Guo H, Liu L, Feng M, Yang X and
Hao S: Pyroptosis patterns of colon cancer could aid to estimate
prognosis, microenvironment and immunotherapy: Evidence from
Multi-Omics analysis. Aging (Albany NY). 14:7547–7567. 2022.
View Article : Google Scholar : PubMed/NCBI
|
|
37
|
Yin S, Li X, Xiong Z, Xie M, Jin L, Chen
H, Mao C, Zhang F and Lian L: A novel ceRNA-Immunoregulatory axis
based on immune cell infiltration in ulcerative colitis-associated
colorectal carcinoma by integrated weighted gene co-expression
network analysis. BMC Gastroenterol. 22:1882022. View Article : Google Scholar : PubMed/NCBI
|
|
38
|
Adegoke A, Ribeiro JMC, Smith RC and Karim
S: Tick innate immune responses to hematophagy and Ehrlichia
infection at single-cell resolution. Front Immunol. 14:13059762023.
View Article : Google Scholar : PubMed/NCBI
|
|
39
|
Shaw TI, Wagner J, Tian L, Wickman E,
Poudel S, Wang J, Paul R, Koo SC, Lu M, Sheppard H, et al:
Discovery of immunotherapy targets for pediatric solid and brain
tumors by Exon-Level expression. Nat Commun. 15:37322024.
View Article : Google Scholar : PubMed/NCBI
|
|
40
|
Pan Y, Wu L, He S, Wu J, Wang T and Zang
H: Identification of hub genes in thyroid carcinoma to predict
prognosis by integrated bioinformatics analysis. Bioengineered.
12:2928–2940. 2021. View Article : Google Scholar : PubMed/NCBI
|
|
41
|
Liu T, Men Q, Su X, Chen W, Zou L, Li Q,
Song M, Ouyang D, Chen Y, Li Z, et al: Downregulated expression of
TSHR is associated with distant metastasis in thyroid cancer. Oncol
Lett. 14:7506–7512. 2017.PubMed/NCBI
|
|
42
|
Xia E, Bhandari A, Shen Y, Zhou X and Wang
O: LncRNA LINc00673 induces proliferation, metastasis and
Epithelial-Mesenchymal transition in thyroid carcinoma via
Kruppel-Like factor 2. Int J Oncol. 53:1927–1938. 2018.PubMed/NCBI
|
|
43
|
Zhang XX, Luo JH and Wu LQ: Fn1
overexpression is correlated with unfavorable prognosis and immune
infiltrates in breast cancer. Front Genet. 13:9136592022.
View Article : Google Scholar : PubMed/NCBI
|
|
44
|
Geng QS, Huang T, Li LF, Shen ZB, Xue WH
and Zhao J: Over-Expression and prognostic significance of FN1,
correlating with immune infiltrates in thyroid cancer. Front Med
(Lausanne). 8:8122782021. View Article : Google Scholar : PubMed/NCBI
|
|
45
|
Huo X, Ma S, Wang C, Song L, Yao B, Zhu S,
Li P, Wang L, Wu Z and Wang K: Unravelling the role of immune cells
and FN1 in the recurrence and therapeutic process of skull base
chordoma. Clin Transl Med. 13:e14292023. View Article : Google Scholar : PubMed/NCBI
|
|
46
|
Ashok G and Ramaiah S: Fn1 and
cancer-associated fibroblasts markers influence immune
microenvironment in clear cell renal cell carcinoma. J Gene Med.
25:e35562023. View Article : Google Scholar : PubMed/NCBI
|
|
47
|
Zhang L, Wang Y, Song M, Chang A, Zhuo W
and Zhu Y: Fibronectin 1 as a key gene in the genesis and
progression of Cadmium-Related bladder cancer. Biol Trace Elem Res.
201:4349–4359. 2023. View Article : Google Scholar : PubMed/NCBI
|
|
48
|
Li J, Chen C, Chen B and Guo T: High FN1
expression correlates with gastric cancer progression. Pathol Res
Pract. 239:1541792022. View Article : Google Scholar : PubMed/NCBI
|
|
49
|
Chen C, Ye L, Yi J, Liu T and Li Z:
Correction: FN1-mediated activation of aspartate metabolism
promotes the progression of Triple-Negative and luminal a breast
cancer. Breast Cancer Res Treat. 204:425–427. 2024. View Article : Google Scholar : PubMed/NCBI
|
|
50
|
Karaulov AV, Gurina NN, Novikov DV, Fomina
SG and Novikov VV: Role of Muc1 expression in tumor progression.
Vestn Ross Akad Med Nauk. 71:392–396. 2016.(In Russian). PubMed/NCBI
|
|
51
|
Schroeder JA, Adriance MC, Thompson MC,
Camenisch TD and Gendler SJ: MUC1 alters beta-catenin-dependent
tumor formation and promotes cellular invasion. Oncogene.
22:1324–1332. 2003. View Article : Google Scholar : PubMed/NCBI
|
|
52
|
Saha SK, Choi HY, Kim BW, Dayem AA, Yang
GM, Kim KS, Yin YF and Cho SG: KRT19 directly interacts with
β-catenin/RAC1 complex to regulate NUMB-dependent NOTCH signaling
pathway and breast cancer properties. Oncogene. 36:332–349. 2017.
View Article : Google Scholar : PubMed/NCBI
|
|
53
|
Yao H, Yang Z, Liu Z, Miao X, Yang L, Li
D, Zou Q and Yuan Y: Glypican-3 and KRT19 are markers associating
with metastasis and poor prognosis of pancreatic ductal
adenocarcinoma. Cancer Biomark. 17:397–404. 2016. View Article : Google Scholar : PubMed/NCBI
|
|
54
|
Yi J, Tian M, Hu L, Kang N, Ma W, Zhi J,
Zheng X, Ruan X and Gao M: The mechanisms of celastrol in treating
papillary thyroid carcinoma based on network pharmacology and
experiment verification. Ann Transl Med. 9:8662021. View Article : Google Scholar : PubMed/NCBI
|
|
55
|
Sasca D, Szybinski J, Schüler A, Shah V,
Heidelberger J, Haehnel PS, Dolnik A, Kriege O, Fehr EM, Gebhardt
WH, et al: NCAM1 (CD56) promotes leukemogenesis and confers drug
resistance in AML. Blood. 133:2305–2319. 2019. View Article : Google Scholar : PubMed/NCBI
|
|
56
|
Wu H, Fu Z, Li H, Fang F, He B, Ye Y, Wu
H, Xu D, Zheng H and Zhang Q: TRIB3, as a robust prognostic
biomarker for HNSC, is associated with poor immune infiltration and
cancer cell immune evasion. Front Immunol. 14:12908392023.
View Article : Google Scholar : PubMed/NCBI
|