Introduction
Adult soft-tissue sarcoma (ASTS) encompasses a wide
array of rare solid tumors, stemming from mesenchymal tissue, with
~175 distinct subtypes (1).
Epidemiologically, ASTS accounts for merely 1% of all human
malignancies (2), with >13,000
new cases identified in the United States as per the 2019 Cancer
Statistics report (3). Recently,
advancements have been made in treatments for ASTS, including
surgical resection, chemotherapy, targeted therapy, immunotherapy
and radiotherapy (3,4). Despite these advancements, the overall
survival (OS) prognosis for patients with ASTS remains poor, with a
5-year survival rate of ~65% (5),
largely due to the high risk of local recurrence and
metastasis.
Metastasis is a predominant cause of mortality among
patients with ASTS, affecting 40–50% within 5 years of diagnosis
(3). Patients with metastatic
disease have a median survival rate of 12–16 months, with a 2-year
survival rate of just 30% (6). Lung
metastases are the most common, yet the precise molecular processes
that drive metastasis are still not well understood (3). While clinical data can predict
outcomes to some extent, its predictive accuracy is constrained by
complex tumor regulatory factors. In the era of genetics, several
studies have endeavored to develop prognostic prediction models
focusing on specific gene functions, such as immune- or
hypoxia-related genes (6,7). The adverse effects of metastasis on
the prognosis of ASTS necessitates the early detection of
metastatic indicators and the creation of a new prognostic model
using reliable markers with unbiased gene selection, which could
enhance our understanding of ASTS progression and lead to more
effective, personalized treatment strategies.
The objective of the present study was to develop
and validate a prognostic model [including actin γ2 (ACTG2),
apolipoprotein D (APOD), coatomer protein complex subunit γ2
imprinted transcript 1 (COPG2IT1), collagen type VI α6 chain
(COL6A6) and osteomodulin (OMD)] by comparing and analyzing
differentially expressed genes (DEGs) between metastatic and
non-metastatic ASTS cases, utilizing online databases, and to
explore the implications of this model in clinical samples.
Additionally, preliminary investigations were conducted into the
function of ACTG2 in a sarcoma cell line.
Materials and methods
Data collection and processing
The mRNA expression profiles of patients with ASTS
were sourced from the Gene Expression Omnibus (GEO) (https://www.ncbi.nlm.nih.gov/geo/query/acc.cgi?acc=GSE21050)
dataset initially created by Chibon et al (8), encompassing 310 sarcoma tissue samples
(accession no. GSE21050). These samples were categorized into a
metastasis group (n=122) and a non-metastasis group (n=188). Only
patients with complete information on survival and metastasis were
included in the analysis. The mRNA expression profiles comprised
54,613 entries, from which DEGs were identified using the DESeq
(https://cran.r-project.org/web/packages/DESeq2/index.html)
and Limma (https://cran.r-project.org/web/packages/limma/index.html)
R packages. DEGs in metastatic ASTS samples, compared with
non-metastatic samples, met stringent criteria, including an
adjusted P-value of <0.05 and an absolute log2-based fold-change
(FC) value of >1. Additionally, an external validation cohort of
ASTS samples was obtained from The Cancer Genome Atlas (TCGA)
database (https://portal.gdc.cancer.gov), which included 260
cases. Clinical profiles and survival information for these
datasets were downloaded simultaneously.
Establishment of the gene prediction
model
Following the established protocol, univariate,
least absolute shrinkage and selection operator (LASSO), and
multivariate Cox regression analyses were utilized to examine the
correlation between OS and gene expression levels in patients.
Initially, the prognostic significance of each
differentially expressed gene (DEG) was assessed using univariate
Cox regression analysis facilitated by the survival R package
(https://cran.r-project.org/web/packages/survival/index.html).
Genes achieving P<0.1 in this analysis were deemed
significant. Next, the significant prognostic genes for metastatic
ASTS were narrowed down using LASSO-penalized Cox regression. This
involved subsampling the dataset 1,000 times and selecting genes
that appeared in >900 of these samples. The tuning parameters
for LASSO were determined based on the Akaike Information Criterion
(AIC) (9) using an estimation of
the expected generalization error from 10-fold cross-validation,
and the highest λ-value was selected. Subsequently, multivariate
Cox regression analysis was conducted to evaluate the contribution
of each gene as an independent prognostic factor for OS. Next, a
forest map and a heatmap were generated to visually represent these
contributing genes. Finally, a prognostic risk score was
established for each patient using a linear combination of the gene
expression levels weighted by their respective regression
coefficients (β) from the multivariate Cox regression analysis. The
optimal cut-off for the risk score was determined using the median
value rule, which allowed us to categorize patients into low- and
high-risk groups, and construct Kaplan-Meier (KM) survival curves
for these groups.
Five genes identified as independent variables in
the multivariate Cox regression analysis were used to create a
nomogram to predict the annual OS probability for patients with
ASTS. Additionally, the receiver operating characteristic (ROC)
curve was plotted to evaluate the discrimination accuracy of the
nomogram and a calibration plot was used to assess its predictive
accuracy, using rms R software. (https://cran.r-project.org/web/packages/rms/index.html).
Functional enrichment analysis of
DEGs
DEGs were identified between the high- and low-risk
subgroups using specific criteria (adjusted P<0.05 and absolute
log2-based FC>1). The clusterProfiler (https://cran.r-project.org/web/packages/clusterProfiler/index.html),
ggplot2 (https://cran.r-project.org/web/packages/ggplot2/index.html)
and enrichplot packages (https://cran.r-project.org/web/packages/enrichplot/index.html)
were employed to conduct Gene Ontology (GO) and Kyoto Encyclopedia
of Genes and Genomes (KEGG) analyses based on these DEGs. The GO
analysis was segmented into three categories: Biological process
(BP), cellular component (CC) and molecular function (MF).
Immunocyte infiltration analysis
The RNA-sequencing expression profiles and
associated clinical information for patients with ASTS (key word
‘Sarcoma’) were obtained from TCGA dataset (https://portal.gdc.com). The proportions of the 10
types of immune cells in the high- and low-risk subgroups were
estimated using the TIMER2.0 algorithm, following the official
manual available on the TIMER2.0 website (http://timer.cistrome.org/). The ggstatsplot package
in R (https://github.com/IndrajeetPatil/ggstatsplot) was
utilized to establish the degree of correlation between gene
expression and immune score, while the pheatmap package in R
(https://cran.r-project.org/web/packages/pheatmap/index.html)
was used to identify correlations among multiple genes. Spearman's
correlation analysis was conducted to assess the correlation
between quantitative variables that were not normally distributed.
P<0.05 was considered to indicate a statistically significant
difference.
IHC staining of the sarcoma
samples
To explore the clinical relevance of these
predictive genes in a specific sarcoma subtype, 90 osteosarcoma
samples were collected from patients who had undergone surgical
resection at Shanghai Changzheng Hospital (Shanghai, China) and
Shanghai Pudong New Area People's Hospital (Shanghai, China)
between January 2017 and December 2020. The follow-up data was
obtained through outpatient service and telephone consultation.
Patients who were lost to follow-up were excluded. The mean age of
the patients was 32.2±20.2 years (range, 7–81 years), and the
cohort included 49 males and 41 females. This research was reviewed
and approved by the Medical Ethics Committees of Shanghai Pudong
New Area People's Hospital (no. K82 of 2021) and Shanghai
Changzheng Hospital (approval no. 2018SL004), and written informed
consent was obtained from all participants or their legal
guardians.
The samples were fixed in 4% paraformaldehyde at
room temperature for 6–12 h, sequentially dehydrated through a
graded ethanol series, embedded in paraffin and sectioned into 5-µm
slices. Immunohistochemical (IHC) staining for ACTG2 (cat. no.
ab231802; dilution, 1:200; Abcam), APOD (cat. no. ab108191;
dilution, 1:200; Abcam), COL6A6 (cat. no. HPA045239; dilution,
1:200; MilliporeSigma) and OMD (cat. no. ab154249; dilution, 1:200;
Abcam) was performed (incubated at 4°C overnight) following the
standard histological procedures outlined in the Histostain-Plus
(DAB) kit manual (Invitrogen; Thermo Fisher Scientific, Inc.). Goat
anti-rabbit antibody (cat. no. ab205718; dilution, 1:5,000; Abcam)
was used as the secondary antibody (incubated at room temperature
for 1 h). Given that COPG2IT1 is a non-protein coding RNA, IHC
staining was not applicable for this gene. The IHC staining results
were independently evaluated by three blinded observers based on
the sample characteristics. Staining intensity was rated on a scale
from 0 (negative) to 3 (strongly positive), and positivity was
quantified in four increments: 0 (<5%), 1 (5–25%), 2
(>25–50%), 3 (>50–75%) and 4 (>75%). The final staining
score, used to classify expression as either low (score ≤4) or high
(score ≥5), was calculated by multiplying the intensity by the
positivity rate.
Cell line and transfection
The human HOS cell line was sourced from the Cell
Bank of the China Center for Type Culture Collection of the Chinese
Academy of Sciences. Cells were maintained in Dulbecco's modified
Eagle's medium (DMEM) (Gibco; Thermo Fisher Scientific, Inc.)
supplemented with 10% fetal bovine serum (FBS) (Gibco; Thermo
Fisher Scientific, Inc.). Prior to experimentation, cells underwent
mycoplasma testing. Two short hairpin (sh)RNA sequences targeting
ACTG2 were obtained from Genomeditech; Jiman Biotechnology
(Shanghai) Co., Ltd. The target site of sh-ACTG2#1 was
5′-GAGAGAAATTGTGCGAGACAT-3′, and the target site of sh-ACTG2#2 was
5′-GCAGGTTATCACCATTGGCAA-3′. pGenesil-1 plasmid (Shanghai Genechem
Co., Ltd.) with non-mammalian targeted sequence was used as the
control of sh-ACTG2. Transfection of HOS cells was performed for 24
h at 37°C using Lipofectamine®2000 (Invitrogen; Thermo
Fisher Scientific, Inc.). shRNA plasmids (5 µg) mixed with
transfection reagent (10 µl) were added to each well of a 6-well
plate, according to the manufacturer's protocol. The cells were
then used for subsequent experiments from 24 h
post-transfection.
Reverse transcription quantitative
(RT-q)PCR assay
Total RNA from transfected HOS cells was extracted
using TRIzol® (Thermo Fisher Scientific, Inc.) and
reverse-transcribed into cDNA using Prime Script™ RT
Master Mix (Takara Bio Inc.), performed at 37°C for 30 min followed
by incubation for 5 sec at 85°C to inactivate the reverse
transcriptase, according to the manufacturer's protocol. The
forward primer of ACTG2 was 5′-GCGTGTAGCACCTGAAGAG-3′ and the
reverse primer was 5′-GAATGGCGACGTACATGGCA-3′. GAPDH was used as
the loading control, with the forward primer of
5′-GGAGTCCACTGGCGTCTTCA-3′ and the reverse primer of
5′-GGGGTGCTAAGCAGTTGGTG-3′. For qPCR, all reactions were performed
with a hot-start preincubation step of 5 min at 95°C, followed by
40 cycles of 25 sec at 95°C, 30 sec at 58°C and 20 sec at 72°C, and
a final 5 min step at 72°C using SYBR-Green qPCR Master Mix
(Selleck Chemicals) on a 7900HT Fast Real-Time PCR system (Thermo
Fisher Scientific, Inc.). Expression levels were calculated using
GAPDH as an internal control with the 2−ΔΔCq method
(10).
Western blot analysis
Cells were harvested with radioimmunoprecipitation
assay lysis buffer at 0°C for 30 min to obtain total proteins.
Proteins were quantified using a BCA Protein Assay kit (cat. no.
P0012S; Beyotime Institute of Biotechnology), and then 20 µg
protein/lane was separated on 10% gels using SDS-PAGE before
transfer to 0.22-mm nitrocellulose membranes. The nitrocellulose
membranes were blocked using 1% BSA for 20 min at 37°C. Subsequent
to washing with TBS for 10 min at room temperature three times, the
membranes were incubated overnight at 4°C with primary antibodies
against ACTG2 (1:1,000; cat. no. AF5351; Affinity Biosciences,
Ltd.) and β-actin (1:1,000; cat. no. AF7018; Affinity Biosciences,
Ltd.). The membranes were washed with TBS for 5 min at room
temperature three times. Proteins were detected through incubation
of the membranes with HRP-conjugated goat anti-rabbit IgG secondary
antibody (1:5,000; cat. no. ab205718; Abcam) at 37°C for 2 h.
Cell counting Kit-8 (CCK-8) assay
Transfected HOS cells at a seeding density of
5×10³ were distributed in 96-well plates and incubated
for 48 h before being analyzed using the CCK-8 Kit (Selleck
Chemicals). Incubation with CCK-8 was for 2 h. Absorbance was
measured at 450 nm using an ELx800 microplate reader (BioTek
Instruments, Inc.).
Wound-healing assay
Transfected HOS cells were cultured in 12-well
plates. Once cell density reached ≥90%, the cell monolayer was
scored with a 200-µl pipette tip to create a scratch, and then
cultured with 2% FBS for 48 h. Wound healing was monitored by phase
contrast microscopy and quantified by measuring the wound
distance.
Transwell assay
An 8-µm pore size Transwell chamber precoated with
Matrigel (cat. no. 354480) when purchased (Corning, Inc.) was
employed to assess transfected HOC cell invasion. Chambers were
seeded with 1×10⁵ cells in 100 µl serum-free DMEM, while
the lower chamber was filled with 500 µl DMEM enriched with 10% FBS
to serve as a chemoattractant. After incubation at 37°C for 24 h,
cells that had invaded the lower membrane surface were fixed with
4% paraformaldehyde for 20 min at room temperature, stained with
0.1% crystal violet for 30 min at room temperature, and then
counted under a light microscope at ×400 magnification.
Statistical analysis
Statistical analyses were performed using SPSS
software (version 21.0; IBM Corp.) and R language software
(https://www.r-project.org/; version
R-4.0.3). Data are presented as the mean ± standard deviation.
Survival curves were generated using the KM method, and the
log-rank test (pooled over strata) was used to analyze differences
in survival between patient groups. Comparisons of qPCR, CCK8,
wound-healing and Transwell assays were conducted using the one-way
ANOVA analysis followed by Dunnett's (for data with unequal
variances) or Fisher's least significant difference post hoc tests
(for data with equal variances). P<0.05 was considered to
indicate a statistically significant difference. All experimental
procedures were repeated at least three times.
Results
Establishment of the prognosis
prediction model for patients with ASTS based on metastatic gene
features
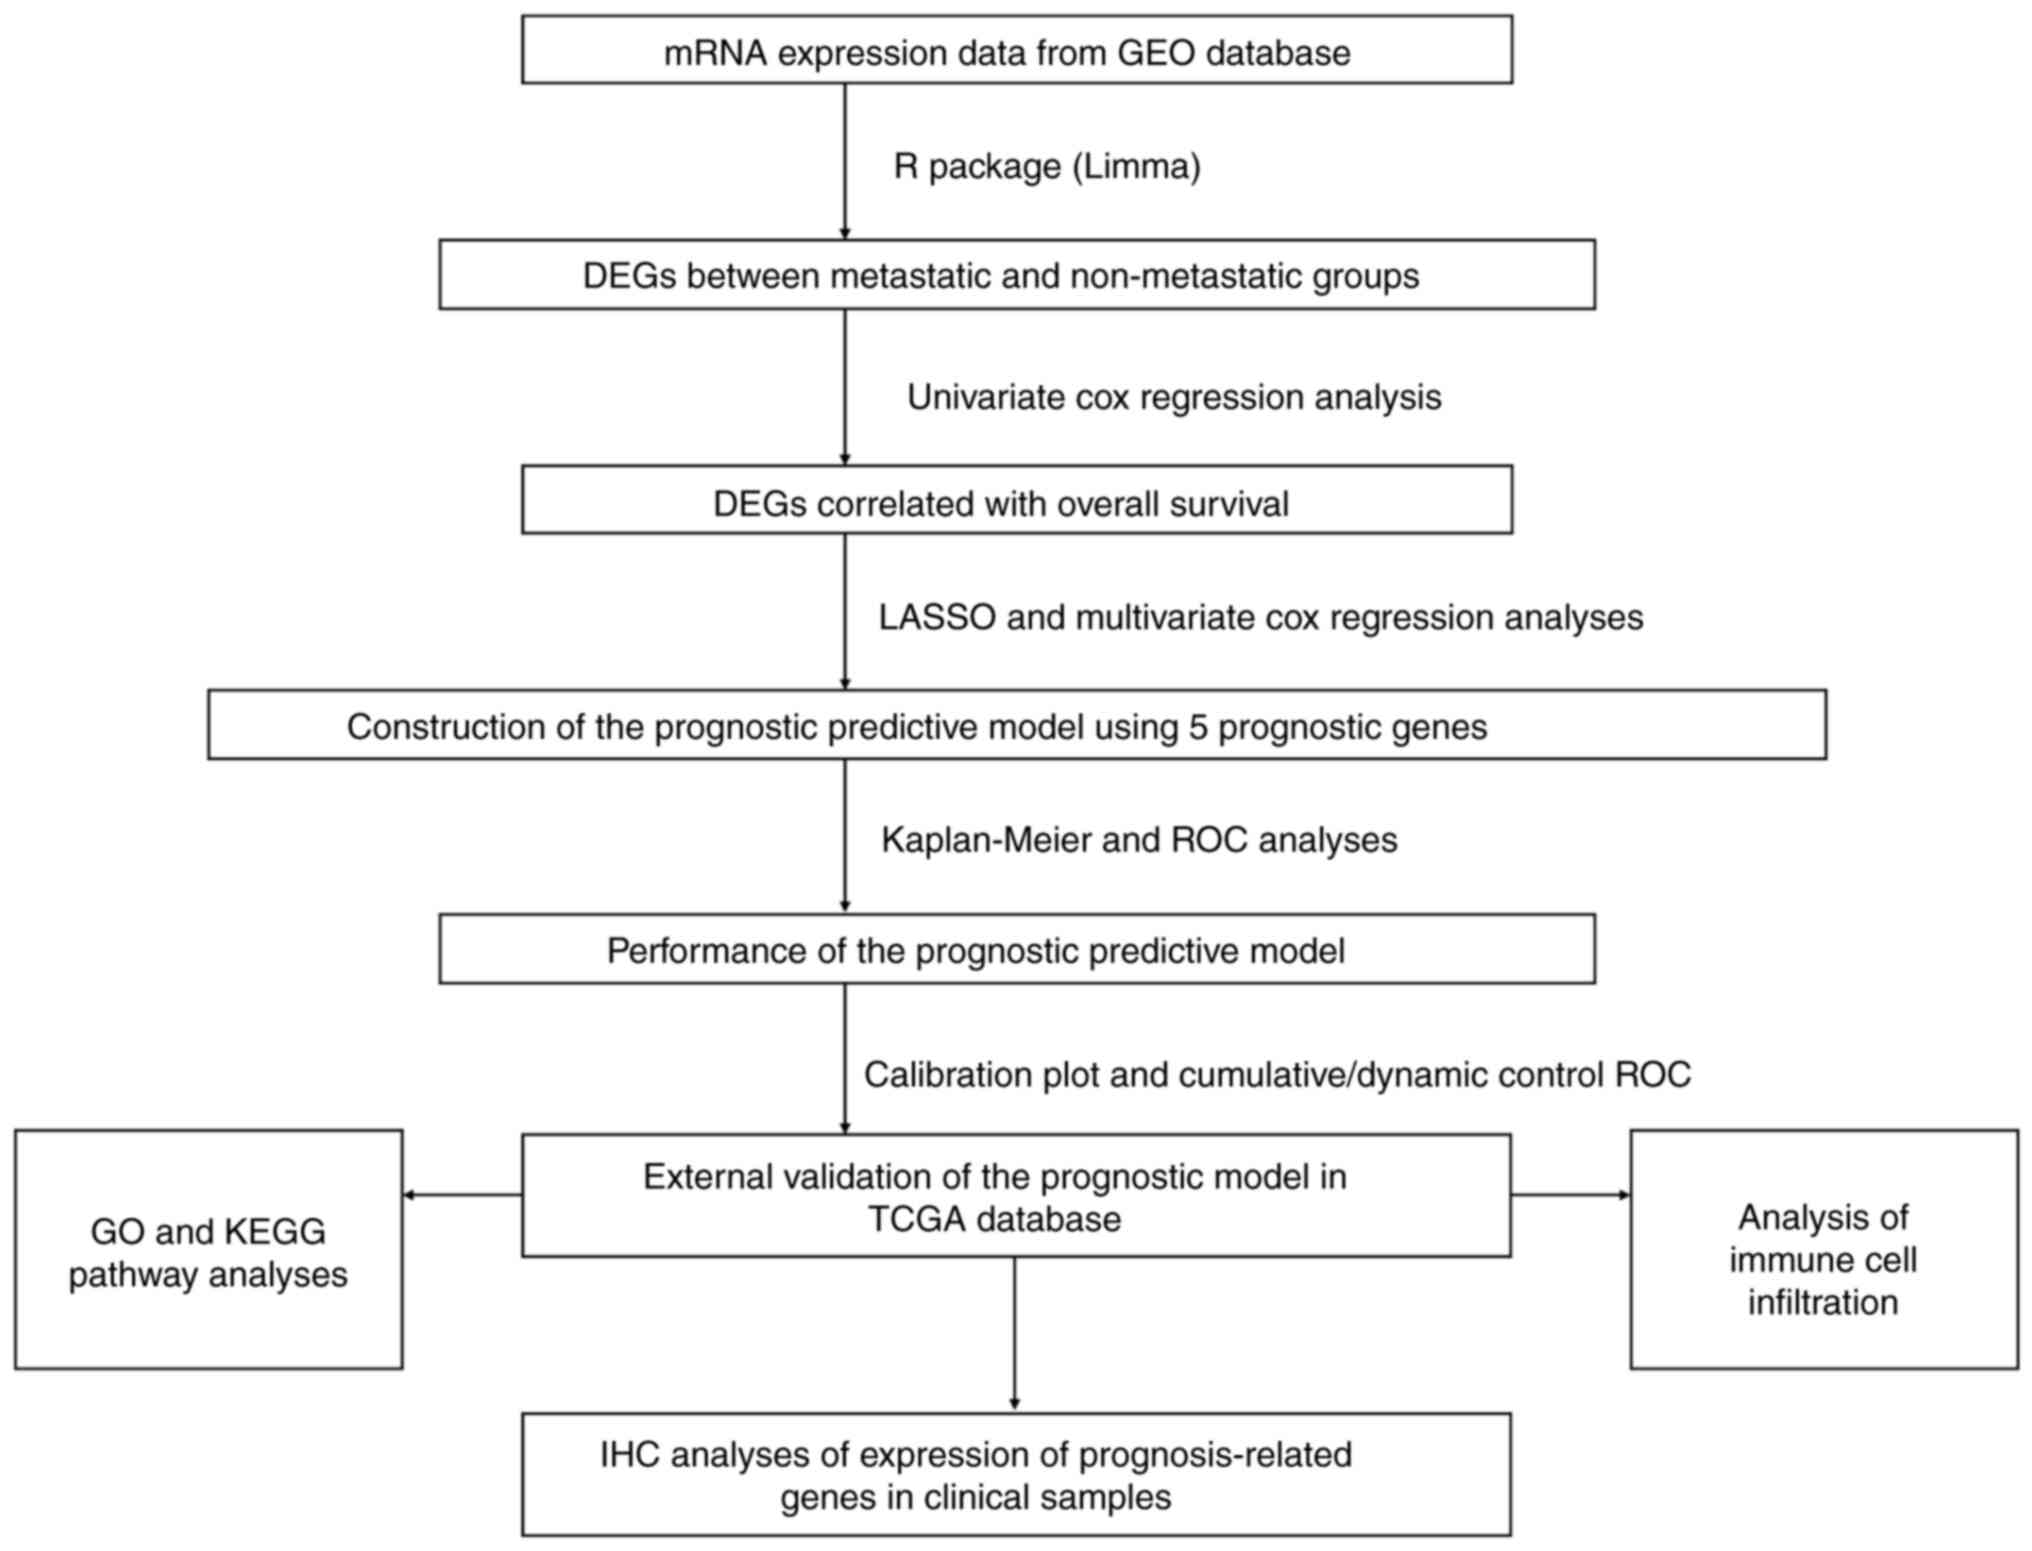
The present study followed the procedural flow chart
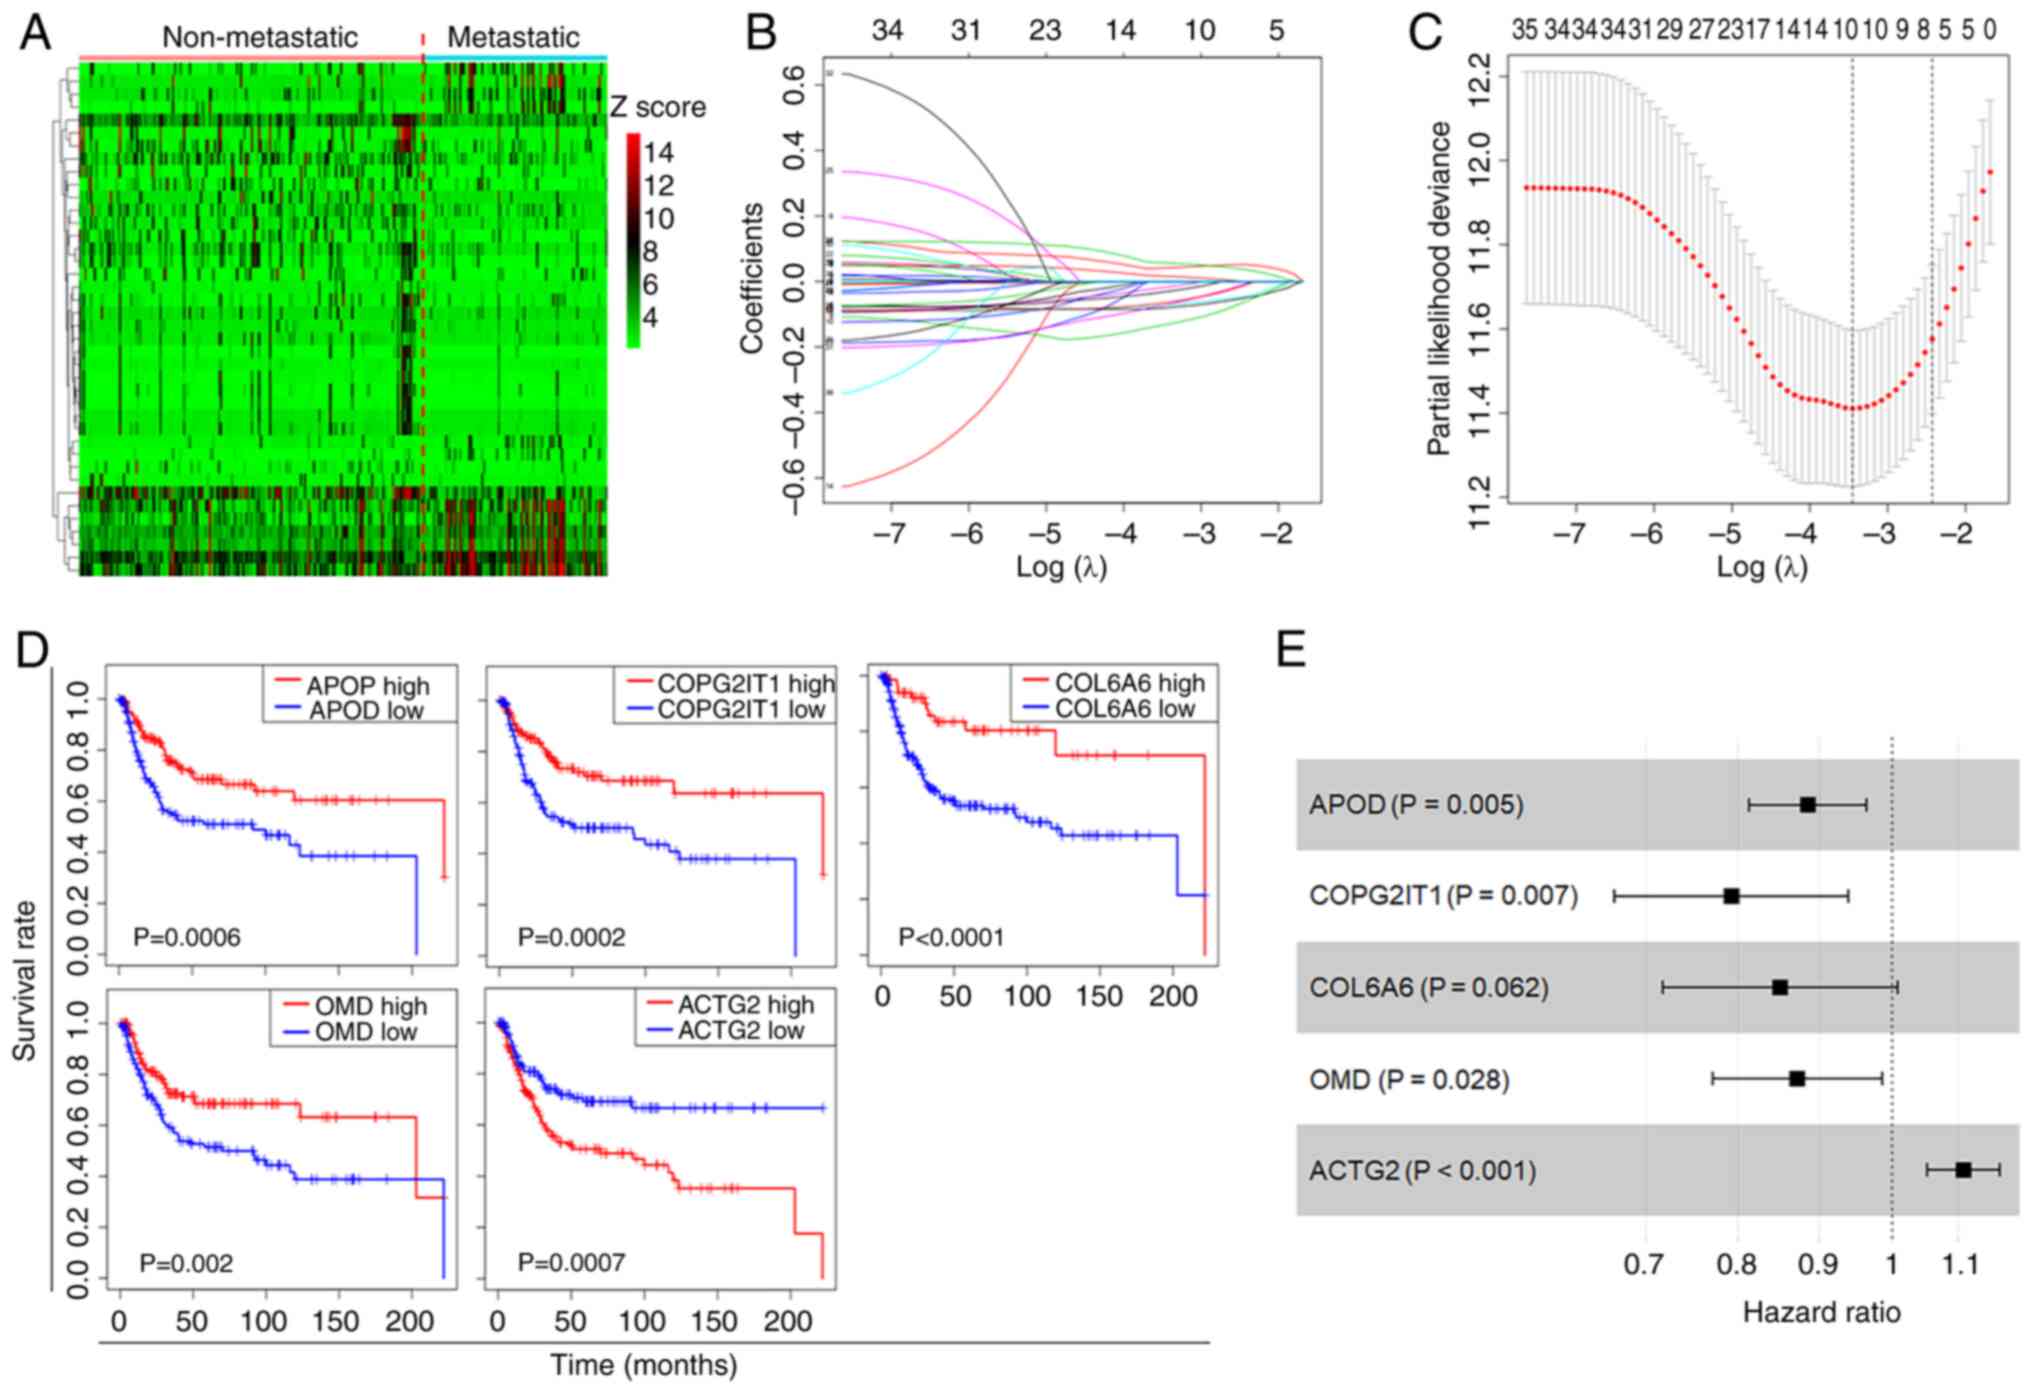
depicted in Fig. 1. DEGs between
metastatic and non-metastatic ASTS samples from the GEO dataset
(GSE21050) were identified using the DESeq and Limma R packages
(Fig. 2A). The univariate Cox
regression model was employed to pinpoint DEGs significantly
associated with the OS of patients with ASTS. Following variable
selection by LASSO regression, five critical genes were identified:
ACTG2, APOD, COPG2IT1, COL6A6 and OMD (Fig. 2B and C). KM curves illustrated the
significant correlation between the presence of these genes and the
OS of patients with ASTS (Fig. 2D).
Using multivariate Cox regression analysis, a regression model was
formulated (Fig. 2E), and a
prognostic risk score was calculated for further analysis: Risk
score=ACTG2 exp. × 0.10297 + APOD exp. × (−0.1223) + COPG2IT1 exp.
× (−0.23284) + COL6A6 exp. × (−0.16208) + OMD exp. × (−0.13717).
The Cox coefficients and hazard ratios are detailed in Table I. Only the P-value for COL6A6 was
>0.05, while the remaining results were significant.
 | Table I.Multivariate Cox regression analysis
of genes for overall survival. |
Table I.
Multivariate Cox regression analysis
of genes for overall survival.
| Gene | Coef | HR | 95% CI | P-value |
|---|
| ACTG2 | 0.103 | 1.1085 | 1.0517–1.1682 | 0.0001 |
| APOD | −0.1223 | 0.8849 | 0.8128–0.9634 | 0.0048 |
| COPG2IT1 | −0.2328 | 0.7923 | 0.6689–0.9385 | 0.0070 |
| COL6A6 | −0.1621 | 0.8504 | 0.7174–1.0079 | 0.0617 |
| OMD | −0.1372 | 0.8718 | 0.7711–0.9857 | 0.0285 |
Performance of the prognosis
prediction model
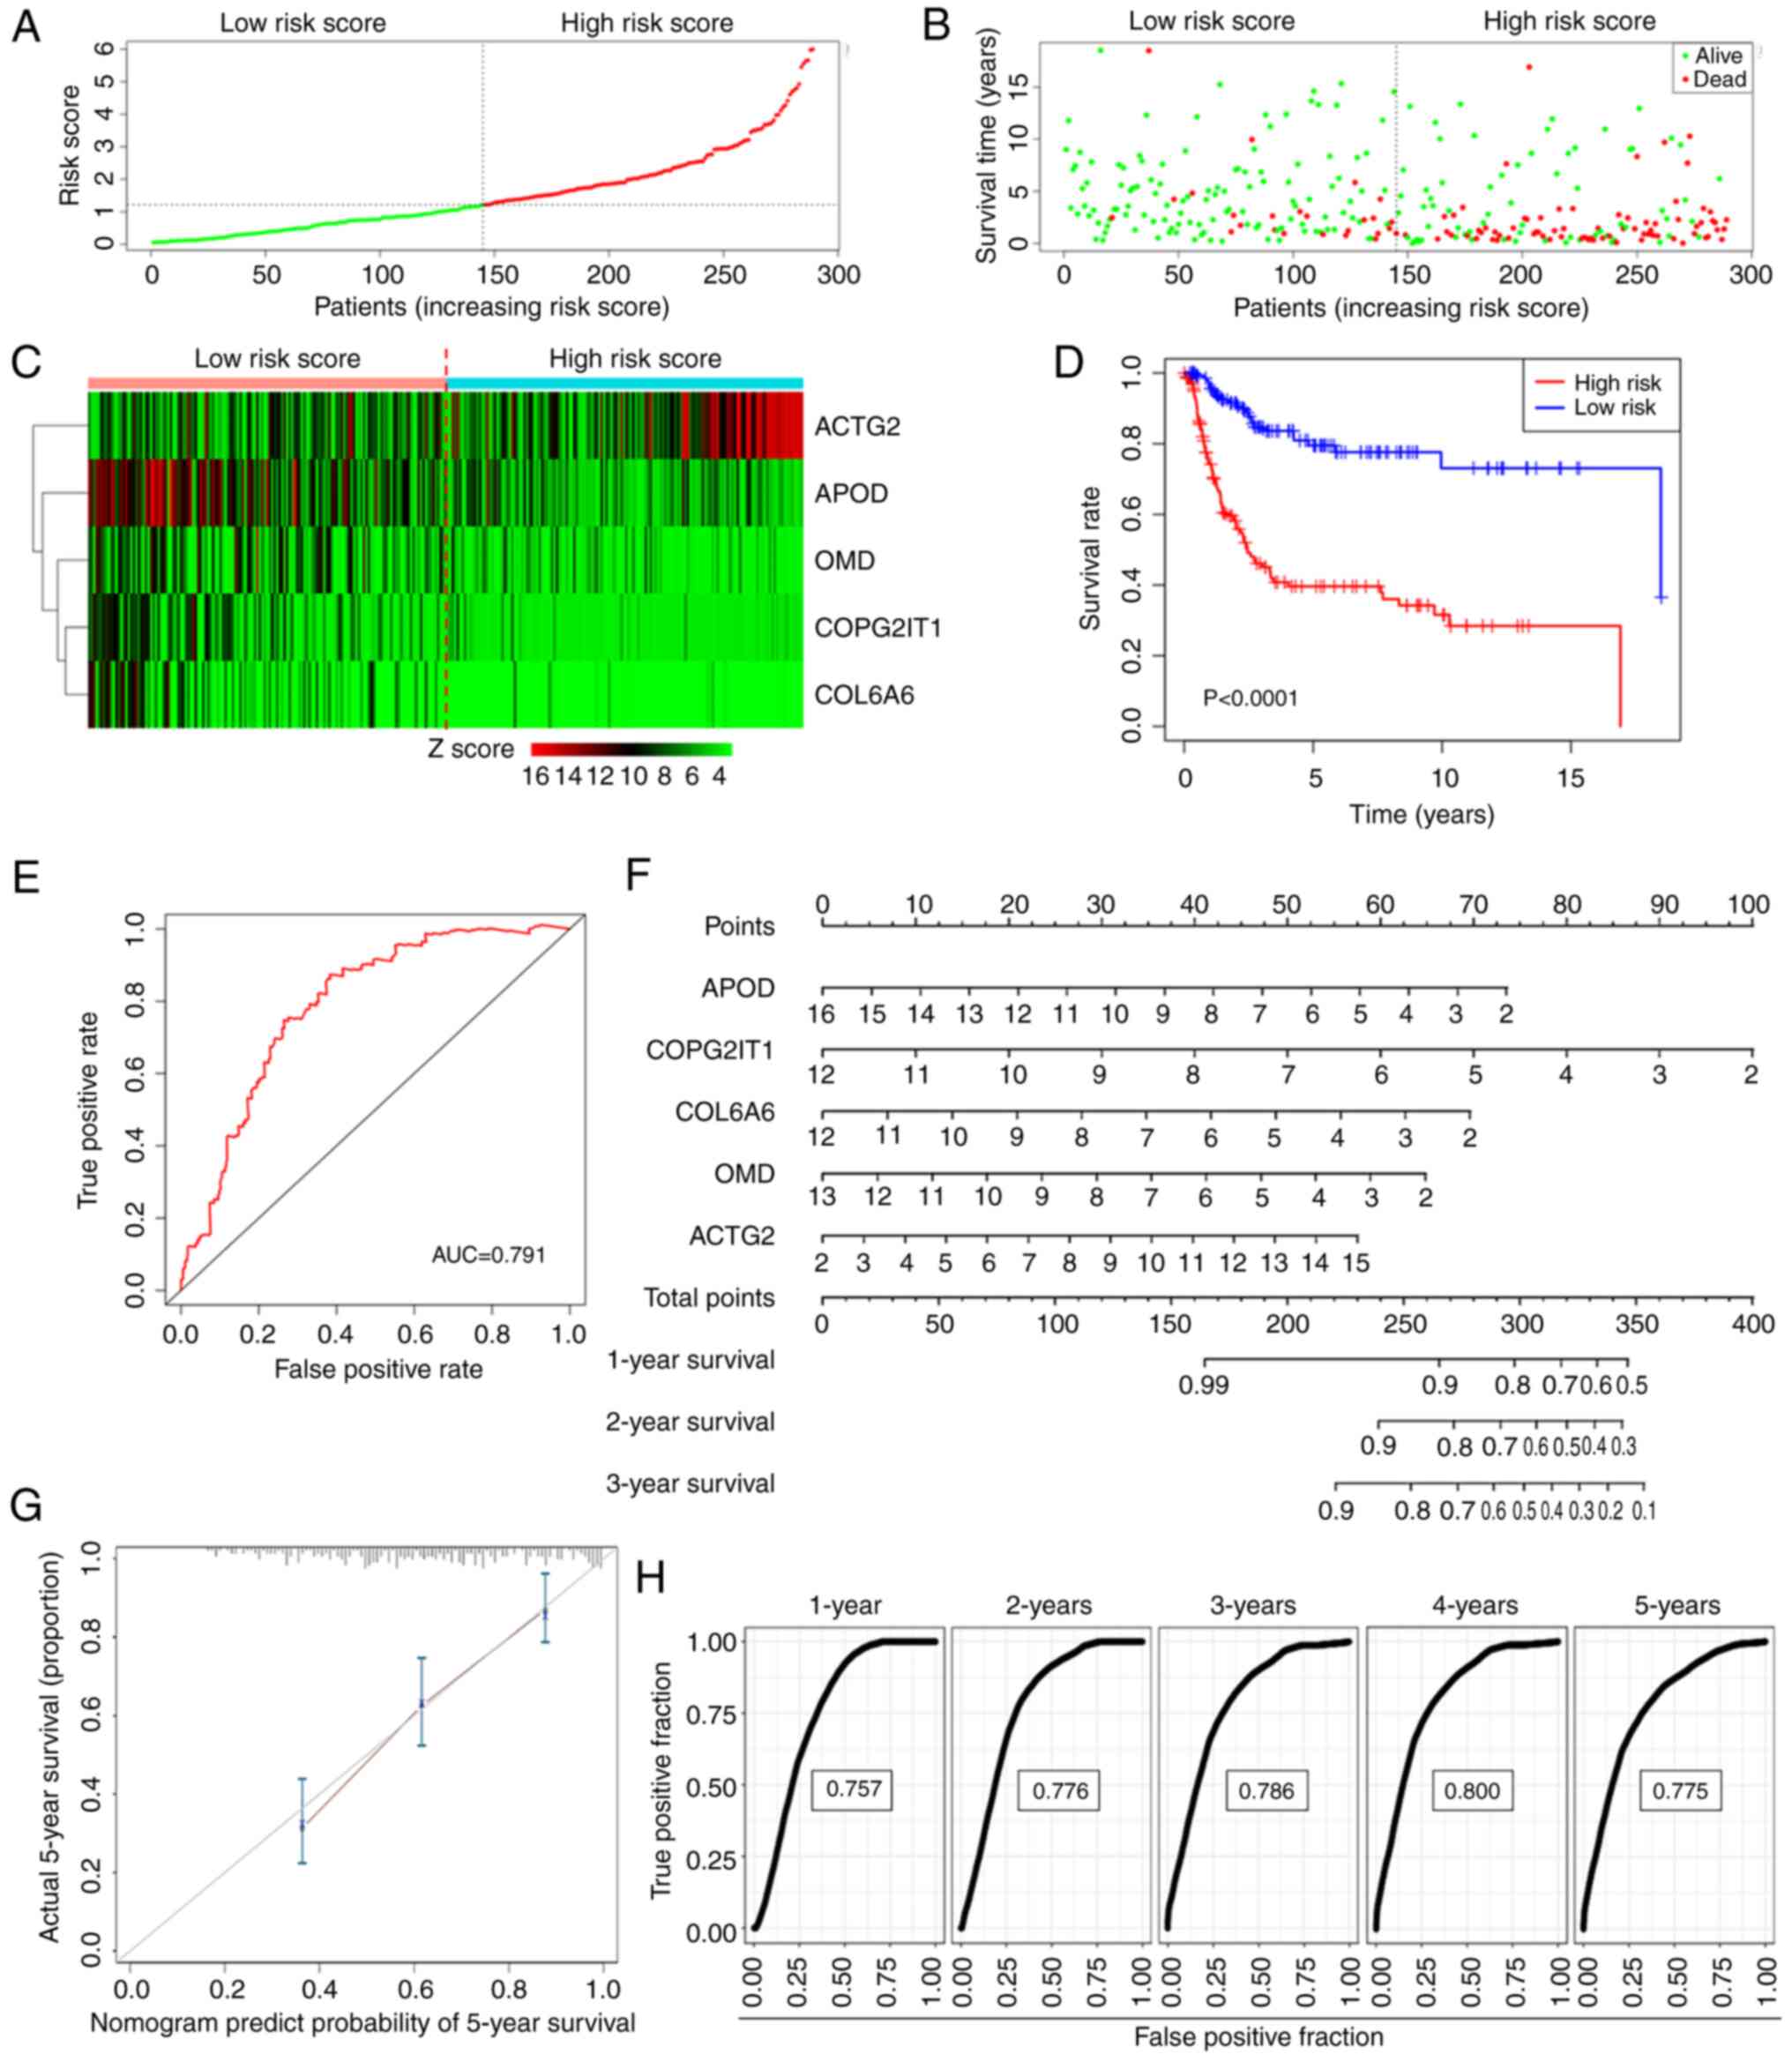
Utilizing the median rule for risk scoring, patients
were categorized into high- and low-risk groups (Fig. 3A). Patients in the high-risk group
exhibited a higher mortality rate and shorter survival time
compared with those in the low-risk group (Fig. 3B). The expression patterns of the
five genes in both groups are illustrated in the form of a heatmap
in Fig. 3C. The KM curve further
confirmed that the high-risk group experienced significantly
shorter OS times than the low-risk group (Fig. 3D). The ROC curve for the risk score
in predicting survival is depicted in Fig. 3E, demonstrating an area under the
curve (AUC) of 0.791.
To project the annual survival rates of patients
with ASTS, a nomogram was developed based on this metastasis-driven
prognosis prediction model (Fig.
3F). Calibration plots showed excellent agreement between the
predicted outcomes of the nomogram and actual clinical results
(Fig. 3G). ROC analysis was
employed to determine the sensitivity and specificity of the
nomogram, with the AUC values being 0.757 at 1 year, 0.776 at 2
years, 0.786 at 3 years, 0.800 at 4 years and 0.775 at 5 years
(Fig. 3H). These findings
underscore the exceptional predictive capability of the risk
score.
External validation of the
metastatic-based prognosis prediction model in TCGA dataset
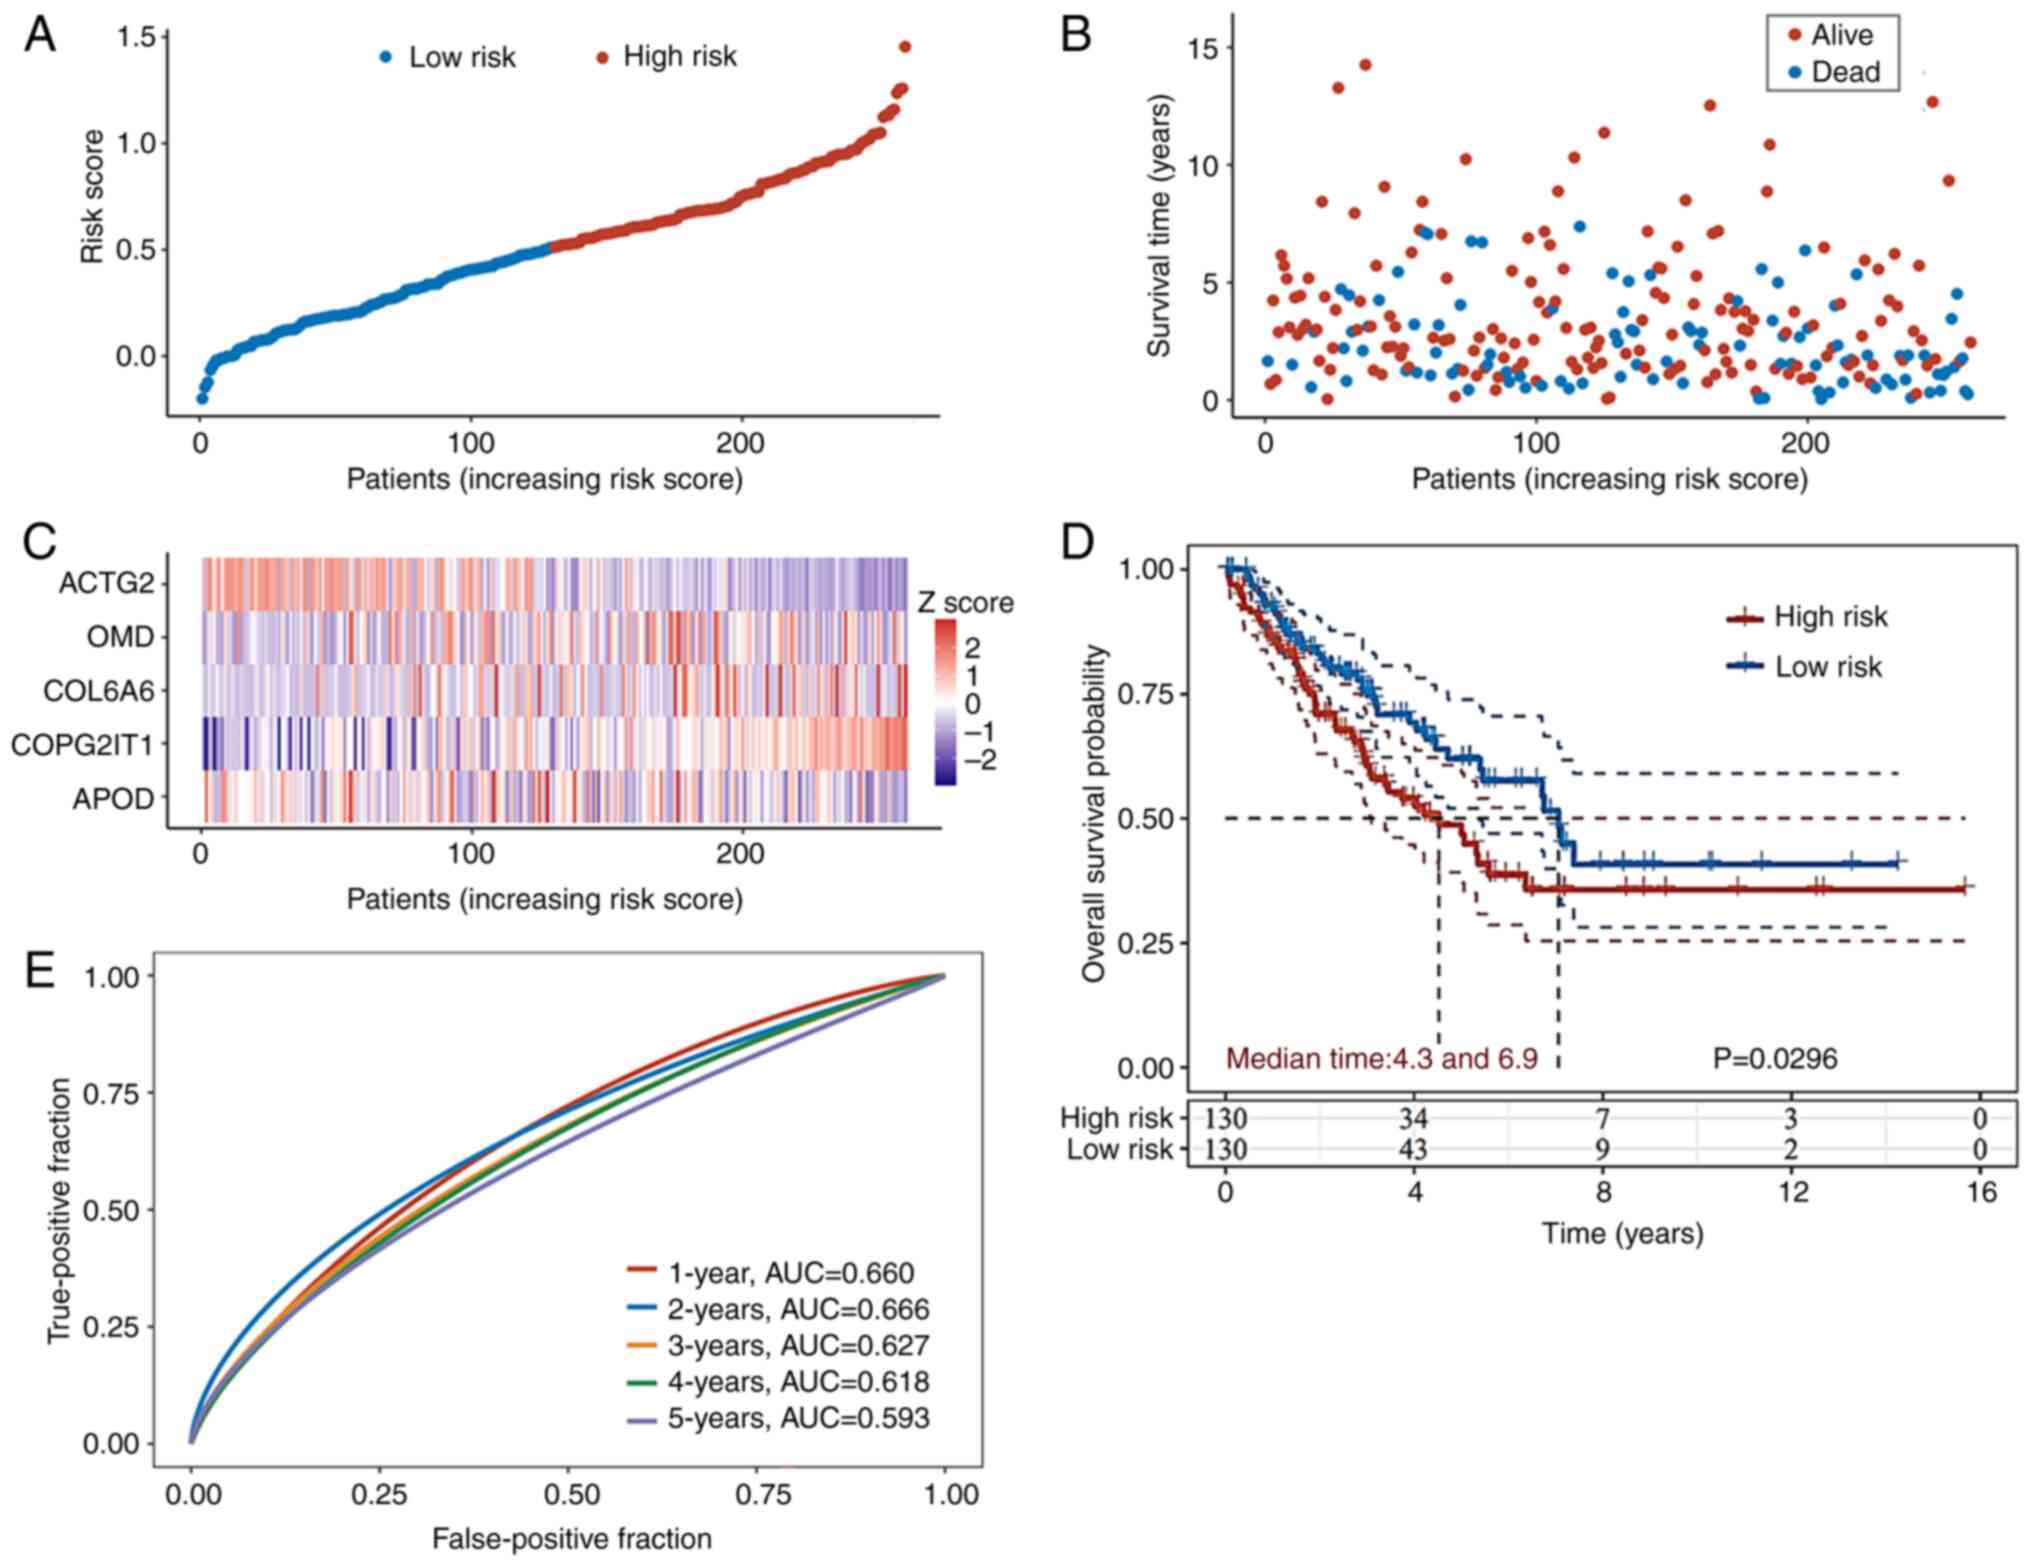
To verify the robustness of the prognosis prediction
model, RNA-Seq data along with processed survival information for
patients with ASTS were obtained from TCGA database. A cohort of
260 patients was classified into high- or low-risk groups using the
median value derived from the same formula used in the GEO database
(Fig. 4A). The high-risk group
exhibited higher mortality rates and shorter survival durations
compared to the low-risk group (Fig.
4B). The distribution of the expression levels of the five
genes in the prognosis prediction model in both groups is depicted
in the form of a heatmap in Fig.
4C. The KM curves further illustrate that the high-risk group
in TCGA validation set had significantly lower OS times than the
low-risk group (Fig. 4D). ROC
analysis was conducted to evaluate the predictive accuracy of the
nomogram system from the GEO database for the annual survival
rates. In TCGA validation cohort, the AUC values on the ROC curve
were 0.660 at 1 year, 0.666 at 2 years, 0.627 at 3 years, 0.618 at
4 years and 0.593 at 5 years (Fig.
4E).
Functional analysis between high- and
low-risk groups
To delve into the biological functions and pathways
associated with the risk model, DEGs that varied between the two
risk groups were identified in both the GEO and TCGA datasets,
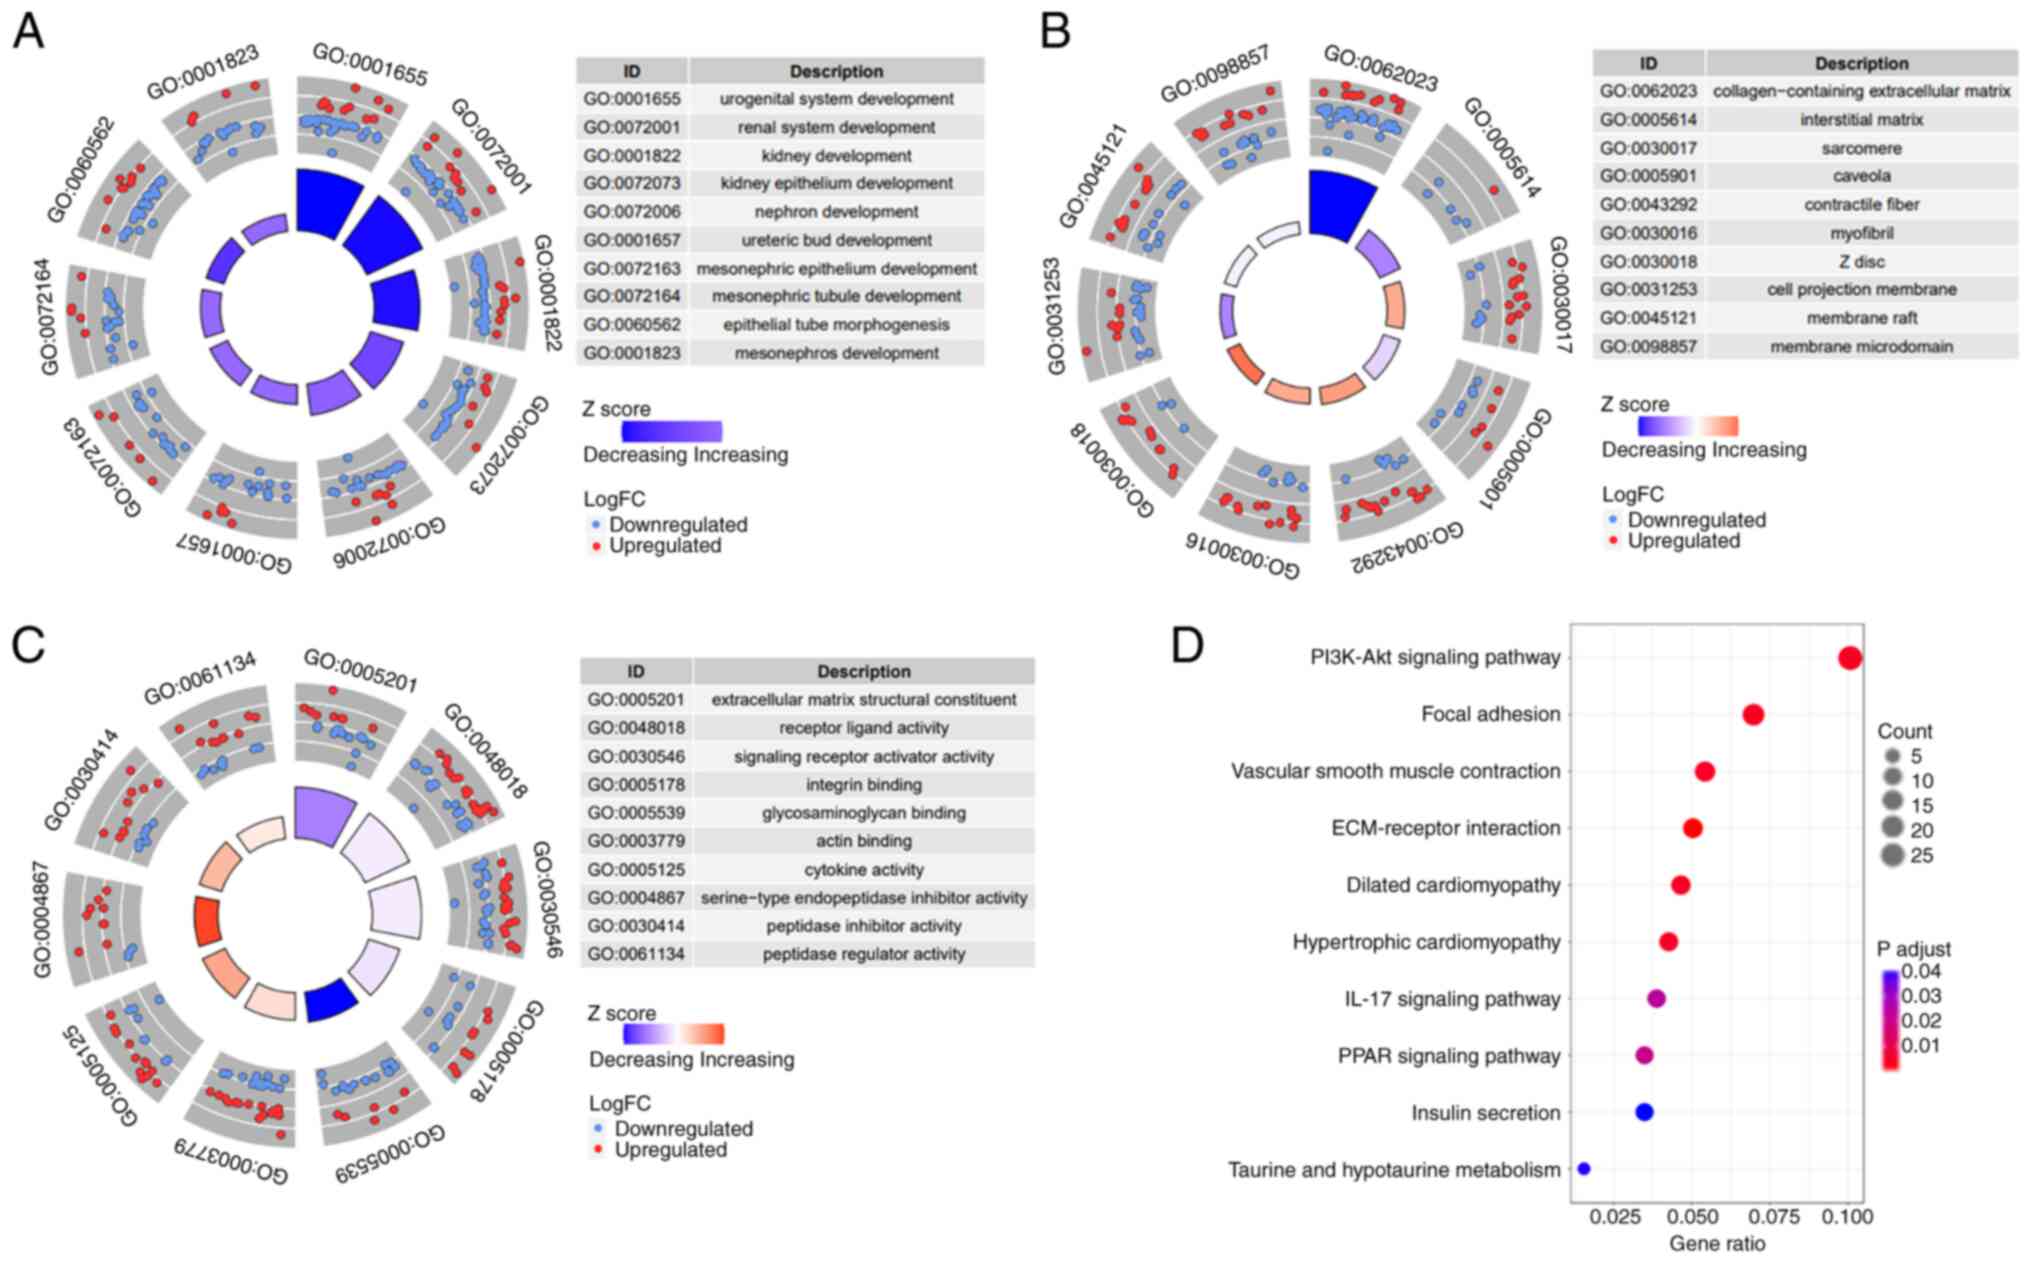
followed by GO and KEGG analyses of these DEGs. The BP component of
the GO analysis revealed significant alterations in
development-related pathways between the two risk groups in both
the GEO (Fig. 5A) and TCGA
(Fig. S1A) datasets, indicating
increased tumor cell stemness in high-risk cases (11). The CC and MF components of the GO
analysis identified significant changes in collagen, extracellular
matrix (ECM) and actin binding pathways between the groups in the
GEO (Fig. 5B and C) and TCGA
(Fig. S1B and C) datasets. These
pathways are closely linked to tumor cell migration and metastasis
(12,13), suggesting modifications in the tumor
microenvironment during ASTS metastasis (12,14).
KEGG pathway analysis indicated the activation of several
migration-related pathways in high-risk cases, such as ‘focal
adhesion’ and ‘ECM-receptor interaction’ pathways, across both GEO
(Fig. 5D) and TCGA (Fig. S1D) datasets. Additionally,
activation of the ‘PI3K-Akt signaling pathway’ was observed in the
high-risk group, highlighting the potential of targeted therapy
that addresses the PI3K-Akt pathway in high-risk patients.
Immune infiltration based on risk
signature
The immune microenvironment is crucial in the
pathology of tumors (15). Immune
checkpoint therapies are increasingly applied in the clinical
management of several types of sarcoma (16,17).
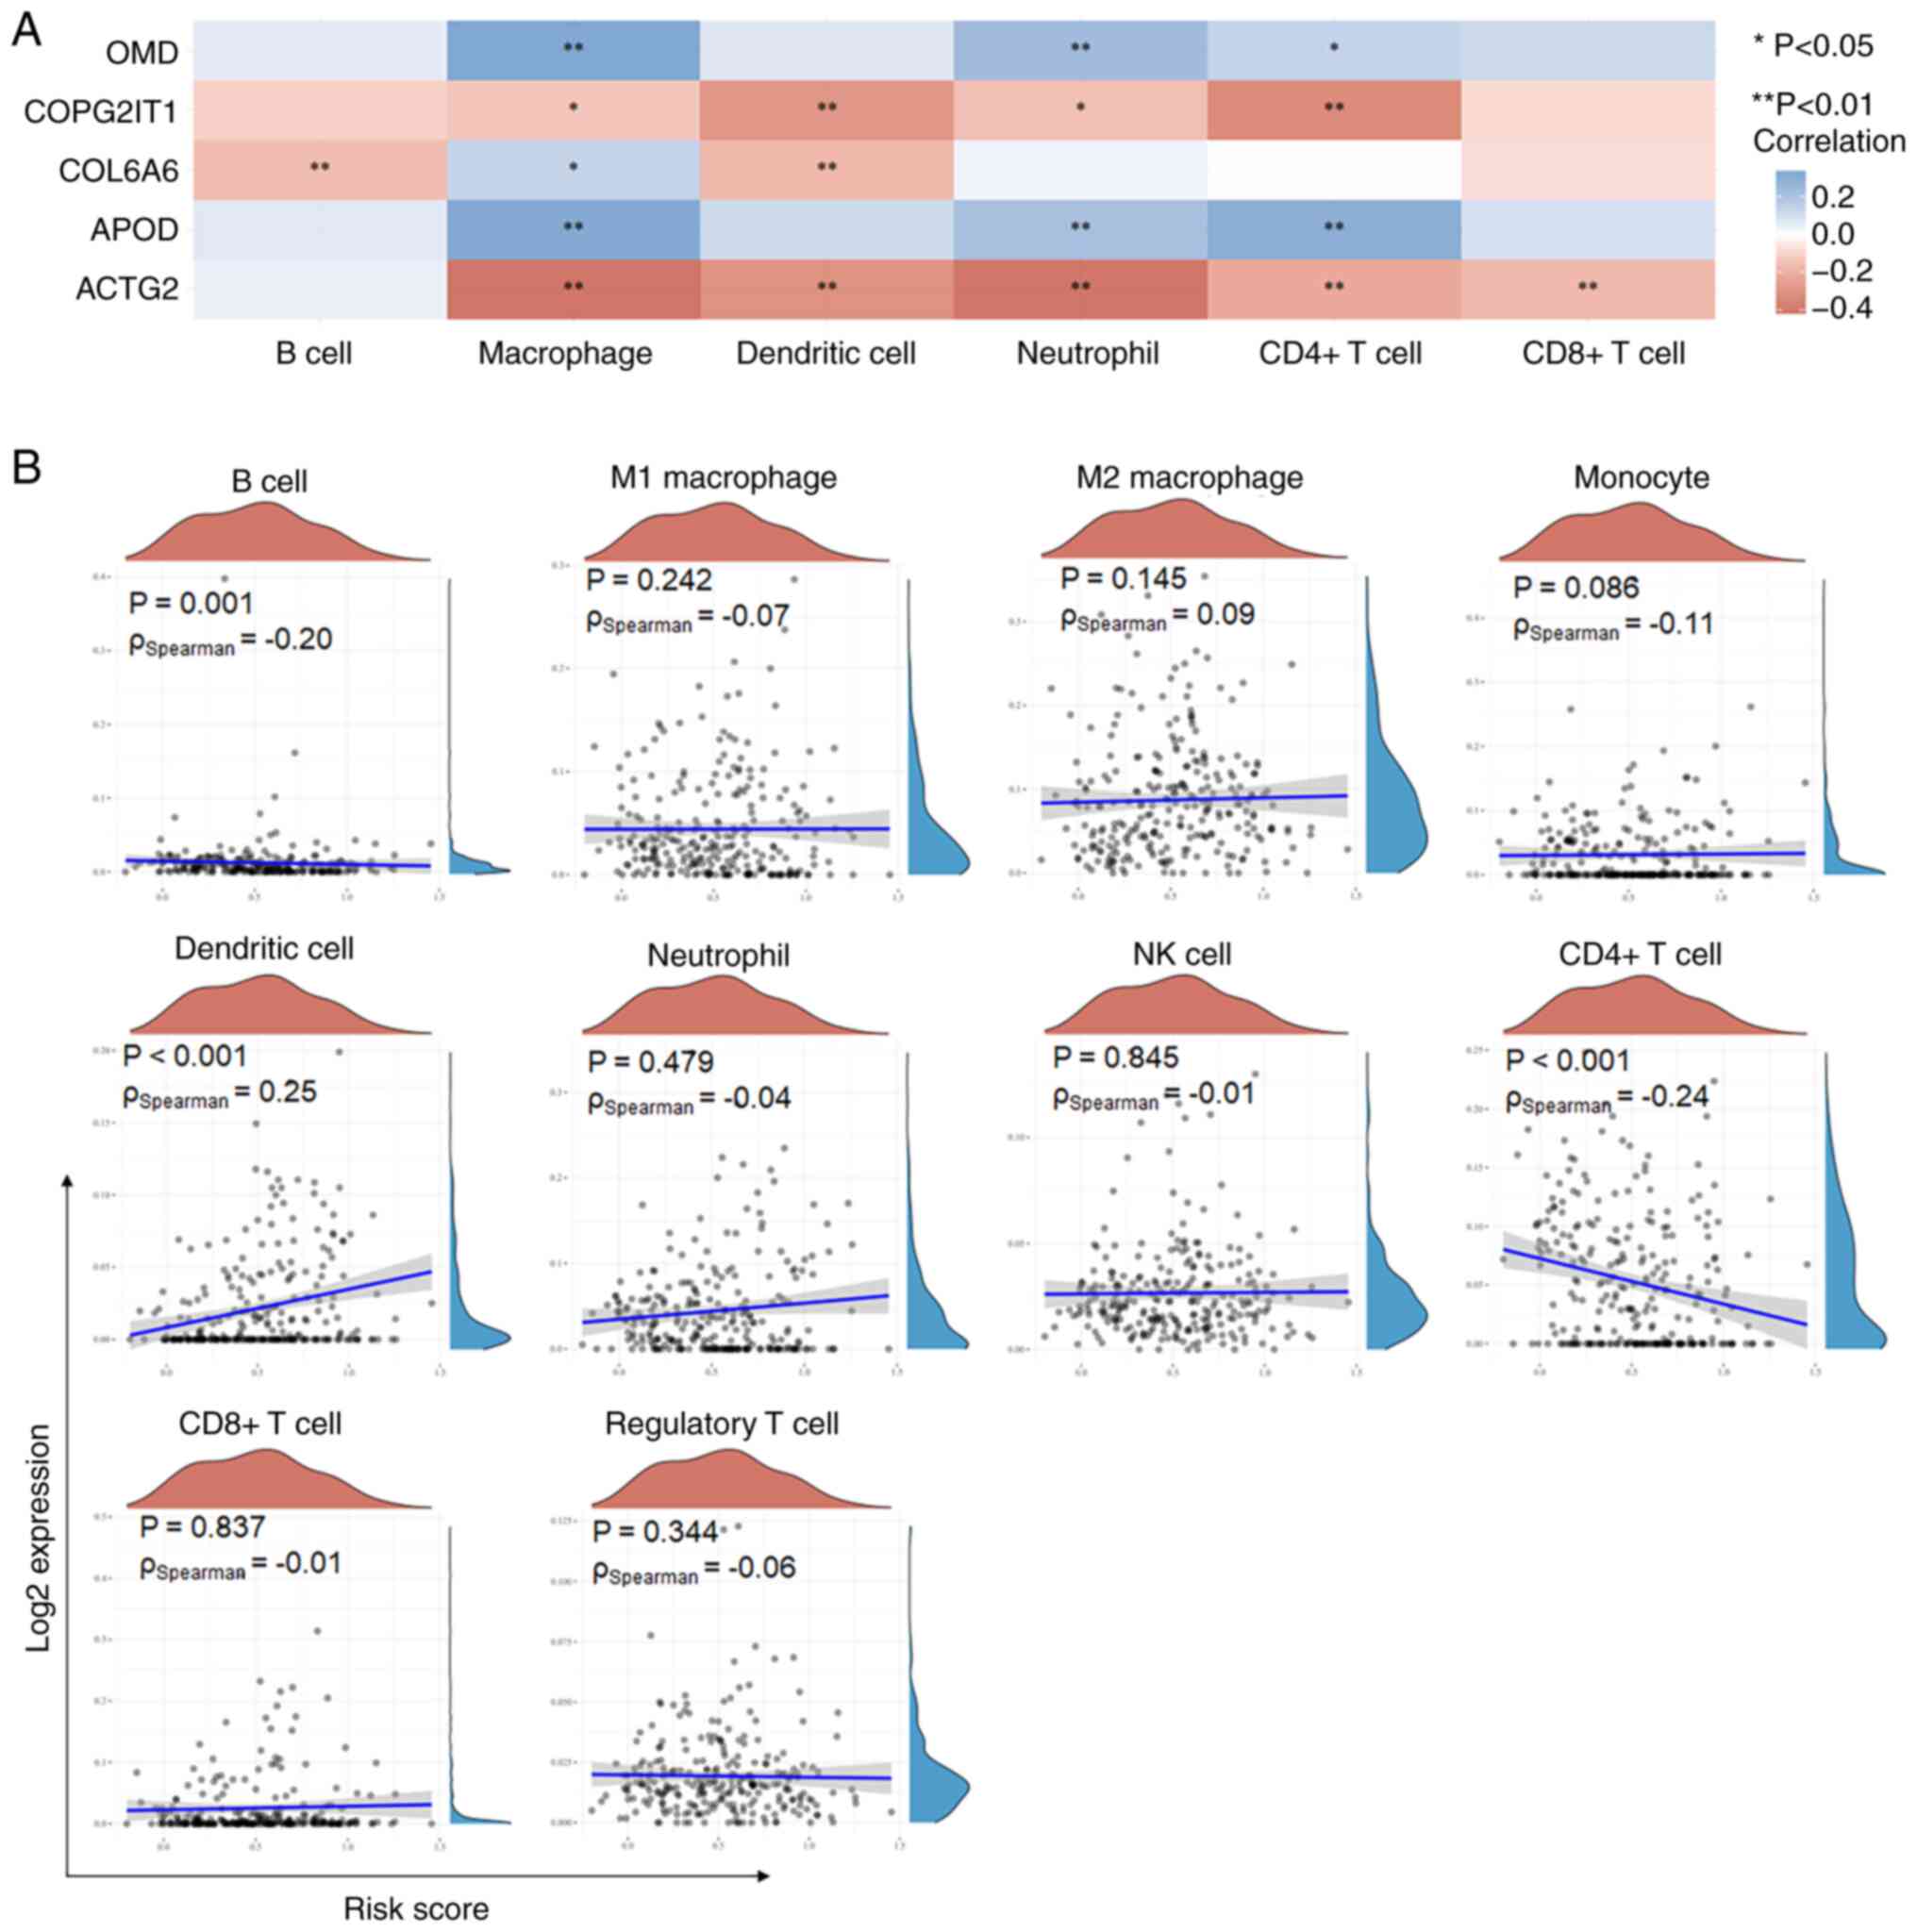
Therefore, the present study analyzed the infiltration of immune
cells in the two risk groups of ASTS, and assessed the correlations
between the expression of the five genes from the prognosis
prediction model and the infiltration of the six primary types of
immune cells. The results showed that OMD and APOD were positively
correlated with the presence of macrophages (r>0.3). COPG2IT1
was negatively correlated with CD4+ T cell infiltration
(r<-0.3), while upregulation of ACTG2 significantly predicted
reduced infiltrations of dendritic cell, neutrophil and macrophages
(r<-0.3) (Fig. 6A).
Subsequently, the association between the risk score and 10
subtypes of immune cells was explored. The analysis revealed a
significant negative correlation between the risk score and
infiltration of B cells and CD4+ T cells, and a positive
correlation with dendritic cell (DC) infiltration (Fig. 6B). These observations imply that
substantially different alterations tend to occur within the immune
microenvironments of the two ASTS risk groups.
Verification of protein expression
levels of the prognosis-related genes in the clinical samples
To confirm the clinical relevance of the
aforementioned metastasis-based prognosis prediction model for a
specific sarcoma subtype, 90 osteosarcoma samples were collected
and IHC staining was conducted for the genes included in this
model. Given that COPG2IT1 is a non-protein coding RNA, IHC
staining was performed using antibodies specific to ACTG2, APOD,
COL6A6 and OMD (Fig. 7A). The
associations between the expression levels of these genes and both
OS and progression-free survival (PFS) in patients were then
examined. The analysis showed that the expression levels of ACTG2,
APOD, COL6A6 and OMD were all significantly associated with patient
OS (Fig. 7B). Moreover, the
expression levels of ACTG2, APOD and OMD, but not COL6A6, were
significantly associated with PFS (Fig.
7C). High expression of ACTG2 was associated with worse
survival, while low expression of the other genes was associated
with worse survival. This was also the case for PFS.
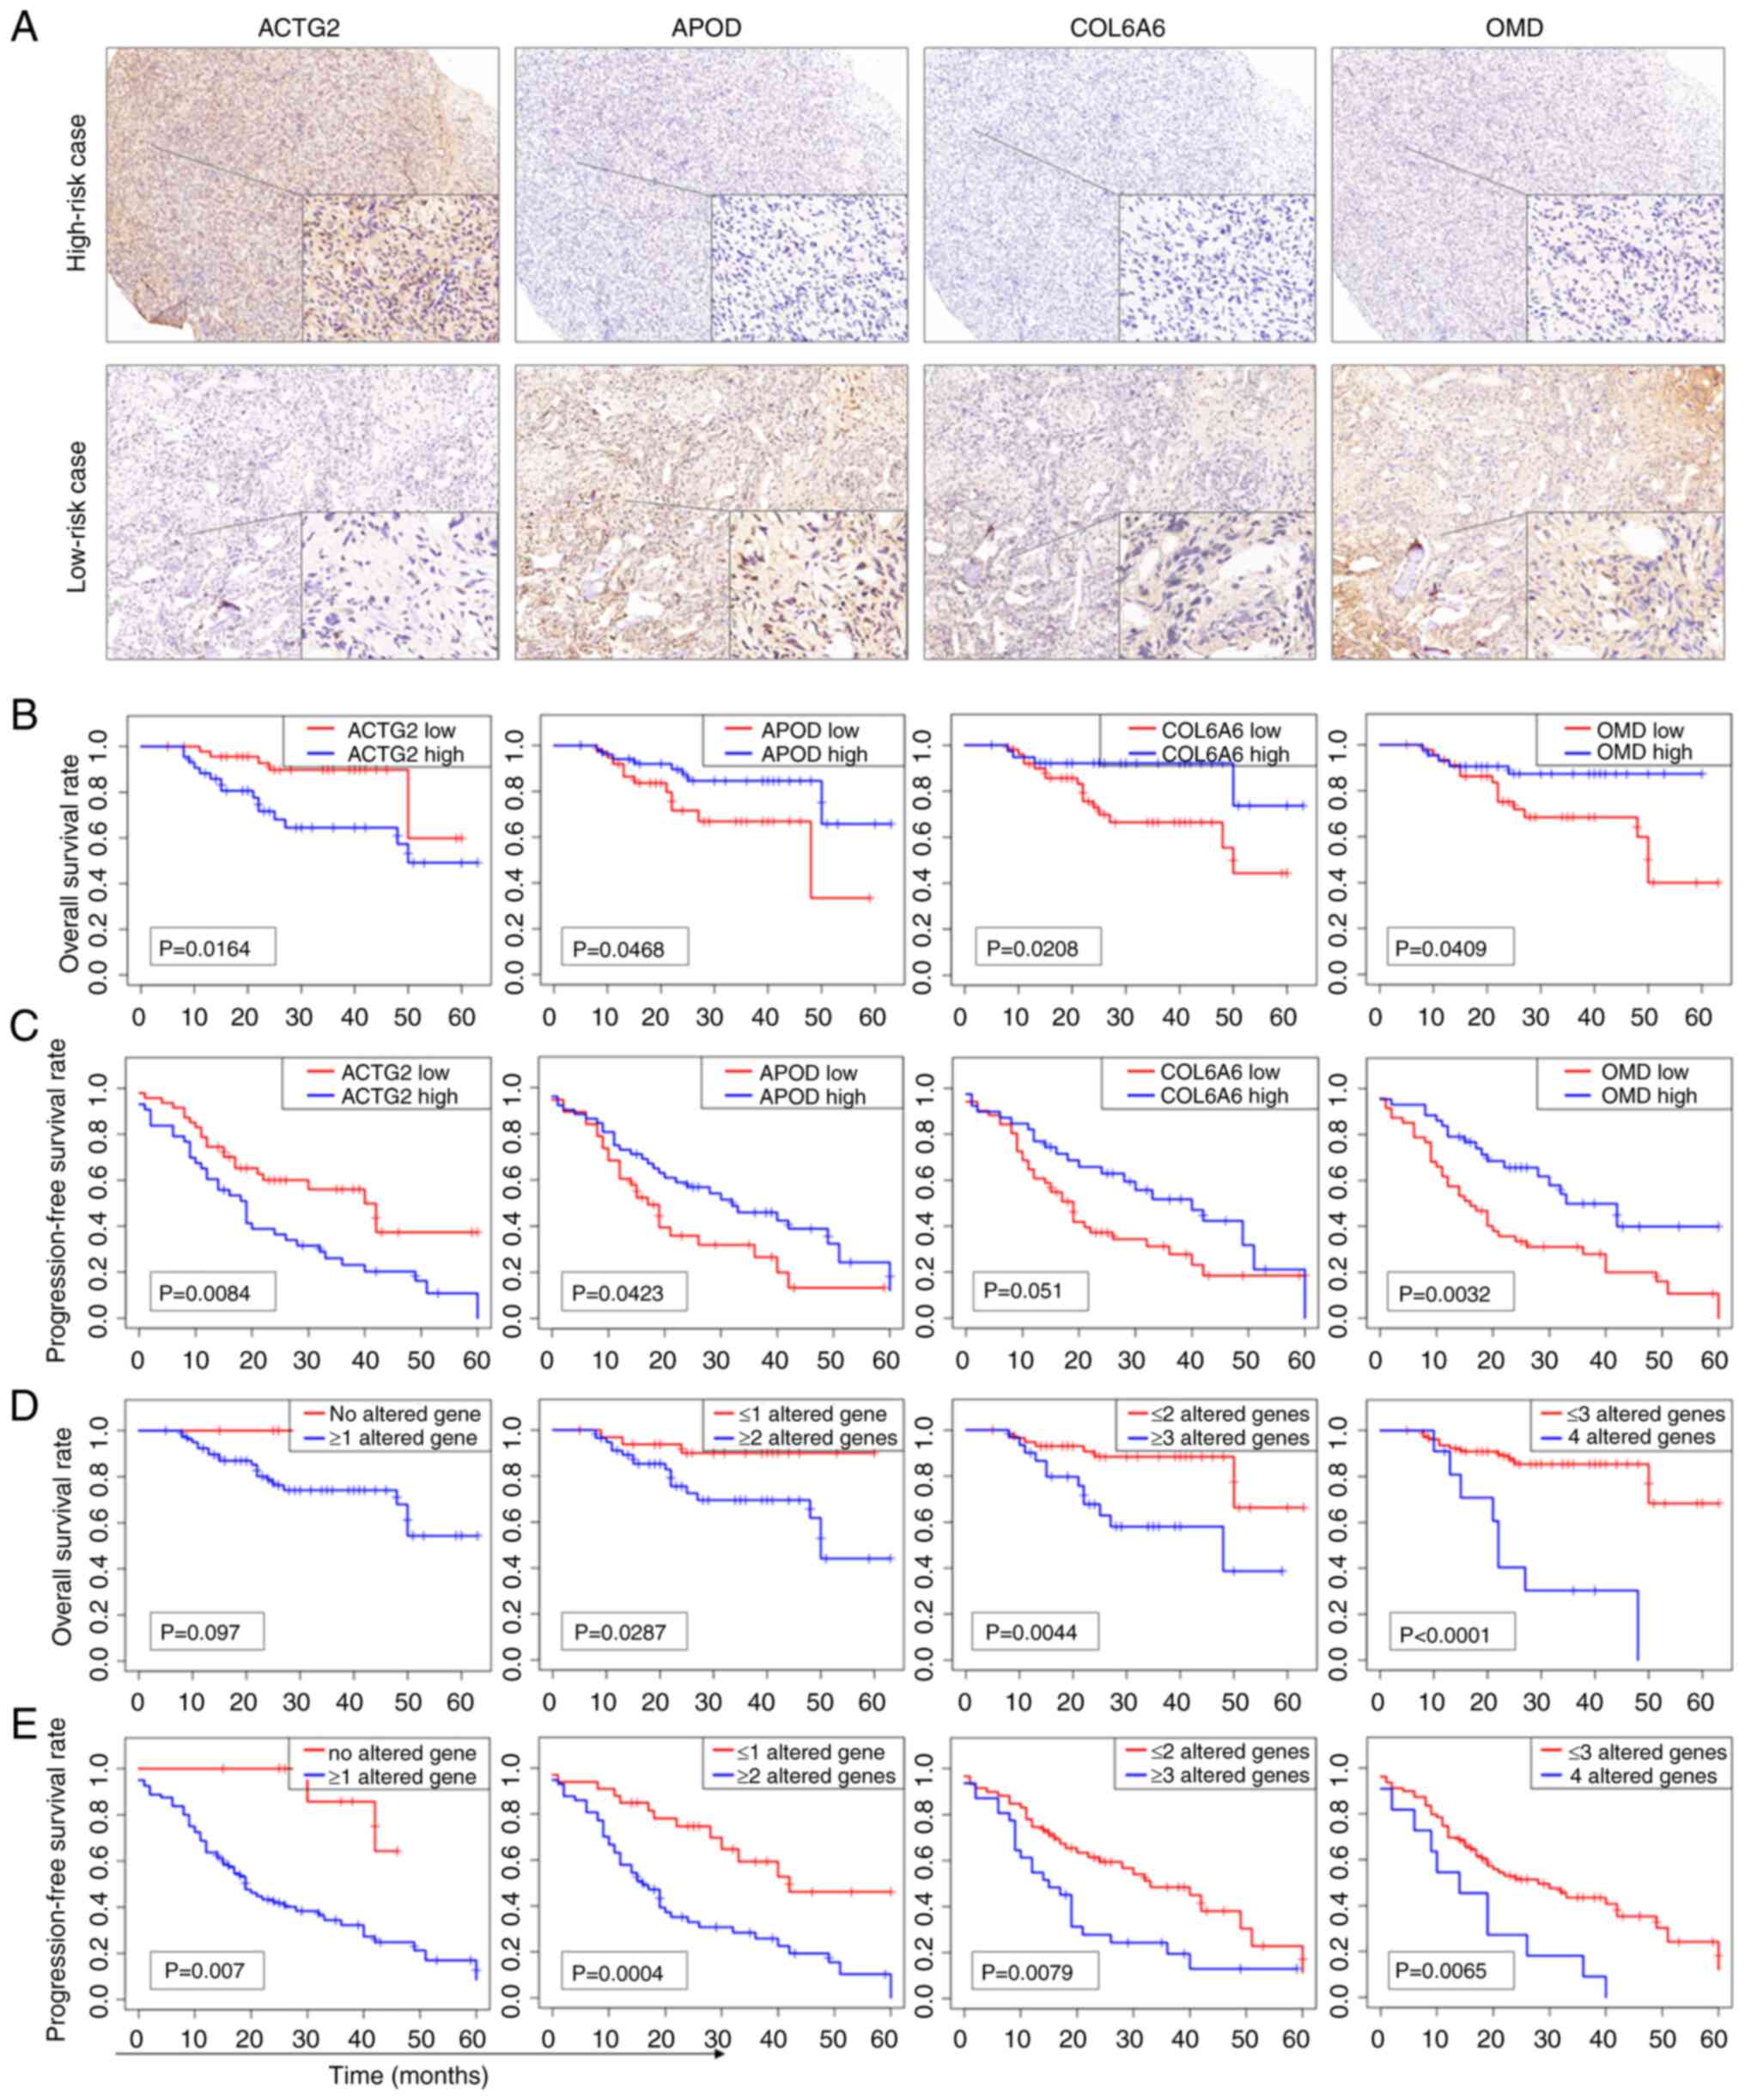 | Figure 7.IHC staining analysis of
prognosis-related genes in the clinical validation cohort. (A) IHC
staining of a high-risk case showing high expression of ACTG2 and
low expression of APOD, COL6A6 and OMD, and a low-risk case
displaying low expression of ACTG2 and high expression of APOD,
COL6A6 and OMD (main image, ×40 magnification, and inset image,
×400 magnification). (B) KM curves of OS for ACTG2, APOD, COL6A6
and OMD based on the IHC staining results. (C) KM curves of PFS for
ACTG2, APOD, COL6A6 and OMD. High expression of ACTG2 and low
expression of APOD, COL6A6 or OMD were considered altered genes.
(D) KM curves of OS for the number of altered genes. (E) KM curves
of PFS for the number of altered genes. KM, Kaplan-Meier; IHC,
immunohistochemistry; ACTG2, actin γ2; APOD, apolipoprotein D;
COL6A6, collagen type VI α6 chain; OMD, osteomodulin; OS, overall
survival; PFS, progression-free survival. |
To assess whether combining the expression data of
multiple genes could improve prognostic performance, the high
expression of ACTG2 and the low expression of either APOD, COL6A6
or OMD were categorized as altered gene profiles. KM analysis
revealed that combinations of multiple altered genes provided a
clearer differentiation in OS and PFS compared with single genes.
The combination of four altered genes yielded the lowest P-values
for OS (Fig. 7D), while the
combination of two altered genes achieved the lowest P-values for
PFS (Fig. 7E). These findings
suggest that utilizing multiple genes in the prognosis prediction
model enhances the predictive accuracy for both OS and PFS in
clinical samples.
Inhibition of ACTG2 suppresses cell
migration and invasion, but not proliferation in a sarcoma cell
line
ACTG2 was identified as the sole factor with high
expression associated with a poor prognosis in this prognosis
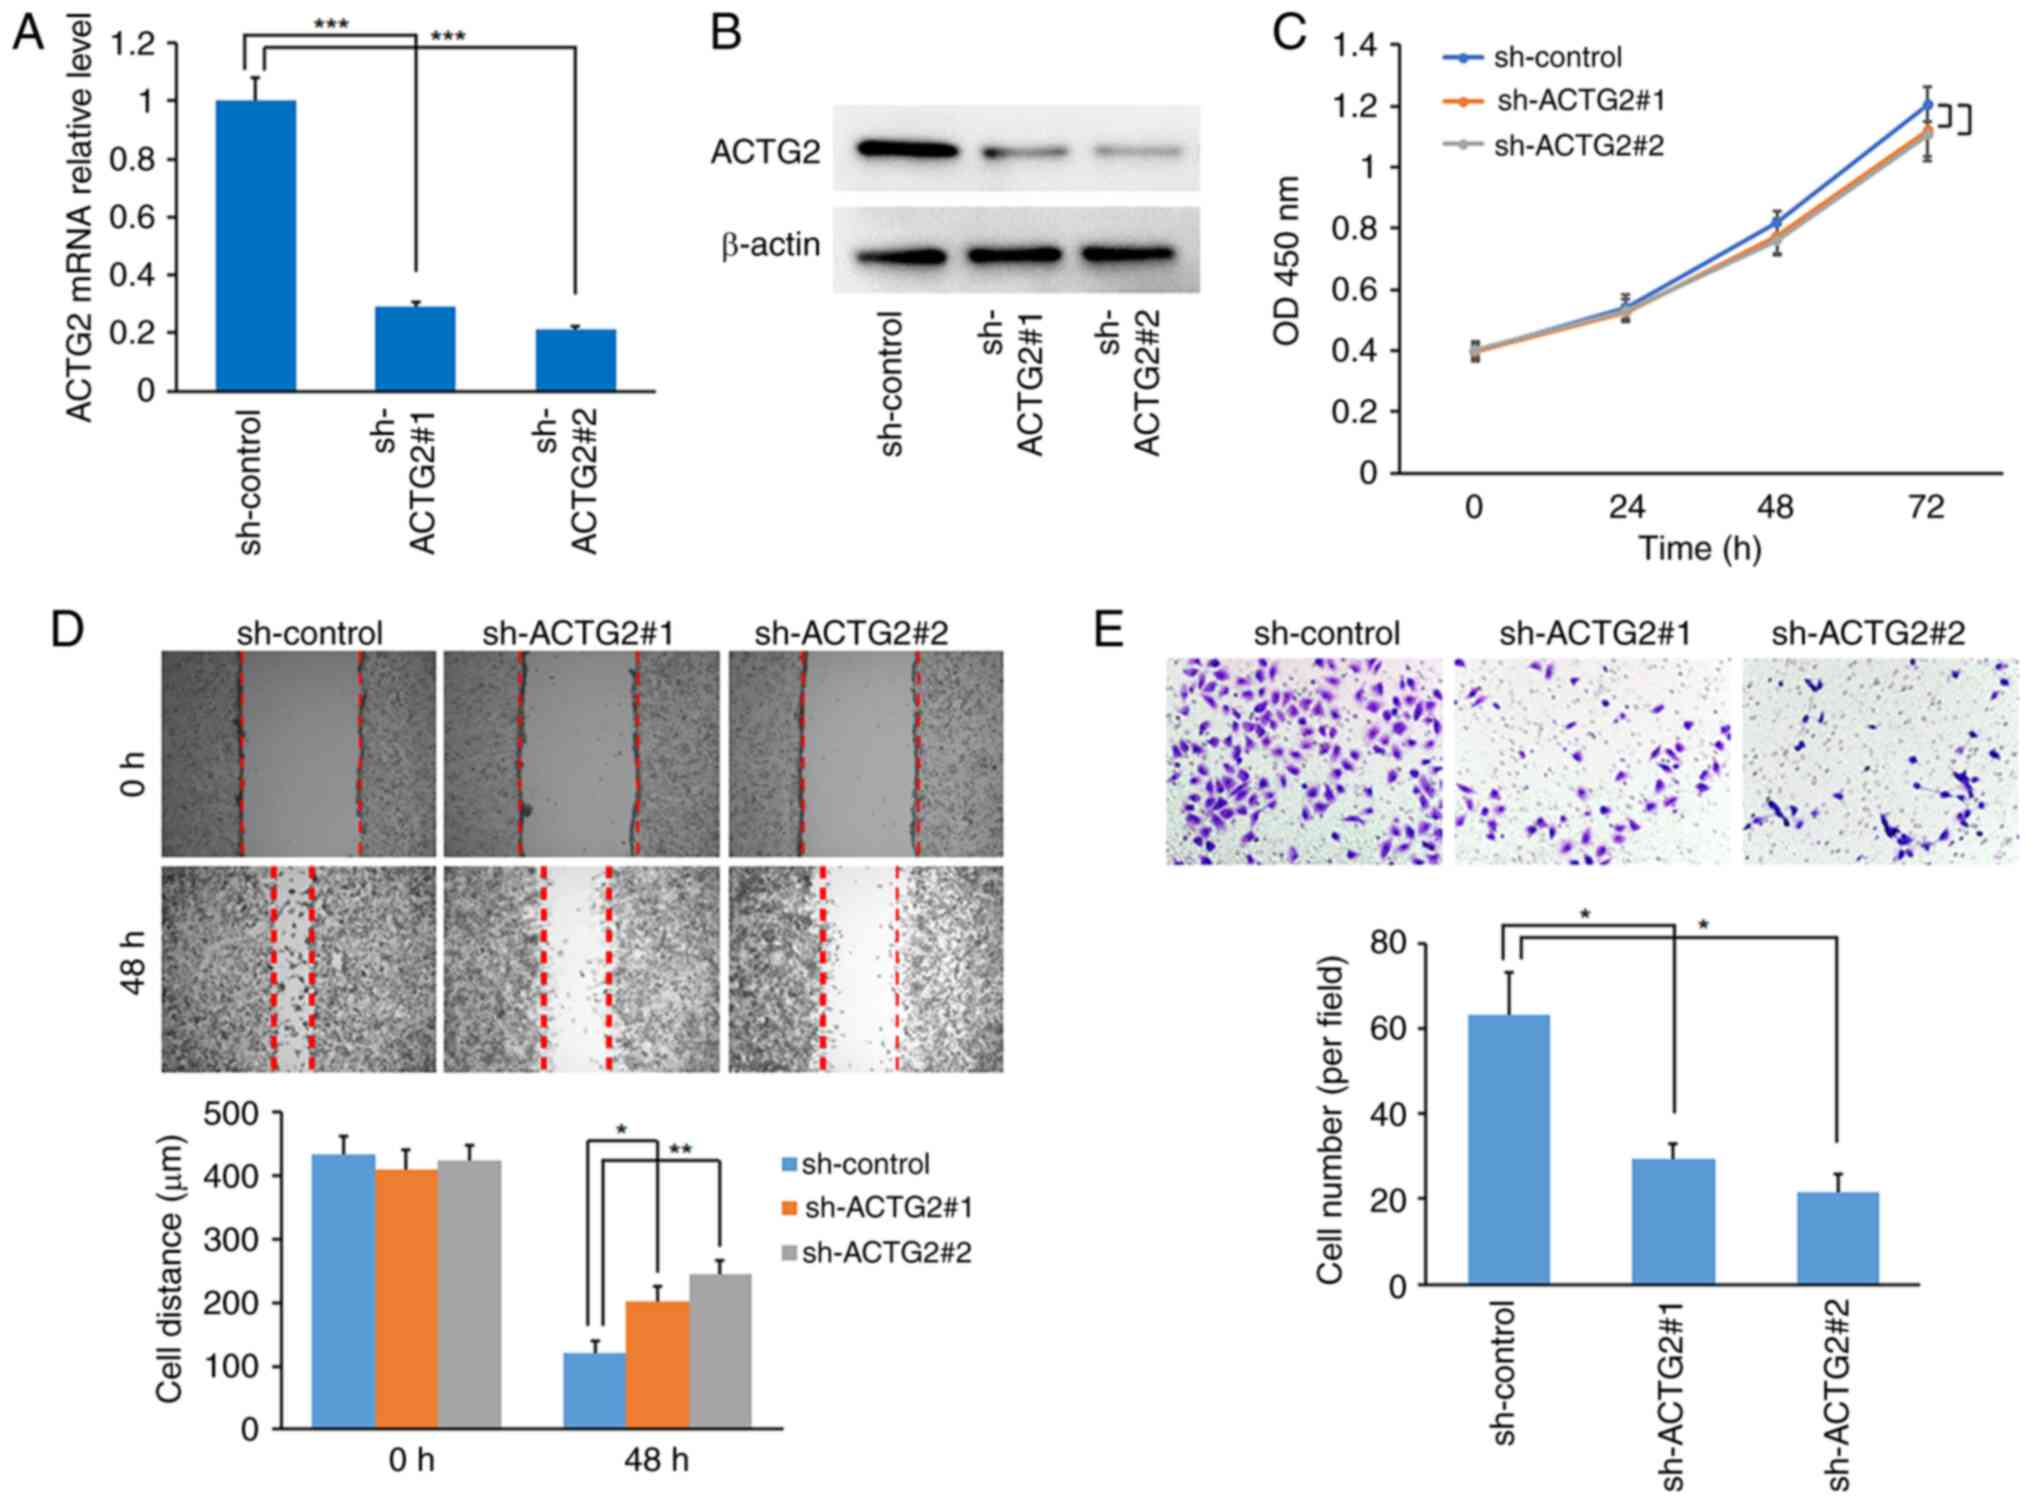
prediction model for ASTS. Consequently, the role of ACTG2 was
investigated in the sarcoma HOS cell line. The effectiveness of two
shRNAs for targeting ACTG2 was confirmed through RT-qPCR and
western blot assays (Fig. 8A and
B). Although the CCK-8 assay indicated that ACTG2 inhibition
slightly reduced the proliferation rate of HOS cells compared with
the control, the change was not statistically significant (Fig. 8C). However, the wound-healing assay
demonstrated that ACTG2 inhibition significantly curtailed the
migration of HOS cells compared with the control (Fig. 8D). Further validation using the
Transwell assay showed that sh-ACTG2 markedly inhibited the
invasive capabilities of the cells (Fig. 8E), indicating that ACTG2 may act as
an enhancer of sarcoma metastasis.
Discussion
ASTS represents one of the most lethal malignant
tumors due to its high level of heterogeneity. Additionally, with
an incidence rate of ~5 cases per 100,000 individuals annually,
accurately predicting its prognosis is extremely challenging
(1). Despite advancements in novel
therapies and combinations of chemotherapy, metastasis still occurs
in nearly one-half of patients with ASTS (3). Once metastasis is present, the
survival of patients with ASTS is severely jeopardized, with only a
30% 2-year survival rate (6).
Consequently, identifying metastasis-related genes and constructing
a survival prediction model could improve prognostic predictions
for patients with ASTS during clinical treatments. In the present
study, a prognosis prediction model using five gene signatures was
developed by analyzing the DEGs between patients with metastatic
and non-metastatic ASTS from the GEO database, and then verified in
an independent series of patients with ASTS from TCGA database. GO
and KEGG analyses were performed to explore the prognosis
prediction model data. The correlation between the gene signature
and immunocyte infiltration was also assessed. Finally, the
expression levels of genes in the prognosis prediction model were
examined in a single subtype of sarcoma by IHC staining, aiming to
explore the possible application of the prognostic model in
clinical samples.
The prognosis prediction model comprised five genes:
ACTG2, APOD, COPG2IT1, COL6A6 and OMD. The P-value of COL6A6 was
0.062 in the multivariate Cox regression model. The model selection
was primarily based on the principle of minimizing the AIC.
Following this AIC principle, in a multifactorial model, it is
possible to include variables with P>0.05, without necessarily
requiring them to be independent predictive factors (P<0.05).
Thus, COL6A6 was included in the final model.
ACTG2 encodes a smooth muscle actin primarily found
in the gastrointestinal system, and is linked with chronic
intestinal pseudo-obstruction (18)
and early onset colorectal cancer (19). Although the role of ACTG2 in other
cancer types remains uncertain, Tang et al (20) indicated that it acts as a tumor
suppressor in colorectal cancer by curtailing tumor cell
proliferation. Conversely, ACTG2 has been identified as an oncogene
that enhances hepatocellular carcinoma cell migration and
metastasis by activating the NOTCH1 pathway (21). The ACTG2-ALK receptor tyrosine
kinase fusion gene, has been implicated in the tumorigenesis and
drug resistance of leiomyosarcoma, which is a subtype of ASTS
(22). Additionally, ACTG2
expression has been associated with the prognosis of patients with
leiomyosarcoma (23). However, the
role of ACTG2 in sarcomas has rarely been explored. Therefore, the
present study investigated the potential role of ACTG2 in a sarcoma
cell line. The findings revealed that while inhibition of ACTG2 had
a minimal effect on cell proliferation, it significantly curtailed
cell migration and invasion, thus marking ACTG2 as a promoter of
metastasis in ASTS.
The role of APOD in tumors remains under debate.
Jankovic-Karasoulos et al (24) showed that elevated APOD expression
facilitated breast cancer metastasis and indicated a poor
prognosis. Aligning with the positive association found between
APOD expression and OS in the present study, other research has
noted that high APOD expression is associated with improved
survival outcomes in cervical cancer (25), thyroid cancer (26) and dermatofibrosarcoma (27).
COPG2IT1 belongs to the lncRNA class, but its role
in sarcomas remains unclear. Green et al (28) demonstrated that COPG2IT1
interference occurs in infant neurobehavioral development. Mai
et al (29) reported that
COPG2IT1 was expressed at low levels in undifferentiated cells
during the differentiation process of embryonic stem cells,
suggesting that low expression of COPG2IT1 may contribute to the
stemness of tumor cells.
COL6A6 is part of the collagen protein family,
playing a role in the composition of the ECM (30). COL6A6 has been shown to inhibit
tumor growth and metastasis via the JAK or PI3K-Akt pathways in
non-small cell lung cancer and pituitary adenoma (31,32).
Additionally, high COL6A6 expression has been identified as a
favorable prognostic factor and is positively associated with the
infiltration of B cells, T cells, neutrophils and DCs in lung
adenocarcinoma (33). The present
findings also indicated a positive correlation between COL6A6
expression and the infiltration of B cells and DCs in ASTS.
Therefore, despite a P-value of 0.062 in the final model, COL6A6
was considered a key gene indicator in the prognostic model.
OMD is a small leucine-rich keratan sulfate
proteoglycan found in the ECM of mineralized tissues such as bones
and teeth, typically expressed by osteoblasts (34). OMD expression increases with
osteoblast differentiation and supports osteoblast viability
(35). In bladder cancer, OMD has
been observed to suppress cancer progression by reversing
epithelial-mesenchymal transition and activating cell-cell adhesion
through the inhibition of the transforming growth factor-β and
epidermal growth factor pathways (36). The present study also demonstrated
that high OMD expression impedes tumor progression and is
associated with the increased survival of patients with ASTS.
Although each of the five genes has been identified to play a role
in cancer, few studies have explored their potential interactions,
indicating that more research is necessary.
Based on the prognosis prediction model developed in
the present study, patients with ASTS were classified into high-
and low-risk groups. Significant differences in OS were observed
between these groups. Consequently, GO and KEGG analyses were
conducted to investigate the molecular processes underlying these
differences. The consistency of results across the GEO and TCGA
databases confirmed the reliability of the prognosis prediction
model. GO analysis indicated significant disparities in
development-related pathways between the two risk groups,
suggesting increased tumor cell stemness in the high-risk group,
which is a critical factor in tumorigenesis, tumor progression and
the drug resistance of tumors (37,38).
This high stemness likely contributes to the poor prognosis
observed in high-risk patients. Additionally, differences in
collagen, ECM, actin binding and focal adhesion pathways, which are
linked to cell-cell adhesion, were noted between the groups.
Reduced cell adhesion is a crucial driver of metastasis, fostering
the formation of circulating tumor cells (39) and enhancing tumor cell invasion
(40). Furthermore, the ECM
modulates the functions of adjacent cells through cell surface
receptors, influencing tumor cell behavior (41) and immune cell infiltration (42), thereby partially explaining the
increased metastatic risk and worse prognosis in high-risk
patients.
KEGG analysis revealed distinctions in the PI3K-Akt
signaling pathway between the risk groups in both the GEO and TCGA
datasets (P=0.0024; data not shown), although it was not in the top
10 pathways. The PI3K-Akt pathway is recognized as a critical
promoter of various tumors, influencing their onset and progression
(43–46). Consequently, therapies targeting the
PI3K-Akt pathway have been explored in the clinical management of
various cancer types, including thymomas (43), breast cancer (45), and endometrial cancer (44). The present findings suggest that the
PI3K-Akt pathway is activated in the high-risk group, highlighting
the potential efficacy of targeted therapies in these patients.
Moreover, within the prognosis prediction model, APOD and COL6A6
were found to suppress the PI3K-Akt pathway (31,47),
while activation of this pathway upregulated OMD expression
(48).
With the advancement of research into tumor
immunology, new technologies and methods will be increasingly
applied to the staging and treatment of ASTS (3,4).
Accordingly, the immune cell infiltration within tumor tissues of
high- and low-risk patients were analyzed in the present study. The
analysis revealed that the risk score was negatively correlated
with B-cell and CD4+ T-cell infiltration, and positively
correlated with DC infiltration. DCs primarily serve as
antigen-presenting cells (49),
while B and CD4+ T cells are recognized as promoters of
the antitumor immune response (50). These findings highlight the complex
differences in the immune microenvironment of the two risk
groups.
ASTS encompasses various sarcoma subtypes, all of
which have a low rate of incidence. To determine the effectiveness
of the prognosis prediction model for a specific sarcoma subtype,
the present study model was constructed based on mRNA profiles,
which are often challenging to obtain from clinical patients. IHC
staining is a prevalent diagnostic method in clinical settings. To
assess the potential application of this model in a clinical
context, 90 osteosarcoma samples were collected and the expression
of genes from the prognosis prediction model were analyzed through
IHC staining. It was found that low expression levels of ACTG2, but
high expression levels of APOD, COL6A6 and OMD, were all associated
with a favorable patient prognosis. Furthermore, the combination of
multiple altered genes provided a more distinct differentiation
between OS and PFS than any single gene. These findings suggest
that leveraging multiple genes in the prognosis prediction model
can improve prognosis accuracy for patients with ASTS.
The present study is not without limitations. First,
the stage of ASTS is not available in both the GEO and TCGA
datasets, restricting the analysis of the correlation between the
prognosis prediction model and the clinical stages of ASTS. Second,
a direct link between the risk score and immunization activity has
not yet been established. Third, although the model was validated
in a single sarcoma subtype using IHC staining, conducting RT-qPCR
assays in more ASTS subtypes and with a larger patient cohort could
better assess the clinical applicability of the prognostic model.
Fourth, there is a crossing phenomenon at the beginning or the end
of some survival curves, which may have a certain impact on the
statistical results. However, at present, there is no universally
recognized and mature method to resolve this issue (51). Lastly, the potential roles of the
other four genes in ASTS warrant further investigation in future
studies.
In conclusion, in the present study, a prognosis
prediction model for ASTS was developed by analyzing DEGs in
patients with metastatic cancer, which was then validated in
external patient cohorts. Functional and pathway analyses
identified significant differences in stemness, ECM and cell
adhesion-related pathways between the two risk groups, underscoring
the importance of PI3K-Akt pathway activation in high-risk cases.
Changes in immune cell infiltration were also correlated with the
risk score. This metastasis-based prediction model not only serves
as a valuable tool for predicting the survival of patients with
ASTS, but also establishes a foundation for future investigations
into the process of tumor metastasis.
Supplementary Material
Supporting Data
Acknowledgements
Not applicable.
Funding
This research was funded by the National Natural Science Youth
Fund (grant no. 82003132), the Long Voyage Plan of Shanghai Pudong
New Area People's Hospital (grant no. PRYYH202301), the Excellent
Young Medical Talents Training Program at the Shanghai Pudong New
Area People's Hospital (grant no. PWRq2021-33) and the Project of
Clinical Outstanding Clinical Discipline Construction in Shanghai
Pudong New Area (grant no. PWYgy2021-08).
Availability of data and materials
The data generated in the present study may be
requested from the corresponding author.
Authors' contributions
SH, JT and JW conceptualized and designed the study.
SH and XS performed the data analyses. SH and JT interpreted the
results. JL and JZ collected the clinical samples. ZW and HS
conducted the IHC staining. SH and JT performed the in vitro
studies. XS and JT drafted the manuscript, which was revised by JT.
SH and XS confirm the authenticity of all the raw data. All authors
have read and approved the final manuscript.
Ethics approval and consent to
participate
This study was reviewed and approved by the Medical
Ethics Committees of Shanghai Changzheng Hospital (Shanghai, China;
approval no. 2018SL004) and Shanghai Pudong New Area People's
Hospital (Shanghai, China; approval no. K82 of 2021). Written
informed consent was obtained from all participating patients or
their legal guardians.
Patient consent for publication
Written informed consent for publication was
obtained from all individuals involved in the study.
Competing interests
The authors declare that they have no competing
interests.
References
|
1
|
Li Z, Duan Z, Jia K, Yao Y, Liu K, Qiao Y,
Gao Q, Yang Y, Li G and Shang A: A combined risk score model to
assess prognostic value in patients with soft tissue sarcomas.
Cells. 11:40772022. View Article : Google Scholar : PubMed/NCBI
|
|
2
|
Siegel RL, Miller KD and Jemal A: Cancer
statistics, 2018. CA Cancer J Clin. 68:7–30. 2018. View Article : Google Scholar : PubMed/NCBI
|
|
3
|
Gamboa AC, Gronchi A and Cardona K:
Soft-tissue sarcoma in adults: An update on the current state of
histiotype-specific management in an era of personalized medicine.
CA Cancer J Clin. 70:200–229. 2020. View Article : Google Scholar : PubMed/NCBI
|
|
4
|
Ardakani AHG, Woollard A, Ware H and Gikas
P: Soft tissue sarcoma: Recognizing a rare disease. Cleve Clin J
Med. 89:73–80. 2022. View Article : Google Scholar : PubMed/NCBI
|
|
5
|
Chen HH, Zhang TN, Zhang FY and Zhang T:
Non-coding RNAs in drug and radiation resistance of bone and
soft-tissue sarcoma: A systematic review. Elife. 11:e796552022.
View Article : Google Scholar : PubMed/NCBI
|
|
6
|
Xu R, Qi L, Ren X, Zhang W, Li C, Liu Z,
Tu C and Li Z: Integrated analysis of TME and hypoxia identifies a
classifier to predict prognosis and therapeutic biomarkers in soft
tissue sarcomas. Cancers (Basel). 14:56752022. View Article : Google Scholar : PubMed/NCBI
|
|
7
|
Gu HY, Lin LL, Zhang C, Yang M, Zhong HC
and Wei RX: The potential of five immune-related prognostic genes
to predict survival and response to immune checkpoint inhibitors
for soft tissue sarcomas based on multi-omic study. Front Oncol.
10:13172020. View Article : Google Scholar : PubMed/NCBI
|
|
8
|
Chibon F, Lagarde P, Salas S, Pérot G,
Brouste V, Tirode F, Lucchesi C, de Reynies A, Kauffmann A, Bui B,
et al: Validated prediction of clinical outcome in sarcomas and
multiple types of cancer on the basis of a gene expression
signature related to genome complexity. Nat Med. 16:781–787. 2010.
View Article : Google Scholar : PubMed/NCBI
|
|
9
|
Proost JH and Eleveld DJ: Performance of
an iterative two-stage bayesian technique for population
pharmacokinetic analysis of rich data sets. Pharm Res.
23:2748–2759. 2006. View Article : Google Scholar : PubMed/NCBI
|
|
10
|
Livak KJ and Schmittgen TD: Analysis of
relative gene expression data using real-time quantitative PCR and
the 2(−Delta Delta C(T)) method. Methods. 25:402–408. 2001.
View Article : Google Scholar : PubMed/NCBI
|
|
11
|
Zhang H, Wang T, Gong HY, Jiang RY, Zhou
W, Sun HT, Huang R, Wang Y, Wu Z, Xu W, et al: A novel molecular
classification method for osteosarcoma based on tumor cell
differentiation trajectories. Bone Res. 11:12023. View Article : Google Scholar : PubMed/NCBI
|
|
12
|
Lepucki A, Orlińska K, Mielczarek-Palacz
A, Kabut J, Olczyk P and Komosińska-Vassev K: The role of
extracellular matrix proteins in breast cancer. J Clin Med.
11:12502022. View Article : Google Scholar : PubMed/NCBI
|
|
13
|
Song Y, Ma X, Zhang M, Wang M, Wang G, Ye
Y and Xia W: Ezrin mediates invasion and metastasis in
tumorigenesis: A review. Front Cell Dev Biol. 8:5888012020.
View Article : Google Scholar : PubMed/NCBI
|
|
14
|
Rømer AMA, Thorseth ML and Madsen DH:
Immune modulatory properties of collagen in cancer. Front Immunol.
12:7914532021. View Article : Google Scholar : PubMed/NCBI
|
|
15
|
Yan JY, Gong HY, Han S, Liu JL, Wu ZP,
Wang ZH and Wang T: GALNT5 functions as a suppressor of ferroptosis
and a predictor of poor prognosis in pancreatic adenocarcinoma. Am
J Cancer Res. 13:4579–4596. 2023.PubMed/NCBI
|
|
16
|
Crombé A, Roulleau-Dugage M and Italiano
A: The diagnosis, classification, and treatment of sarcoma in this
era of artificial intelligence and immunotherapy. Cancer Commun
(Lond). 42:1288–1313. 2022. View Article : Google Scholar : PubMed/NCBI
|
|
17
|
Lynch MM, Alexiev BA, Schroeder BA and
Pollack SM: Combinations of chemotherapy and PD-1/PD-L1 inhibitors
in sarcoma. Curr Treat Options Oncol. 23:1861–1876. 2022.
View Article : Google Scholar : PubMed/NCBI
|
|
18
|
Milunsky A, Baldwin C, Zhang X, Primack D,
Curnow A and Milunsky J: Diagnosis of chronic intestinal
pseudo-obstruction and megacystis by sequencing the ACTG2 gene. J
Pediatr Gastroenterol Nutr. 65:384–387. 2017. View Article : Google Scholar : PubMed/NCBI
|
|
19
|
Zhao B, Baloch Z, Ma Y, Wan Z, Huo Y, Li F
and Zhao Y: Identification of potential key genes and pathways in
early-onset colorectal cancer through bioinformatics analysis.
Cancer Control. 26:10732748198312602019. View Article : Google Scholar : PubMed/NCBI
|
|
20
|
Tang G, Wu D, Guo M and Li H: LncRNA
MIR497HG inhibits colorectal cancer progression by the
miR-3918/ACTG2 axis. J Genet. 101:272022. View Article : Google Scholar : PubMed/NCBI
|
|
21
|
Wu Y, Liu ZG, Shi MQ, Yu HZ, Jiang XY,
Yang AH, Fu XS, Xu Y, Yang S, Ni H, et al: Identification of ACTG2
functions as a promoter gene in hepatocellular carcinoma cells
migration and tumor metastasis. Biochem Biophys Res Commun.
491:537–544. 2017. View Article : Google Scholar : PubMed/NCBI
|
|
22
|
Davis LE, Nusser KD, Przybyl J,
Pittsenbarger J, Hofmann NE, Varma S, Vennam S, Debiec-Rychter M,
van de Rijn M and Davare MA: Discovery and characterization of
recurrent, targetable ALK fusions in leiomyosarcoma. Mol Cancer
Res. 17:676–685. 2019. View Article : Google Scholar : PubMed/NCBI
|
|
23
|
Beck AH, Lee CH, Witten DM, Gleason BC,
Edris B, Espinosa I, Zhu S, Li R, Montgomery KD, Marinelli RJ, et
al: Discovery of molecular subtypes in leiomyosarcoma through
integrative molecular profiling. Oncogene. 29:845–854. 2010.
View Article : Google Scholar : PubMed/NCBI
|
|
24
|
Jankovic-Karasoulos T, Bianco-Miotto T,
Butler MS, Butler LM, McNeil CM, O'Toole SA, Millar EKA, Sakko AJ,
Ruiz AI, Birrell SN, et al: Elevated levels of tumour
apolipoprotein D independently predict poor outcome in breast
cancer patients. Histopathology. 76:976–987. 2020. View Article : Google Scholar : PubMed/NCBI
|
|
25
|
Zhang Y, Qin Y, Li D and Yang Y: A risk
prediction model mediated by genes of APOD/APOC1/SQLE associates
with prognosis in cervical cancer. BMC Womens Health. 22:5342022.
View Article : Google Scholar : PubMed/NCBI
|
|
26
|
Ruchong P, Haiping T and Xiang W: A
five-gene prognostic nomogram predicting disease-free survival of
differentiated thyroid cancer. Dis Markers. 2021:55107802021.
View Article : Google Scholar : PubMed/NCBI
|
|
27
|
Palmerini E, Gambarotti M, Staals EL,
Zanella L, Sieberova G, Longhi A, Cesari M, Bonarelli S, Picci P,
Ruggieri P, et al: Fibrosarcomatous changes and expression of CD34+
and apolipoprotein-D in dermatofibrosarcoma protuberans. Clin
Sarcoma Res. 2:42012. View Article : Google Scholar : PubMed/NCBI
|
|
28
|
Green BB, Kappil M, Lambertini L,
Armstrong DA, Guerin DJ, Sharp AJ, Lester BM, Chen J and Marsit CJ:
Expression of imprinted genes in placenta is associated with infant
neurobehavioral development. Epigenetics. 10:834–841. 2015.
View Article : Google Scholar : PubMed/NCBI
|
|
29
|
Mai X, Mai Q, Li T and Zhou C: Dynamic
expression patterns of imprinted genes in human embryonic stem
cells following prolonged passaging and differentiation. J Assist
Reprod Genet. 28:315–323. 2011. View Article : Google Scholar : PubMed/NCBI
|
|
30
|
Kang SH, Oh SY, Lee HJ, Kwon TG, Kim JW,
Lee ST, Choi SY and Hong SH: Cancer-associated fibroblast subgroups
showing differential promoting effect on HNSCC progression. Cancers
(Basel). 13:6542021. View Article : Google Scholar : PubMed/NCBI
|
|
31
|
Long R, Liu Z, Li J and Yu H: COL6A6
interacted with P4HA3 to suppress the growth and metastasis of
pituitary adenoma via blocking PI3K-Akt pathway. Aging (Albany NY).
11:8845–8859. 2019. View Article : Google Scholar : PubMed/NCBI
|
|
32
|
Qiao H, Feng Y and Tang H: COL6A6 inhibits
the proliferation and metastasis of non-small cell lung cancer
through the JAK signalling pathway. Transl Cancer Res.
10:4514–4522. 2021. View Article : Google Scholar : PubMed/NCBI
|
|
33
|
Ma Y, Qiu M, Guo H, Chen H, Li J, Li X and
Yang F: Comprehensive analysis of the immune and prognostic
implication of COL6A6 in lung adenocarcinoma. Front Oncol.
11:6334202021. View Article : Google Scholar : PubMed/NCBI
|
|
34
|
Skenteris NT, Seime T, Witasp A, Karlöf E,
Wasilewski GB, Heuschkel MA, Jaminon AMG, Oduor L, Dzhanaev R,
Kronqvist M, et al: Osteomodulin attenuates smooth muscle cell
osteogenic transition in vascular calcification. Clin Transl Med.
12:e6822022. View Article : Google Scholar : PubMed/NCBI
|
|
35
|
Hamaya E, Fujisawa T and Tamura M:
Osteoadherin serves roles in the regulation of apoptosis and growth
in MC3T3-E1 osteoblast cells. Int J Mol Med. 44:2336–2344.
2019.PubMed/NCBI
|
|
36
|
Papadaki V, Asada K, Watson JK, Tamura T,
Leung A, Hopkins J, Dellett M, Sasai N, Davaapil H, Nik-Zainal S,
et al: Two secreted proteoglycans, activators of urothelial
cell-cell adhesion, negatively contribute to bladder cancer
initiation and progression. Cancers (Basel). 12:33622020.
View Article : Google Scholar : PubMed/NCBI
|
|
37
|
Nallasamy P, Nimmakayala RK, Parte S, Are
AC, Batra SK and Ponnusamy MP: Tumor microenvironment enriches the
stemness features: The architectural event of therapy resistance
and metastasis. Mol Cancer. 21:2252022. View Article : Google Scholar : PubMed/NCBI
|
|
38
|
Rodrigues FS, Ciccarelli FD and Malanchi
I: Reflected stemness as a potential driver of the tumour
microenvironment. Trends Cell Biol. 32:979–987. 2022. View Article : Google Scholar : PubMed/NCBI
|
|
39
|
Gao Y, Fan WH, Song Z, Lou H and Kang X:
Comparison of circulating tumor cell (CTC) detection rates with
epithelial cell adhesion molecule (EpCAM) and cell surface vimentin
(CSV) antibodies in different solid tumors: A retrospective study.
PeerJ. 9:e107772021. View Article : Google Scholar : PubMed/NCBI
|
|
40
|
Ventura E, Xie C, Buraschi S, Belfiore A,
Iozzo RV, Giordano A and Morrione A: Complexity of progranulin
mechanisms of action in mesothelioma. J Exp Clin Cancer Res.
41:3332022. View Article : Google Scholar : PubMed/NCBI
|
|
41
|
Fromme JE and Zigrino P: The role of
extracellular matrix remodeling in skin tumor progression and
therapeutic resistance. Front Mol Biosci. 9:8643022022. View Article : Google Scholar : PubMed/NCBI
|
|
42
|
Kolesnikoff N, Chen CH and Samuel MS:
Interrelationships between the extracellular matrix and the immune
microenvironment that govern epithelial tumour progression. Clin
Sci (Lond). 136:361–377. 2022. View Article : Google Scholar : PubMed/NCBI
|
|
43
|
Abu Zaid MI, Radovich M, Althouse S, Liu
H, Spittler AJ, Solzak J, Badve S and Loehrer PJ Sr: A phase II
study of buparlisib in relapsed or refractory thymomas. Front
Oncol. 12:8913832022. View Article : Google Scholar : PubMed/NCBI
|
|
44
|
Heudel P, Frenel JS, Dalban C, Bazan F,
Joly F, Arnaud A, Abdeddaim C, Chevalier-Place A, Augereau P,
Pautier P, et al: Safety and efficacy of the mTOR inhibitor,
vistusertib, combined with anastrozole in patients with hormone
receptor-positive recurrent or metastatic endometrial cancer: The
VICTORIA multicenter, open-label, phase 1/2 randomized clinical
trial. JAMA Oncol. 8:1001–1009. 2022. View Article : Google Scholar : PubMed/NCBI
|
|
45
|
Savas P, Lo LL, Luen SJ, Blackley EF,
Callahan J, Moodie K, van Geelen CT, Ko YA, Weng CF, Wein L, et al:
Alpelisib monotherapy for PI3K-altered, pretreated advanced breast
cancer: A phase II study. Cancer Discov. 12:2058–2073. 2022.
View Article : Google Scholar : PubMed/NCBI
|
|
46
|
Xu C, Wang Z, Zhang L, Feng Y, Lv J, Wu Z,
Yang R, Wu T, Li J, Zhou R, et al: Periostin promotes the
proliferation and metastasis of osteosarcoma by increasing cell
survival and activates the PI3K/Akt pathway. Cancer Cell Int.
22:342022. View Article : Google Scholar : PubMed/NCBI
|
|
47
|
Yu RH, Zhang XY, Xu W, Li ZK and Zhu XD:
Apolipoprotein D alleviates glucocorticoid-induced osteogenesis
suppression in bone marrow mesenchymal stem cells via the PI3K/Akt
pathway. J Orthop Surg Res. 15:3072020. View Article : Google Scholar : PubMed/NCBI
|
|
48
|
Guntur AR, Rosen CJ and Naski MC:
N-cadherin adherens junctions mediate osteogenesis through PI3K
signaling. Bone. 50:54–62. 2012. View Article : Google Scholar : PubMed/NCBI
|
|
49
|
Patente TA, Pinho MP, Oliveira AA,
Evangelista GCM, Bergami-Santos PC and Barbuto JAM: Human dendritic
cells: Their heterogeneity and clinical application potential in
cancer immunotherapy. Front Immunol. 9:31762019. View Article : Google Scholar : PubMed/NCBI
|
|
50
|
Liu D, Heij LR, Czigany Z, Dahl E, Lang
SA, Ulmer TF, Luedde T, Neumann UP and Bednarsch J: The role of
tumor-infiltrating lymphocytes in cholangiocarcinoma. J Exp Clin
Cancer Res. 41:1272022. View Article : Google Scholar : PubMed/NCBI
|
|
51
|
Li H, Han D, Hou Y, Chen H and Chen Z:
Statistical inference methods for two crossing survival curves: A
comparison of methods. PLoS One. 10:e01167742015. View Article : Google Scholar : PubMed/NCBI
|