Introduction
Head and neck cancer (HNC) is the sixth most common
type of cancer (1), accounting for
2.8% of all malignant cancer cases worldwide (2). HNC is a significant cause of morbidity
and mortality across the globe, with 890,000 new cases reported in
2020 (3) and >400,000 deaths
predicted annually worldwide (4).
Head and neck squamous cell carcinoma (HNSCC) accounts for 90% of
HNC cases and describes a group of heterogeneous cancers that
emerge from the upper aerodigestive tract that affect the oral and
nasal cavity, salivary glands, oropharynx, pharynx, larynx,
paranasal sinuses, local lymph nodes and even the middle ear
(5–7). HNSCC is a complex disease
characterized by alterations in multiple genes and pathways
(5,8). However, the underlying molecular
mechanisms of its development and prognosis require further
investigation. Identifying novel therapeutic targets and prognostic
biomarkers of HNSCC will contribute to a deeper understanding of
HNSCC and may assist in prolonging the survival and improving the
quality of life of patients.
With the development of high-throughput sequencing
technologies, using mRNA-sequencing (seq) to identify HNSCC-related
genes and pathways has emerged as a valuable method for cancer
research (9). Numerous mRNA
datasets have been produced for studying a myriad of biological
challenges. These datasets facilitate extensive gene analysis
efforts. For instance, the TP53 gene is frequently mutated
in patients with HNSCC, as evidenced by numerous studies (10–12).
In TP53-mutated HNSCC, sestrin 1, UHRF1BP1 and
microRNA-377-3p have been identified as prognostic markers
(13). Furthermore, CD3D serves as
an independent and favorable prognostic marker for immunotherapy in
patients with HNSCC (14). The
currently identified biomarkers for HNSCC have limited utility,
primarily confined to patient prognosis analysis, thereby
underscoring the imperative need for a comprehensive and versatile
biomarker in this specific context.
In the present study, overlapping genes were
identified by integrating differentially expressed genes (DEGs) and
co-expressed genes using data obtained from The Cancer Genome Atlas
(TCGA) and Gene Expression Omnibus (GEO). A total of 51 overlapping
genes were analyzed using systematic bioinformatics to explore the
underlying molecular mechanisms of HNSCC pathogenesis and to
identify a novel biomarker and a candidate therapeutic target for
HNSCC. Additionally, immune analysis was performed on the selected
targets to further predict the therapeutic value of immunotherapy.
The present study investigated and validated a novel, comprehensive
tumor biomarker termed secretoglobin family 1A member 1
(SCGB1A1), which exhibits significant potential for the
diagnosis, evaluation of treatment efficacy and analysis of patient
prognosis in HNSCC. Furthermore, the present study investigated
whether SCGB1A1 plays a pivotal role in the metabolic and immune
regulatory processes within HNSCC, thereby emerging as a promising
therapeutic target for effective management of HNSCC.
Materials and methods
Data collection
After conducting a comprehensive search of the GEO
database (https://www.ncbi.nlm.nih.gov/geo/) for HNSCC as well
as normal head and neck tissues, the available datasets were
narrowed down to 40 datasets based on specific criteria, such as
array-based expression profiling and human tissue type. The
GSE30784 dataset (15,16) was selected for data analysis based
on the sample size (the other available datasets included fewer
samples), aiming to obtain more precise data. This dataset consists
of 45 normal tissues and 167 HNSCC tissues. The GPL570 platform
(Affymetrix; Thermo Fisher Scientific, Inc.; version 1.38.0) was
used to analyze the microarray data. For this, after downloading
the GEO dataset, the gene expression matrix was extracted and the
merge function was utilized to convert probe names into
corresponding gene names. Finally, 20,549 genes were selected for
subsequent analysis (17). In
addition, relevant datasets and clinical information on HNSCC were
also obtained from TCGA (18)
(dataset: TCGA-HNSC; http://portal.gdc.cancer.gov). A total of 83 samples
(13 normal samples and 70 cancer samples) and 14,212 genes were
selected for subsequent analysis.
Identification of DEGs
DEG analysis was performed as described in our
previous study with some modifications (19). Briefly, the ‘limma’ package in R
(version; 4.0.3) was used to analyze the data obtained from TCGA
and the GEO (20,21). During the gene differential analysis
process, a logarithmic transformation was applied to the data in
the GeneMatrix file to normalize its overall scale. The
Log2FoldChange (FC) values ranged between 0 and 2, with only 2
genes exhibiting absolute values >1. To ensure suitability for
subsequent analyses, the range of absolute FC values was expanded
to include those as low as 0.2. Therefore, the DEGs between
adjacent normal tissues and HNSCC samples were defined based on a
|logFC|>1 and false discover rate (FDR)<0.05 for the data
obtained from TCGA, or |logFC|>0.2 (22) and FDR<0.05 for data obtained from
the GEO. Next, the DEGs in the datasets were output in the form of
a volcano plot using the ‘ggplot’ package in R (23).
Weighted gene co-expression network
analysis (WGCNA)
The ‘WGCNA’ package in R was used to construct the
weighted gene co-expression network and to classify the
co-expression modules (24,25). First, gene correlations and an
adjacency matrix were calculated. Next, this matrix was transformed
into a topological overlap matrix (TOM) to reduce noise and false
correlations [gene co-expression matrix, S=(Sij); adjacency
function, Aij=power (Sij, β)=| Sij| β) |GS| ˃0.5, |MM| ˃0.8]. TOM
was used to convert the correlation between genes into a distance
matrix. The distance matrix was used for cluster analysis, and the
genes were classified into the same module. Finally, the
significant modules associated with traits were determined and
selected for subsequent analysis (24,26).
Unsupervised clustering analysis
To identify genes that were significantly
differentially expressed in HNSCC in the data obtained from TCGA,
unsupervised clustering analysis was performed using
‘ConsensusClusterPlus’ in R (27).
Screening of overlapping genes by the
intersection of differential genes and differential modules
The overlapping genes between the DEGs were screened
using the limma package, and the co-expression genes of modules
were screened by differential clinical characteristics. A Venn
diagram was constructed using the ‘VennDiagram’ package in R
(28).
Gene Set Enrichment Analysis
(GSEA)
Gene Ontology (GO) and Kyoto Encyclopedia of Genes
and Genomes (KEGG) analyses and GSEA were performed as described in
our previous study with slight modifications (19). The R packages ‘clusterProfiler’,
‘ggplot2’, ‘enrichplot’ and ‘org.Hs.eg.db’ were used to perform the
GO and KEGG pathway analyses (29,30).
P- and Q-values <0.05 were considered significantly enriched.
GSEA of the hub genes in the high-expression group [samples
exhibiting expression levels surpassing the median expression level
of the target gene (SCGB1A1) in the expression matrix were
categorized as belonging to the high-expression group] was
performed using the KEGG gene sets and the hallmarks from the
Molecular Signatures Database (MSigDB; version 7.5.1) gene sets
were used to identify the enriched pathways (31). Each enrichment analysis was
performed using 1,000× gene set permutations. Pathways with an
FDR<0.05 and a nominal P<0.05 were considered significantly
enriched.
Protein-protein interaction (PPI)
network construction
The PPI network was constructed as described in our
previous study with slight modifications (19). Briefly, the PPIs of the identified
DEGs were predicted using the Search Tool for the Retrieval of
Interacting Genes/Proteins (STRING), an online tool for determining
the interacting genes/proteins (https://cn.string-db.org/) (32). Then, the intersecting genes were
identified from the PPI network. The Cytoscape (version 3.7.2)
platform was utilized to visualize the interactive network of
overlapping genes, and a confidence level of >0.95 was used to
build the network (33,34).
Survival analysis of the hub
genes
Survival analysis of the hub genes was performed as
described previously with slight modifications (19). The R packages ‘survival’ and
‘survminer’ were used to analyze the clinical information of the
hub genes; ‘survival’ was used for Kaplan-Meier survival curve
analysis and ‘survminer’ was used for ‘ggsurvplot’ visualization
and statistical analysis (all using the default settings) (35,36).
P<0.05 was considered to indicate a statistically significant
difference.
Pan-cancer analysis
RNA-sequencing expression profiles and corresponding
clinical information for pan-cancer were downloaded from TCGA
(https://portal.gdc.com). All the analysis methods
were implemented by R version 4.0.3. If not stated otherwise,
two-group data comparisons were performed by the Wilcoxon test.
P<0.05 were considered to indicate a statistically significant
difference (https://www.aclbi.com/static/index.html#/pan_cancer).
Clinical samples
Clinical samples were collected according to a
protocol approved by the Ethics Committee of the Medical College of
Qingdao University (Qingdao, China; approval no. QDU-HEC-2022166).
All patients consented to participation in the present study,
signed informed consent forms and agreed to the publication of the
collected data. The patient inclusion criteria were as follows:
Patients with HNSCC without any other diseases, including chronic
diseases. From March, 2023 to September, 2023, a total of 12 oral
squamous cell carcinoma tissue samples (from 7 male and 5 female
patients; median age, 58 years old; age range, 38–79 years old)
were collected during surgery at the Qingdao Municipal Hospital.
Adjacent normal tissues were also collected from the same
patients.
Cell culture and treatment
CAL27 and SCC-9 cells (both from Hunan Fenghui
Biotechnology Co., Ltd.) were cultured in DMEM-H and DMEM-H/F12
(both from Gibco; Thermo Fisher Scientific, Inc.), respectively,
supplemented with 10% FBS (TransGen Biotech Co., Ltd.) in a
humidified incubator supplied with 5% CO2 air at 37°C.
Cells were treated with 0, 1 or 3 µM doxorubicin (DOX; Selleck
Chemicals) in medium for 12 h.
Lentiviral (Lv) vector
The Lv-SCGB1A1 overexpression vector was constructed
in our laboratory. The SCGB1A1 sequence was downloaded from
the NCBI (https://www.ncbi.nlm.nih.gov/gene/7356), and the
primers for SCGB1A1 were designed using SnapGene 4.0
(https://www.snapgene.com/). The primer
sequences were as follows: Forward 5′-ATGAAACTCGCTGTCACCCTCACC-3′
and reverse 5′-CTAATTACACAGTGAGCTTTGGGCTATTTTTTCC-3′. The amplified
products were then inserted into the PCDH vector (Hunan Fenghui
Biotechnology Co., Ltd.) and used to establish a stably expressing
cell line. The negative control (LV-control) was an empty plasmid
that did not express SCGB1A1. The 2nd generation system (Hunan
Fenghui Biotechnology Co., Ltd.) was used to producing lentivirus.
For this, 80% confluent 293T cells (Hunan Fenghui Biotechnology
Co., Ltd.) in a 10-cm dish were transfected with 10 µg SCGB1A1 or
control plasmid, 5 µg PMD2G plasmid and 5 µg PsPAX2 plasmid using
Lipofectamine 3000 Transfection Reagent (Invitrogen; Thermo Fisher
Scientific, Inc.), according to the manufacturer's instructions.
The cells were incubated in a humidified incubator supplied with 5%
CO2 air at 37°C. After 6 h, the transfection medium was
replaced with DMEM-H containing 5% FBS and cultured for another 48
h for the generation of lentivirus. The lentiviral particles were
collected using Amicon® Ultra-15 (Merck KGaA). CAL27
cells were transduced with SCGB1A1 or control lentivirus at MOI=10
and the transduction medium contained 1% lentiBOOST (Sirion Biotech
GmbH) to promote viral transduction. After 18 h, the transduction
medium was replaced with normal medium. After another 72 h, 4 µg/ml
puromycin (Selleck Chemicals) was used for selection and
maintenance of the stable cell line. The stable cell line was used
for subsequent experiments 1 week later.
To investigate the influence of SCGB1A1
overexpression on cell viability, 2×10⁴ cells/well were
seeded into 96-well plates and the cell viability was detected by
Cell Counting Kit-8 (CCK-8) assay once a day, continuously for 6
days. The CCK-8 assay (Dalian Meilun Biology Technology Co., Ltd.;
cat. no. MA0218) was performed according to the manufacturer's
protocol.
Immunohistochemistry
Paraffin-embedded sections of oral squamous cell
carcinoma tissues and normal tissues were collected for
immunohistochemical staining. Immunochemical staining was performed
as described in our previous study (37). Briefly, tissues were fixed in 4%
paraformaldehyde at 4°C for 24 h, followed by embedding in
paraffin. The tissues were cut into 5 µm sections and used for
subsequent experiments. The sections were blocked with goat serum
(Solarbio; cat. no. SL038) at room temperature for 1 h, then 1X
endogenous peroxidase blocking buffer (Beyotime Institute of
Biotechnology; cat. no. P0100B) was used to block endogenous
peroxidase/phosphatase activity. Samples were incubated with a
primary antibody against SCGB1A1 (1:100; Affinity Biosciences; cat.
no. DF6581) at 4°C overnight, followed by the secondary antibody
[Goat Anti-Rabbit IgG (H+L) HRP; 1:200; Affinity Biosciences; cat.
no. S0001] at room temperature for 1 h. Finally, the samples were
incubated with DAB at room temperature for 10 min. Images were
obtained using an OLYMPUS CKX53 in light mode. Figure analysis was
performed using ImageJ 1.51 (National Institutes of Health).
CCK-8 assay
A total of 2×10⁴ cells/well were seeded
into 96-well plates and incubated overnight for adherence. The
cells were subsequently treated with 0, 1 or 3 µM DOX for 12 h.
After treatment, a CCK-8 assay was performed according to the
manufacturer's protocol.
Reverse transcription-quantitative PCR
(RT-qPCR)
RT-qPCR was used for the detection of hub gene
expression as described previously (38). Total RNA was extracted from clinical
samples and treated cells using an RNA isolation kit (Tiangen
Biotech Co., Ltd.). RT to generate cDNA was performed using the
TransScript II One-Step gDNA Removal and cDNA Synthesis SuperMix
(TransGen Biotech Co., Ltd.) according to the manufacturer's
instructions. TransStart Green qPCR SuperMix (TransGen Biotech Co.,
Ltd.) was used for qPCR. The thermocycler conditions were as
follows: 94°C for 10 min, then 94°C for 5 sec and 60°C for 30 sec
for 40 cycles. The expression levels of the hub genes were
normalized to that of β-actin and calculated using the
2−ΔΔCq method (38). The
sequences of the primers used for amplification are listed in
Table SI.
Western blotting
The treated cells were lysed in RIPA lysis buffer
(Shanghai Epizyme Biotech Co., Ltd.; cat. no. PC102) containing 1%
protease inhibitor (Shanghai Epizyme Biotech Co., Ltd.; cat. no.
GRF101). The protein concentrations were then determined using a
BCA kit (Shanghai Epizyme Biotech Co., Ltd.; cat. no. ZJ101). Equal
amounts of protein (20 µg) per lane were loaded and separated on a
12.5% SDS-PAGE gel, then proteins were transferred onto a PVDF
membrane, which was blocked in 5% skim milk (Shanghai Epizyme
Biotech Co., Ltd.; cat. no. PS112) dissolved in 1% tris-buffered
saline Tween-20 (TBST) (Shanghai Epizyme Biotech Co., Ltd.; cat.
no. TF103) at room temperature for 1 h with slight shaking. The
membranes were next incubated with the primary SCGB1A1 (1:2,000;
Rabbit; Affinity Biosciences; cat. no. DF6581) and actin (1:10,000;
Rabbit; Affinity Biosciences; cat. no. AF7018) antibodies overnight
at 4°C. After washing three times with 1% TBST, the membranes were
incubated with secondary antibody [Goat Anti-Rabbit IgG (H+L) HRP;
1:10,000; Affinity Biosciences; cat. no. S0001] for 1 h at room
temperature. After washing three times with 1% TBST, the blots were
visualized using Omni-ECL™ (Shanghai Epizyme Biotech
Co., Ltd.; cat. no. SQ201). Images were obtained using an
integrated chemiluminescence imaging system (Shanghai Epizyme
Biotech Co., Ltd.; cat. no. XF101). Semi-quantitative analysis was
performed using ImageJ 1.51 (National Institutes of Health).
Drug sensitivity and molecular docking
analysis
RNA-seq expression data from HNSCC samples were
downloaded from TCGA as aforementioned (https://portal.gdc.com). pRRophetic was used to
predict the response of SCGB1A1 to drugs in the Cancer Genome
Project database
(ftp://ftp.sanger.ac.uk/pub4/cancerrxgene/releases), based on
expression levels of SCGB1A1, the IC50 values of
different drugs between SCGB1A1 high and low groups were compared
using the Wilcoxon rank-sum test (39,40).
The 2D structures of drugs were downloaded from PubChem (https://pubchem.ncbi.nlm.nih.gov/), transformed
into 3D structures and optimized using Chem3D (https://library.bath.ac.uk/chemistry-software/chem3d).
Non-polar hydrogens were added to the 3D structures using
AutoDockTools (ADT; version 1.5.6; http://autodocksuite.scripps.edu/adt/) (41). The 3D structure of SCGB1A1 was
downloaded from the RCSB Protein Data Bank (https://www.rcsb.org/; accession no. 7vf3) (42). The water molecules and molecular
ligands were removed in ADT and non-polar hydrogens were added.
AutoDock Vina (version 1.1.2) was used to simulate the docking of
the drugs with the SCGB1A1 protein, and the docking conformations
were visualized using PyMOL (version 2.3; Schrodinger, LLC)
(43).
Immunological analysis
Immunological analysis was performed online
according to the included instructions (https://www.home-for-researchers.com/static/index.html#/).RNA-seq
expression profiles and the corresponding clinical information for
HNSCC were downloaded from TCGA as aforementioned. The R package
‘ggalluvial’ was used to build the Sankey diagram. All the
analytical methods and R packages were implemented by R (foundation
for statistical computing 2020) version 4.0.3 (44). To assess the reliability of the
results of the immune score evaluation, ‘immuneeconv’ was used, an
R software package that integrates six of the latest algorithms,
including TIMER, xCell, MCP-counter, CIBERSORT, EPIC and quanTIseq
(45–48). SIGLEC15, IDO1, CD274, HAVCR2,
PDCD1, CTLA4, LAG3 and PDCD1LG2 are the transcripts associated
with immune checkpoint-related genes, thus the expression of these
8 genes was assessed (44,49–52).
Results derived from normal and cancer tissues were compared using
the Wilcoxon test.
GeneMANIA analysis
GeneMANIA analysis was performed using the URL:
http://genemania.org, application version: 3.6.0.
The analyses are conducted based on the descriptions provided by
others, following the default conditions (53).
Gene mutation analysis
Mutation analysis of glycolysis-related genes and
cluster analysis of DEGs was performed using the somatic mutation
data from TCGA. The ‘maftools’ function in R was used for mutation
analysis, while organizing and visualizing the results using
different functional packages (54).
Statistical analysis
Data are presented as the mean ± SD of at least
three independent experiments. Differences between multiple groups
were compared using one-way ANOVA followed by Tukey's post hoc
test. The comparison of only two groups was conducted using paired
t-test. The cell viability curve data were analyzed using an
un-paired t-test. All statistical analyses were performed using
GraphPad Prism version 5.0 (Dotmatics). P<0.05 was considered to
indicate a statistically significant difference.
Results
The aim of the present study was to identify a
potential biomarker and a candidate therapeutic target for HNSCC.
The workflow of the present study is shown in Fig. 1.
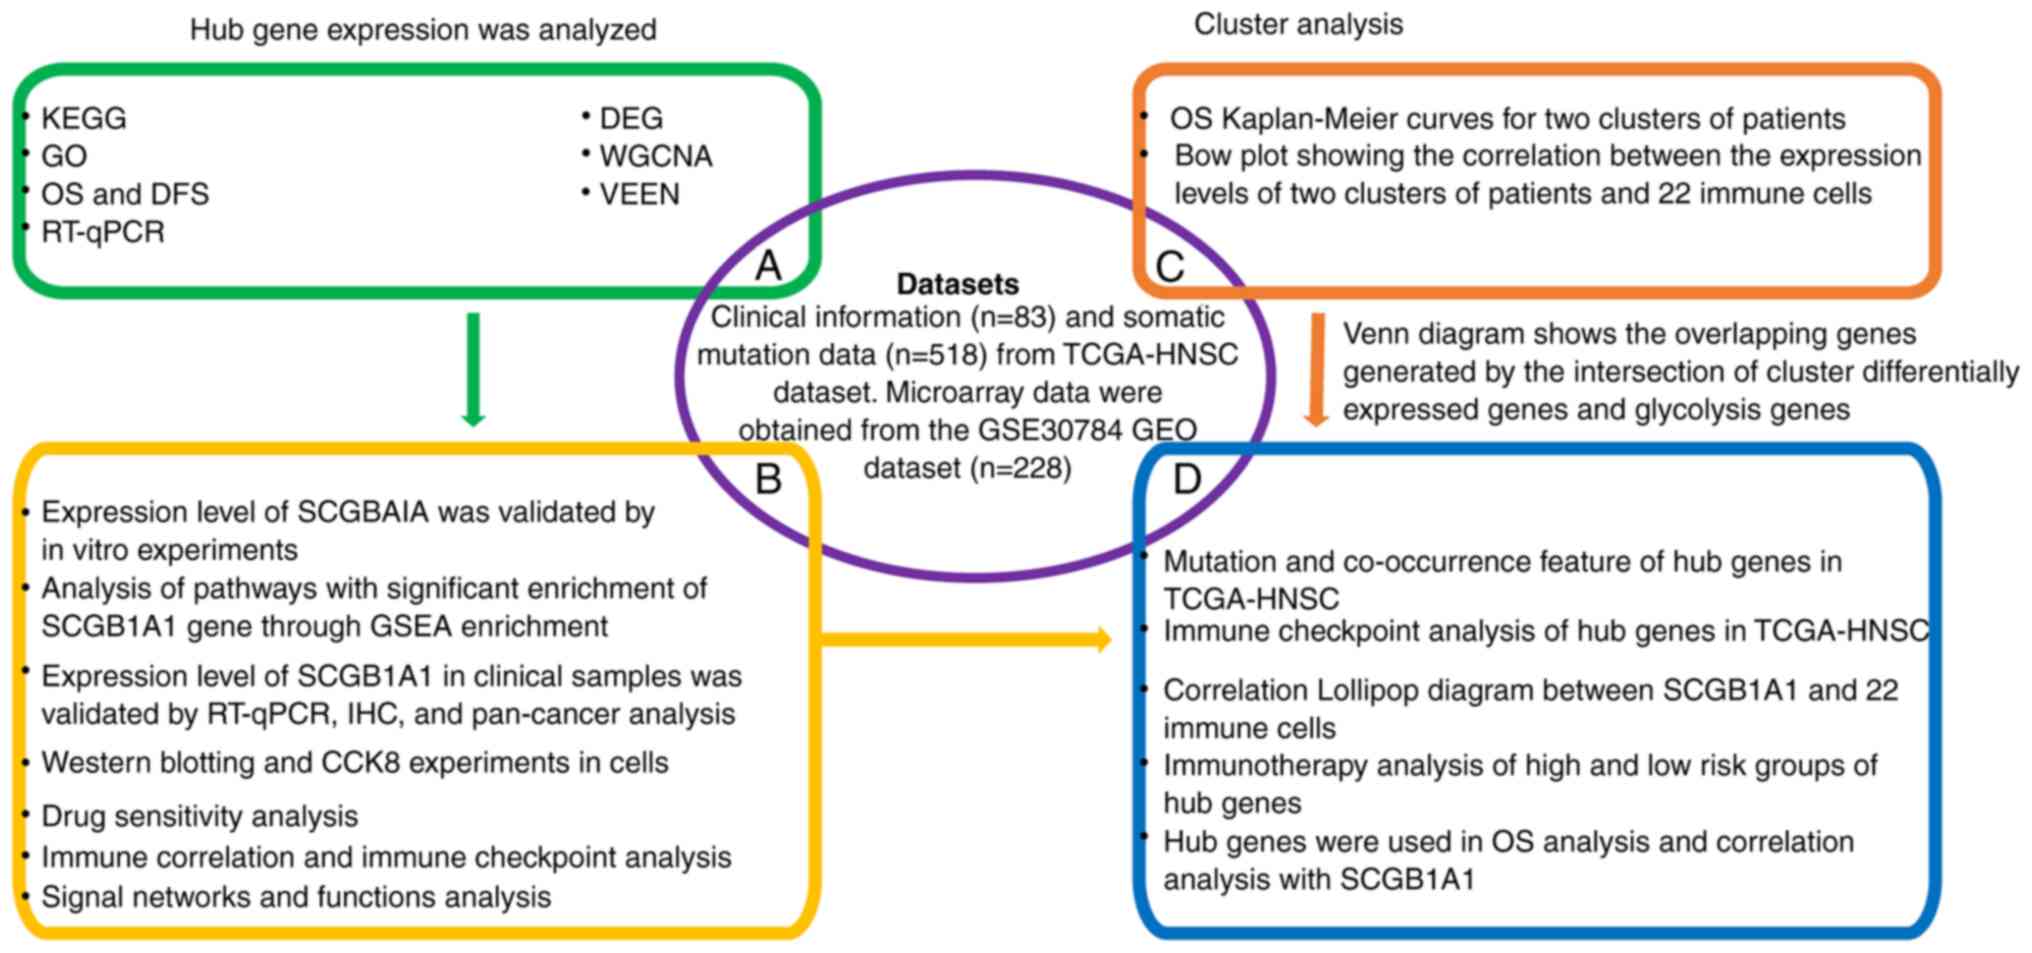 | Figure 1.Workflow of the present study. KEGG,
Kyoto Encyclopedia of Genes and Genomes; GO, Gene Ontology; OS,
overall survival; DFS, disease-free survival; RT-qPCR, reverse
transcription-quantitative PCR; DEG, differentially expressed gene;
WGCNA, weighted gene co-expression network analysis; HNSC, head and
neck squamous cell carcinoma; TCGA, The Cancer Genome Atlas; GEO,
Gene Expression Omnibus; GSEA, Gene Set Enrichment Analysis; IHC,
immunohistochemistry; CCK8, Cell Counting Kit 8; SCGB1A1,
secretoglobin family 1A member 1. |
DEG identification, WGCNA and cluster
analysis
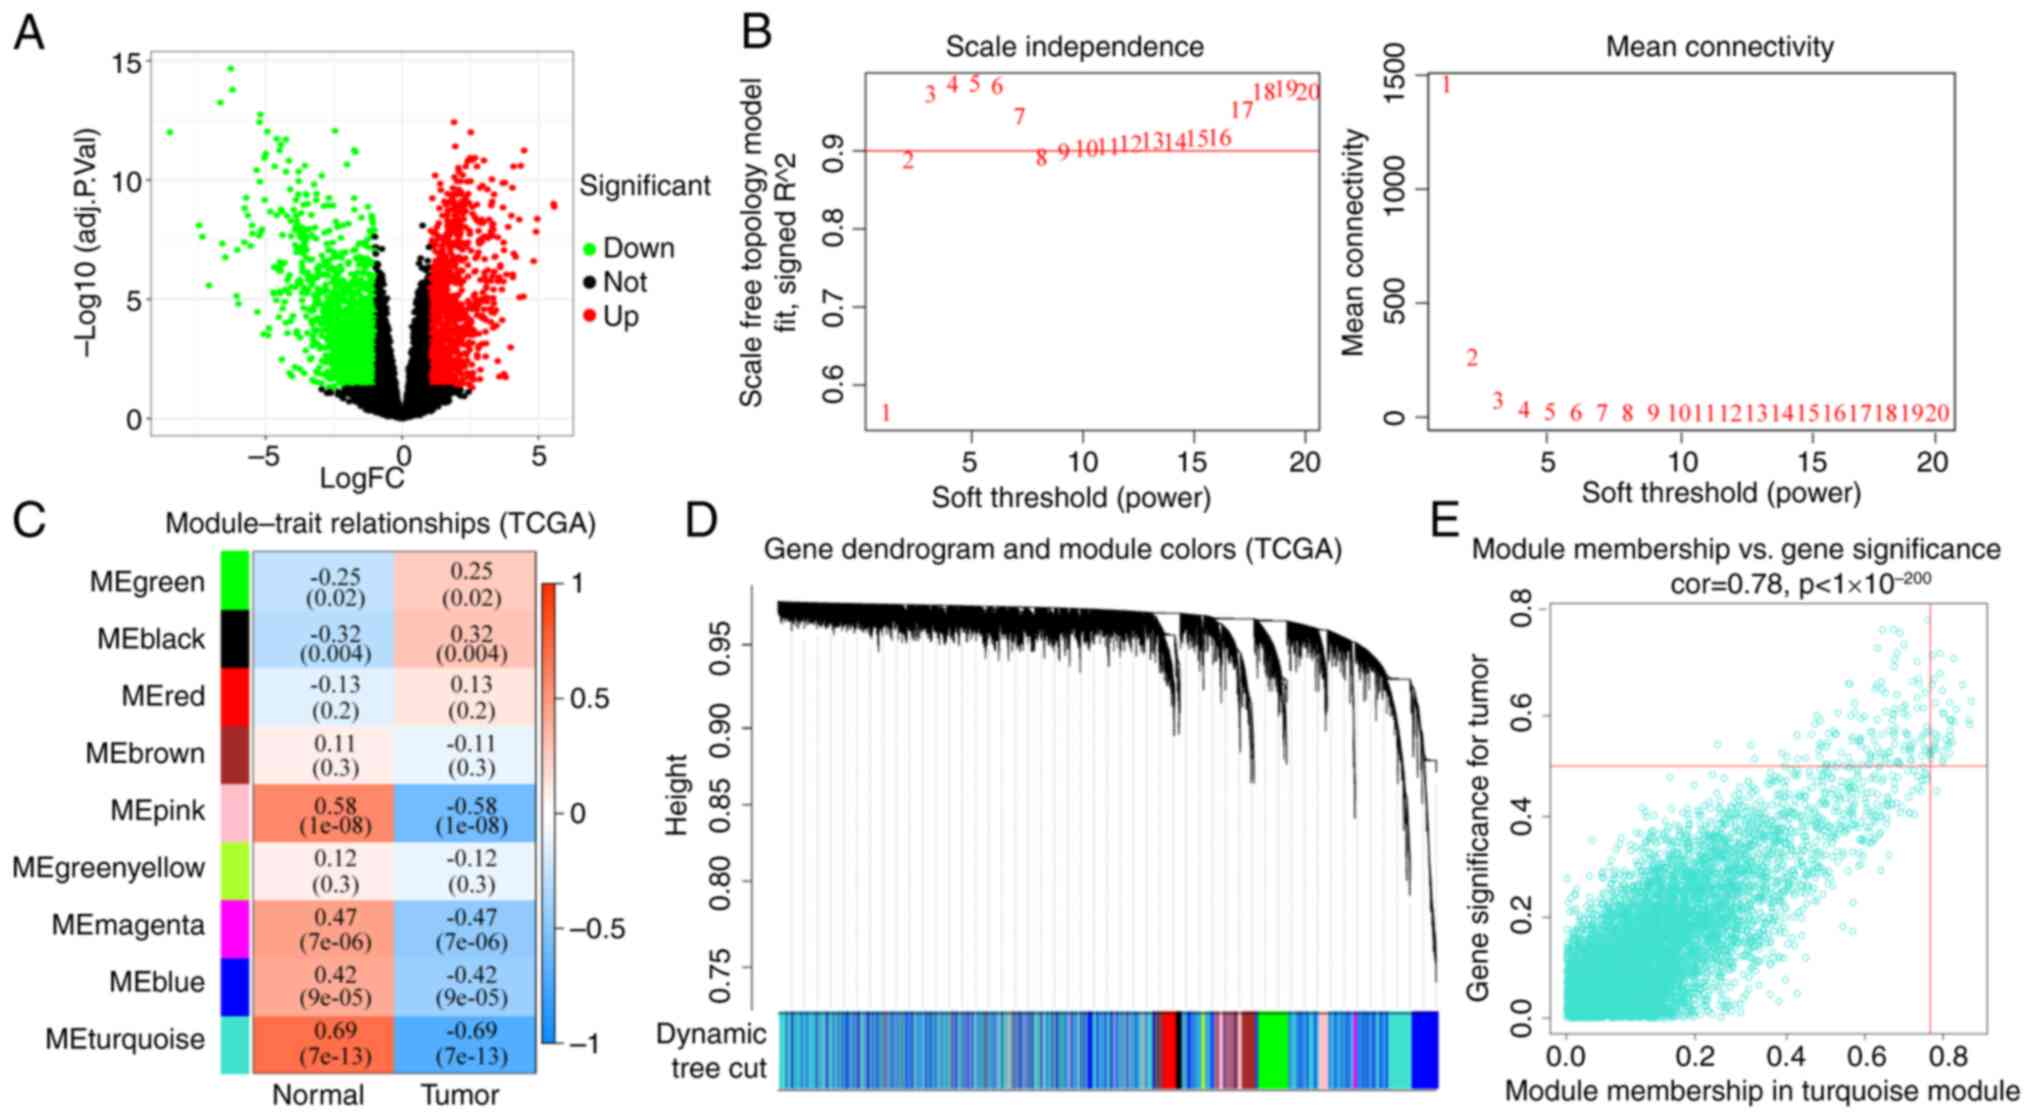
The GEO (20,549 genes; Table SII) and TCGA (14,212 genes;
Table SIII) HNSCC datasets were
used to identify DEGs. The DEGs identified from TCGA (2,479 genes)
or GEO (841 genes) datasets are shown in Fig. 2A and Table SIV or Fig. S1A and Table SV, respectively. The DEGs that were
significantly differentially expressed between normal and tumor
tissues, along with DEG expression profiles in 70 (TCGA) and 184
(GEO) patients with HNSCC, were included in the construction of a
co-expression network with 9 (TCGA) and 13 (GEO) genes as the soft
thresholding power β (Figs. 2B and
S1B). A total of four WGCNA
modules were identified (Figs. 2C
and S1C). The relationships
between the DEGs and the four co-expression modules were explored
in Figs. S1D and 2D. The results
showed that the DEGs were most commonly associated with the
designated turquoise and red modules. The association between
module membership and gene significance for a tumor in the
turquoise and red modules was then analyzed (Figs. S2E and S1E and Tables SVI and SVII), which showed that gene significance
for a tumor in the DEGs was significantly associated with the
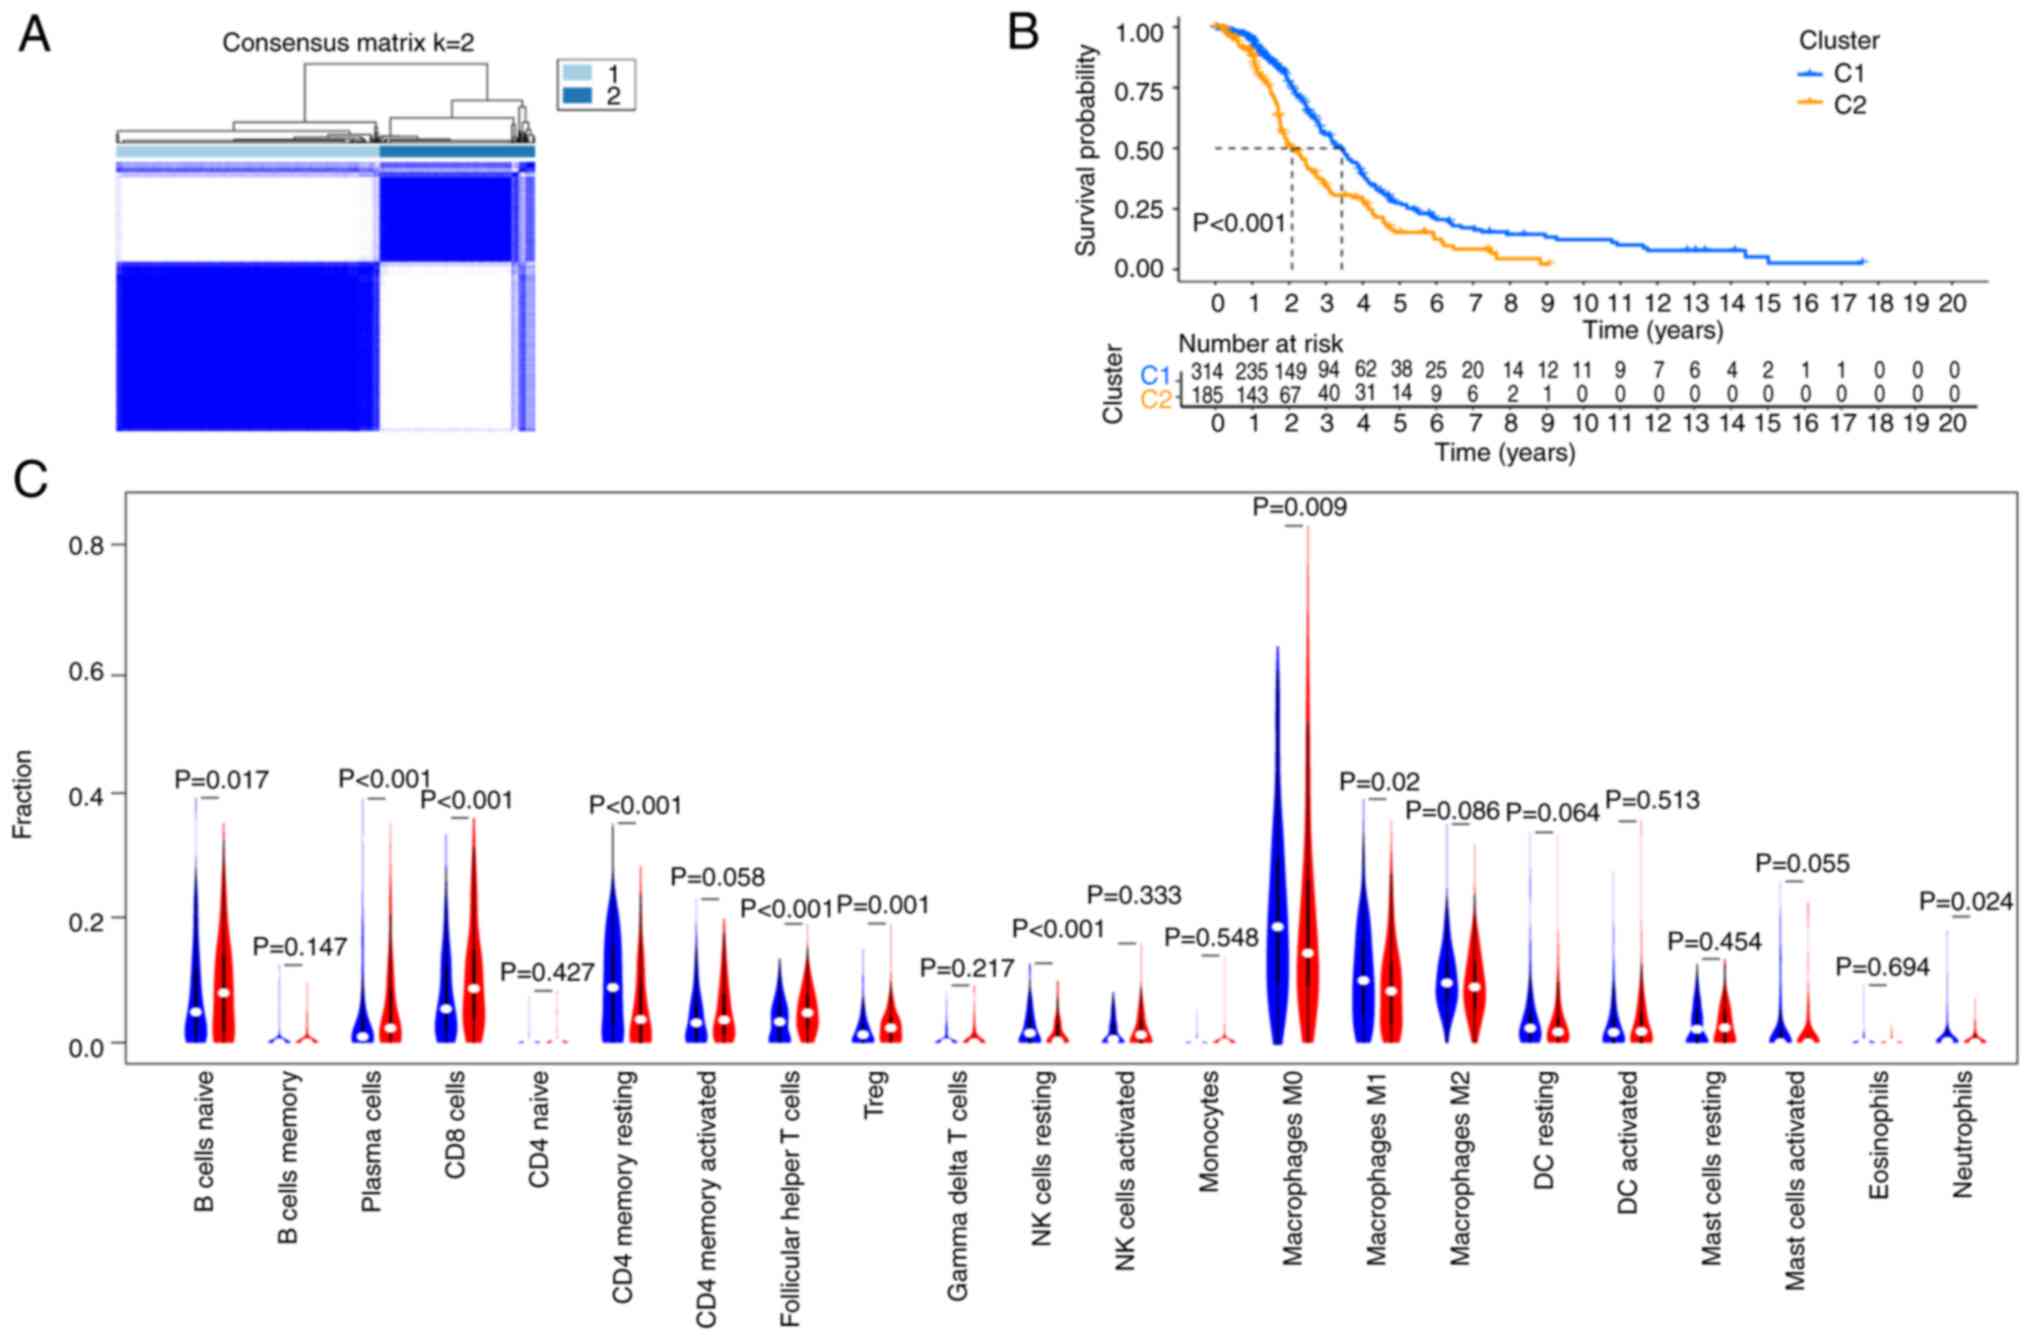
corresponding module membership. Using TCGA-HNSC dataset for
unsupervised clustering analysis, the data were divided into two
categories: Clusters 1 and 2 (Fig.
3A), and there was a significant difference in the median
survival between these two clusters (Fig. 3B). To understand the relationship
between these two clusters in immune cell infiltration, the
CIBERSORT algorithm was used to study the infiltration of 22 types
of immune cells. The results demonstrated that the differential
genes in Clusters 1 and 2 had different immune infiltration scores
for different immune cells. The proportions of Naïve B cells,
plasma cells, CD8+ T cells, T follicular helper cells
and regulatory T cells in Cluster 2 were higher than that in
Cluster 1, while the proportions of resting CD4+ memory
T cells, resting natural killer cells, M0 and M1 macrophages and
neutrophils in Cluster 1 were higher (Fig. 3C).
Functional enrichment analysis
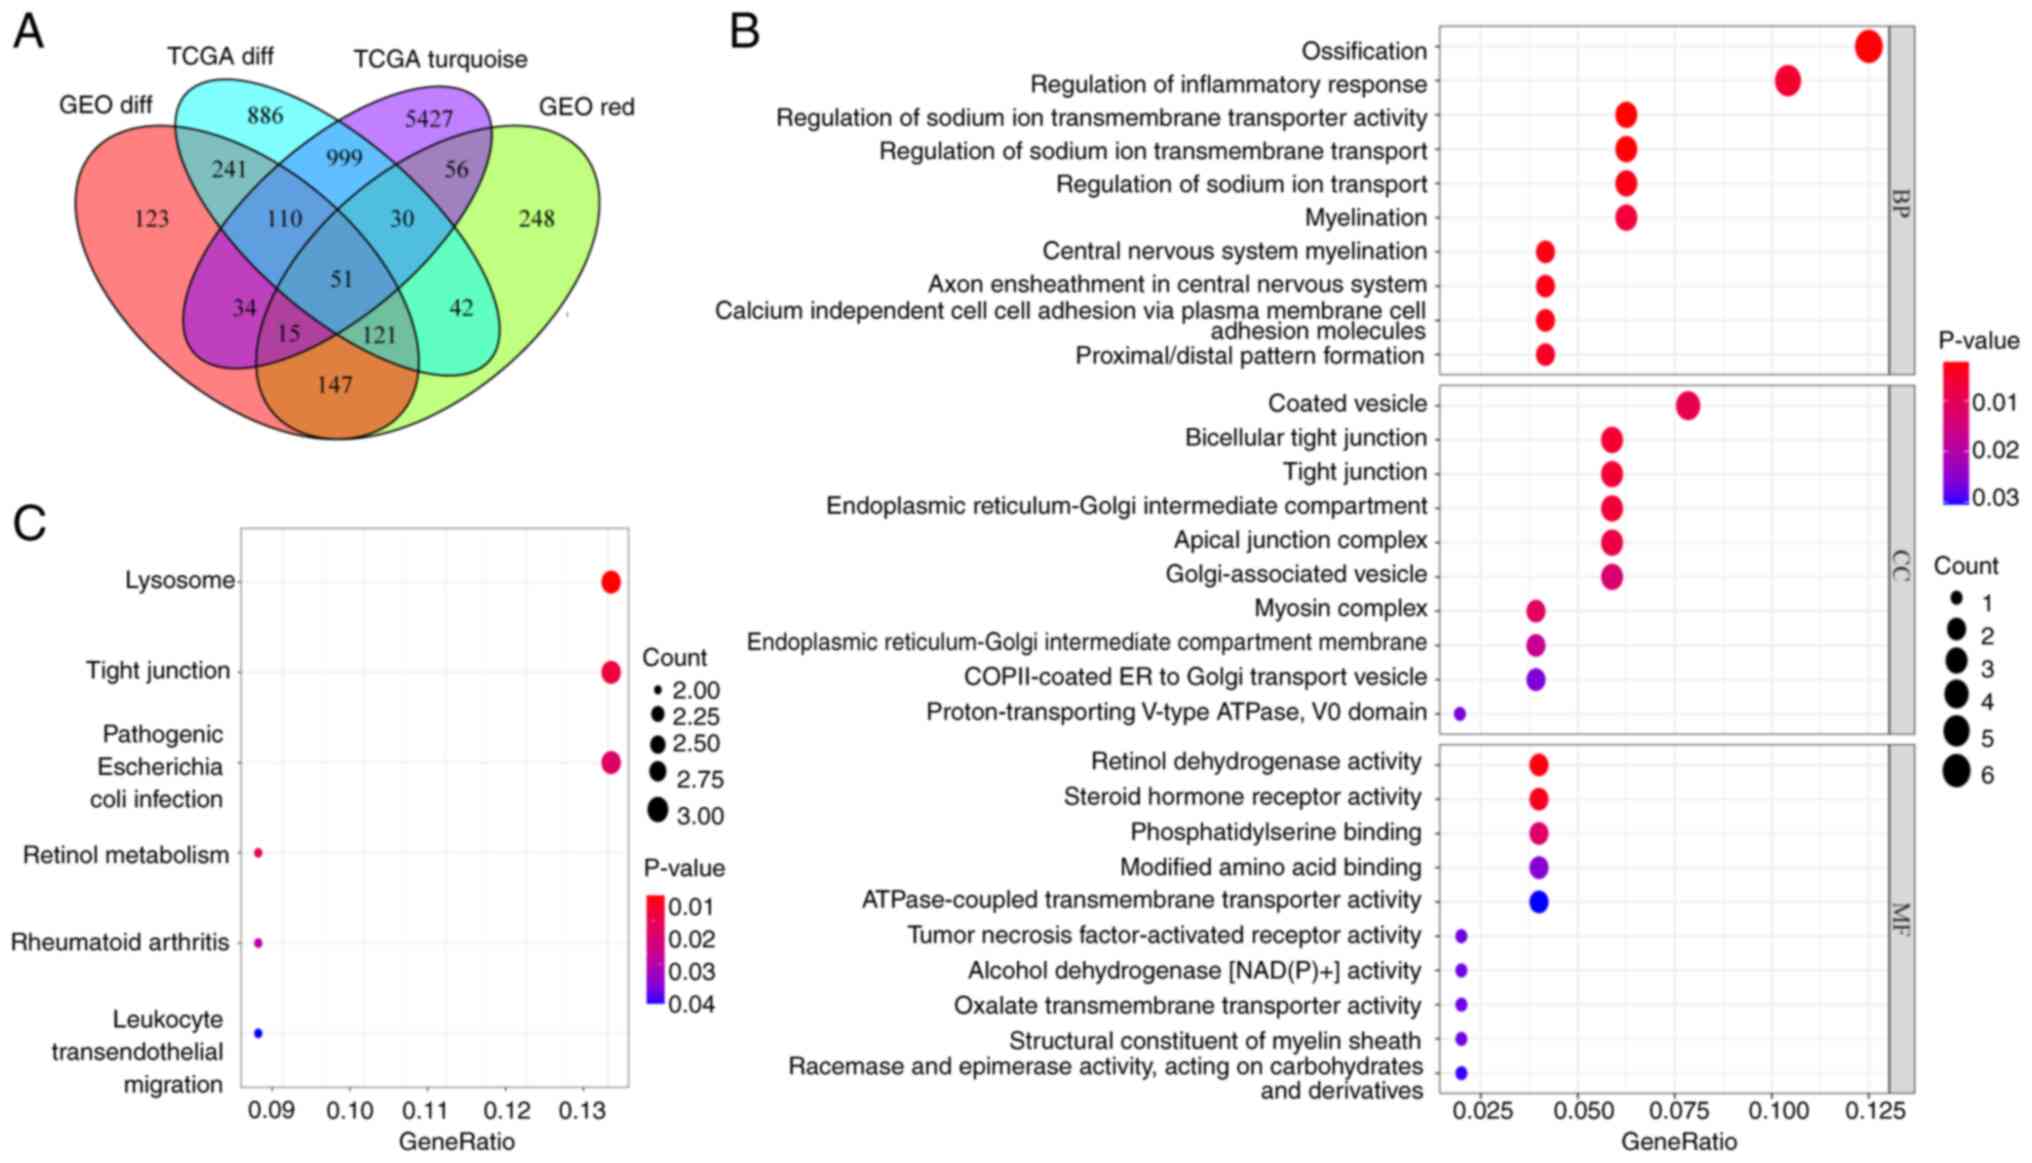
A total of 51 overlapping genes were identified by
integrating DEGs and co-expressed genes from TCGA and GEO datasets
(Fig. 4A). GO functional enrichment
analysis showed that the overlapping genes were involved in the
biological processes of ‘ossification’, ‘regulation of inflammatory
response’ and ‘regulation of sodium ion transmembrane transporter
activity’, the cellular components of ‘coated vesicle’, ‘bicellular
tight junction’ and ‘tight junction’ and the molecular functions of
‘retinol dehydrogenase activity’, ‘steroid hormone receptor
activity’ and ‘phosphatidylserine binding’ (Fig. 4B). KEGG pathway analysis indicated
that the overlapping genes were involved in the ‘Lysosome’, ‘Tight
junction’, ‘Pathogenic Escherichia coli infection’, ‘Retinol
metabolism’, ‘Rheumatoid arthritis’ and ‘Leukocyte transendothelial
migration’ pathways (Fig. 4C).
Survival analysis and expression
characteristics of SCGB1A1
A PPI network was constructed using the STRING
database with 72 edges and 51 nodes (Fig. S2A and B). CytoHubba was used to
filter the hub genes in the PPI network. The top 10 hub genes were
CLDN8, CAB39L, PLP1, GPX3, ATP6V0A4, GPD1L, cathepsin C
(CTSC), SCGB1A1, ATP binding cassette subfamily A
member 8 (ABCA8) and SLC26A2 (Fig. S2C).
Kaplan-Meier curves were used for survival analysis,
and the results revealed that ABCA8 and SCGB1A1 were
significantly associated with overall survival (Figs. 5A, B and S3). Patients with upregulated expression
levels of ABCA8 and SCGB1A1 had a longer overall
survival time. In addition, CTSC and SCGB1A1 were
significantly associated with disease-free survival (Figs. 5C, D and S4). Patients with a low expression level
of CTSC and a high expression level of SCGB1A1 had a
longer disease-free survival time. Further analysis showed that the
expression levels of SCGB1A1 were also associated with the
pathological TNM stage and grade of patients with HNSCC (Fig. S5A and B). In summary, the
expression level of SCGB1A1 could be used to evaluate the
prognosis of patients with HNSCC.
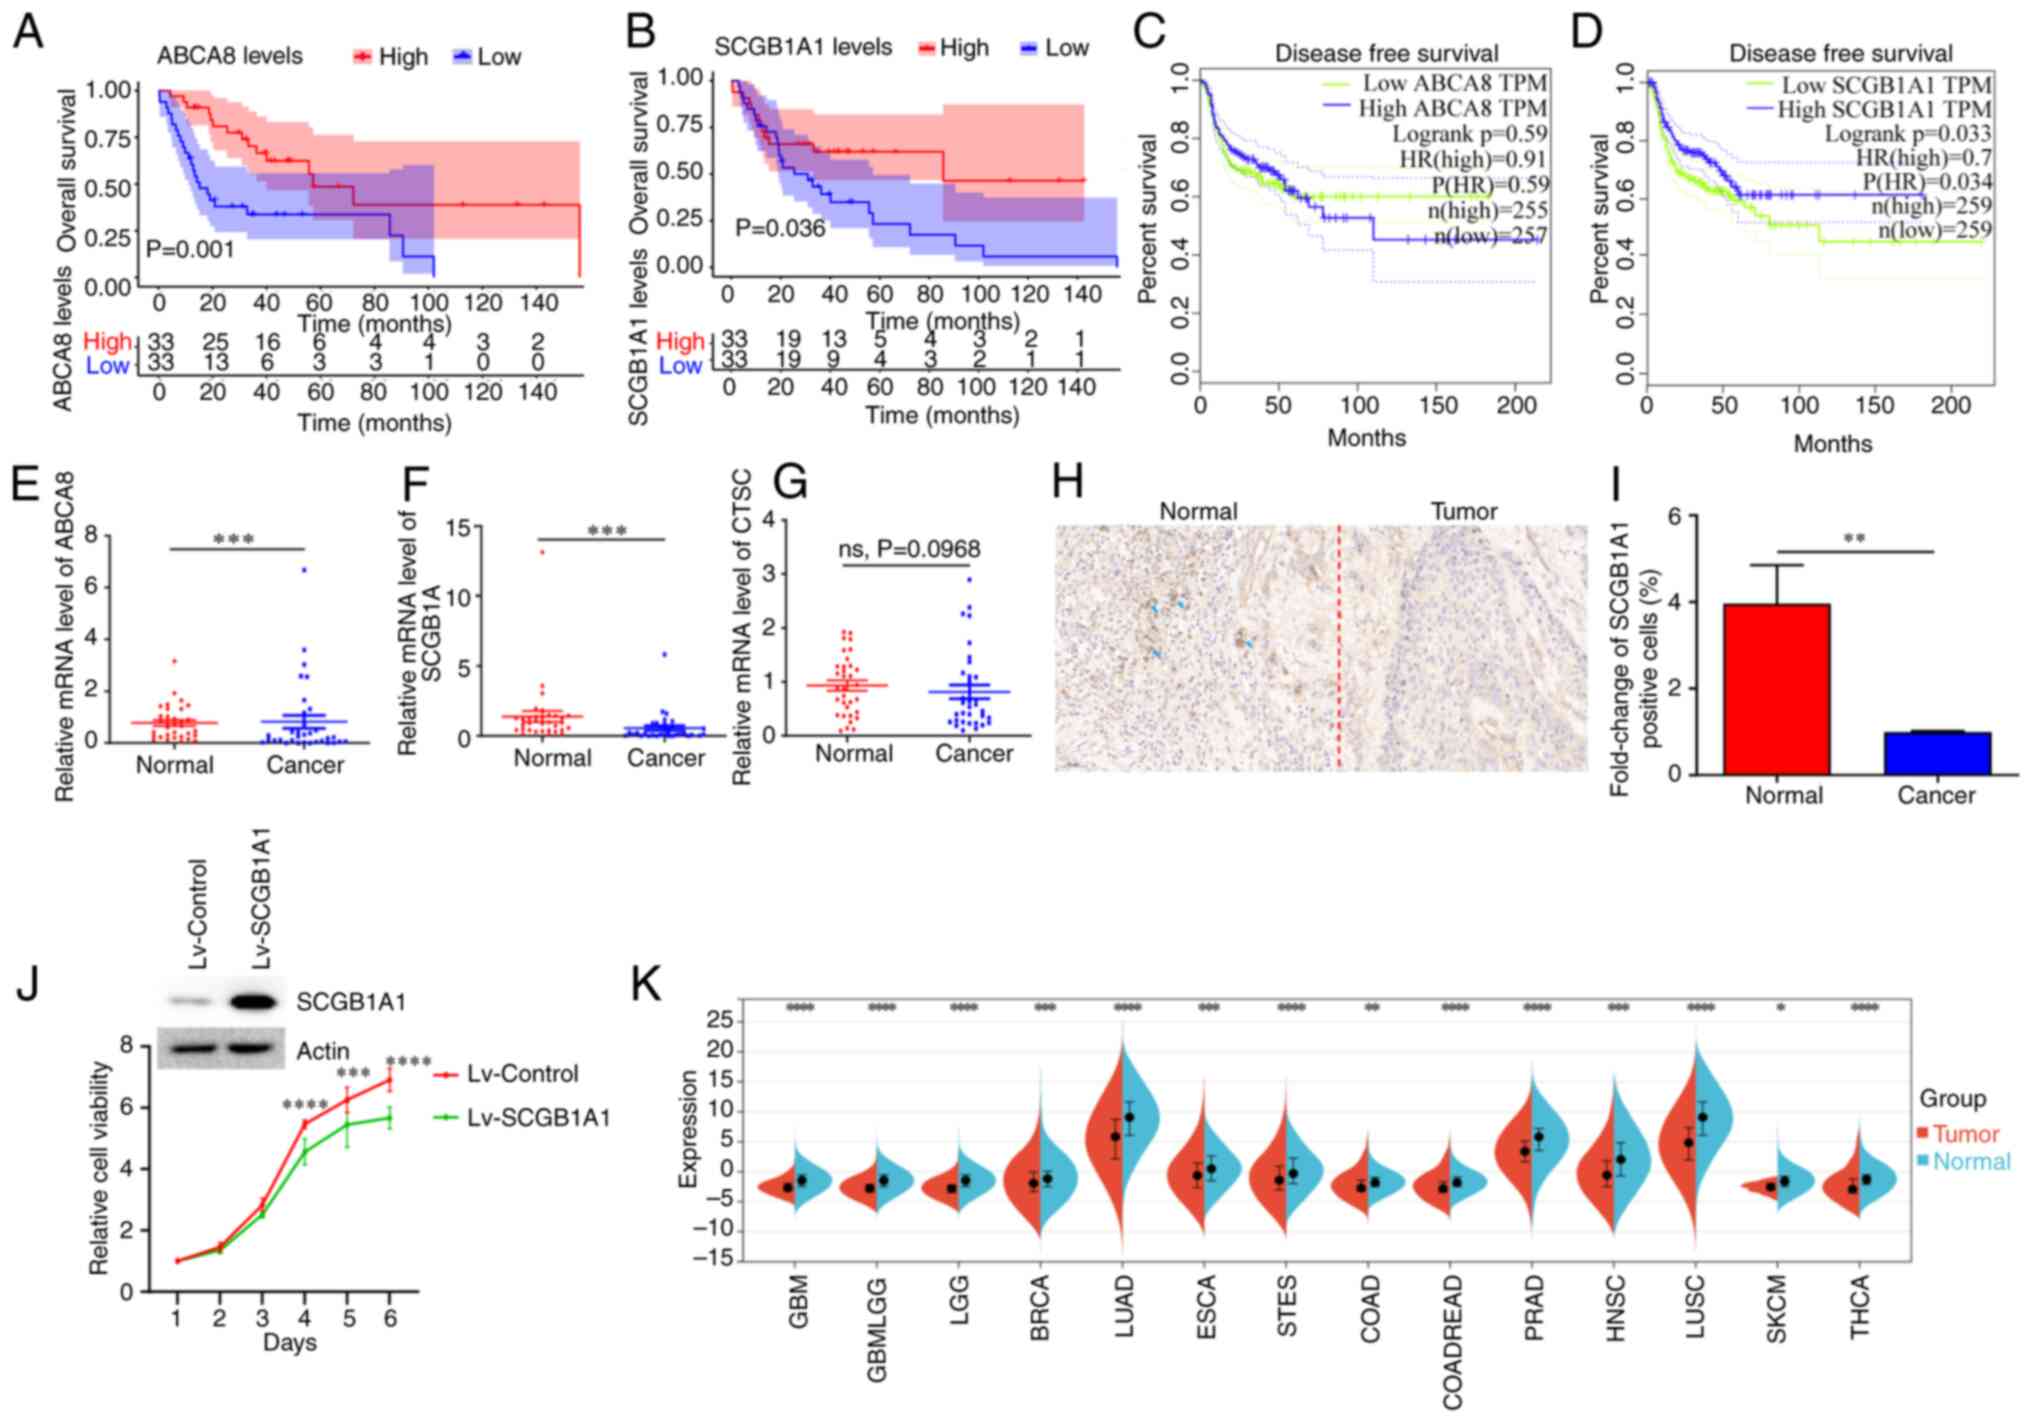 | Figure 5.Survival analysis and expression
characteristics of SCGB1A1. (A) Overall survival analysis of
ABCA8. (B) Overall survival analysis of SCGB1A1. (C)
Disease-free survival analysis of ABCA8. (D) Disease-free
survival analysis of SCGB1A1. (E) ABCA8, (F)
SCGB1A1, and (G) CTSC expression levels in the
clinical samples. (H) Immunohistochemical staining of
SCGB1A1 in the clinical sample. Representative
SCGB1A1+ cells are marked with blue arrows. Scale bar,
50 µm. (I) Statistical analysis of SCGB1A1+ cells after
immunohistochemical staining. (J) The knockdown of SCGB1A1
expression following Lv-SCGB1A1 transduction. The viability of
Lv-SCGB1A1-infected and Lv-Control-infected CAL27 cells were
determined using a Cell Counting Kit-8 assay. (K) Analysis of
SCGB1A1 expression levels in the pan-cancerous tissue.
**P<0.01, ***P<0.001, ****P<0.0001. ABCA8, ATP binding
cassette subfamily A member 8; CTSC, cathepsin C; HR, hazard ratio;
ns, not significant; Lv-SCGB1A1, lentiviral SCGB1A1; TPM,
transcripts per million; SCGB1A1, secretoglobin family 1A member
1. |
cDNA from 12 pairs of normal and cancer tissues were
used in RT-qPCR, to verify the results of the bioinformatics
analysis. As shown in Fig. 5E-G,
only SCGB1A1 expression changes were consistent with the
bioinformatics analysis. The expression levels of SCGB1A1 in
normal tissues were significantly higher than in the cancer
tissues. The trend in SCGB1A1 expression was also confirmed
using immunohistochemical staining (Fig. 5H and I). The viability of cancer
cell lines stably overexpressing SCGB1A1 was lower than that of the
control group cancer cells (Fig.
5J). Furthermore, pan-cancer analysis revealed that the
expression levels of SCGB1A1 in normal tissues were
significantly higher than in tumor tissues (Fig. 5K). According to the expression
characteristics, SCGB1A1 may be used as a novel biomarker to
improve the diagnosis of HNSCC.
Drug sensitivity and molecular docking
analysis
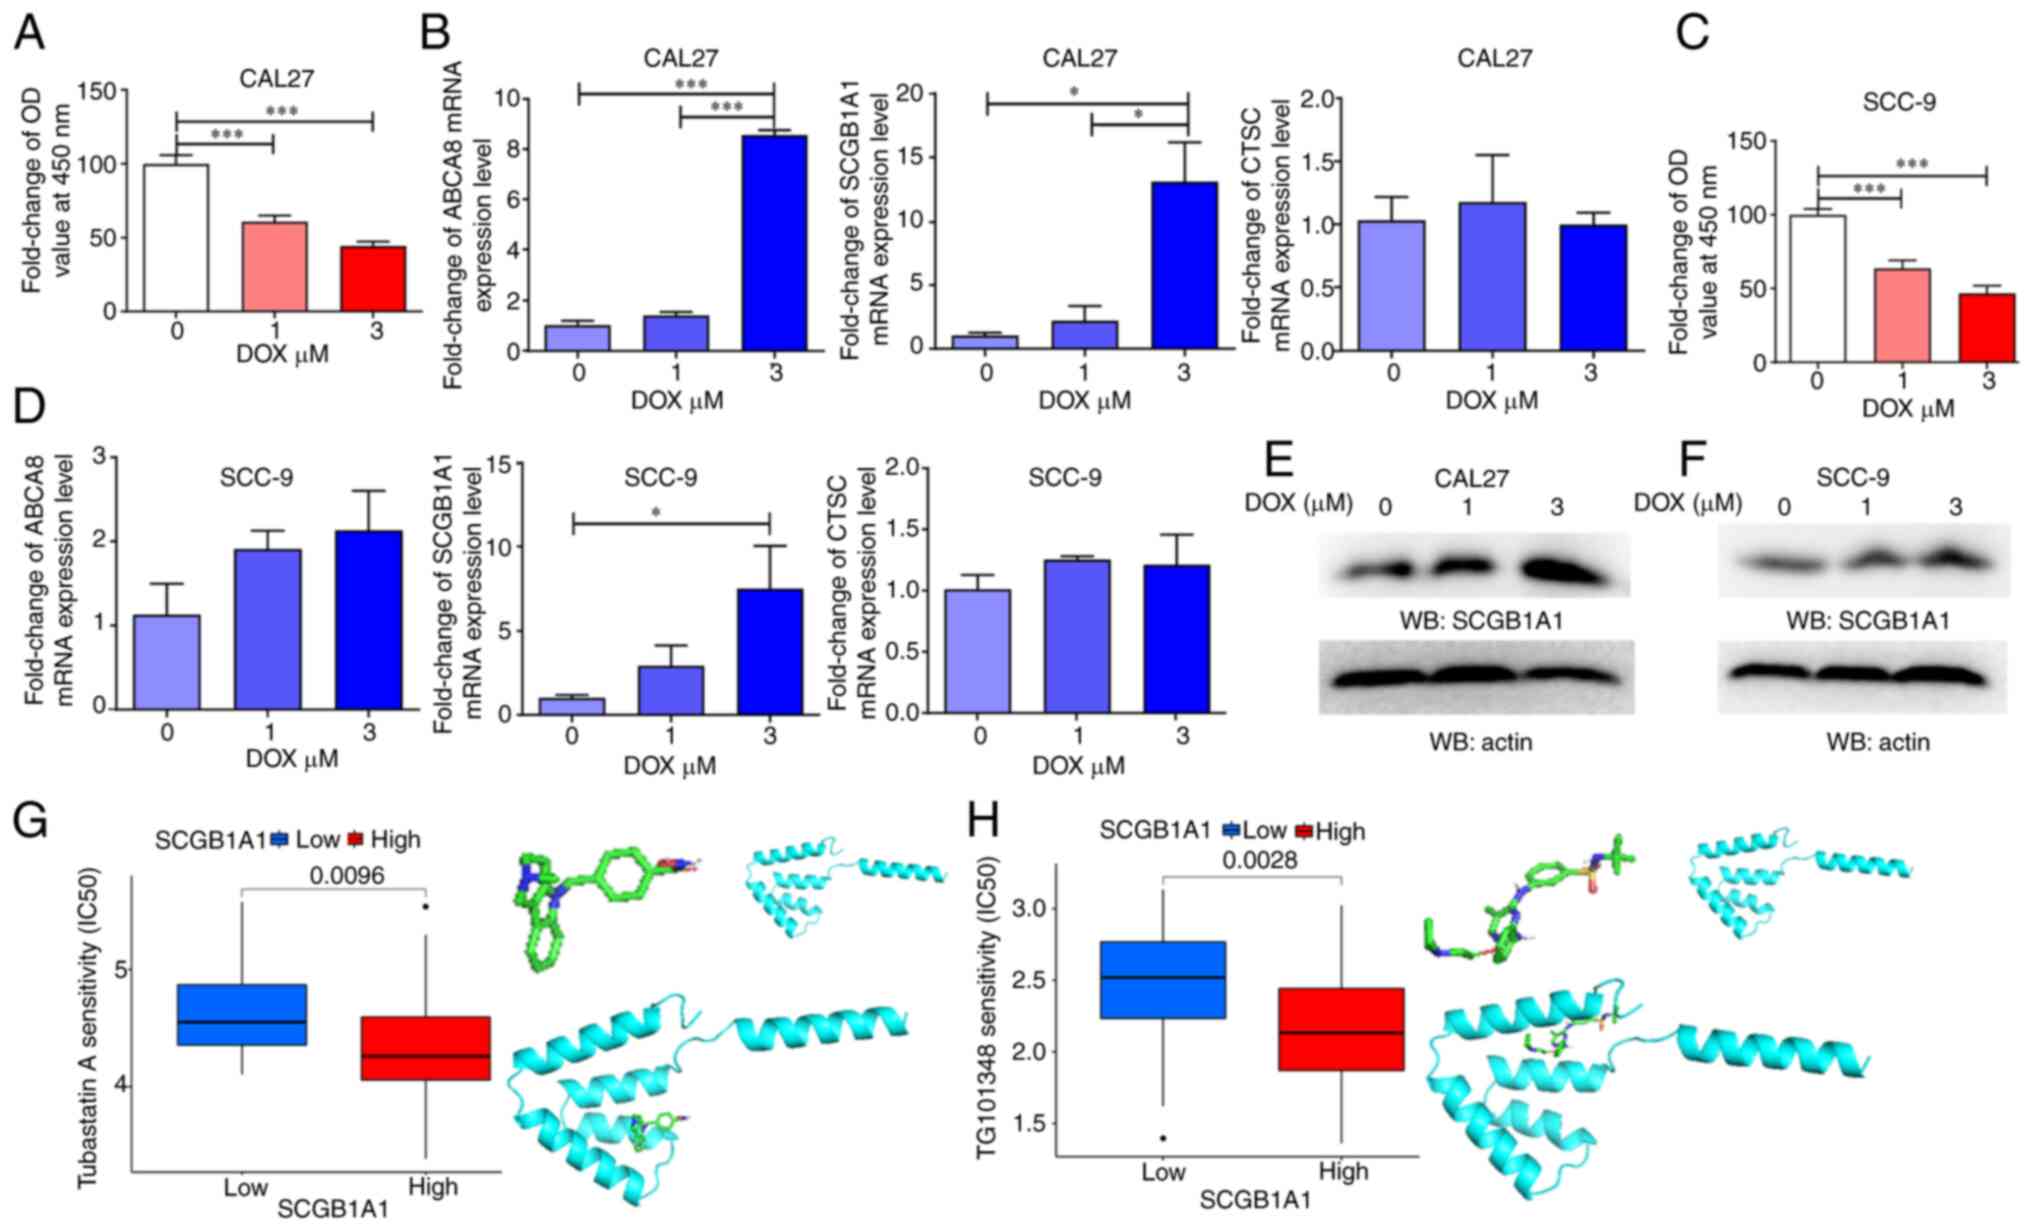
To further explore the role of SCGB1A1 in
HNSCC therapy, two types of oral squamous cell carcinoma cell lines
were used as in vitro models and treated with DOX, a
chemotherapeutic agent primarily employed for the treatment of
cancer, including HNSCC. The expression level of SCGB1A1 was
upregulated during DOX-induced tumor cell apoptosis (Fig. 6A-D). Therefore, SCGB1A1 may
serve as a biomarker for evaluating the effectiveness of cancer
therapy.
In addition, the results of a drug sensitivity
analysis indicated that the SCGB1A1 expression level in cancer
cells exhibited a significant increase after DOX treatment
(Figs. 6E, F and S6). Furthermore, certain drug molecules
could bind directly to the SCGB1A1 protein, such as Tubastatin A
and TG101348 (Fedratinib) (Fig. 6G and
H), which may exert anticancer properties by regulating the
SCGB1A1 protein. These data may explain why patients with
upregulated expression of SCGB1A1 had a longer survival time. In
summary, it was demonstrated that SCGB1A1 may serve as a candidate
therapeutic target for the management of HNSCC.
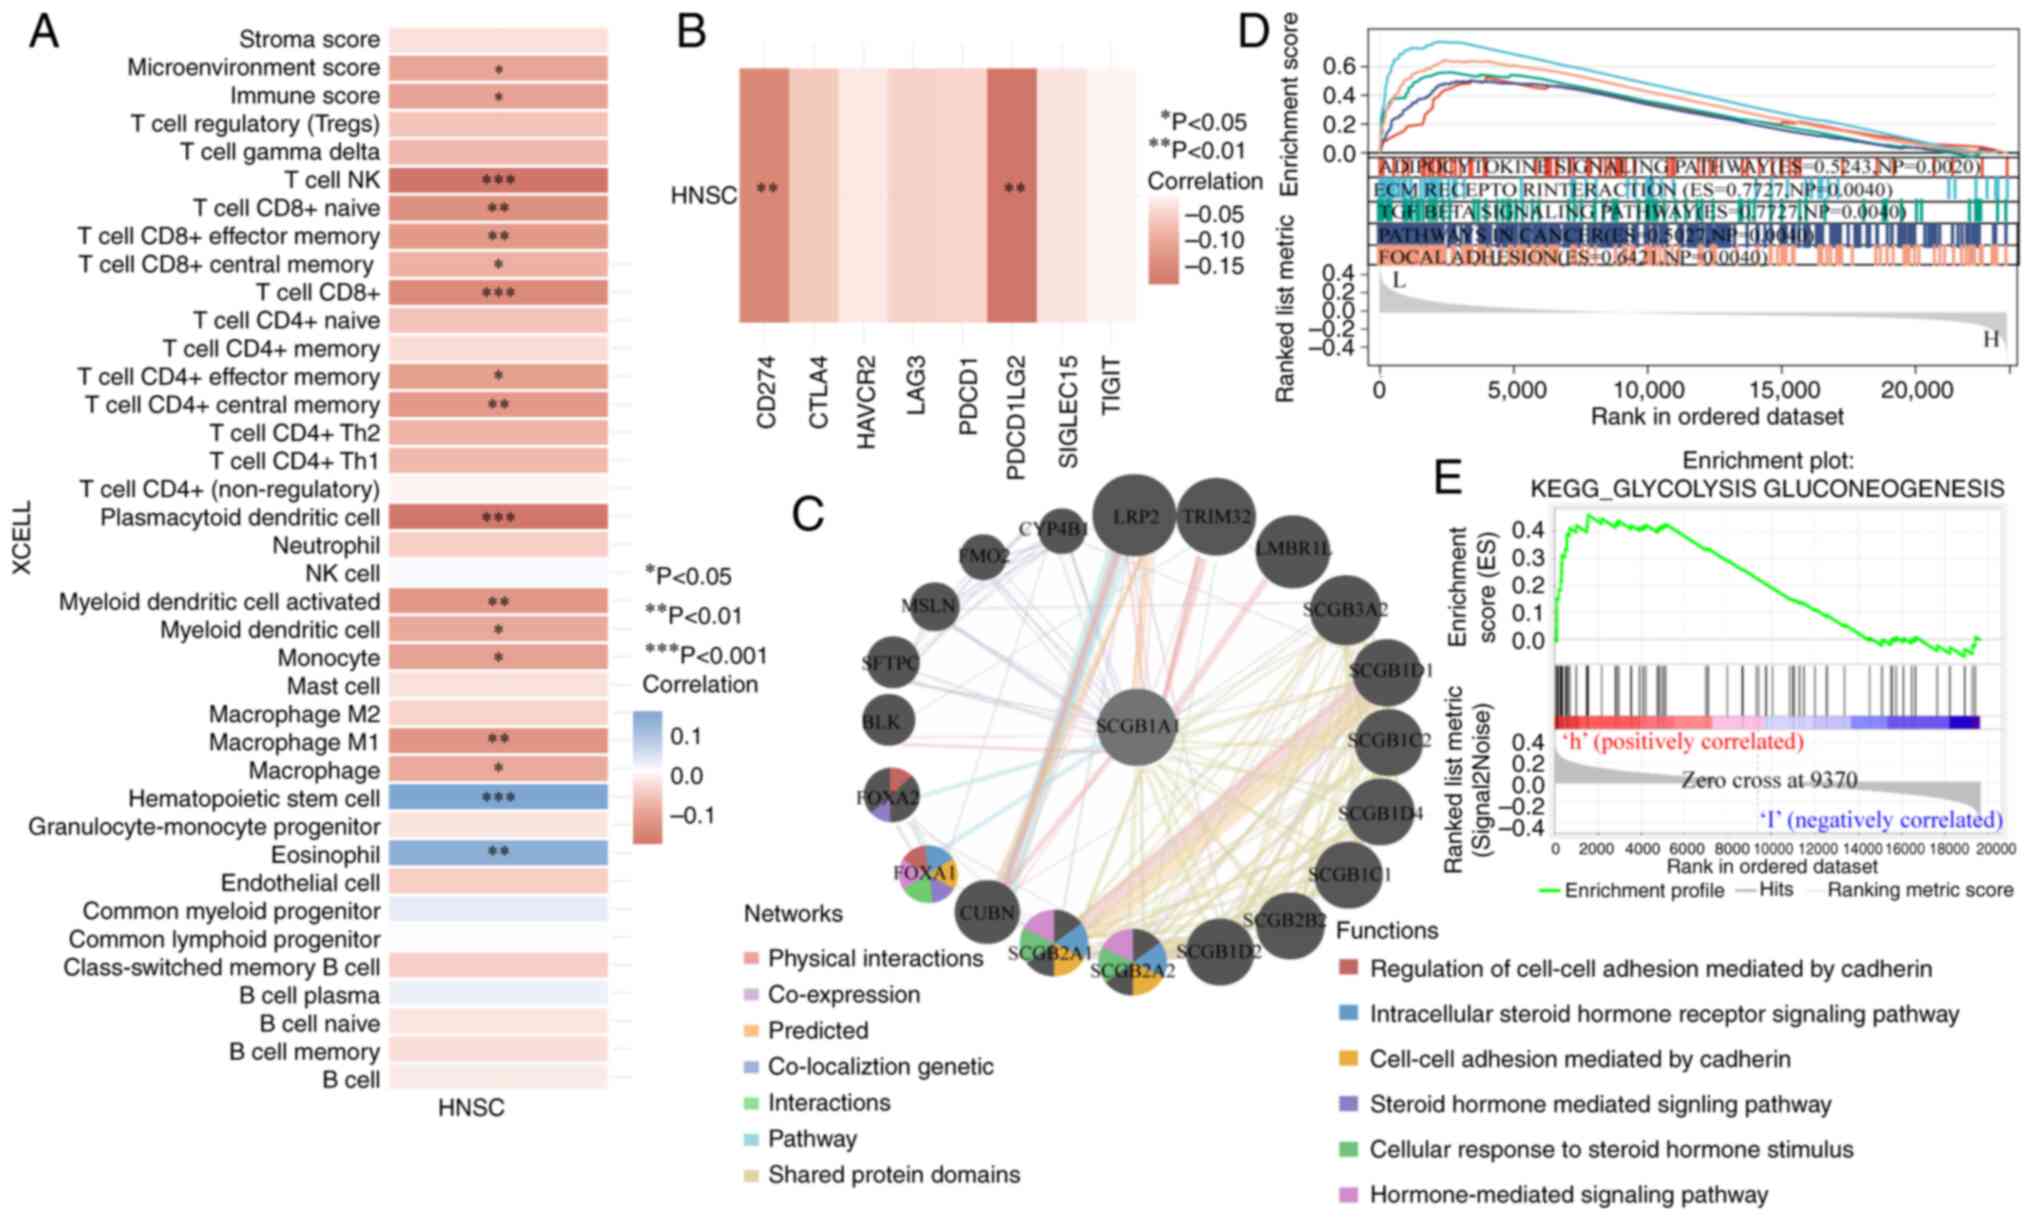
Immunological function analysis of
SCGB1A1
It is well-established that the immune
microenvironment has a notable influence on the effectiveness of
cancer treatment (55). Of note,
the results of the present study showed that SCGB1A1
expression was negatively correlated with immune adjustment by
regulating the infiltration, activation and differentiation of
immune cells, such as CD8+ cells, CD4+ cells,
dendritic cells and macrophages (Fig.
7A). Furthermore, SCGB1A1 expression was also correlated
with immune checkpoint proteins, including CD274 and PDCD1LG2
(Fig. 7B). These results
demonstrated that SCGB1A1 may be a candidate therapeutic
target for the management of HNSCC.
Regulatory mechanism analysis of
SCGB1A1
Due to SCGB1A1 exerting numerous functions in
HSNCC therapy, the underlying mechanisms of SCGB1A1 were
further explored. Gene interaction networks were built to
understand the functional biological mechanisms of SCGB1A1
using GeneMANIA. A total of 20 genes associated with SCGB1A1
were identified, and the results showed that these genes were
involved in the ‘Regulation of cell-cell adhesion mediated by
cadherin’, ‘Intracellular steroid hormone receptor signaling
pathway’, ‘Steroid hormone mediated signaling pathway’, ‘Cell-cell
adhesion mediated by cadherin’, ‘Cellular response to steroid
hormone stimulus’ and ‘Hormone-mediated signaling pathway’
(Fig. 7C). To further elucidate the
molecular mechanisms of SCGB1A1 in HNSCC, GSEA was performed
using TCGA RNA-seq data. As shown in Fig. 7D, downregulated expression of
SCGB1A1 was associated with ‘ECM RECEPTOR INTERACTION’,
‘ADIPOCYTOKINE SIGNALING PATHWAY’, ‘TGF BETA SIGNALING PATHWAY’,
‘PATHWAYS IN CANCER’ and ‘FOCAL ADHESION’, which were highly
associated with cancer cell proliferation, metabolism, immune
escape and migration. As shown in Figs.
7E and S7, the mechanism of
action of SCGB1A1 was primarily enriched for metabolism pathways
when it was upregulated, such as ‘GLYCOLYSIS GLUCONEOGENESIS’,
‘ASCORBATE AND ALDARATE METABOLISM’, ‘DRUG METABOLISM CYTOCHROME
P450’, ‘STARCH AND SUCROSE METABOLISM’, ‘METABOLISM OF XENOBIOTICS
BY CYTOCHROME P450’, ‘PENTOSE AND GLUCURONATE INTERCONVERSIONS’,
‘PORPHYRIN AND CHLOROPHYLL METABOLISM’, ‘TYROSINE METABOLISM’,
‘RETINOL METABOLISM’ and ‘ARACHIDONIC ACID METABOLISM’. Based on
these findings, SCGB1A1 may be a potential target for HNSCC
therapy.
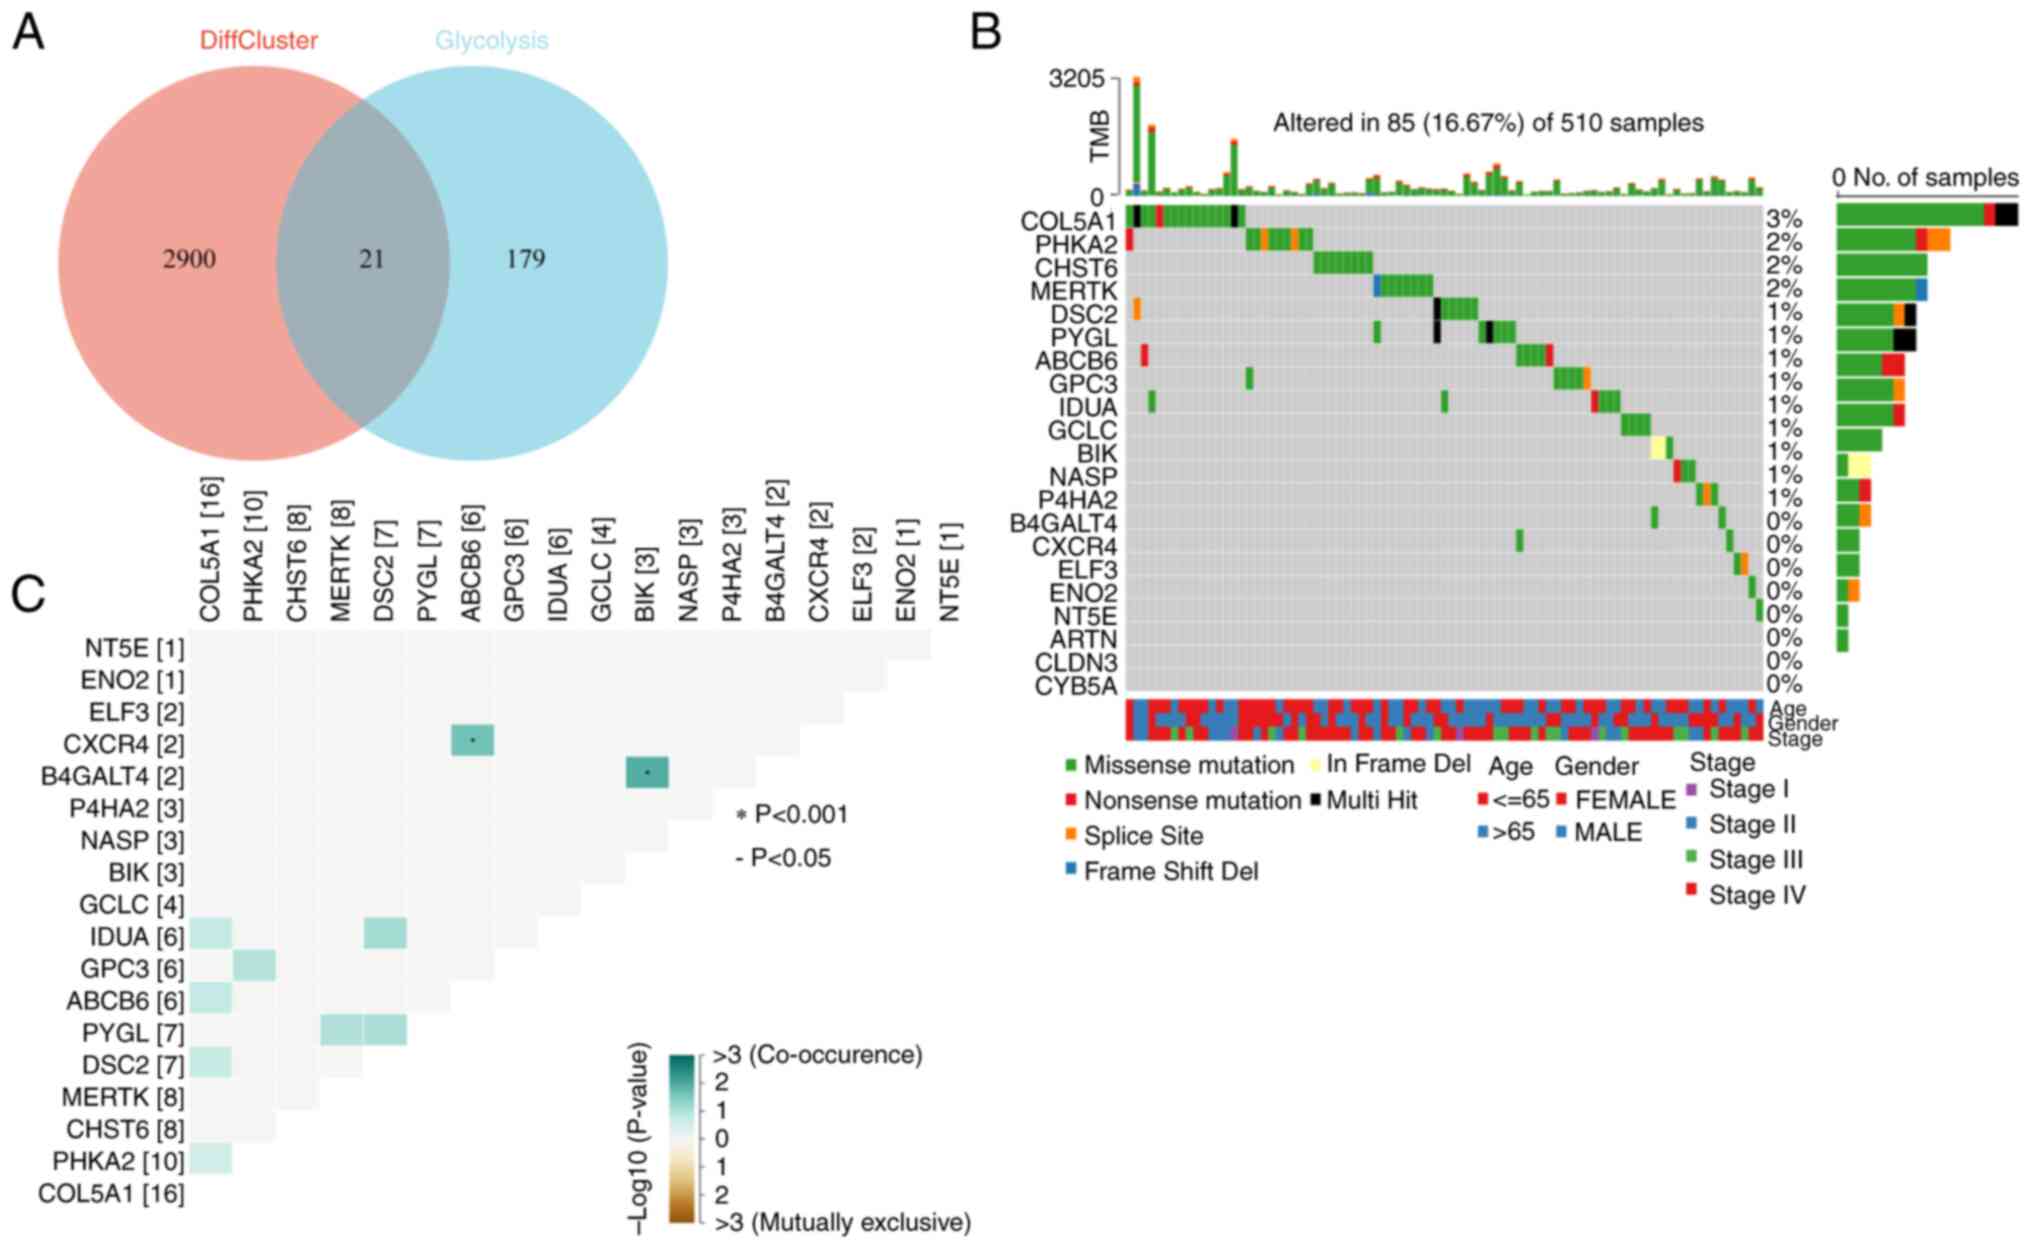
Analysis of glycolytic genes
To understand the association between SCGB1A1 and
the glycolytic pathway, 21 key glycolytic genes were obtained by
intersecting the clustering differential genes obtained through
previous clustering analysis with 200 glycolysis-related genes
collected in the GSEA MSigDB gene sets (Fig. 8A). First, the mutations of 21
glycolysis-associated genes were examined and found that 18 genes,
such as collagen type V α1 chain (COL5A1), PHKA2, CHST6,
MERTK, DSC2, PYGL, ABCB6, GPC3, IDUA, GCLC, BIK, nuclear
autoantigenic sperm protein (NASP), P4HA2, B4GALT4, CXCR4, ELF3,
ENO2 and NT5E, exhibited varying degrees of mutations,
with a maximum degree of mutation of 3% (Fig. 8B). Among them, three types of
mutations were more common: Missense mutations, nonsense mutations
and splice site. In addition, the coexistence and exclusion
relationships of these 18 mutated glycolytic genes were also
analyzed and it was found that CXCR4 and ABCB6, and
B4GALT4 and BIK exhibited coexistence relationships
(Fig. 8C).
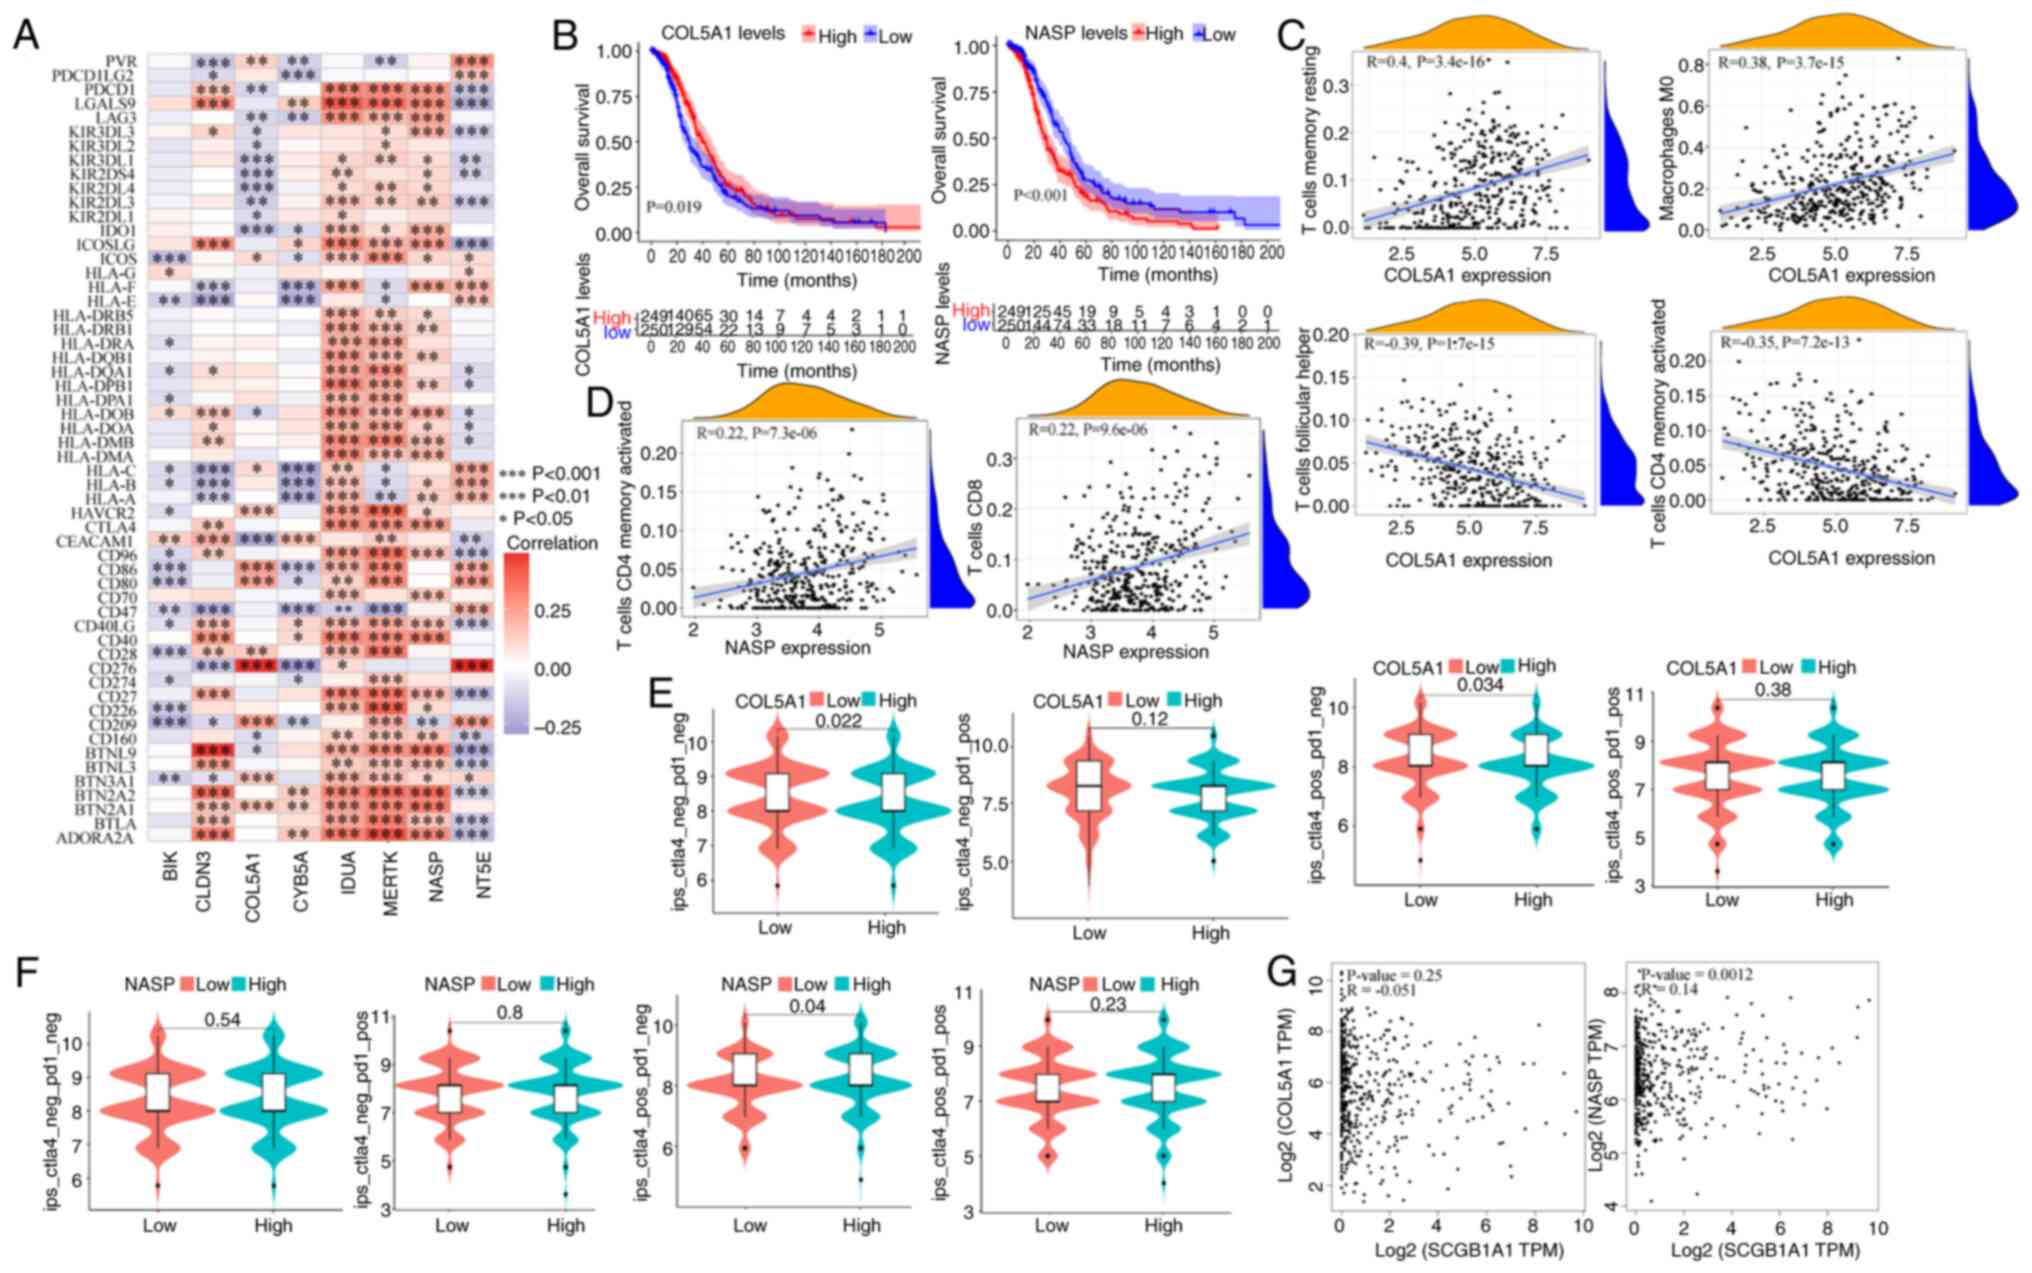
Immunological characteristics and the
relationship with prognosis of glycolytic genes
The immune characteristics of glycolysis-related
genes were assessed to understand the relationship between
glycolysis and tumor immune escape. First, a proportional risk
regression model was used to classify genes for risk. Next, 79
immune checkpoint genes were collected (56) and the correlation heatmap with
glycolysis genes was analyzed. It was found that BIK, COL5A1
and CYB5A were negatively correlated with the majority of
immune checkpoint genes, while IDUA, MERTK and NASP
were positively correlated with the majority of immune checkpoint
genes (Fig. 9A). In subsequent
prognostic analysis, it was found that high expression of
COL5A1 was associated with a good prognosis, while
downregulated expression of NASP was associated with a worse
prognosis (Figs. 9B and S8). Subsequently, the correlation between
immune cells and these 2 genes was analyzed, and it was found that
COL5A1 was significantly positively correlated with resting
CD4+ memory T cells and M0 macrophages, while it was
significantly negatively correlated with T follicular helper cells
and activated CD4+ memory T cells (Fig. 9C). The NASP glycolytic gene
was significantly positively correlated with T follicular helper
cells and activated CD4+ memory T cells (Fig. 9D), while it was significantly
negatively correlated with M0 macrophages and other cells (Fig. S9). In recent years, emerging
immunotherapies, including immune checkpoint inhibitors, have
achieved notable results in clinical practice. To investigate the
role of the glycolytic genes, COL5A1 and NASP, in
immunotherapy, patients were stratified based on their individual
gene expression levels and it was observed that the COL5A1
or NASP low expression groups exhibited significant
therapeutic efficacy upon CTLA4 treatment (Fig. 9E and F). In the gene correlation
analysis, it was found that SCGB1A1 was positively
correlated with NASP (Fig.
9G), while its correlation with other glycolytic genes was low
(Fig. S10).
Discussion
HNSCC is one of the most common types of cancer and
is associated with high morbidity and mortality rates (57,58).
Exploring novel biomarkers and therapeutic targets for HNSCC may
contribute to the diagnosis, prognostic evaluation and therapeutic
management of HNSCC, and may also decrease the economic burden on
patients and society.
SCGB1A1 is an important gene that is
implicated in several pulmonary diseases, including asthma, chronic
obstructive pulmonary disease and lung cancer (59). A study conducted by Xu et al
(60) revealed the crucial role of
SCGB1A1 in modulating alveolar macrophage-mediated inflammation and
immune responses, as well as attenuating cytokine surges within the
lungs. Yu et al (61)
demonstrated that excessive expression of SCGB1A1 in the heart can
result in the development of myocardial hypertrophy. Moreover,
SCGB1A1 can inhibit the Th17 response by regulating dendritic cells
in allergic rhinitis (62).
Downregulation of SCGB1A1 affects tumorigenicity in
non-small cell lung cancer (63)
and mouse lung cancer models (64).
These studies therefore indicate a potential role for
SCGB1A1 in the development of numerous diseases. However, to
the best of our knowledge, the roles of SCGB1A1 in HNSCC
have not been previously reported in the literature. In the present
study, it was found that SCGB1A1 may serve as a novel
biomarker for the diagnostic and prognostic evaluation of HNSCC.
Notably, the expression levels of SCGB1A1 were significantly
positively associated with patient outcomes.
Additionally, SCGB1A1 may also serve as a potential
therapeutic target for the management of HNSCC. The SCGB1A1 protein
is 10 kDa, imbues acid, heat and protease resistance and can be
produced in large quantities through recombinant protein
expression. These characteristics of SCGB1A1 make it an ideal
candidate for further comprehensive investigation, thereby
augmenting the potential of targeted therapy with this protein
(65). The present study revealed
that the expression levels of SCGB1A1 were strongly
correlated with drug sensitivity and the immune microenvironment.
Further exploration found that SCGB1A1 was involved in
several pathways that are significantly associated with several
types of cancer. However, the predicted non-specific effect of
targeting or administering SCGB1A1 may limit its clinical
utilization. The delivery of SCGB1A1 into cancer cells using
oncolytic viruses can potentially address this issue. Nevertheless,
further verification is necessary to confirm the feasibility of
this strategy.
Adipocytokines have been reported to impact cancer
cell proliferation, invasion and migration directly. TGF-β is an
immune-suppressive cytokine that restricts the activity of effector
immune cells, which can result in tumor development by generating
and maintaining a highly immune-suppressive tumor environment
(66). Focal adhesion molecules
play a key role in allowing cells to attach to the extracellular
matrix and mediate numerous biological functions. Reduced
expression of focal adhesion molecules has been associated with
enhanced cell migration and cancer metastasis (67). In addition, the results of the
present study demonstrated that the expression level of
SCGB1A1 was highly correlated with glycolytic enzymes, which
may confer heightened susceptibility of tumor cells to cytotoxic T
lymphocytes and initiate innate immune responses (68,69).
Moreover, the immune checkpoint molecules associated with
SCGB1A1 exhibit promising antitumor activity in the clinical
treatment of patients with HNSCC (70). Therefore, SCGB1A1 may serve as an
attractive therapeutic target for the management of cancer due to
its multiple regulatory functions.
In the present study, a relatively limited number
of clinical samples were obtained to validate the accuracy of the
bioinformatics analyses. In future, the sample size will be
expanded in further research endeavors to further substantiate the
precision of the bioinformatics analysis results and to investigate
the underlying mechanism of action of SCGB1A1. In conclusion, the
biomarker, SCGB1A1, exhibits versatility in its application
for the diagnosis, evaluation of treatment response, immune
assessment and prognosis evaluation of HNSCC. Furthermore, SCGB1A1
demonstrates potential as a promising therapeutic target.
Supplementary Material
Supporting Data
Supporting Data
Supporting Data
Supporting Data
Supporting Data
Supporting Data
Supporting Data
Supporting Data
Acknowledgements
Not applicable.
Funding
The present study was supported by The Natural Science
Foundation of Shandong (grant no. ZR2020QH160), New Industry
Cultivation Program of Qingdao (grant no. 23-1-4-xxgg-18-nsh) and
Technological SMEs Innovation Ability Improvement Project of
Shandong Province (grant no. 2023TSGC0510).
Availability of data and materials
The data generated in the present study may be
requested from the corresponding author.
Authors' contributions
Project administration was conducted by JW, QX and
ZY. JW, QX, RY and ZY contributed to conception and design.
Experiments and data analysis were conducted by JW, QX, LY, JY, ZC
and YC. JW, QX and AX also contributed to the acquisition of data.
Original manuscript draft preparation was conducted by JW, QX, LY
and AX. Reviewing and editing of the manuscript was conducted by RY
and ZY. All authors read and approved the final version of the
manuscript. JW, QX, RY and ZY confirm the authenticity of all the
raw data.
Ethics approval and consent to
participate
The clinical sample collection was performed
according to the protocols approved by the Ethics Committee of the
Medical College of Qingdao University (Qingdao, China;
QDU-HEC-2022166). All patients provided written consented for
participation in the present study.
Patient consent for publication
The patients provided consent for their information
to be published.
Competing interests
The authors declare that they have no competing
interests.
Glossary
Abbreviations
Abbreviations:
|
HNC
|
head and neck cancer
|
|
HNSC/HNSCC
|
head and neck squamous cell
carcinoma
|
|
DEG
|
differentially expressed gene
|
|
GEO
|
Gene Expression Omnibus
|
|
WGCNA
|
weighted gene co-expression network
analysis
|
|
GO
|
Gene Ontology
|
|
KEGG
|
Kyoto Encyclopedia of Genes and
Genomes
|
|
PPI
|
protein-protein interaction
|
|
GSEA
|
Gene Set Enrichment Analysis
|
|
RT-qPCR
|
reverse transcription-quantitative
PCR
|
|
SCGB1A1
|
secretoglobin family 1A member 1
|
References
|
1
|
Raj S, Kesari KK, Kumar A, Rathi B, Sharma
A, Gupta PK, Jha SK, Jha NK, Slama P, Roychoudhury S and Kumar D:
Molecular mechanism(s) of regulation(s) of c-MET/HGF signaling in
head and neck cancer. Mol Cancer. 21:312022. View Article : Google Scholar : PubMed/NCBI
|
|
2
|
Tang E, Lahmi L, Meillan N, Pietta G,
Albert S and Maingon P: Treatment strategy for distant synchronous
metastatic head and neck squamous cell carcinoma. Curr Oncol Rep.
21:1022019. View Article : Google Scholar : PubMed/NCBI
|
|
3
|
Chow LQM: Head and neck cancer. N Engl J
Med. 382:60–72. 2020. View Article : Google Scholar : PubMed/NCBI
|
|
4
|
Bray F, Ferlay J, Soerjomataram I, Siegel
RL, Torre LA and Jemal A: Global cancer statistics 2018: GLOBOCAN
estimates of incidence and mortality worldwide for 36 cancers in
185 countries. CA Cancer J Clin. 68:394–424. 2018. View Article : Google Scholar : PubMed/NCBI
|
|
5
|
Vahabi M, Blandino G and Di Agostino S:
MicroRNAs in head and neck squamous cell carcinoma: A possible
challenge as biomarkers, determinants for the choice of therapy and
targets for personalized molecular therapies. Transl Cancer Res.
10:3090–3110. 2021. View Article : Google Scholar : PubMed/NCBI
|
|
6
|
Global Burden of Disease Cancer
Collaboration, . Fitzmaurice C, Allen C, Barber RM, Barregard L,
Bhutta ZA, Brenner H, Dicker DJ, Chimed-Orchir O, Dandona R, et al:
Global, regional, and national cancer incidence, mortality, years
of life lost, years lived with disability, and disability-adjusted
life-years for 32 cancer groups, 1990 to 2015: A systematic
analysis for the global burden of disease study. JAMA Oncol.
3:524–548. 2017. View Article : Google Scholar : PubMed/NCBI
|
|
7
|
Hakim M, Billan S, Tisch U, Peng G,
Dvrokind I, Marom O, Abdah-Bortnyak R, Kuten A and Haick H:
Diagnosis of head-and-neck cancer from exhaled breath. Br J Cancer.
104:1649–1655. 2011. View Article : Google Scholar : PubMed/NCBI
|
|
8
|
Schötz U, Balzer V, Brandt FW, Ziemann F,
Subtil FSB, Rieckmann T, Köcher S, Engenhart-Cabillic R, Dikomey E,
Wittig A and Arenz A: Dual PI3K/mTOR inhibitor NVP-BEZ235 enhances
radiosensitivity of head and neck squamous cell carcinoma (HNSCC)
cell lines due to suppressed double-strand break (DSB) repair by
non-homologous end joining. Cancers (Basel). 12:4672020. View Article : Google Scholar : PubMed/NCBI
|
|
9
|
You Y, Tian Z, Du Z, Wu K, Xu G, Dai M,
Wang Y and Xiao M: M1-like tumor-associated macrophages cascade a
mesenchymal/stem-like phenotype of oral squamous cell carcinoma via
the IL6/Stat3/THBS1 feedback loop. J Exp Clin Cancer Res.
41:102022. View Article : Google Scholar : PubMed/NCBI
|
|
10
|
Tokheim CJ, Papadopoulos N, Kinzler KW,
Vogelstein B and Karchin R: Evaluating the evaluation of cancer
driver genes. Proc Natl Acad Sci USA. 113:143302016. View Article : Google Scholar : PubMed/NCBI
|
|
11
|
Andrea S, Paola M, Claudio P, Urbani G,
Allegretti M, Pellini R, Mehterov N, Ben-David U, Strano S, Bossi P
and Blandino G: Immunosignatures associated with TP53 status and
co-mutations classify prognostically head and neck cancer patients.
Mol Cancer. 22:1922023. View Article : Google Scholar
|
|
12
|
Kong W, Han Y, Gu H, Yang H and Zang Y:
TP53 mutation-associated immune infiltration and a novel risk score
model in HNSCC. Biochem Biophys Rep. 32:1013592022.PubMed/NCBI
|
|
13
|
El Baroudi M, Machiels JP and Schmitz S:
Expression of SESN1, UHRF1BP1, and miR-377-3p as prognostic markers
in mutated TP53 squamous cell carcinoma of the head and neck.
Cancer Biol Ther. 18:775–782. 2017. View Article : Google Scholar : PubMed/NCBI
|
|
14
|
Wei Z, Shen Y, Zhou C, Cao Y, Deng H and
Shen Z: CD3D: A prognostic biomarker associated with immune
infiltration and immunotherapeutic response in head and neck
squamous cell carcinoma. Bioengineered. 13:13784–13800. 2022.
View Article : Google Scholar : PubMed/NCBI
|
|
15
|
Chen Y, Yang J, Jin H, Wen W, Xu Y, Zhang
X and Wang Y: HtrA3: A promising prognostic biomarker and
therapeutic target for head and neck squamous cell carcinoma.
PeerJ. 11:e162372023. View Article : Google Scholar : PubMed/NCBI
|
|
16
|
Chen C, Méndez E, Houck J, Fan W,
Lohavanichbutr P, Doody D, Yueh B, Futran ND, Upton M, Farwell DG,
et al: Gene expression profiling identifies genes predictive of
oral squamous cell carcinoma. Cancer Epidemiol Biomarkers Prev.
17:2152–2162. 2008. View Article : Google Scholar : PubMed/NCBI
|
|
17
|
Zhang Y, Luo S, Jia Y and Zhang X:
Telomere maintenance mechanism dysregulation serves as an early
predictor of adjuvant therapy response and a potential therapeutic
target in human cancers. Int J Cancer. 151:313–327. 2022.
View Article : Google Scholar : PubMed/NCBI
|
|
18
|
Leemans CR, Snijders PJF and Brakenhoff
RH: The molecular landscape of head and neck cancer. Nat Rev
Cancer. 18:269–282. 2018. View Article : Google Scholar : PubMed/NCBI
|
|
19
|
Han D, Yu Z, Zhang H, Liu H, Wang B and
Qian D: Microenvironment-associated gene HSD11B1 may serve as a
prognostic biomarker in clear cell renal cell carcinoma: A study
based on TCGA, RT-qPCR, Western blotting, and immunohistochemistry.
Bioengineered. 12:10891–10904. 2021. View Article : Google Scholar : PubMed/NCBI
|
|
20
|
Ritchie ME, Phipson B, Wu D, Hu Y, Law CW,
Shi W and Smyth GK: limma powers differential expression analyses
for RNA-sequencing and microarray studies. Nucleic Acids Res.
43:e472015. View Article : Google Scholar : PubMed/NCBI
|
|
21
|
RStudio Team: RStudio: Integrated
Development for R. RStudio, Inc.; Boston, MA: 2015
|
|
22
|
Shippy DC and Ulland TK: Lipid metabolism
transcriptomics of murine microglia in Alzheimer's disease and
neuroinflammation. Sci Rep. 13:148002023. View Article : Google Scholar : PubMed/NCBI
|
|
23
|
Luo L, Zhu J, Guo Y and Li C: Mitophagy
and immune infiltration in vitiligo: Evidence from bioinformatics
analysis. Front Immunol. 14:11641242023. View Article : Google Scholar : PubMed/NCBI
|
|
24
|
Langfelder P and Horvath S: WGCNA: An R
package for weighted correlation network analysis. BMC
Bioinformatics. 9:5592008. View Article : Google Scholar : PubMed/NCBI
|
|
25
|
Liu B, Ma X and Ha W: Identification of
potential prognostic biomarkers associated with macrophage M2
infiltration in gastric cancer. Front Genet. 12:8274442022.
View Article : Google Scholar : PubMed/NCBI
|
|
26
|
Pei G, Chen L and Zhang W: WGCNA
application to proteomic and metabolomic data analysis. Methods
Enzymol. 585:135–158. 2017. View Article : Google Scholar : PubMed/NCBI
|
|
27
|
Wilkerson MD and Hayes DN:
ConsensusClusterPlus: A class discovery tool with confidence
assessments and item tracking. Bioinformatics. 26:1572–1573. 2010.
View Article : Google Scholar : PubMed/NCBI
|
|
28
|
Gao CH, Yu G and Cai P: ggVennDiagram: An
intuitive, easy-to-use, and highly customizable r package to
generate venn diagram. Front Genet. 12:7069072021. View Article : Google Scholar : PubMed/NCBI
|
|
29
|
Thomas PD: The gene ontology and the
meaning of biological function. Methods Mol Biol. 1446:15–24. 2017.
View Article : Google Scholar : PubMed/NCBI
|
|
30
|
Kanehisa M, Furumichi M, Tanabe M, Sato Y
and Morishima K: KEGG: New perspectives on genomes, pathways,
diseases and drugs. Nucleic Acids Res. 45:D353–D361. 2017.
View Article : Google Scholar : PubMed/NCBI
|
|
31
|
Liberzon A, Birger C, Thorvaldsdóttir H,
Ghandi M, Mesirov JP and Tamayo P: The molecular signatures
database (MSigDB) hallmark gene set collection. Cell Syst.
1:417–425. 2015. View Article : Google Scholar : PubMed/NCBI
|
|
32
|
Szklarczyk D, Gable AL, Lyon D, Junge A,
Wyder S, Huerta-Cepas J, Simonovic M, Doncheva NT, Morris JH, Bork
P, et al: STRING v11: Protein-protein association networks with
increased coverage, supporting functional discovery in genome-wide
experimental datasets. Nucleic Acids Res. 47:D607–D613. 2019.
View Article : Google Scholar : PubMed/NCBI
|
|
33
|
Shannon P, Markiel A, Ozier O, Baliga NS,
Wang JT, Ramage D, Amin N, Schwikowski B and Ideker T: Cytoscape: A
software environment for integrated models of biomolecular
interaction networks. Genome Res. 13:2498–2504. 2003. View Article : Google Scholar : PubMed/NCBI
|
|
34
|
Chin CH, Chen SH, Wu HH, Ho CW, Ko MT and
Lin CY: cytoHubba: Identifying hub objects and sub-networks from
complex interactome. BMC Syst Biol. 8 (Suppl 4):S112014. View Article : Google Scholar : PubMed/NCBI
|
|
35
|
Hess AS and Hess JR: Kaplan-Meier survival
curves. Transfusion. 60:670–672. 2020. View Article : Google Scholar : PubMed/NCBI
|
|
36
|
Goel MK, Khanna P and Kishore J:
Understanding survival analysis: Kaplan-Meier estimate. Int J
Ayurveda Res. 1:274–278. 2010. View Article : Google Scholar : PubMed/NCBI
|
|
37
|
Mu H, Wang Z, Zhang X, Qian D, Wang Y,
Jiang S, Liang S and Wang B: HCMV-encoded IE2 induces
anxiety-depression and cognitive impairment in UL122
genetically-modified mice. Int J Clin Exp Pathol. 12:4087–4095.
2019.PubMed/NCBI
|
|
38
|
Livak KJ and Schmittgen TD: Analysis of
relative gene expression data using real-time quantitative PCR and
the 2(−Delta Delta C(T)) method. Methods. 25:402–408. 2001.
View Article : Google Scholar : PubMed/NCBI
|
|
39
|
Geeleher P, Cox N and Huang RS:
pRRophetic: An R package for prediction of clinical
chemotherapeutic response from tumor gene expression levels. PLoS
One. 9:e1074682014. View Article : Google Scholar : PubMed/NCBI
|
|
40
|
Geeleher P, Cox NJ and Huang RS: Clinical
drug response can be predicted using baseline gene expression
levels and in vitro drug sensitivity in cell lines. Genome Biol.
15:R472014. View Article : Google Scholar : PubMed/NCBI
|
|
41
|
El-Hachem N, Haibe-Kains B, Khalil A,
Kobeissy FH and Nemer G: AutoDock and AutoDockTools for
protein-ligand docking: Beta-site amyloid precursor protein
cleaving enzyme 1(BACE1) as a case study. Methods Mol Biol.
1598:391–403. 2017. View Article : Google Scholar : PubMed/NCBI
|
|
42
|
Sugano-Nakamura N, Matoba K, Hirose M,
Bashiruddin NK, Matsunaga Y, Yamashita K, Hirata K, Yamamoto M,
Arimori T, Suga H and Takagi J: De novo Fc-based receptor
dimerizers differentially modulate PlexinB1 function. Structure.
30:1411–1423.e4. 2022. View Article : Google Scholar : PubMed/NCBI
|
|
43
|
Tao Q, Du J, Li X, Zeng J, Tan B, Xu J,
Lin W and Chen XL: Network pharmacology and molecular docking
analysis on molecular targets and mechanisms of Huashi Baidu
formula in the treatment of COVID-19. Drug Dev Ind Pharm.
46:1345–1353. 2020. View Article : Google Scholar : PubMed/NCBI
|
|
44
|
Zeng D, Li M, Zhou R, Zhang J, Sun H, Shi
M, Bin J, Liao Y, Rao J and Liao W: Tumor microenvironment
characterization in gastric cancer identifies prognostic and
immunotherapeutically relevant gene signatures. Cancer Immunol Res.
7:737–750. 2019. View Article : Google Scholar : PubMed/NCBI
|
|
45
|
Sturm G, Finotello F, Petitprez F, Zhang
JD, Baumbach J, Fridman WH, List M and Aneichyk T: Comprehensive
evaluation of transcriptome-based cell-type quantification methods
for immuno-oncology. Bioinformatics. 35:i436–i445. 2019. View Article : Google Scholar : PubMed/NCBI
|
|
46
|
Li B, Severson E, Pignon JC, Zhao H, Li T,
Novak J, Jiang P, Shen H, Aster JC, Rodig S, et al: Comprehensive
analyses of tumor immunity: Implications for cancer immunotherapy.
Genome Biol. 17:1742016. View Article : Google Scholar : PubMed/NCBI
|
|
47
|
Aran D, Hu Z and Butte AJ: xCell:
Digitally portraying the tissue cellular heterogeneity landscape.
Genome Biol. 18:2202017. View Article : Google Scholar : PubMed/NCBI
|
|
48
|
Li T, Fu J, Zeng Z, Cohen D, Li J, Chen Q,
Li B and Liu XS: TIMER2.0 for analysis of tumor-infiltrating immune
cells. Nucleic Acids Res. 48:W509–W514. 2020. View Article : Google Scholar : PubMed/NCBI
|
|
49
|
Wang J, Sun J, Liu LN, Flies DB, Nie X,
Toki M, Zhang J, Song C, Zarr M, Zhou X, et al: Siglec-15 as an
immune suppressor and potential target for normalization cancer
immunotherapy. Nat Med. 25:656–666. 2019. View Article : Google Scholar : PubMed/NCBI
|
|
50
|
Frost FG, Cherukuri PF, Milanovich S and
Boerkoel CF: Pan-cancer RNA-seq data stratifies tumours by some
hallmarks of cancer. J Cell Mol Med. 24:418–430. 2020. View Article : Google Scholar : PubMed/NCBI
|
|
51
|
Izzi V, Davis MN and Naba A: Pan-cancer
analysis of the genomic alterations and mutations of the matrisome.
Cancers (Basel). 12:20462020. View Article : Google Scholar : PubMed/NCBI
|
|
52
|
Zhang Q, Huang R, Hu H, Yu L, Tang Q, Tao
Y, Liu Z, Li J and Wang G: Integrative analysis of
hypoxia-associated signature in pan-cancer. iScience.
23:1014602020. View Article : Google Scholar : PubMed/NCBI
|
|
53
|
Franz M, Rodriguez H, Lopes C, Zuberi K,
Montojo J, Bader GD and Morris Q: GeneMANIA update 2018. Nucleic
Acids Res. 46:W60–W64. 2018. View Article : Google Scholar : PubMed/NCBI
|
|
54
|
Mayakonda A, Lin DC, Assenov Y, Plass C
and Koeffler HP: Maftools: Efficient and comprehensive analysis of
somatic variants in cancer. Genome Res. 28:1747–1756. 2018.
View Article : Google Scholar : PubMed/NCBI
|
|
55
|
Jiang L and Liu J: Immunological effect of
tyrosine kinase inhibitors on the tumor immune environment in
non-small cell lung cancer. Oncol Lett. 23:1652022. View Article : Google Scholar : PubMed/NCBI
|
|
56
|
Hu FF, Liu CJ, Liu LL, Zhang Q and Guo AY:
Expression profile of immune checkpoint genes and their roles in
predicting immunotherapy response. Brief Bioinform. 22:bbaa1762021.
View Article : Google Scholar : PubMed/NCBI
|
|
57
|
Barsouk A, Aluru JS, Rawla P, Saginala K
and Barsouk A: Epidemiology, risk factors, and prevention of head
and neck squamous cell carcinoma. Med Sci (Basel).
11:422023.PubMed/NCBI
|
|
58
|
Trivedi S, Sun L and Aggarwal C:
Immunotherapy for head and neck cancer. Hematol Oncol Clin North
Am. 35:1021–1037. 2021. View Article : Google Scholar : PubMed/NCBI
|
|
59
|
Li XX, Peng T, Gao J, Feng JG, Wu DD, Yang
T, Zhong L, Fu WP and Sun C: Allele-specific expression identified
rs2509956 as a novel long-distance cis-regulatory SNP for SCGB1A1,
an important gene for multiple pulmonary diseases. Am J Physiol
Lung Cell Mol Physiol. 317:L456–L463. 2019. View Article : Google Scholar : PubMed/NCBI
|
|
60
|
Xu M, Yang W, Wang X and Nayak DK: Lung
secretoglobin Scgb1a1 influences alveolar macrophage-mediated
inflammation and immunity. Front Immunol. 11:5843102020. View Article : Google Scholar : PubMed/NCBI
|
|
61
|
Yu Y, Liu JY, Yang HJ, Luo XQ, Gao XP,
Huang XX, Tang AX, Mary Cheng HY, Liu WC and Zhang P: Circadian
disruption during fetal development promotes pathological cardiac
remodeling in male mice. iScience. 27:1090082024. View Article : Google Scholar : PubMed/NCBI
|
|
62
|
Liu Y, Yu HJ, Wang N, Zhang YN, Huang SK,
Cui YH and Liu Z: Clara cell 10-kDa protein inhibits T(H)17
responses through modulating dendritic cells in the setting of
allergic rhinitis. J Allergy Clin Immunol. 131:387–394.e1-12. 2013.
View Article : Google Scholar : PubMed/NCBI
|
|
63
|
Linnoila RI, Szabo E, DeMayo F, Witschi H,
Sabourin C and Malkinson A: The role of CC10 in pulmonary
carcinogenesis: From a marker to tumor suppression. Ann N Y Acad
Sci. 923:249–267. 2000. View Article : Google Scholar : PubMed/NCBI
|
|
64
|
Hicks SM, Vassallo JD, Dieter MZ, Lewis
CL, Whiteley LO, Fix AS and Lehman-McKeeman LD: Immunohistochemical
analysis of Clara cell secretory protein expression in a transgenic
model of mouse lung carcinogenesis. Toxicology. 187:217–228. 2003.
View Article : Google Scholar : PubMed/NCBI
|
|
65
|
Pilon AL: Rationale for the development of
recombinant human CC10 as a therapeutic for inflammatory and
fibrotic disease. Ann N Y Acad Sci. 923:280–299. 2000. View Article : Google Scholar : PubMed/NCBI
|
|
66
|
Mirlekar B: Tumor promoting roles of
IL-10, TGF-β, IL-4, and IL-35: Its implications in cancer
immunotherapy. SAGE Open Med. 10:205031212110690122022. View Article : Google Scholar : PubMed/NCBI
|
|
67
|
Lu J, Linares B, Xu Z and Rui YN:
Mechanisms of FA-phagy, a new form of selective
autophagy/organellophagy. Front Cell Dev Biol. 9:7991232021.
View Article : Google Scholar : PubMed/NCBI
|
|
68
|
Wu L, Jin Y, Zhao X, Tang K, Zhao Y, Tong
L, Yu X, Xiong K, Luo C, Zhu J, et al: Tumor aerobic glycolysis
confers immune evasion through modulating sensitivity to T
cell-mediated bystander killing via TNF-α. Cell Metab.
35:1580–1596.e9. 2023. View Article : Google Scholar : PubMed/NCBI
|
|
69
|
Yang FM, Chang HM and Yeh ETH: Regulation
of TLR4 signaling through the TRAF6/sNASP axis by reversible
phosphorylation mediated by CK2 and PP4. Proc Natl Acad Sci USA.
118:e21070441182021. View Article : Google Scholar : PubMed/NCBI
|
|
70
|
Economopoulou P, Agelaki S, Perisanidis C,
Giotakis EI and Psyrri A: The promise of immunotherapy in head and
neck squamous cell carcinoma. Ann Oncol. 27:1675–1685. 2016.
View Article : Google Scholar : PubMed/NCBI
|