Introduction
Colorectal cancer (CRC) represents a significant
global health burden, contributing to a substantial number of
cancer-related deaths worldwide. In 2020 alone, there were over 1.9
million new cases and 0.94 million deaths attributed to CRC
globally (1). It ranks third in
terms of incidence and second in mortality among cancers (1). Despite the potential of early
screening to reduce CRC incidence and mortality, challenges persist
in the performance of screening tests and patient adherence among
eligible populations (2).
Metastatic CRC occurs in ~20% of all CRC cases (3), with 40% experiencing recurrence
following treatment of the primary lesion (4). Unfortunately, the prognosis for
metastatic CRC remains grim, with a five-year survival rate of
<20% (5). Elderly individuals
bear a significant burden, as nearly 70% of CRC cases are diagnosed
in those aged >65 years (6).
However, the impact of age on survival outcomes is not universally
agreed upon. Factors such as stage at presentation, tumor location,
preexisting health conditions and treatment type may confound the
prognosis of older patients (7).
Given these challenges, there is an urgent need to develop more
effective therapeutic strategies for patients with advanced-stage
CRC.
Cancer immunotherapy has emerged as a promising
approach for treating challenging solid tumors by enhancing the
ability of the immune system to eliminate cancer cells (8–10). In
CRC, immune checkpoint inhibitors (ICIs) gained regulatory approval
following the CheckMate142 clinical trial in 2017 (11,12).
The ICIs are specifically designed for patients with CRC with a
high tumor mutation burden (TMB), characterized by deficient
mismatch repair protein (dMMR) and high microsatellite instability
(MSI-H), collectively known as the dMMR/MSI-H CRC subtype (12). PD-L1 expression in immune cells is
significantly higher in MSI-H CRC than in proficient MMR [low
microsatellite instability (MSI-L)] tumors, with no notable
differences among various MSI-H molecular subtypes (13). Currently, the recommended screening
for defective MMR involves immunohistochemistry (IHC) and/or MSI
testing (14). However, capturing
the biological and technical heterogeneity of MSI testing poses
challenges. IHC testing of the mismatch repair machinery may yield
varying results for specific germline mutations, while somatic
nonsense mutations can also influence the overall findings
(14). Consequently, it is crucial
for CRC immunotherapy to identify the molecular characteristics of
the tumor microenvironment (TME) and search for reliable immune
prognostic indicators.
Macrophages are pivotal in various immune processes,
serving essential functions such as phagocytosis, antigen
presentation and the secretion of signaling molecules (15,16).
In the TME, tumor-associated macrophages (TAMs) are derived from
peripheral blood monocytes that infiltrate tumor tissues (17,18).
These TAMs are closely associated with tumor initiation,
progression, angiogenesis and metastasis (19). TAMs are generally classified into
two subpopulations including classically activated macrophages (M1)
and alternatively activated macrophages (M2) (20). M1 macrophages release chemokines and
pro-inflammatory cytokines, which have anti-tumor effects and
promote immune surveillance (20).
By contrast, M2 macrophages secrete inhibitory cytokines that
primarily support tumor growth and metastasis (21).
High levels of TAM infiltration in tumor tissues are
typically considered a risk factor for poor prognosis in cancer
treatments, including radiotherapy, chemotherapy and targeted
therapy (16,22–24).
Moreover, the dynamic changes in macrophage subpopulations can
significantly influence the effectiveness of immunotherapy across
various cancer types (25–27). Conventional biomarkers are often
insufficient for predicting the efficacy of cancer immunotherapies.
Although gene mutations such as V-Ki-Ras2 Kirsten rat sarcoma 2
viral oncogene (KRAS), neuroblastoma RAS viral oncology and B-Raf
Proto-Oncogene (BRAF), inflammatory markers such as
neutrophil-lymphocyte ratio, lymphocyte-monocyte ratio and
platelet-lymphocyte ratio, and aberrant miRNAs serve as prognostic
and predictive biomarkers for personalized CRC therapy, more
research is required to optimize their detection and validation
(28). In the present study, to
identify more macrophage-related biomarkers with clinical
relevance, single-cell RNA sequencing (scRNA-seq) was used for a
precise analysis of CRC macrophages.
scRNA-seq is a revolutionary method that enables the
detailed examination of global gene expression profiles in
individual cell types, providing profound insights into cellular
heterogeneity (29,30). Currently, numerous research
initiatives aim to discover novel biomarkers for malignancies by
integrating scRNA-seq with traditional RNA sequencing (RNA-seq)
(31–33). Despite these efforts, there remains
a significant gap in knowledge regarding macrophage-related
immunotherapeutic indicators identified through the combination of
scRNA-seq and weighted gene co-expression network analysis (WGCNA)
(34). The present study aimed to
bridge this gap by developing a novel gene signature through the
integration of the aforementioned advanced tools, thereby improving
prognostic predictions for CRC immunotherapy. This innovative
approach offers a theoretical foundation for creating personalized
treatment strategies for patients with CRC.
Materials and methods
Data acquisition and processing
The present study utilized five independent public
datasets, including scRNA-seq, high-throughput RNA-seq and
microarray cohorts. The scRNA-seq dataset (GSE200997; n=23)
(35), was sourced from the Gene
Expression Omnibus (GEO) (https://www.ncbi.nlm.nih.gov/geo/). This dataset
provided valuable insights into colorectal cellular diversity and
heterogeneity within tumor and microenvironmental cells.
Transcriptome datasets and corresponding clinical information for
CRC were obtained from The Cancer Genome Atlas [dataset no.
TCGA-COAD/TCGA-READ; n=522; colon cancer/rectum cancer (481/41);
https://portal.gdc.cancer.gov/].
Additionally, microarray cohorts from the GEO database were
included: GSE17536 (n=177), GSE38832 (n=122) and GSE39582
(n=585).
The raw RNA-seq count data were converted to
transcripts per million format and subsequently log-2 transformed.
Expression profiles from GEO were processed and normalized using
the ‘affy’ (version 1.48.0) and ‘lumi’ (version 2.22.0) packages,
tailored to the different platforms. The four datasets, excluding
the scRNA-seq cohort, were combined, and the ‘sva’ package (3.18.0)
was employed to correct for batch effects.
scRNA-seq data analysis
ScRNA-seq data analysis was performed with R
language programming (R version 4.2.3, http://www.r-project.org). To ensure quality,
single-cell gene expression profiles were filtered to remove
mitochondrial genes and cells with <200 detected genes.
Dimensional reduction and clustering visualization were performed
using the ‘Seurat’ package. The resulting cell clusters were
annotated using the ‘SingleR’ package. Unique marker genes for each
cluster were identified with the ‘FindAllMarkers’ function.
Subsequently, enrichment analysis was conducted using the irGSEA
package to gain further insights into the biological significance
of these markers.
WGCNA
To explore the correlations between gene modules and
clinicopathological data, WGCNA (version 1.72–5) was used (36). Initially, a scale-free gene
co-expression networks was constructed using the ‘wgcna’ package,
removing outlier samples with a connectivity threshold <-2.5.
The soft threshold powers were determined by calculating the
scale-free topology fitting indices (R2) using the
‘pickSoftThreshold’ function, ensuring a power value >0.8 to
approximate a scale-free network topology.
After which, the adjacency matrix was transformed
into a topological overlap matrix (TOM) and computed the
corresponding dissimilarity TOM (1-TOM). Using the dynamic tree cut
method, gene modules were identified and colored. The relationship
between module eigenvalues and phenotypes was evaluated, selecting
the modules with the highest correlation for further analysis.
Non-negative matrix factorization and
estimation of TME cell infiltration
To identify genes associated with prognosis,
univariate Cox regression analysis was conducted. Molecular
clustering was performed using the non-negative matrix
factorization (NMF) package (R version 4.2.3; http://cran.r-project.org/package=NMF)
(37), iterating through the matrix
factorization process. The ESTIMATE algorithm was applied to infer
immune and stromal scores for each sample, providing insights into
the TME. Additionally, the CIBERSORT algorithm was utilized to
estimate the enrichment scores of immune and stromal cell types
within the samples (38).
Construction of the
Macrophages-Gene-Hub-Signature-related prognostic model
Using the ‘limma’ package (version 3.28.6), 175
differentially expressed genes (DEGs) were identified between two
subtypes. To mitigate the risk of overfitting, a
Macrophages-Gene-Hub-Signature (MHGS) risk score was developed
using the Lasso regression. Subsequently, multivariate Cox
regression analysis was conducted to screen candidate genes. The
MHGS score was calculated as follows: MHGS score=Σ (Exp × coefi),
where ‘Exp’ and ‘coefi’ denote the expression and coefficient of
each MHGS-related gene, respectively. Patients in both the training
and validation sets were stratified into low-risk and high-risk
groups based on the median MHGS score. Kaplan-Meier survival curves
were generated and analyzed for these groups. Additionally, the
prognostic accuracy of the risk-score model was assessed using
receiver operating characteristic (ROC) curves.
Analysis of molecular and immune
characteristics and ICI therapy in the MHGS model
The analysis was initiated by performing
differential expression analysis of all genes between high-risk and
low-risk MHGS groups using the ‘limma’ package (version 3.28.6).
Subsequently, gene set enrichment analysis (GSEA) was employed via
the ‘clusterProfiler’ package in R (R version 4.2.3; http://www.r-project.org) to identify specific
signaling pathways associated with these genes, focusing on those
with statistical significance (P<0.05 and FDR<0.25).
Gene mutation analysis utilized data obtained from
the TCGA and GEO databases, leveraging the ‘Maftools’ package
(version 0.99.30) to assess genetic alterations across different
risk groups. Pearson correlation analysis was conducted to explore
the relationship between the MHGS score and TMB. Additionally, the
relative proportions of 22 types of immune cells in the MHGS groups
were estimated using the CIBERSORT algorithm. These proportions
were then compared alongside clinicopathological factors such as
age, sex, TNM stage, TP53, KRAS, BRAF and recurrence.
To evaluate the predictive value of the MHGS score
in the context of immunotherapy, the Tumor Immune Dysfunction and
Exclusion (TIDE) score (http://tide.dfci.harvard.edu) and the immunophenoscore
(IPS) were employed from The Cancer Immunome Atlas (TCIA)
(https://tcia.at/) to assess treatment response. A
lower TIDE score and higher IPS are indicative of a more favorable
response to immunotherapy (39).
Survival analyses of the MHGS risk score were conducted within a
cohort of patients with urothelial cancer treated with anti-PD-L1
therapy (40). Furthermore,
time-dependent ROC curve analyses were performed to compare the
prognostic value of MHGS with that of the tumor inflammation
signature (TIS), calculated as the average log2-scale normalized
expression of 18 signature genes (41).
Cell culture and transfection
procedures
CRC cell lines (RKO, SW480 and LoVo), colon
epithelial cells (HIEC) and 293T cells were cultured in
high-glucose DMEM medium (HyClone; Cytiva) supplemented with 10%
fetal bovine serum (FBS; Gibco; Thermo Fisher Scientific, Inc.).
HCT15 cells were cultured in RPMI 1640 medium (HyClone; Cytiva)
with 10% FBS (Gibco; Thermo Fisher Scientific, Inc.). These cell
lines were sourced from the Sichuan Bio Biotechnology Co., Ltd. and
maintained at 37°C with 5% CO2 in culture dishes.
To downregulate secreted protein acidic and rich in
cysteine-like 1 (SPARCL1) expression, shRNA targeting SPARCL1 was
obtained from Shanghai GenePharma Co., Ltd. and transfected using
Lipofectamine® 2000 (Invitrogen; Thermo Fisher
Scientific, Inc.) following the manufacturer's protocol. The
specific siRNA sequences used were: sh-SPARCL1 target sequence:
CCGGCCCGACAAATGCAAGATTATTCTCGAGAATAATCTTGCATTTGTCGGGTTT;
sh-negative control (sh-NC) target sequence:
CCTAAGGTTAAGTCGCCCTCGCTCGAGCGAGGGCGACTTAACCTTAGG. PLKO.1-TRC was
selected as the plasmid backbone. The concentration of nucleic acid
was 2 µg plasmid DNA per well in a 6-well plate. The transfection
was carried out at 37°C for 4–6 h. A 48-h interval was maintained
between transfection and subsequent experimentation.
Tissue microarray (TMA) and IHC
analysis
A total of 80 pairs of CRC and adjacent tissue
samples were collected from the Second Affiliated Hospital of Xi'an
Jiaotong University (Xi'an, China) during the period from January
2023 to September 2023. The ages of the patients ranged from 31 to
81 years, comprising 36 women and 44 men. The inclusion criteria
included: i) Aged over 18 years; ii) diagnosis of advanced-stage
colorectal cancer based on pathological standards; iii)
availability of complete clinicopathological information including
sex, age, TNM stage, treatment and prognosis; iv) willingness to
participate in the clinical study and provision of informed
consent; and v) well-preserved tumor tissue sample meeting
experimental requirements. The exclusion criteria included: i)
Presence of simultaneous or metachronous multi-site tumors; ii)
incomplete tumor clinic information leading to insufficient data
collection; and iii) loss of tissue sample during transport.
The collection of human tissues was approved by The
Medical Ethics Committee of The Second Affiliated Hospital of Xi'an
Jiaotong University (Xi'an, China; approval no. 2023R063) and
written informed consent was obtained from all individuals or
individuals' guardians. The samples were then sent to Hunan Aifang
Biotechnology Co., Ltd. where TMA construction and IHC staining
analysis was performed on the collected samples. Tissues were
dehydrated in ethanol solutions (75, 85, 95 and 100%) for 1 h each,
cleared in xylene tanks (Tank I for 20 min; Tank II for 30 min),
and infiltrated in paraffin tanks (Tank I for 1 h; Tank II for 1.5
h; Tank III for 2 h). After which, the samples were embedded in
liquid paraffin, trimmed, marked and retrieved for sectioning.
Tissue strips were arranged in paraffin blocks for microarray
preparation. The final steps involved securing tissue pieces in
paraffin blocks using a specialized machine. During sectioning, the
paraffin block was adjusted in a microtome, the section was
aligned, cut to 4-µm thick, warmed, affixed to a glass slide, dried
briefly, heated and baked.
IHC staining for SPARCL1 was performed using the
anti-SPARCL1 antibody following standardized protocols described in
previous studies (42).
Paraffin-embedded samples were fixed with 10% formalin at room
temperature (25°C) for 24 h, resin-embedded in paraffin and
sectioned at 4 µm thickness. Antigen retrieval was performed at
100°C using phosphate-buffered saline, followed by rehydration in a
descending ethanol series. The samples were blocked with 3% BSA at
room temperature (25°C) for 30 min (Wuhan Servicebio Technology
Co., Ltd.; cat. no. G5001), and 3% hydrogen peroxide was used to
block endogenous peroxidase activity in HRP/DAB staining. The
samples were incubated with the primary antibody for SPARCL1 (cat.
no. 13517-1-AP; Proteintech Group, Inc.; 1:100) at 4°C overnight,
followed by incubation with the secondary antibody
(polymer-horseradish peroxidase conjugated goat anti-rabbit Ig G
polyclonal antibody; cat. no. AFIHC003; Hunan Aifang Biotechnology
Co., Ltd) at room temperature for 50 min. DAB was used for
chromogen detection, and hematoxylin counterstaining was performed
at room temperature for 3 min. Digital images of the stained CRC
tissues were captured using a KF-FL-020 digital slide scanner
(KonFoong Bioinformation Tech Co., Ltd.) utilizing 50 and 200 µm
scale bars and analyzed using Visiopharm software (https://visiopharm.com).
An IHC staining score was calculated for each slide
to assess SPARCL1 expression. The score was derived by multiplying
the staining intensity (i) by the percentage of positively stained
cells (pi) and summing these values: IHC-Score=∑(pi × i). Staining
intensity was graded on a scale from 0 (no staining) to 3 (strong
staining) (43). Thus, the
resulting IHC-Score ranged from 0–300, with higher scores
indicating greater overall positive staining intensity.
Cell culture and colony formation
assay
Colonies were identified as clusters consisting of
>50 cells that originated from a single cell. Cell lines were
trypsinized to obtain a single-cell suspension, and 200 cells were
seeded per well in 6-well plates. The plates were then incubated
for 2 weeks under standard conditions in a 37°C, humidified
atmosphere with 5% CO2 using culture medium with 10% FBS
and antibiotics. After incubation, colonies were fixed with 4%
paraformaldehyde for 30 min at room temperature (25°C) and
subsequently stained with 0.5% crystal violet for 1 h at 37°C. The
colonies were quantified by manual counting under a light
microscope after crystal violet staining. Three independent
experiments were performed in triplicate, and the average number of
colonies was calculated.
Wound healing assay
The wound closure was assessed by measuring the
wound area at 0, 24, and 36 h. The percentage closure was
determined by comparing the areas at each time point to the initial
area at 0 h. CRC cells treated with various conditions (sh-NC and
sh-SPARCL1) were seeded into 6-well culture dishes and allowed to
grow until they reached 90% confluence. Subsequently, all plates
were placed in a 37°C humidified atmosphere with 5% CO2
for the 36-h experimental duration. A linear scratch was made
across the cell monolayer in each well using a 200 µl pipette tip.
After creating the wound, the wells were washed with
phosphate-buffered saline (PBS) to remove any detached cells.
Subsequently, fresh medium without FBS was added to the wells. The
progress of wound closure was monitored and recorded using an
inverted microscope (Olympus Corporation) at 0, 24 and 36 h
post-scratching. A total of three independent experiments were
conducted in triplicate to calculate the average percentage of
wound closure.
Cell migration assay
For the cell migration assay, 3×10⁴ cells
were suspended in serum-free medium and seeded into the upper
chamber of a Transwell plate (Corning Inc.). Each lower chamber was
filled with medium containing 10% FBS (Gibco; Thermo Fisher
Scientific, Inc.; 500 µl/well). The cells were allowed to migrate
for 24 h at 37°C. Following incubation, non-migrated cells on the
upper surface of the membrane were carefully removed using a cotton
swab. Subsequently, the migrated cells on the lower surface of the
membrane were fixed with 4% paraformaldehyde for 15 min at room
temperature (25°C) and the fixed cells were stained with a 0.1%
crystal violet solution for 30 min. Finally, the stained cells were
quantified by counting by the number of stained cells in five
randomly selected fields per membrane under a light microscope.
Protein extraction and Western blot
analysis
Total protein was extracted using RIPA lysis buffer
(Beyotime Institution of Biotechnology) supplemented with protease
and phosphatase inhibitors (Beyotime Institution of Biotechnology).
The concentration of extracted proteins was quantified using a BCA
protein assay kit (Beyotime Institution of Biotechnology).
Subsequently, the proteins were separated by 10% SDS-PAGE and
transferred onto a PVDF membrane (Cytiva) with 30 µg protein loaded
per lane. After which, 5% non-fat dry milk in TBST (Tris-buffered
saline with 0.1% Tween-20) was used to block non-specific antigen
sites for 1 h at room temperature (25°C). The membranes were
incubated overnight at 4°C with the following primary antibodies:
SPARCL1 (1:1,000 dilution; cat. no. ab255597; Abcam) and β-actin
(1:1,000 dilution; cat. no. ab8227; Abcam), followed by incubation
for 1 h at room temperature (20°C) with horseradish
peroxidase-conjugated goat anti-rabbit secondary antibodies
(1:50,000, cat. no. HA1001; 1:20,000; cat. no. HA1006; HUABIO) for
visualization of protein bands. The transferred proteins were
detected using an enhanced chemiluminescence detection system
(Sensi Sage Technology).
Statistical analysis
Data are presented as the mean ± standard deviation
(SD) for continuous variables. For non-parametric data, results
were presented as the median with interquartile range (IQR).
Categorical variables were presented as frequencies and
percentages. Graphs display individual data points along with error
bars representing SD or IQR as appropriate. The statistical
analyses were conducted using R (version 3.3.1) and GraphPad Prism
8.0 (Dotmatics). Comparisons between two groups were evaluated by
the Wilcoxon rank-sum test, while the Kruskal-Wallis test was
conducted to compare more than two groups. An independent t-test
was applied to compare continuous variables between two groups.
P<0.05 was considered to indicate a statistically significant
difference.
Results
Single-cell analysis reveals cell
subtypes
scRNA-seq analysis of the GSE200997 dataset included
16 colon cancer samples and seven normal samples, totaling 47,560
immune cells passing quality control (Fig. S1). Using principal component
analysis (Figs. S2 and S3) and t-distributed stochastic neighbor
embedding (t-SNE) analysis (Fig. 1A and
B), the cells were classified into 31 clusters. Based on
distinct gene signatures, the immune cells were categorized into
seven major clusters: i) T cells; ii) B cells; iii) epithelial
cells; iv) natural killer (NK) cells; v) myeloid cells; vi)
fibroblasts; and vii) endothelial cells (Fig. 1C and D). Further analysis revealed
significant decreases in T cells, B cells and NK cells in tumor
tissues, accompanied by increases in epithelial cells and myeloid
cells compared with normal tissues (Fig. 1E). Given the pivotal role of
macrophages in tumor immunity and progression, additional
investigation and characterization of macrophage cells were
conducted at the single-cell level in the present study.
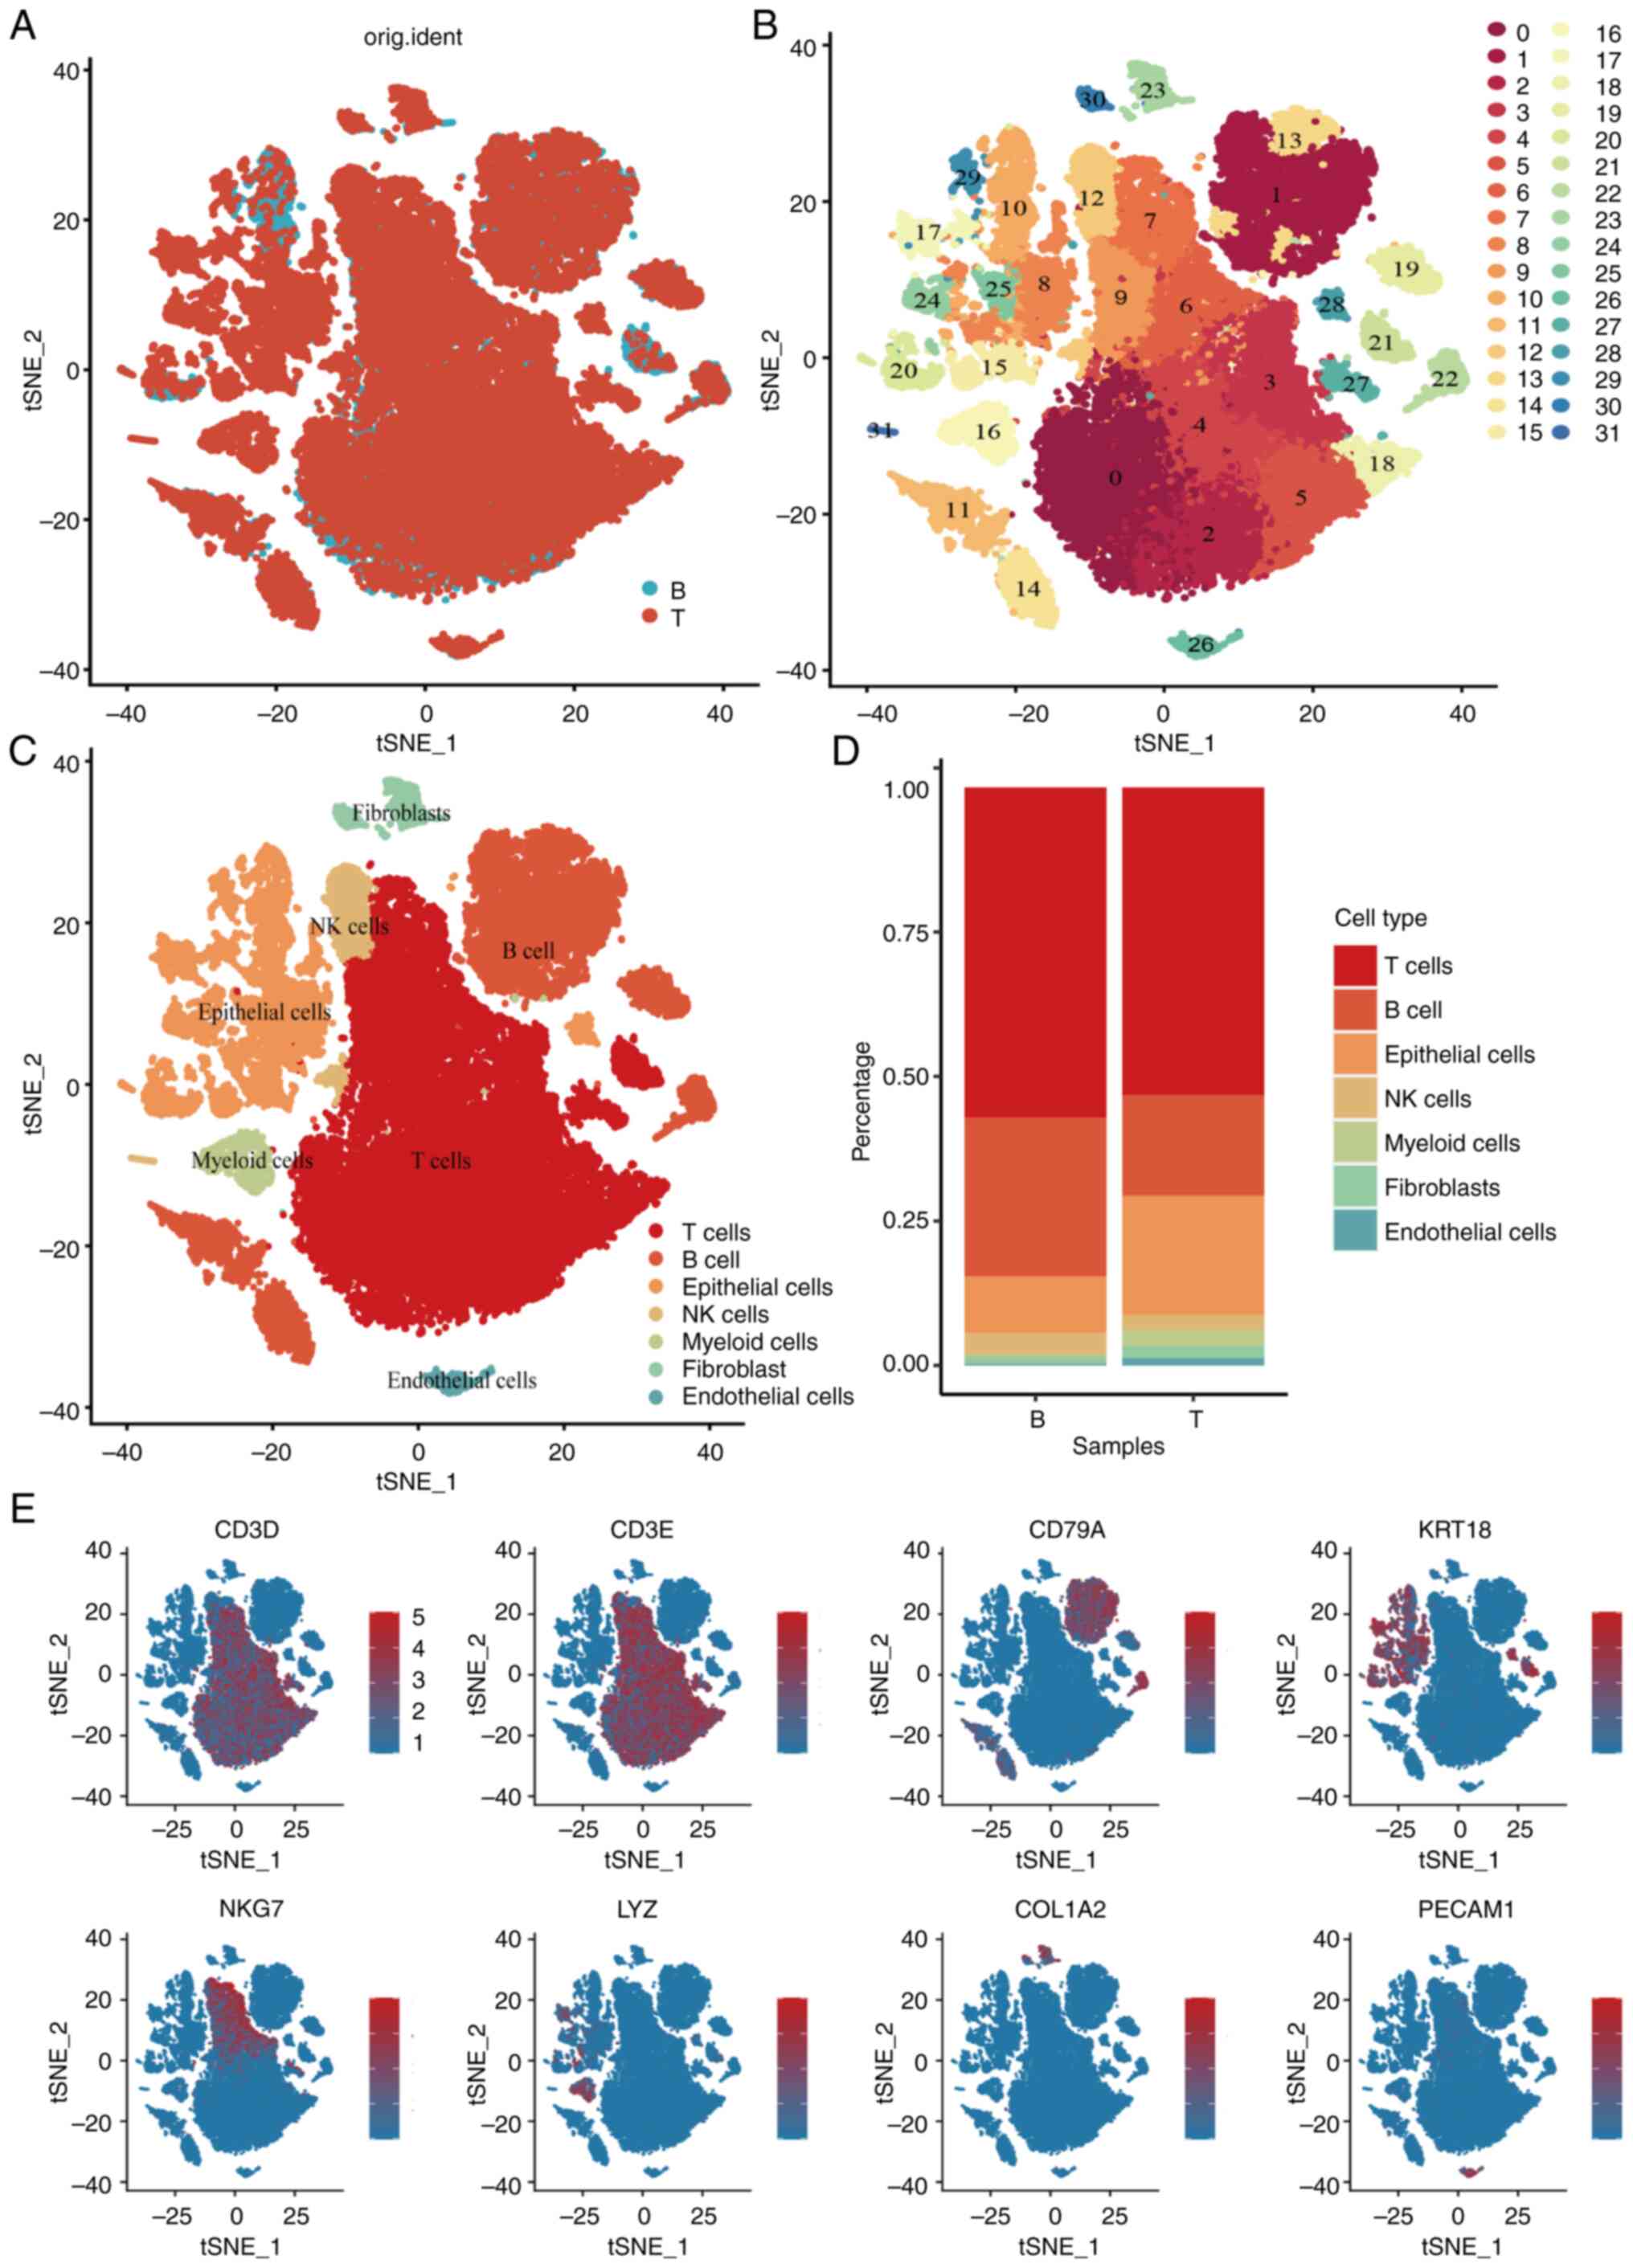 | Figure 1.Single-cell RNA-seq profiling of
different immune cell clusters derived from colorectal cancer.
t-distributed stochastic neighbor embedding plot of all the single
cells, with each color coded for (A) sample origin (normal or
tumor) (B) 31 major cell clusters and (C) immune cell types in CRC.
(D) Top marker gene of eight immune cell types identified in this
profile. (E) Proportions of five immune cell types originated from
tumor and normal tissue. CRC, colorectal cancer; NK, natural
killer; t-SNE, t-distributed stochastic neighbor embedding; KRT18,
cytokeratin18; PECAM1, platelet endothelial cell adhesion molecular
1; COL1A2, collagen type I alpha 2 chain; LYZ, lysozyme; CD3D, CD3
delta subunit of T-Cell receptor complex; CD3E, CD3 epsilon subunit
of T-Cell receptor complex; CD79A, B-cell antigen receptor
complex-associated protein alpha chain; NKG7, natural killer cell
granule protein 7. |
Identification of macrophage-related
genes in CRC development via WGCNA
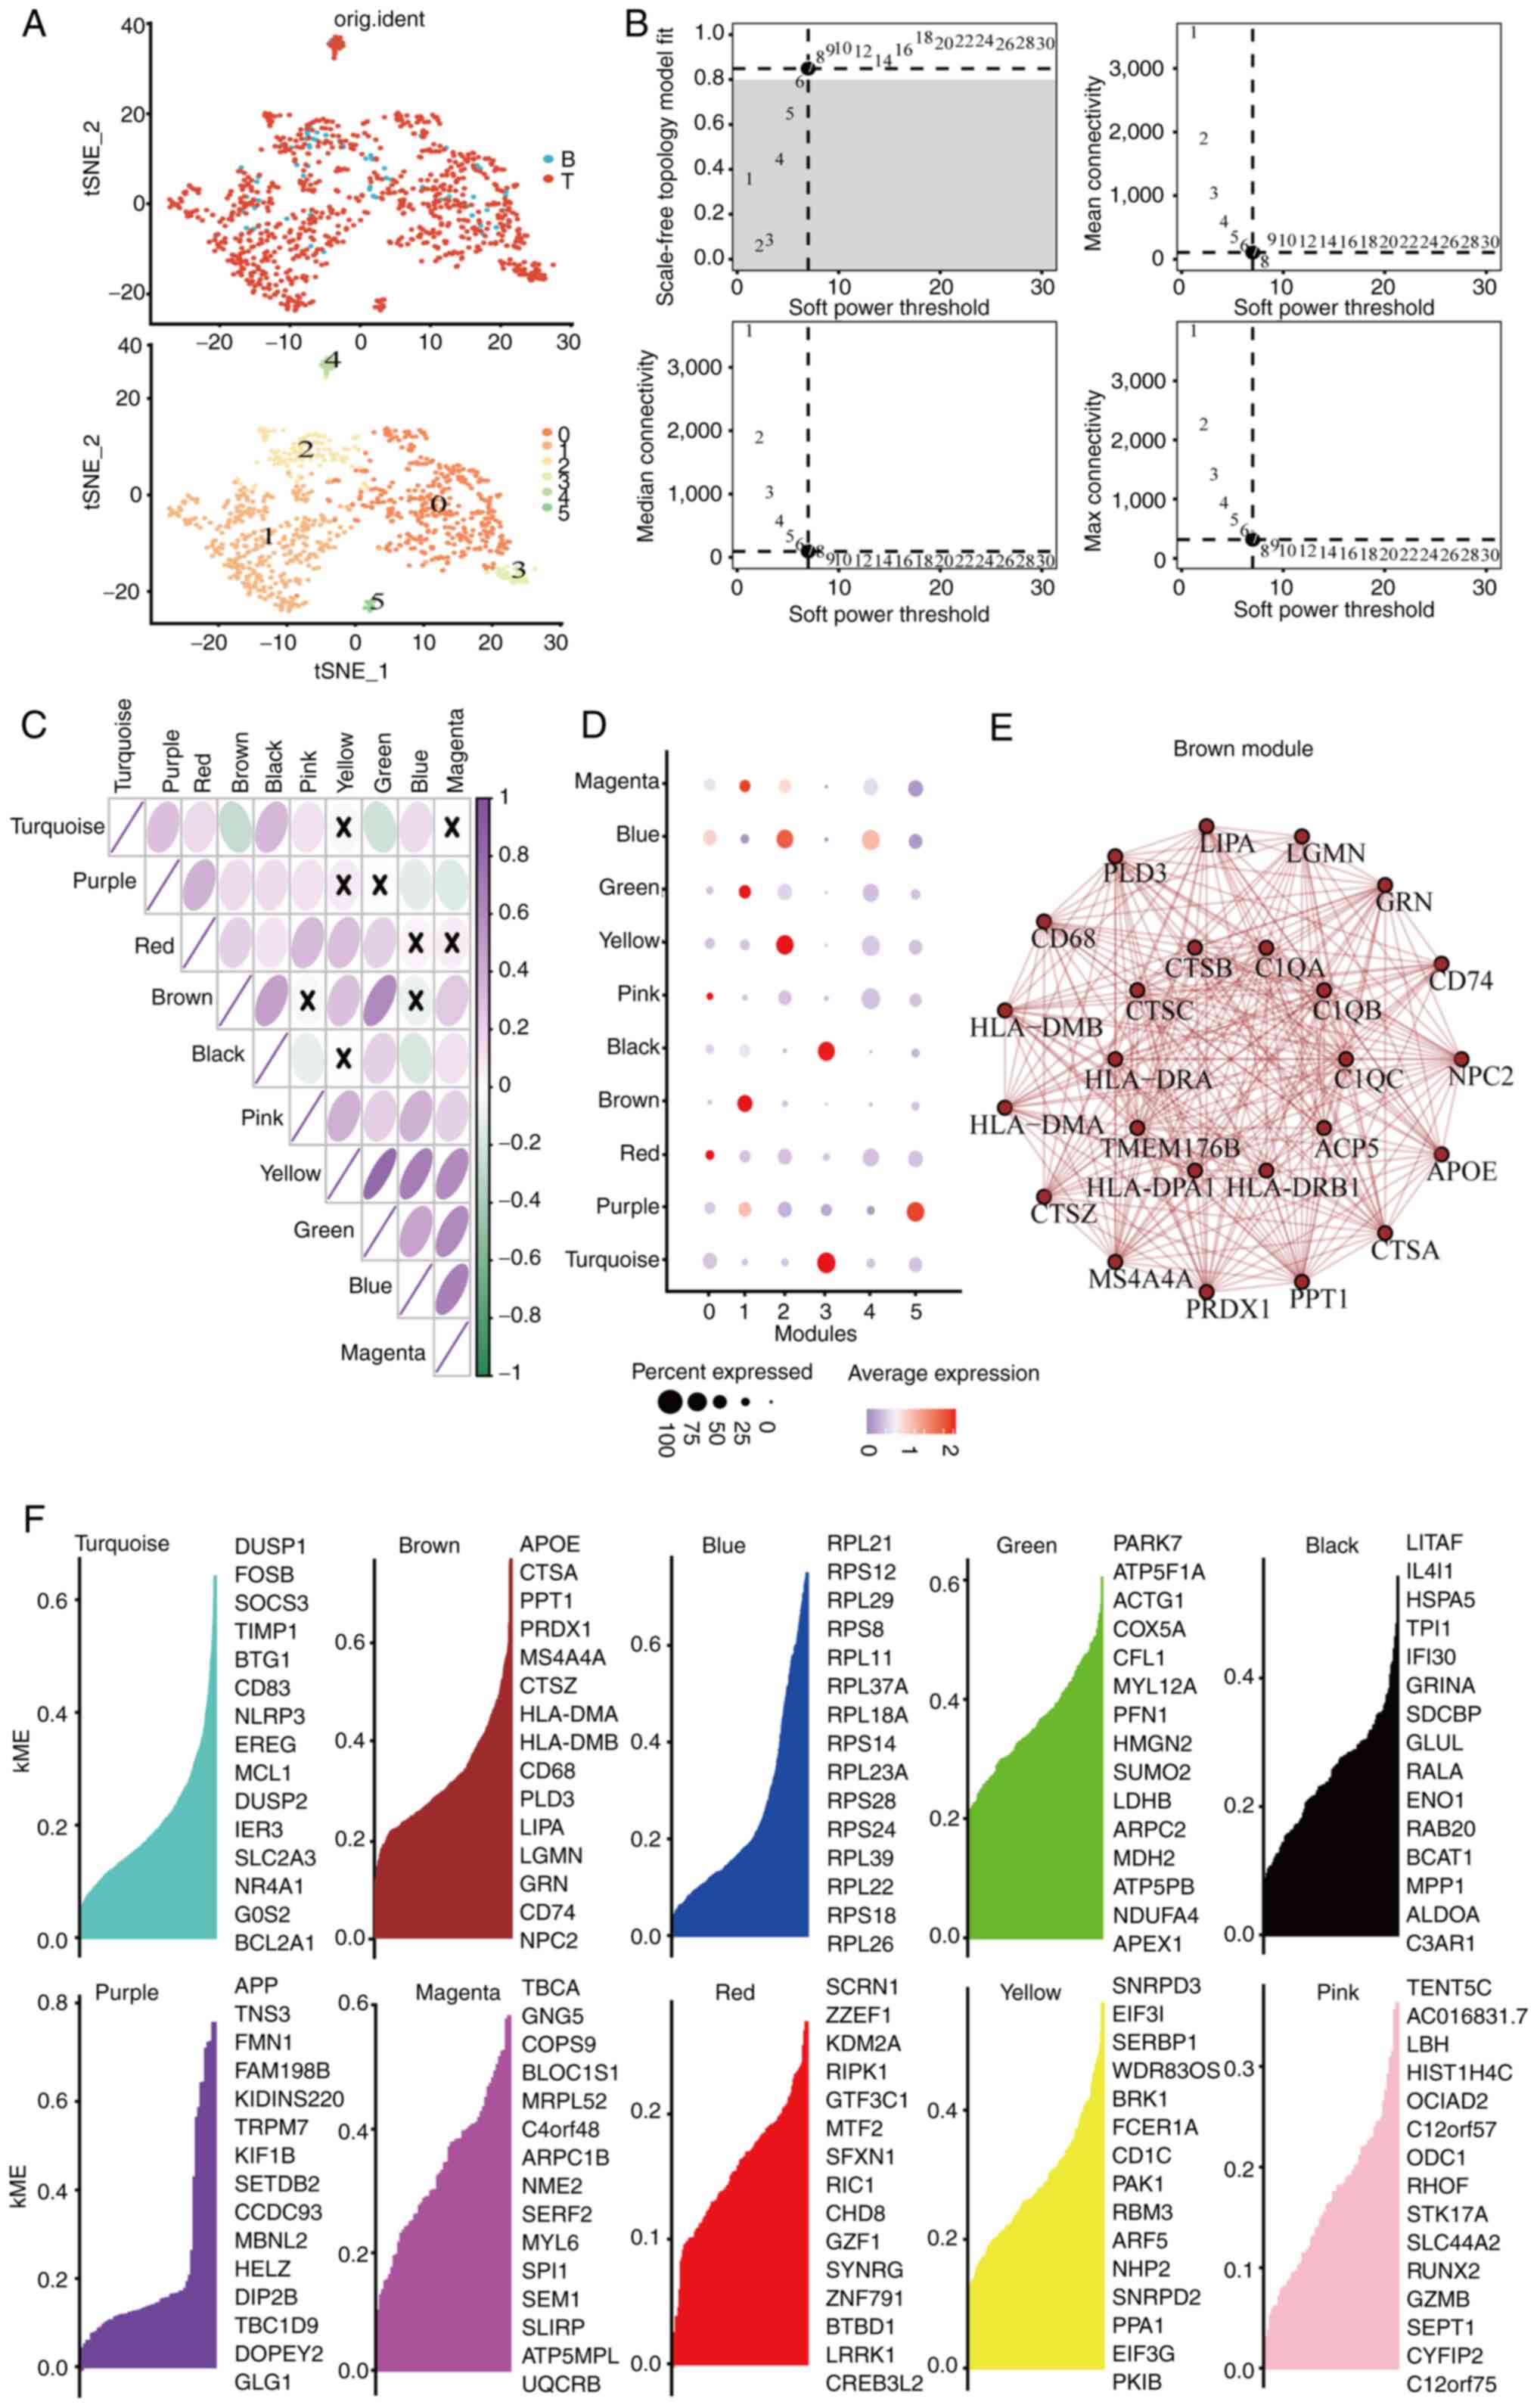
The myeloid cell subpopulations underwent t-SNE
dimensional reduction, revealing six principal subclusters
(Fig. 2A). Analysis of specific
gene markers in each subcluster indicated that cluster one showed
elevated expression of CD68 and CD14 (Fig. S4), recognized as distinctive
macrophage markers. To further investigate these subclusters,
co-expression network analysis was conducted using the WGCNA
package. A soft thresholding power β of seven was chosen, achieving
a fit index of 0.90 and demonstrating a network with scale-free
topology (Fig. 2B). Dynamic tree
cutting identified ten modules (Figs.
S5 and 2C), with the brown,
yellow, turquoise and purple modules strongly correlating with
clusters 1, 2, 3 and 5, respectively (Fig. 2D). Given the association of cluster
1 with macrophages, the blue module linked to cluster 1 was
selected for network analysis. The network connectivity of the top
25 hub genes within the brown module was visualized (Fig. 2E and F).
Different molecular subtype
identification
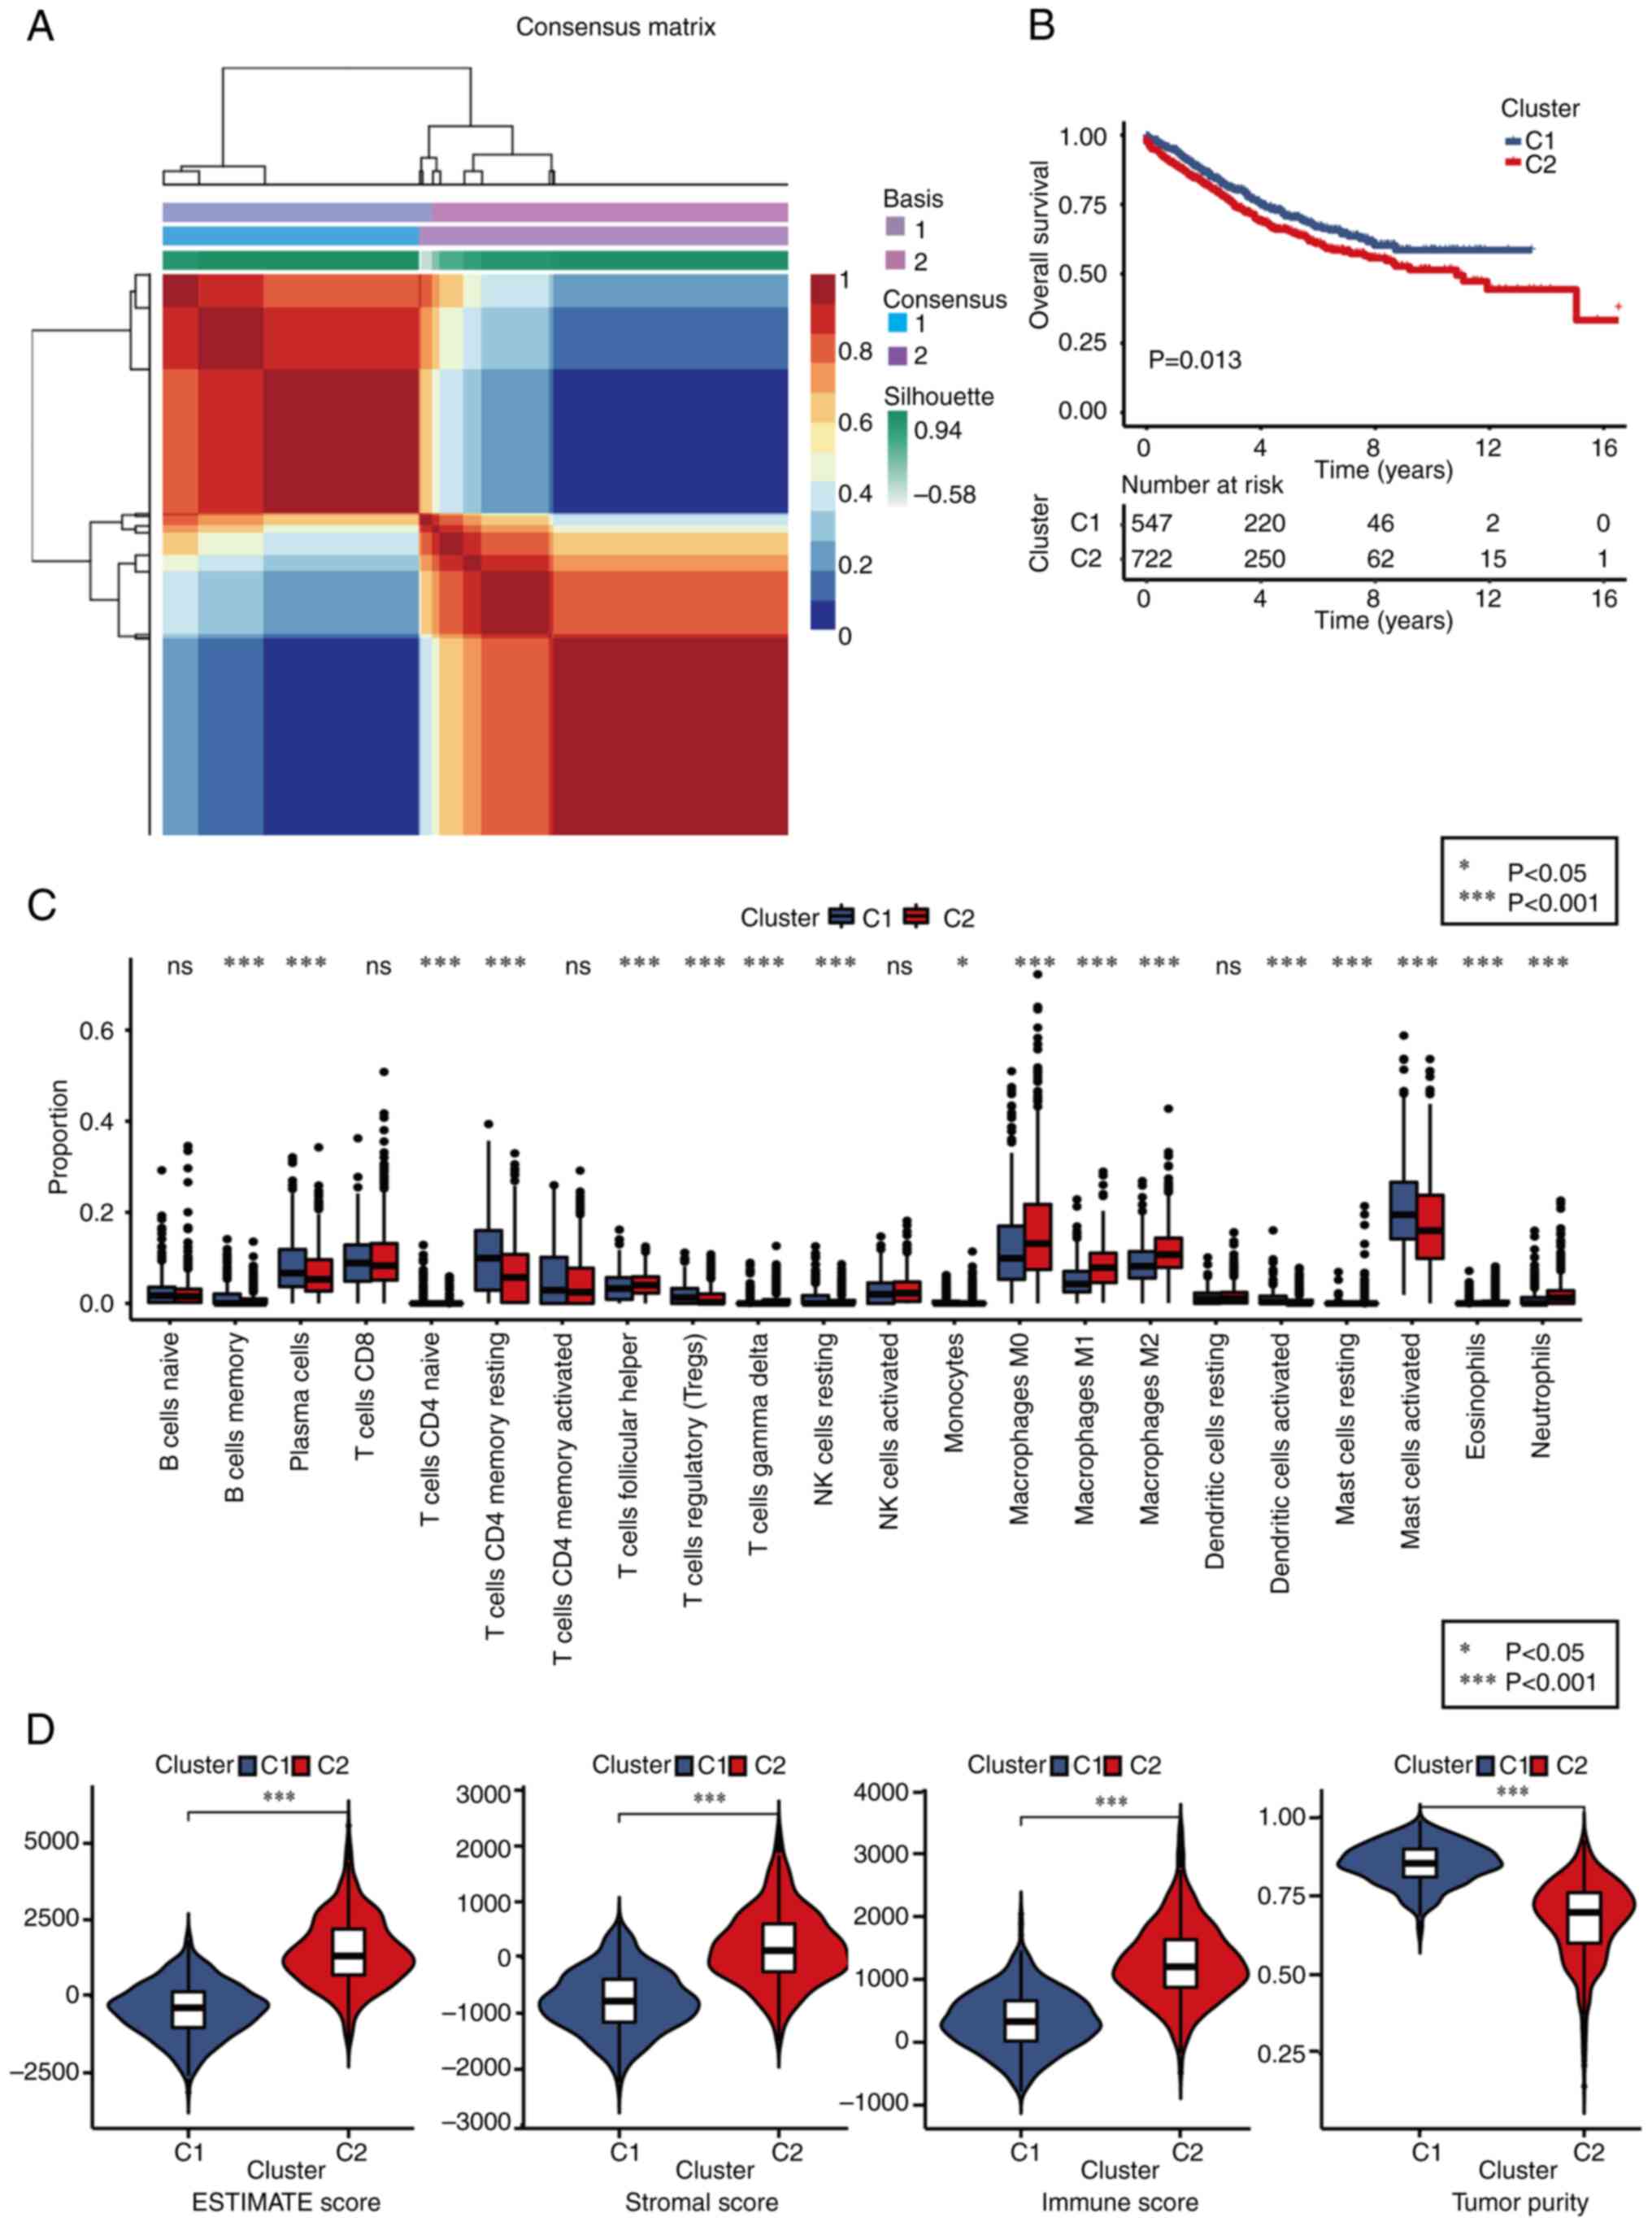
Based on the expression profiles of 25
macrophage-related genes, the NMF clustering algorithm was applied
to classify patients with CRC into two distinct subtypes: Subtype
C1 and C2 (Figs. 3A and S6). Notably, patients in subtype C1
exhibited significantly improved overall survival (OS) outcomes
compared with those in subtype C2 (Fig.
3B). To explore the relationship between these subtypes and 22
human immune cell subsets within CRC samples, correlation analyses
were conducted using the CIBERSORT algorithm (Fig. 3C). The findings revealed substantial
differences in immune cell infiltration between the two subtypes,
except for naïve B cells, CD8+ T cells, memory activated CD4+ T
cells, activated NK cells and resting dendritic cells.
Specifically, subtype C1 showed higher infiltration levels of
memory B cells, plasma cells, naïve CD4+ T cells, memory resting B
cells, regulatory T cells, resting NK cells, monocytes, activated
dendritic cells and activated mast cells compared with subtype C2.
By contrast, the infiltration levels of follicular helper T cells,
delta T cells (Tγδ), M0, M1 and M2 macrophages, resting mast cells,
eosinophils and neutrophils were significantly lower in subtype C1
than in subtype C2. Additionally, the TME scores were evaluated
using the ESTIMATE algorithm, including stromal score, immune score
and estimate score, for both subtypes. The analysis revealed that
subtype C1 displayed inferior stromal and immune scores but higher
tumor purity compared with subtype C2 (Fig. 3D).
MGHS prognostic model construction and
validation
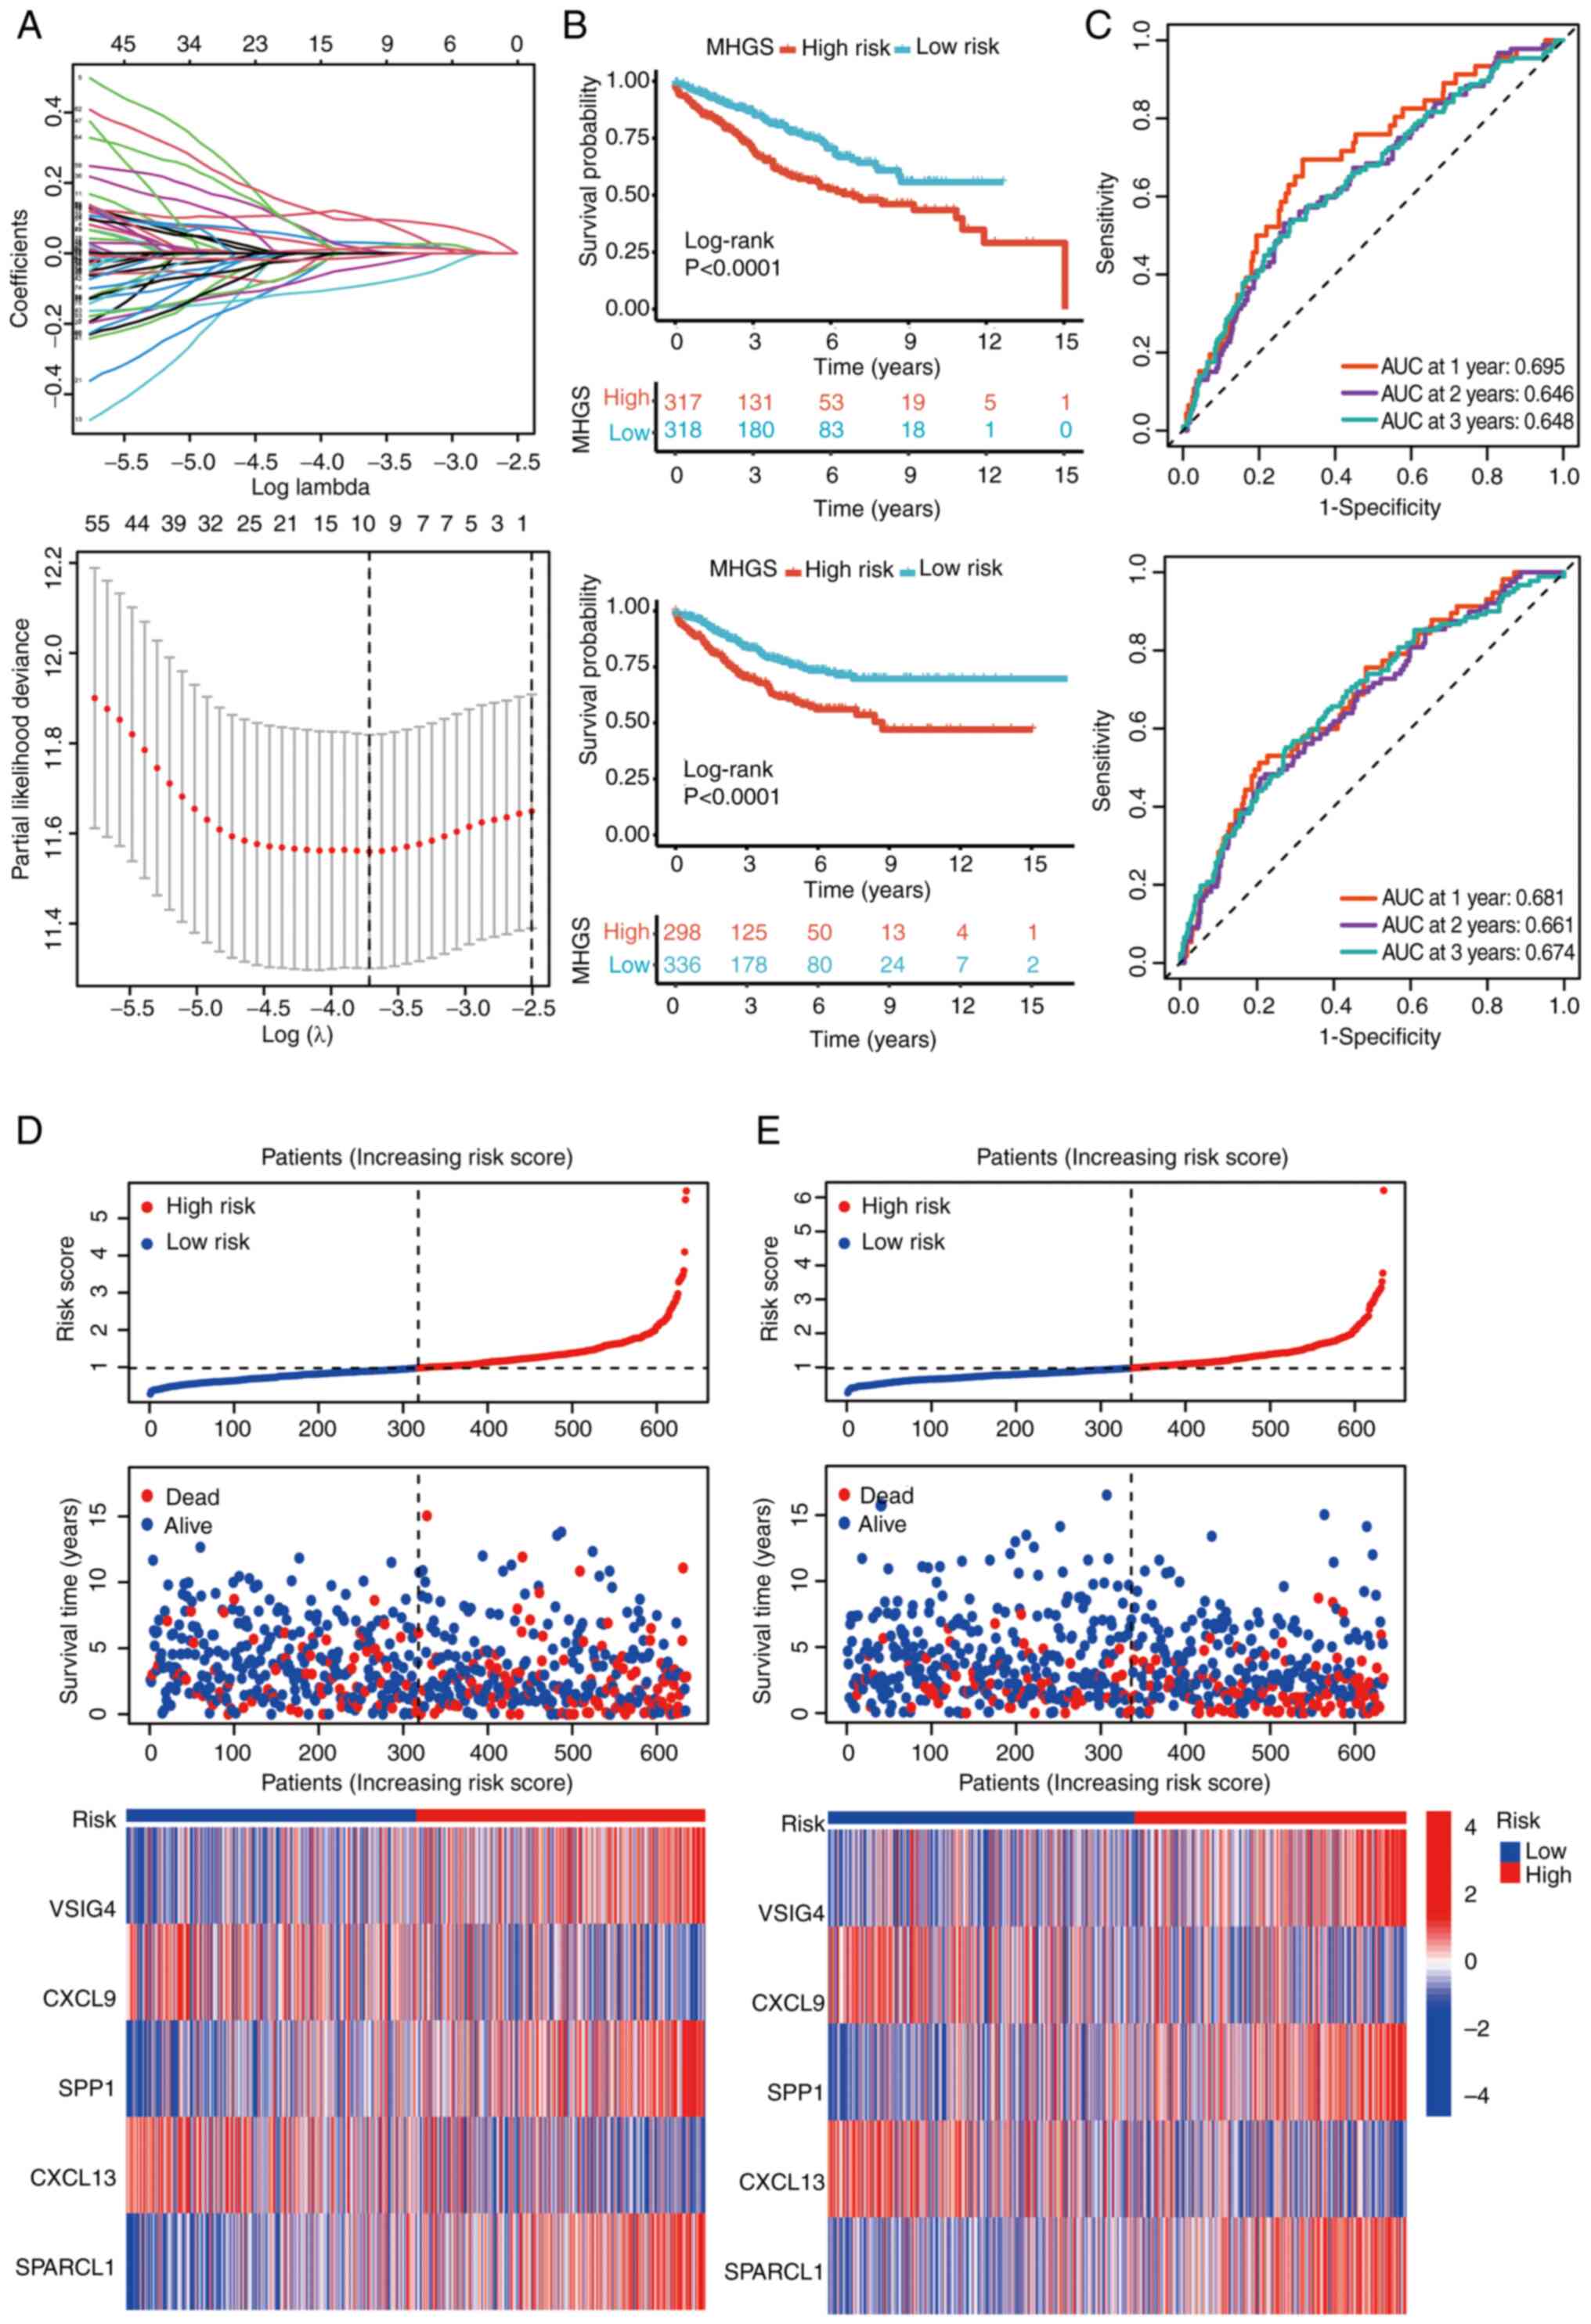
Using the ‘limma’ package, an analysis was conducted
to identify DEGs associated with CRC subtypes. Initially, 175 DEGs
underwent univariate Cox regression to pinpoint potential
prognostic markers within the CRC cohorts. To streamline the
findings, LASSO regression and Cox regression were used to select
independent prognostic markers (Fig.
4A). This comprehensive approach highlighted five genes, V-set
and immunoglobulin domain containing 4 (VSIG4), CXCL9, secreted
phosphoprotein 1 (SPP1), CXCL13 and SPARCL1, as significant
prognostic indicators. The risk model was constructed using the
coefficients of these genes, and the risk score was calculated
using the following formula: MHGS risk score=(expression level of
VSIG4 × 0.21) + (expression level of CXCL9 × −0.09) + (expression
level of SPP1 × 0.07) + (expression level of CXCL13 × −0.14) +
(expression level of SPARCL1 × 0.16).
Patients were stratified into high- and low-risk
groups based on their risk scores, using the median value as the
threshold. The survival analysis demonstrated that patients in the
high-risk group had significantly poorer OS compared with those in
the low-risk group (Fig. 4B).
Furthermore, the risk score exhibited robust
predictive performance for OS in both the training and testing
sets. In the training set, the area under the curve (AUC) for
predicting survival at 1, 2 and 3 years was 0.681, 0.661 and 0.674,
respectively (Fig. 4C). Similarly,
in the testing set, the AUC for predicting survival at 1, 3 and 5
years was 0.695, 0.646 and 0.648, respectively (Fig. 4C). Detailed survival outcomes for
individual patients in the training and testing sets were depicted
using risk plots, providing a comprehensive visualization of
patient-specific outcomes based on the risk score (Fig. 4D and E).
Mutation landscape and enrichment
analysis between high and low-risk MGHS groups
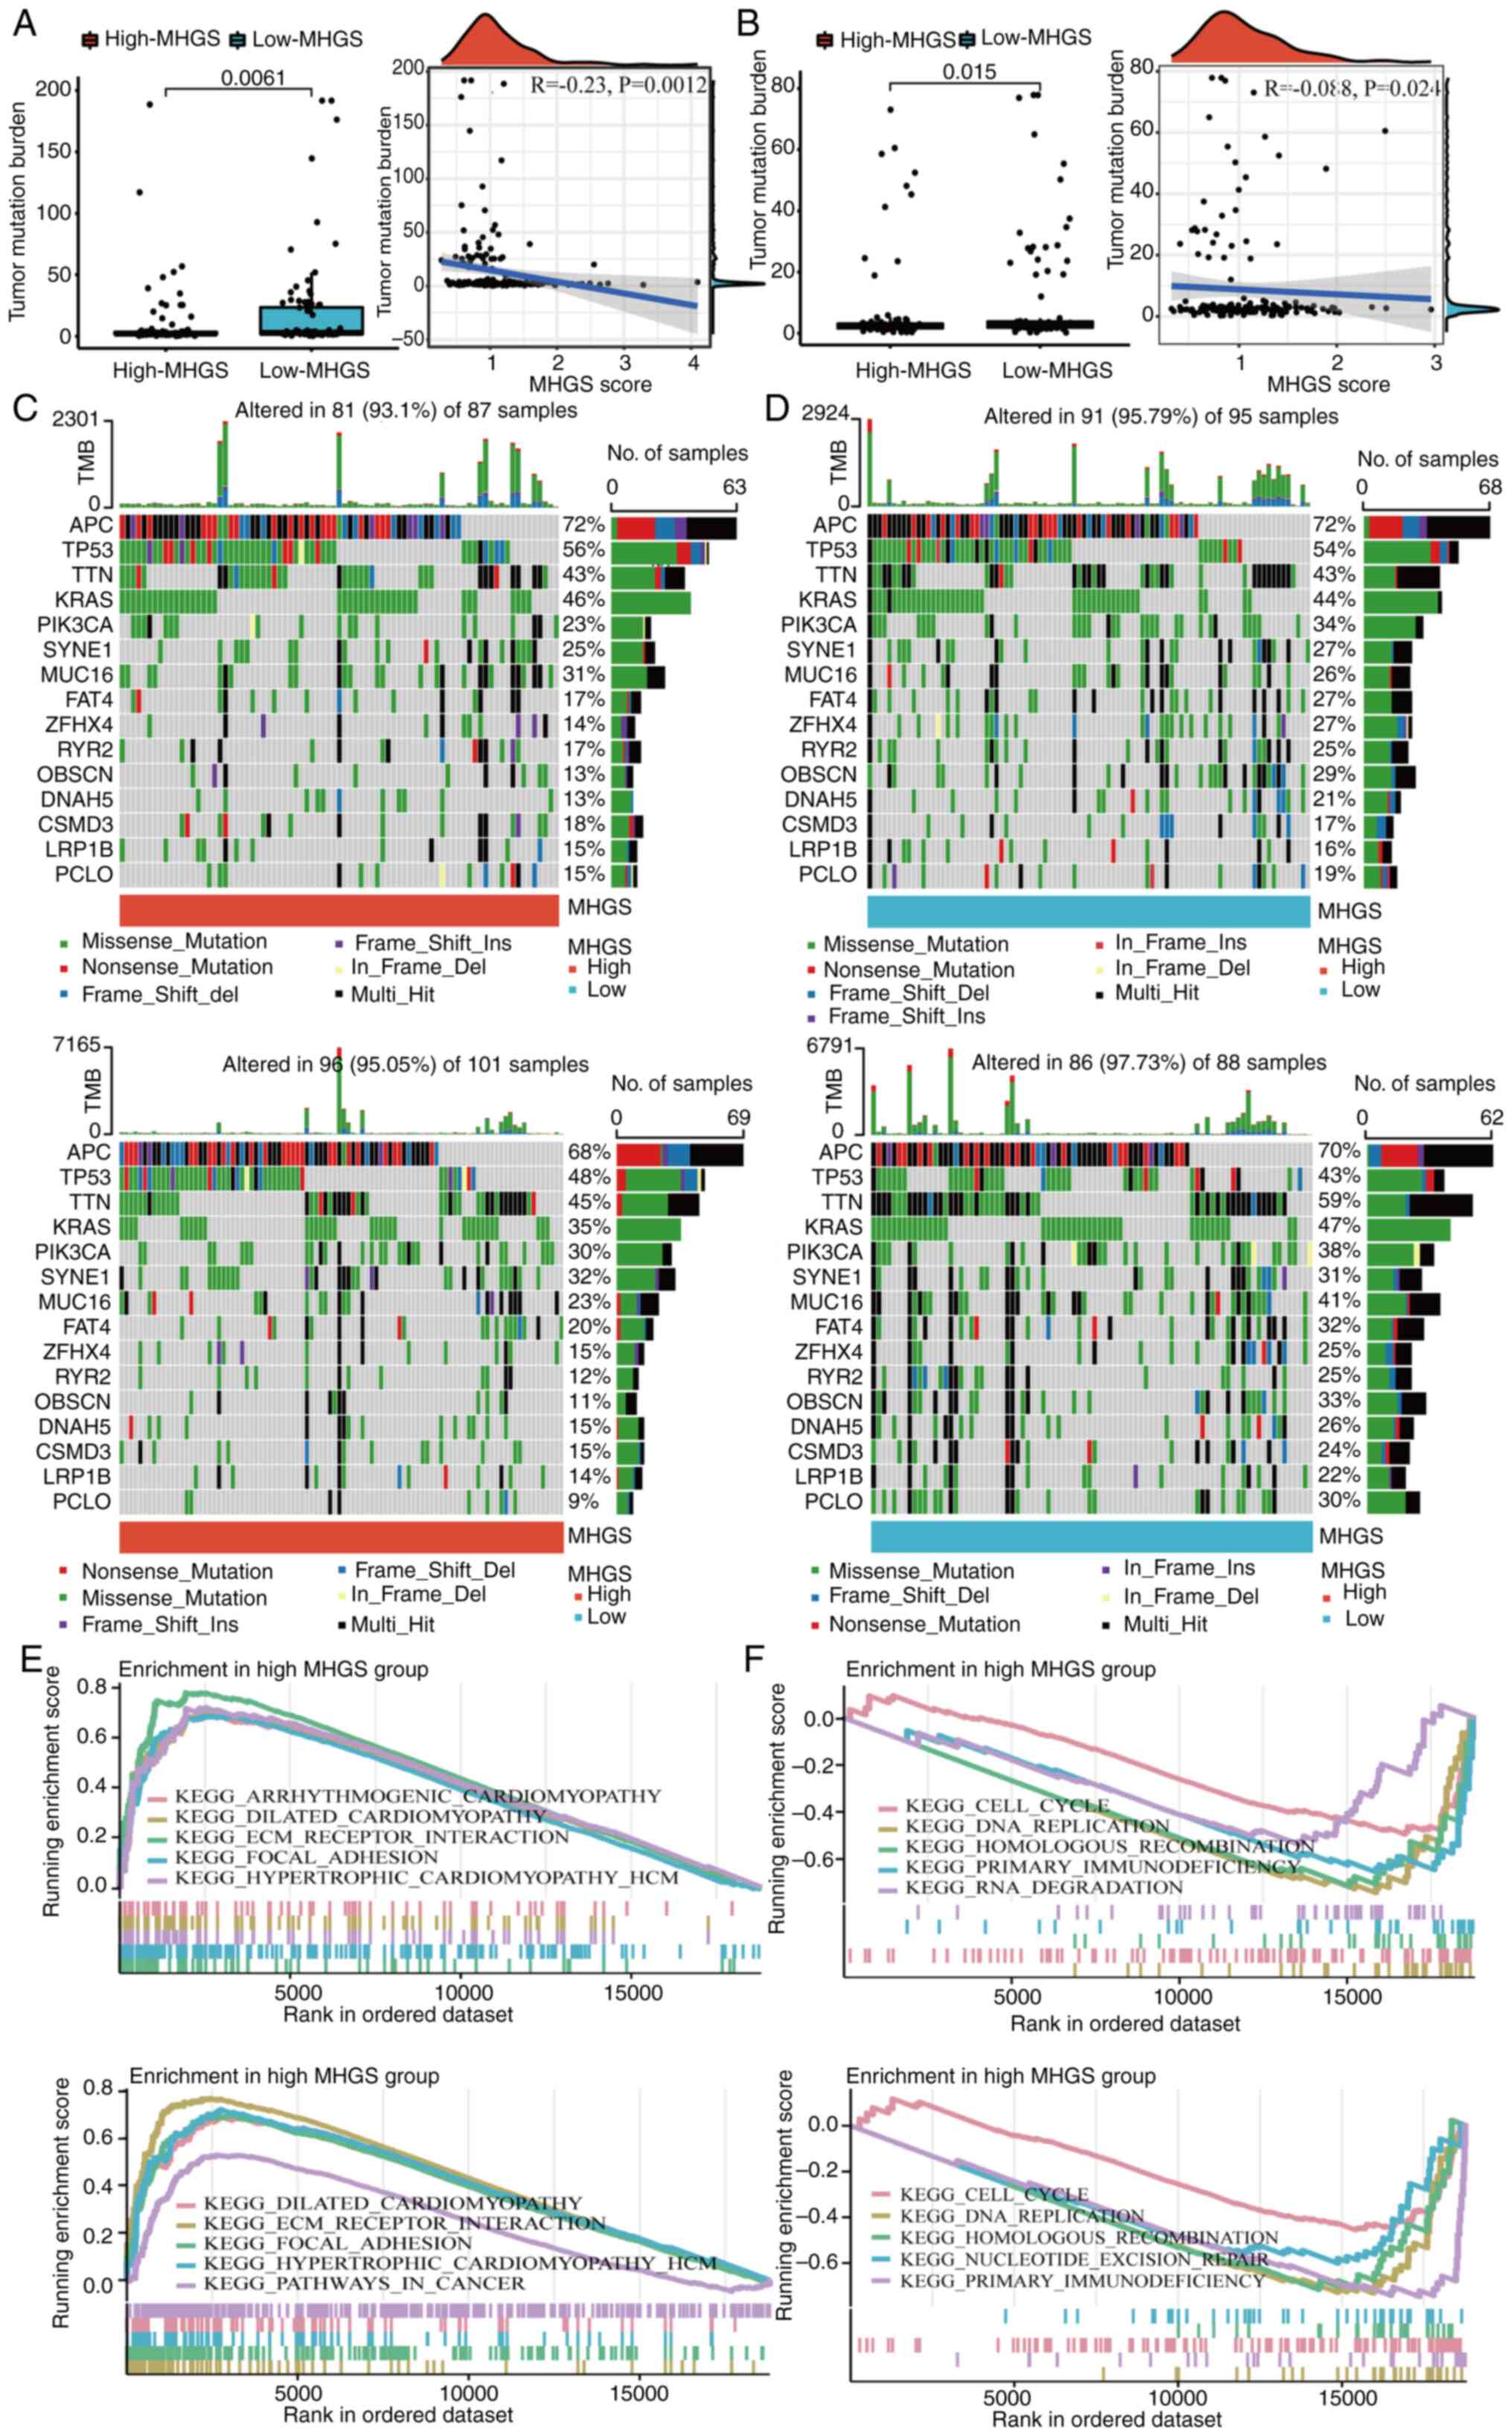
Numerous studies have demonstrated that cancers with
a high mutation burden may benefit from immunotherapy due to
increased neoantigen presence (8,44). In
the present analysis of mutation data from both training and
testing cohorts, it was observed that the low-risk group exhibited
a higher TMB compared with the high-risk group. Spearman
correlation analysis further indicated a negative correlation
between the MHGS score and TMB, suggesting that patients in the
low-risk group may experience more favorable outcomes with
immunotherapy (Fig. 5A and B).
To delve deeper into somatic mutation
characteristics, waterfall plots were generated comparing the two
MHGS score groups in both the training and testing cohorts.
Consistently, both cohorts revealed a higher frequency of mutations
among the top 15 ranked genes in the low-risk group compared with
the high-risk group (Fig. 5C and
D). Subsequently, GSEA was performed to identify pathways
significantly enriched between the two risk groups. Genes in the
high-risk group were notably enriched in pathways related to
extracellular matrix receptor interaction and focal adhesion
(Fig. 5E and F). Conversely, genes
in the low-risk group exhibited significant enrichment in pathways
associated with cell cycle regulation and DNA replication (Fig. 5E and F).
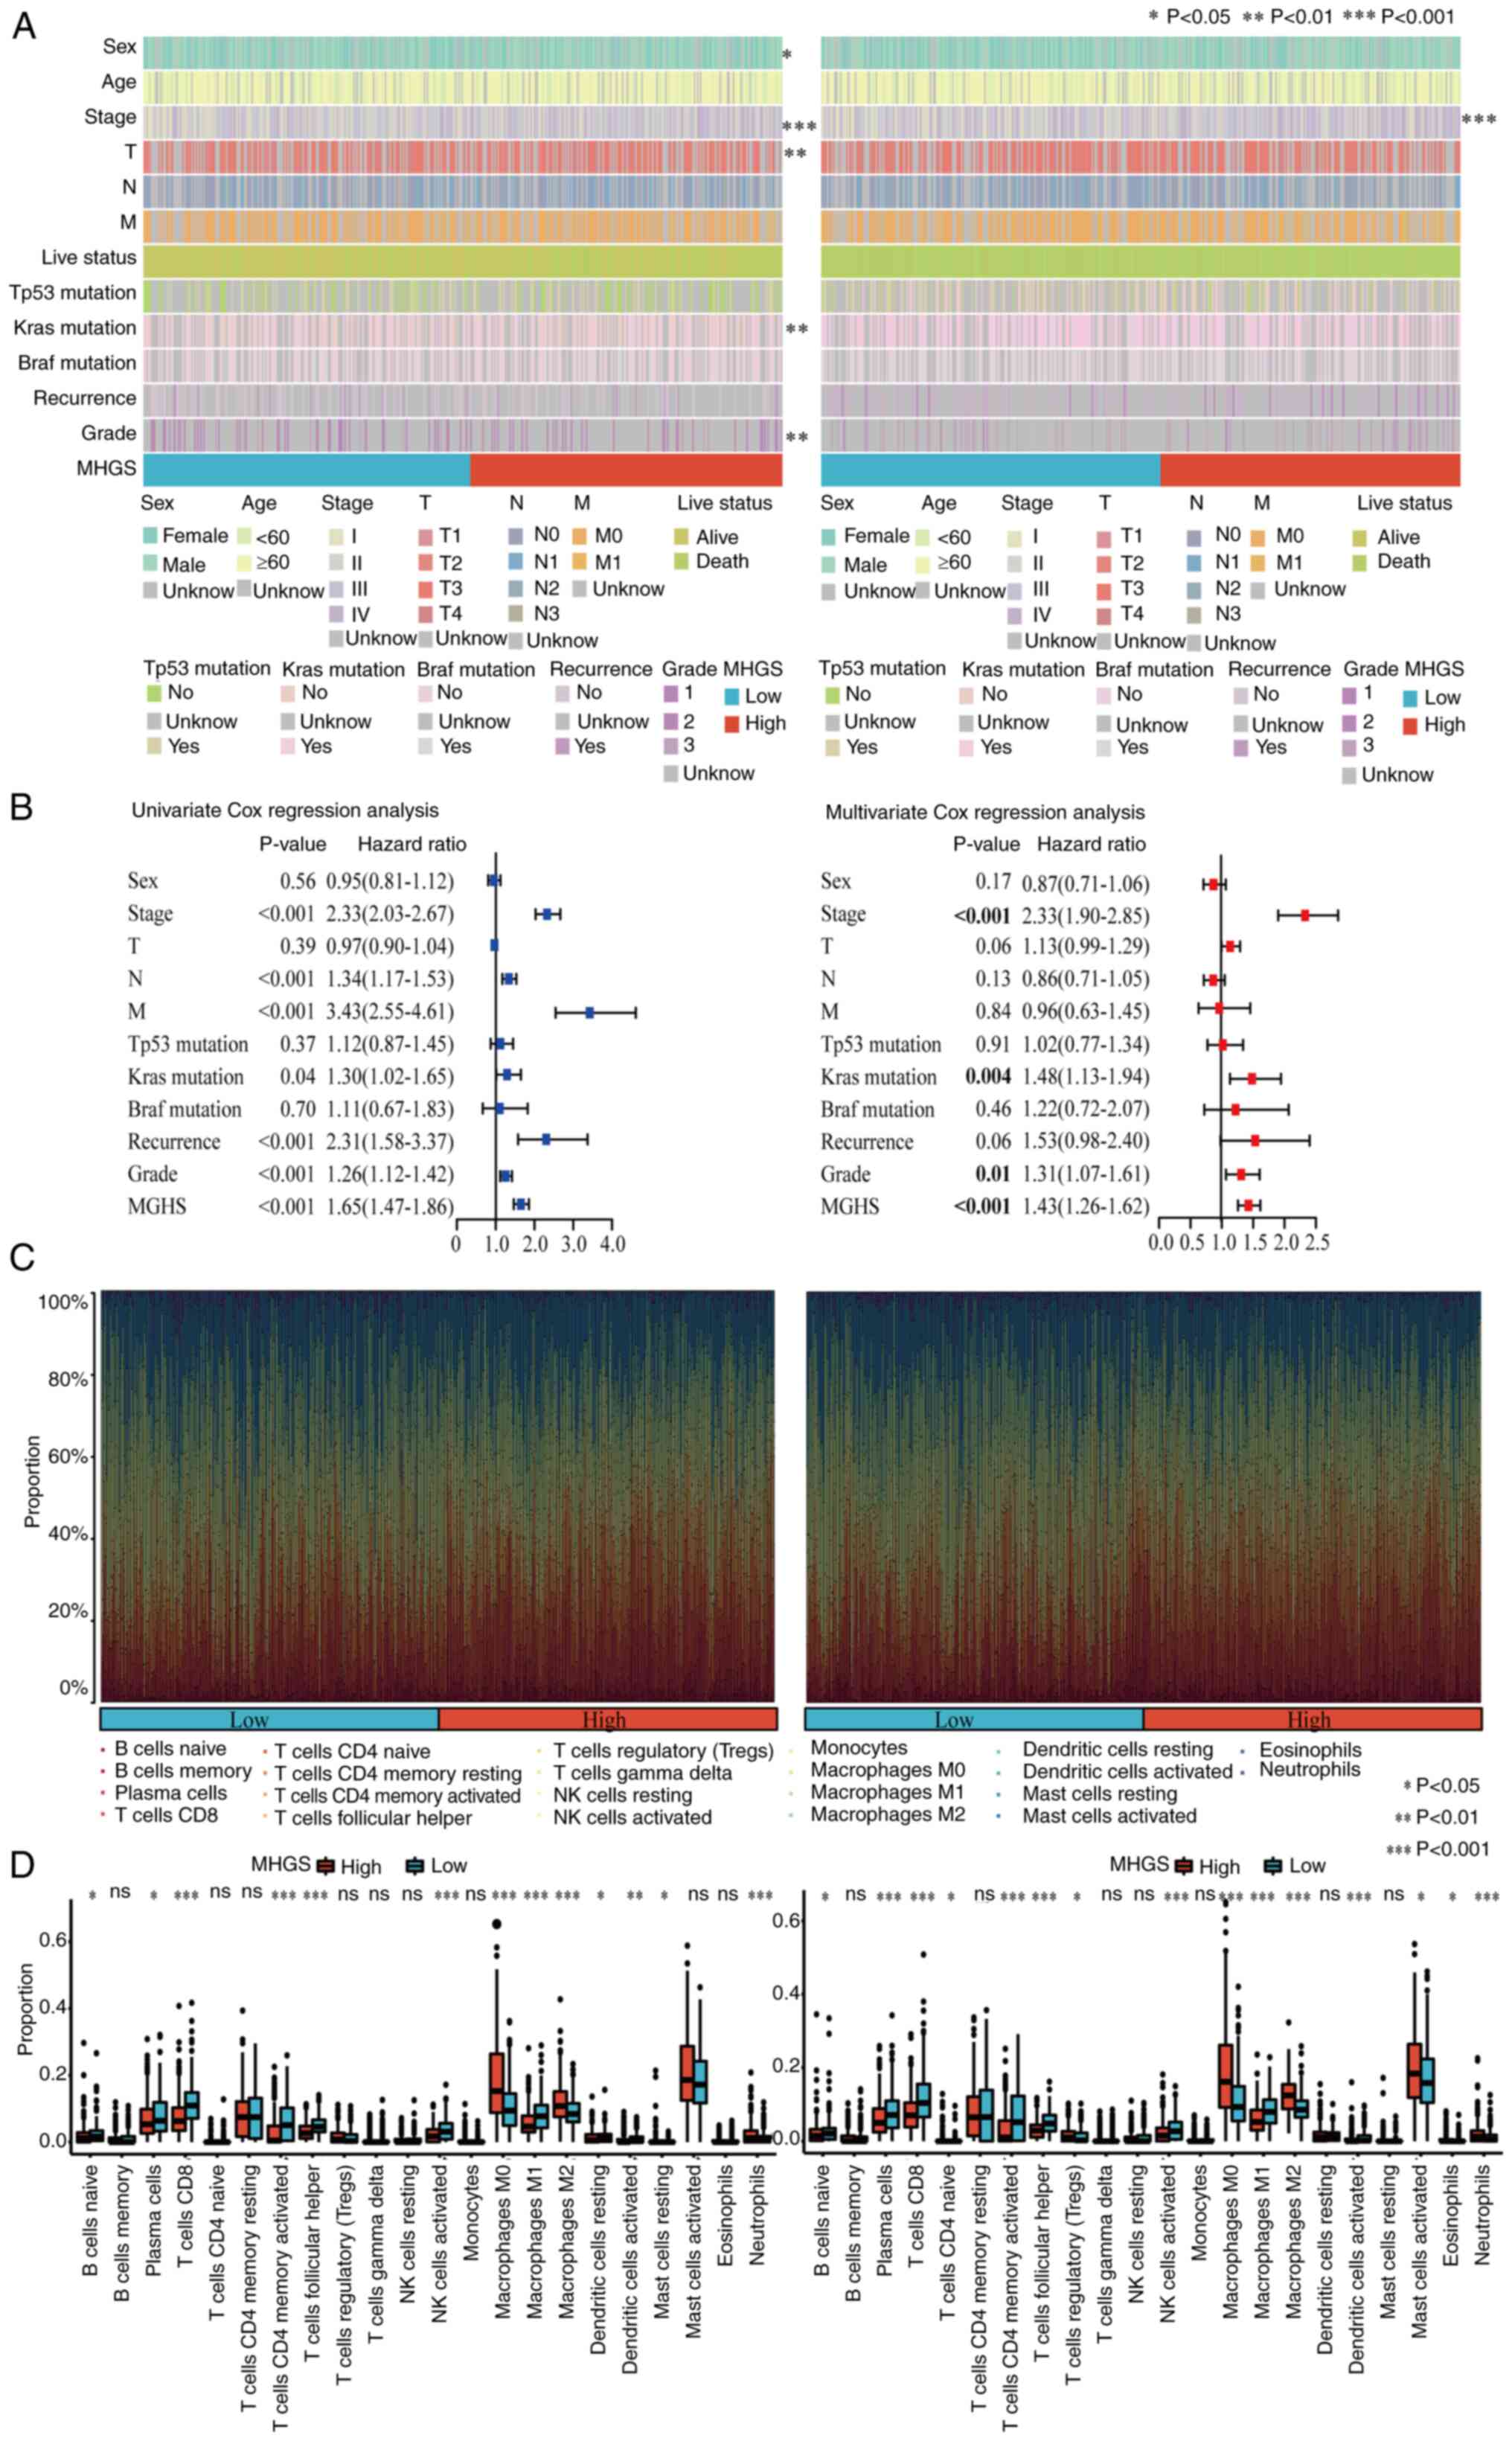
Association between MHGS score,
clinicopathological characteristics and immune cell profiling in
CRC
The association between the MHGS score and
clinicopathological characteristics was investigated. The MHGS
score showed significant associations with TNM stage, survival
status and disease occurrence (Fig.
6A). Both univariate and multivariate Cox analyses confirmed
the MHGS score as an independent prognostic factor for patients
with CRC (Figs. 6A, B and S7). Additionally, differences in the
proportions of 22 immune cell types between high and low-risk
groups were explored using the CIBERSORT algorithm. Fig. 6C illustrates the proportions of
tumor-infiltrating immune cells in these groups, while their
distributions are detailed in Fig.
6D through boxplots. Compared with the high-risk group, the
low-risk group exhibited significantly higher proportions of B
naïve cells, plasma cells, CD8+ T cells, activated memory CD4+ T
cells, T follicular helper cells, activated NK cells, macrophage M1
and dendritic cells. Notably, patients with CRC with low-risk
scores demonstrated higher infiltration of macrophage M1, whereas
the high-risk score group showed elevated levels of macrophage M2
(Fig. 6D).
Association between MHGS score, MSI
status, TME and immunotherapy response in CRC: The benefits of ICI
therapy in high and low-risk MGHS groups
Recent evidence indicates that patients with MSI-H
are more responsive to immunotherapy (45). Correlation analyses between MSI
status and MHGS revealed that patients with CRC with MSI-L or
microsatellite stable (MSS) status had higher risk scores compared
with those with MSI-H in both training and testing sets. This
highlights the ability of the prognostic model to distinguish
microsatellite status in CRC (Fig.
7A).
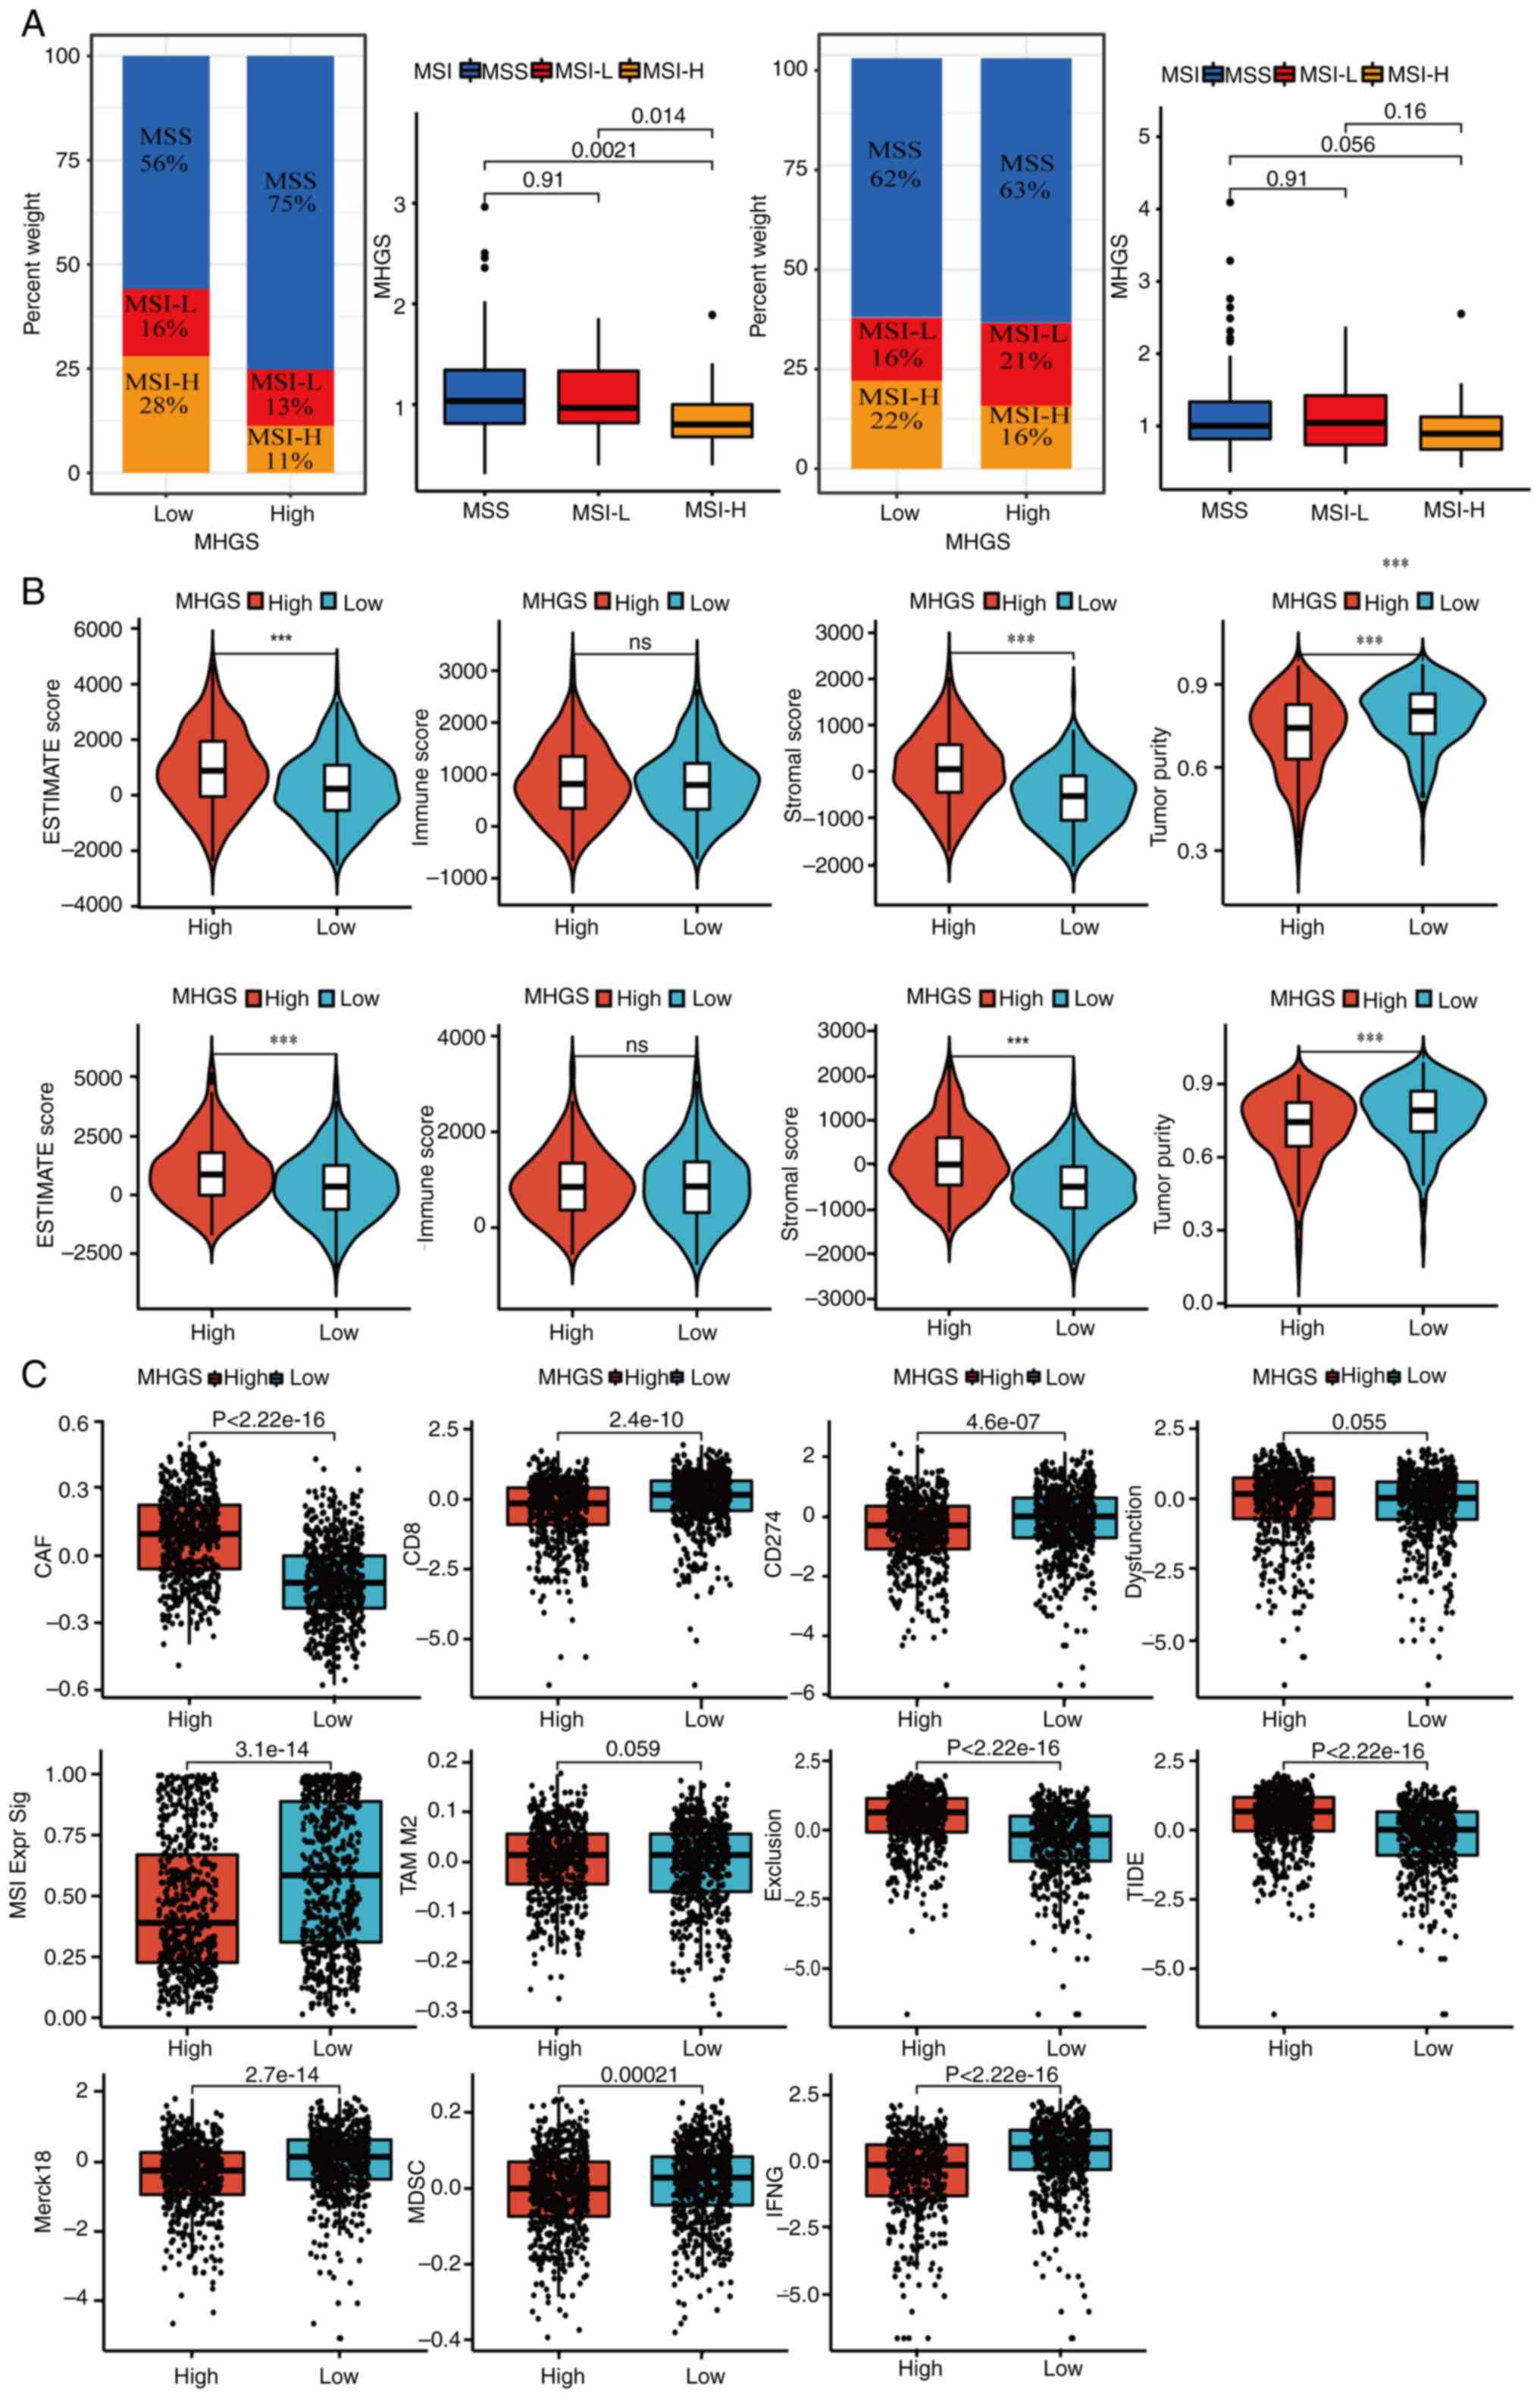 | Figure 7.Landscape of the TME in the MHGS
subgroups. (A) Association between MHGS score and MSI. (B)
Association between MHGS score and both immune and stromal cells.
(C) TIDE score for patients with CRC treated with immunotherapy in
different MHGS subgroups. ***P<0.001. MSI, microsatellites
instability; MSS, microsatellites stability; TIDE, Tumor Immune
Dysfunction and Exclusion; MHGS, Macrophages-Gene-Hub-Signature; L,
low; H, high; ESTIMATE, Estimation of STromal and Immune cells in
MAlignant Tumor tissues using Expression data; CAF, cancer
associated fibroblast; MSI Expr Sig, microsatellites instability
expression significance; MDSC, myeloid-derived suppressor cell;
IFNG, interferon γ; TAM, tumor-associated macrophage. |
A high MHGS score was closely associated with
elevated stromal scores and lower tumor purity, while no
significant difference in immune scores was observed between high
and low-risk groups (Fig. 7B).
Next, in the present analysis of MHGS score and tumor immune escape
in CRC immunotherapy, T-cell dysfunction and exclusion was focused
on. The high-risk group exhibited lower expression levels of
markers such as merck18, CD8 and IFNγ compared with the low-risk
group, indicating severe T-cell dysfunction associated with a high
MHGS score (Fig. 7C). Additionally,
the high-risk group showed a stronger association with the
cancer-associated fibroblast signature and significantly lower
levels of cytotoxic T lymphocytes (CTLs). Combining these findings
with dysfunction, exclusion and TIDE scores (Fig. 7C), it became evident that patients
with high MHGS scores often had poor immune therapy responses due
to T-cell dysfunction and exclusion.
To assess the association between MHGS and immune
checkpoint blockade (ICB) response, the IPS was used as a
predictive scoring system from TCIA database. Patients with CRC in
the low-risk group showed more significant benefits from PD-L1
or/and CTLA-4 immunotherapy compared with those in the high-risk
group (Fig. 8A). Validation in the
urothelial carcinoma immunotherapeutic cohort (IMvigor210)
(40) consistently showed that the
high-risk group had a less effective response to immunotherapy
compared with the low-risk group (Fig.
8B). Survival analysis further demonstrated that patients in
the high-risk group had inferior survival outcomes after receiving
ICIs compared with those in the low-risk group (Fig. 8C).
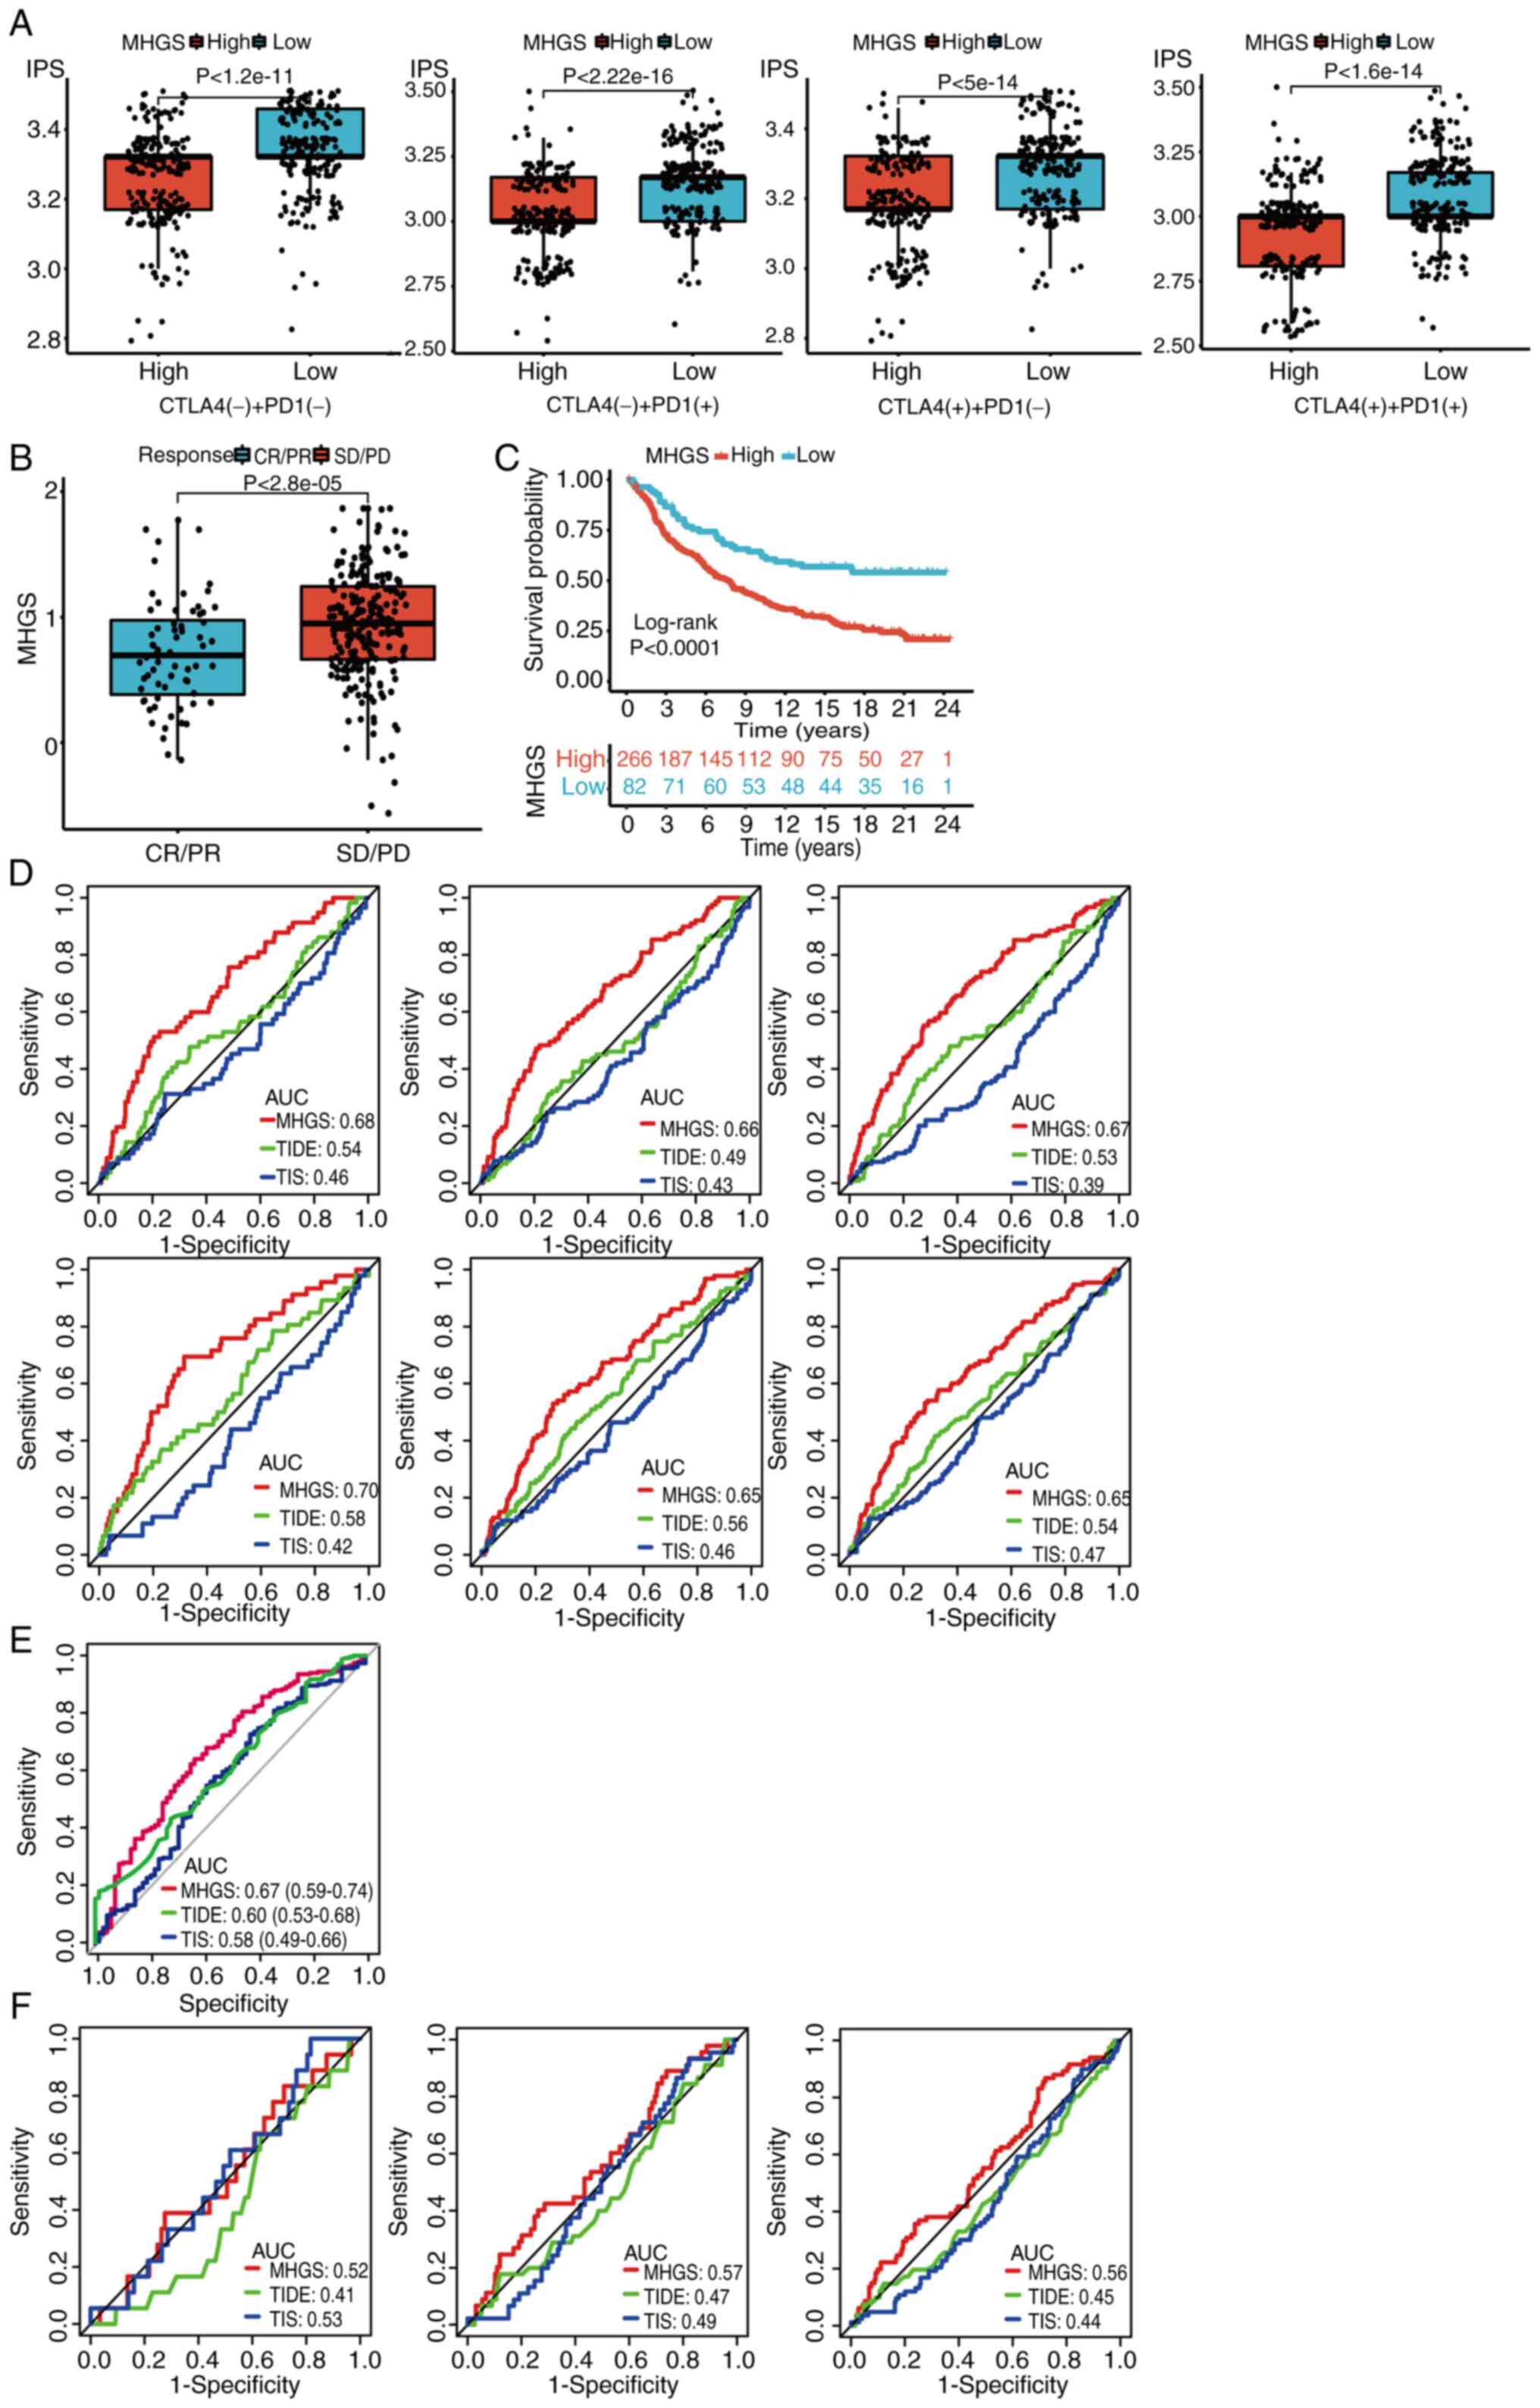 | Figure 8.Association between MHGS and the
response to immune checkpoint blockade, as well as the prognostic
accuracy of the MHGS score in both training and testing sets. (A)
IPS comparison of four treatments, including no treatment, PD1,
CTLA4 and PD1 + CTLA4, in the high-risk and low-risk groups. (B)
Distribution of MHGS in different clinical responses (CR/PR, SD/PD)
in the IMvigor210 dataset. (C) Overall survival analysis of MHGS in
the IMvigor210 dataset. (D) ROC of MHGS, TIDE and TIS for
predicting the 1-, 2- and 3-year follow-up in training and testing
cohorts in TCGA and GEO datasets. (E) The prognostic accuracy of
MHGS, TIDE and TIS for predicting immunotherapeutic efficacy after
ICI treatments (IMvigor210). (F) The prognostic accuracy of MHGS,
TIDE and TIS for predicting overall survival time of patients with
cancer after ICI treatments at 1-, 2- and 3-year follow-up
(IMvigor210). IPS, immune cell proportion score; CR, complete
response; PR, partial response; SD, stable disease; PD, progressive
disease; ROC, receiver operating characteristic. TIS, T cell
inflamed signature; TIDE, tumor immune dysfunction and exclusion;
MHGS, Macrophages-Gene-Hub-Signature; TCGA, The Cancer Genome
Atlas; GEO, Gene Expression Omnibus; ICI, immune checkpoint
inhibitor; AUC, area under the curve; CTLA4, cytotoxic T-lymphocyte
associated protein 4. |
The prognostic accuracy of TIDE and TIS scores was
compared with the MHGS score in training and testing sets. The MHGS
score exhibited superior prognostic value for patients with CRC
(Fig. 8D). Additionally,
immunotherapeutic efficacy (Fig.
8E) and OS time (Fig. 8F) was
analyzed using these scores for cancer patients treated with ICIs.
In both sets, the MHGS score demonstrated improved prognostic
accuracy for predicting immunotherapeutic efficacy and OS. However,
caution is warranted when using the MHGS score as an immunotherapy
indicator, given its AUC value below 70%. Further validation in
larger immunotherapy cohorts is essential.
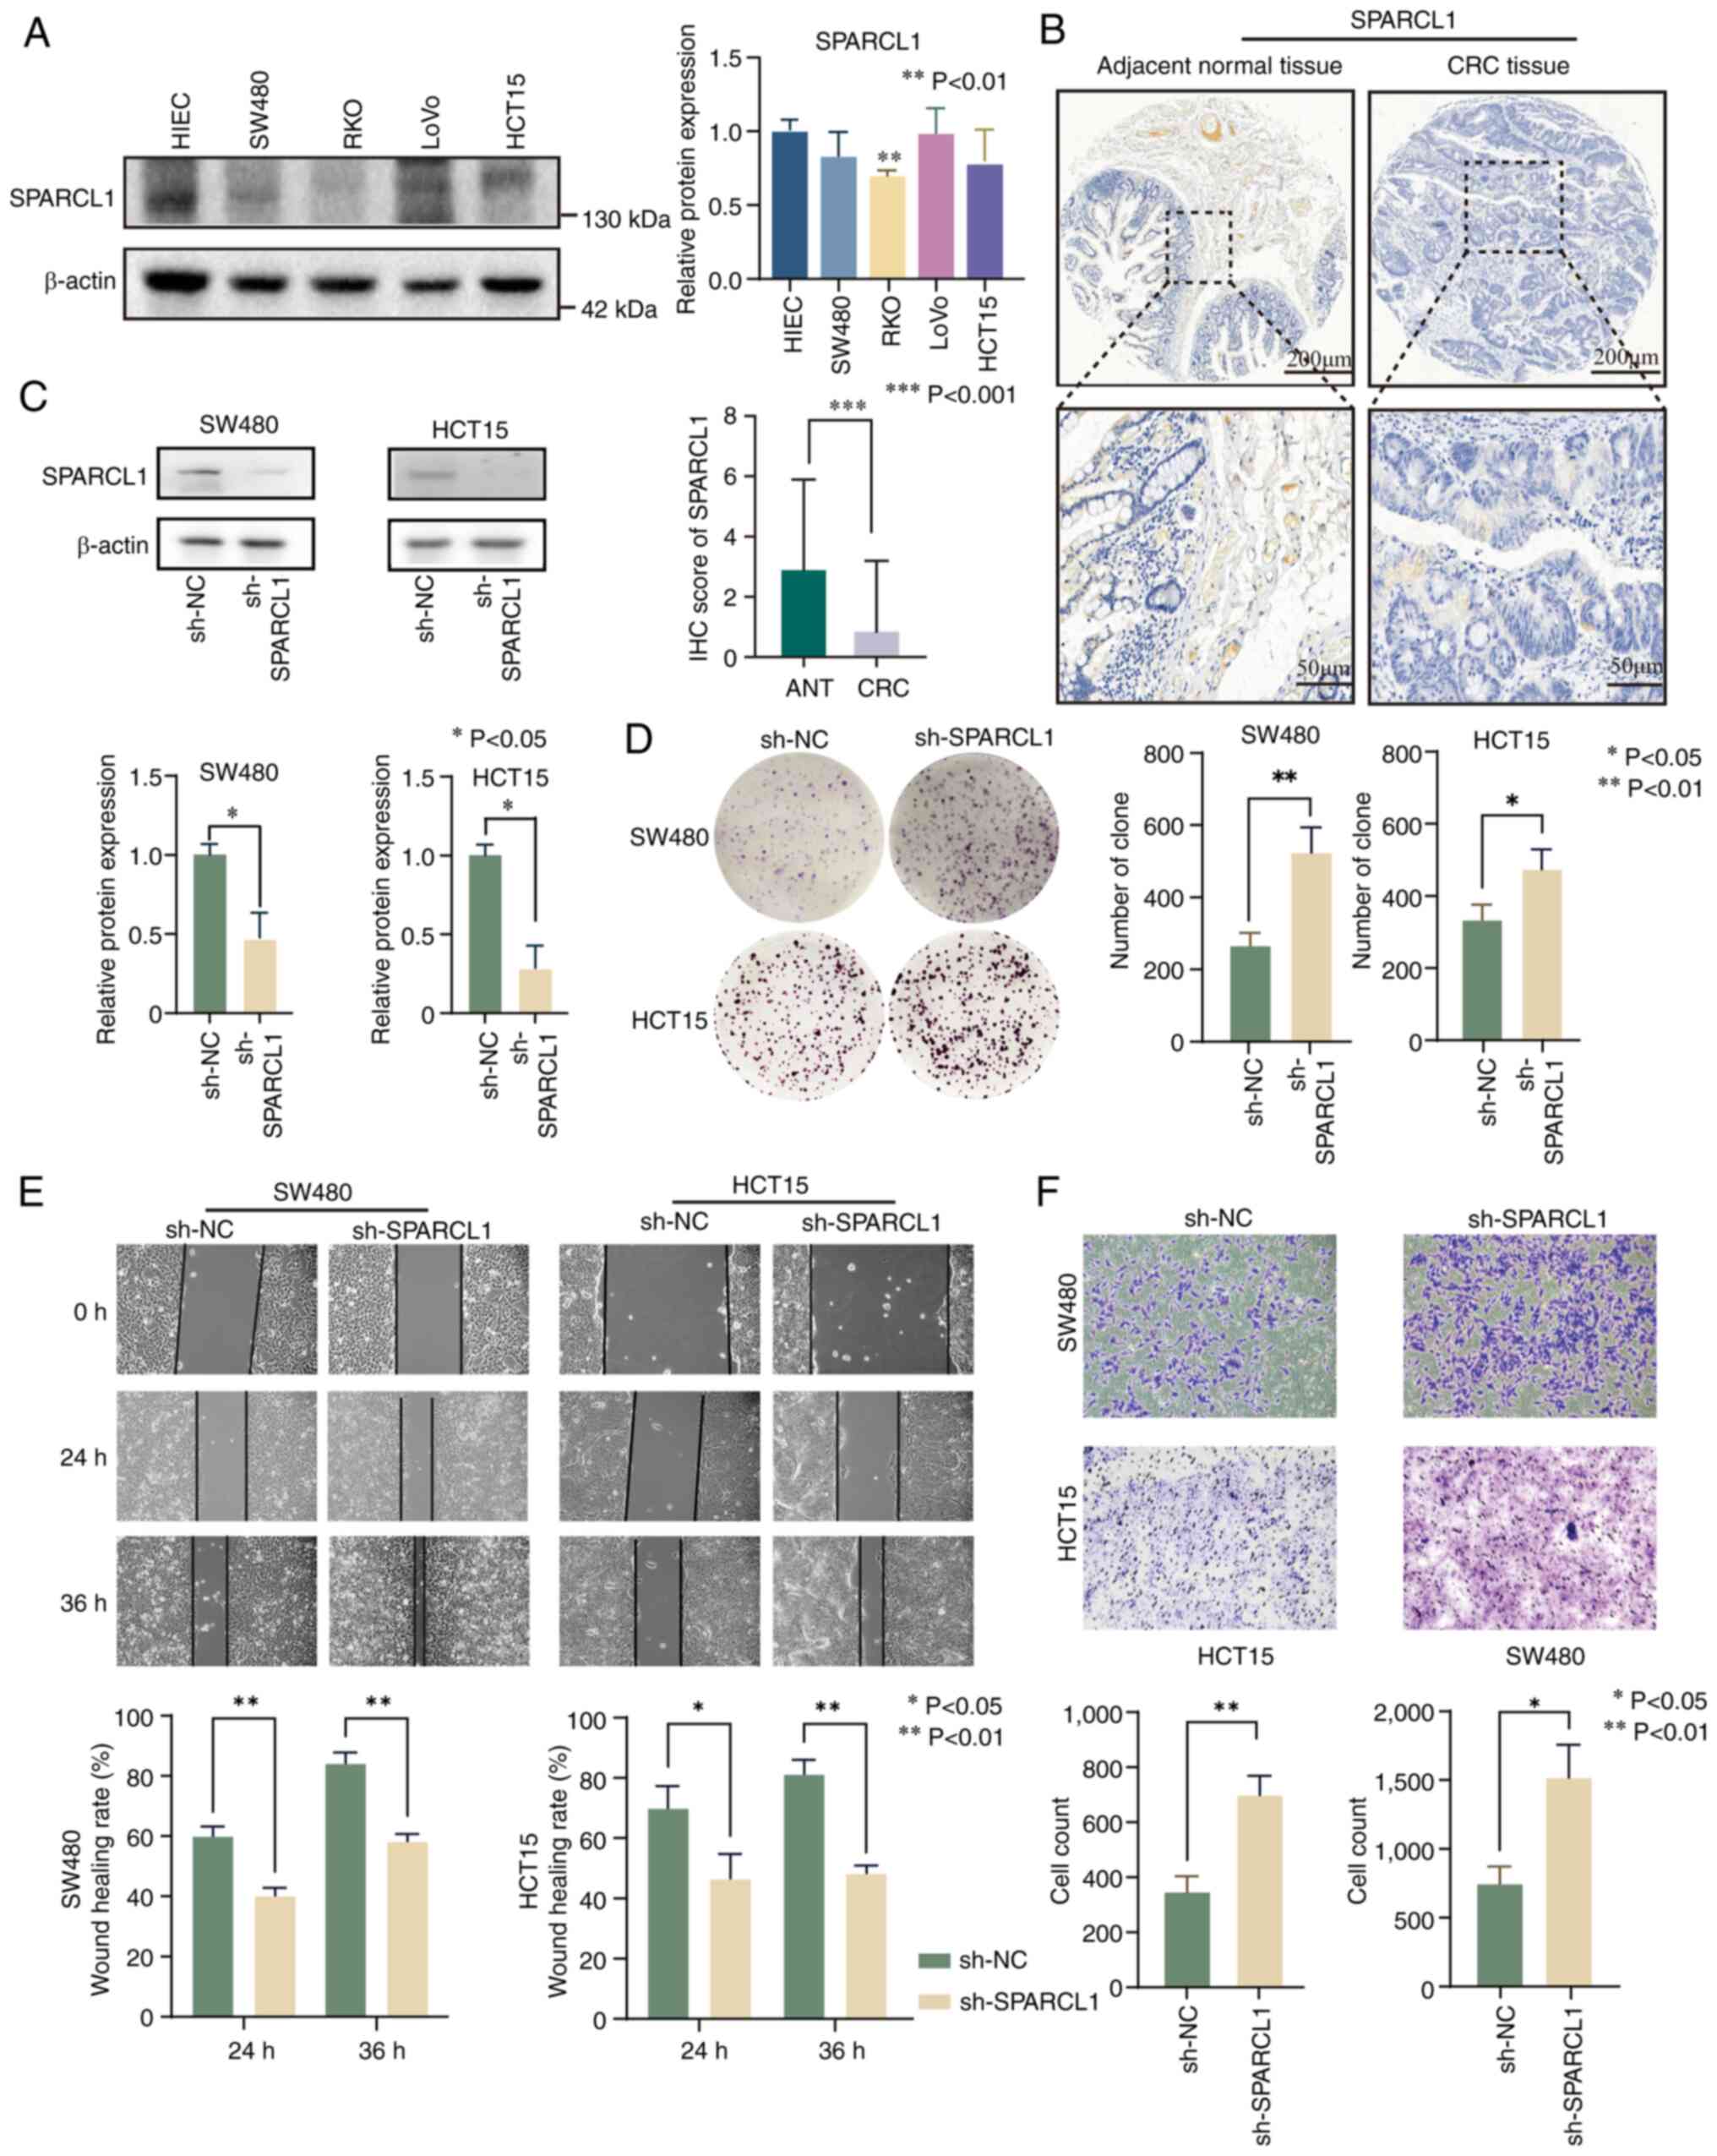
IHC validation of risk score model
genes
Numerous studies have extensively investigated the
association between CXCL9 (46),
SPP1 (47) and CXCL13 (48) with CRC. However, the research
concerning the association between VSIG4 and SPARCL1 in relation to
CRC is relatively limited. Hence, SPARCL1 was selected for detailed
investigation as a target gene in the present study. The clinical
analysis revealed that SPARCL1 expression was lower in RKO, SW480
and HCT15 cell lines compared with HIEC cells. By contrast, LoVo
cells exhibited high expression levels of SPARCL1 compared with
HIEC cells (Fig. 9A and Fig. S8A). To validate these findings, IHC
was performed on a tissue microarray. The results demonstrated a
significant downregulation of SPARCL1 in CRC tissues compared with
adjacent normal tissues (Fig. 9B
and Fig. S8B). To elucidate the
functional role of SPARCL1, stable knockdown experiments in SW480
and HCT15 cells were conducted (Fig.
9C). Subsequently, the impact of SPARCL1 was assessed on cell
proliferation using a colony formation assay, revealing a
substantial increase in proliferation upon SPARCL1 knockdown in
SW480 and HCT15 cells (Fig. 9D).
Furthermore, both wound healing and Transwell assays showed a
significant enhancement in migration and invasion of CRC cells upon
SPARCL1 silencing (Fig. 9E and
F).
Discussion
In the present study, a prognostic model for CRC was
developed by integrating single-cell RNA-seq and RNA-seq data.
Initially, scRNA-seq analysis was conducted to identify distinct
cell subpopulations, focusing particularly on myeloid cell
clusters. Using t-SNE dimensional reduction, myeloid cells were
categorized into six principal subclusters and specific markers
highly expressed in macrophages were identified. Subsequently,
WGCNA was employed to explore the association between gene modules
and these six clusters. This analysis identified macrophage-related
module genes and delineated macrophage-related subtypes (C1 and C2)
using NMF. In terms of TME infiltrating characteristics, subtype C1
exhibited a higher proportion of most immune cells but a lower
content of macrophages compared with subtype C2. However, using the
ESTIMATE algorithm, it was found that patients with the subtype C1
had lower immune and stromal scores but higher tumor purity
compared with patients with the C2 subtype. Survival analysis
indicated a superior survival advantage for patients with the C1
subtype, potentially linked to their higher somatic mutation burden
due to elevated tumor purity (49).
Following this, a prognostic model was conducted using DEGs between
subtype C1 and C2.
The model identified five genes significantly
correlated with CRC prognosis. In the high-risk group, VSIG4, SPP1
and SPARCL1 showed upregulated expression, whereas CXCL9 and CXCL13
were downregulated compared with the low-risk group. VSIG4, located
on the X chromosome, has immunosuppressive functions in
macrophages, including complement system inhibition and T cell
suppression, suggesting its potential as a diagnostic and
prognostic biomarker in cancer contexts (50–55).
SPP1, a member of the SIBLING family, promotes tumorigenesis by
activating MMPs and is associated with macrophage M2 polarization
and poor prognosis (56–60). SPARCL1, belonging to the SPARC
family, is implicated in tumor metastasis regulation and prognosis
(61–63). In the present study, the findings of
reduced SPARCL1 protein expression in CRC, supported by western
blotting and IHC, associated with increased metastasis risk in
functional assays. CXCL9 (64) and
CXCL13 (65), members of the
chemokine ligand family, play critical roles in antitumor immunity
and TME regulation. CXCL9, derived from CD68+ macrophages, confers
a survival advantage, whereas CXCL13, associated with M2
macrophages, may promote tumor metastasis (66–68).
The observed discrepancies between transcriptome and protein levels
highlight potential complexities in tumor biology. Despite these
challenges, the present model demonstrated moderate accuracy in
predicting CRC survival outcomes.
The present study comprehensively analyzed the gene
mutation landscape and immune function in both high and low-risk
groups of patients with CRC. A total of two distinct cohorts were
examined to identify the top 15 mutation genes specific to each
risk group, a number of which are well-known driver genes in cancer
research (69). Notably, the
low-risk group showed a higher frequency of mutations in these
genes compared with the high-risk group. The association between
the MGHS risk score, MSI, immune cell infiltration patterns and
PD-L1 expression was evaluated relevant to immunotherapy. Patients
in the high-risk group predominantly exhibited MSS/MSI-L status,
characterized by lower CD8+ CTL infiltration and decreased PD-L1
expression levels. By contrast, patients with MSI-H status showed a
favorable response to immunotherapy, with reduced risks of
recurrence compared with those with MSI-L status (70,71).
Recent studies have categorized a specific TME immune type (TMIT I)
characterized by abundant infiltration of CD8+ CTLs and high PD-L1
expression, indicating adaptive immune resistance to tumor cells
and favorable outcomes with PD-L1/PD-1 immunotherapy (72,73).
Conversely, TMIT II type is marked by low infiltration of CD8+ CTLs
and minimal PD-L1 expression, suggesting immune indifference
towards tumor cells (74).
Furthermore, the risk score model was integrated with the TIDE and
IPS scoring systems to predict immunotherapy response. TIDE, a
computational method based on tumor immune escape characteristics,
highlighted differences in gene signatures associated with tumor
immune evasion between the risk groups. Although immunosuppressive
cell infiltration varied in the high-risk group, T cell exclusion
scores remained higher compared with the low-risk group. Notably,
the high-risk group exhibited a higher content of TAMM2, which was
not observed in the TIDE scoring system. IPS, a superior predictive
scoring system for ICB response, indicated that low-risk patients
had higher scores and improved responses to immunotherapy, making
them more suitable for ICIs treatment.
To validate the predictive ability of the model,
MGHS with TIDE and TIS were compared in the urothelial carcinoma
immunotherapy cohort. The results demonstrated that MGHS-based
immunotherapy predictions were significantly associated with
improved prognosis and OS time compared with TIDE and TIS
predictions. It is essential to note that while TIDE, IPS and TIS
primarily focus on T cell function and status, providing only a
partial reflection of the response of the TME to immunotherapy,
MGHS consistently demonstrated moderate predictive ability for
survival time and immunotherapy prognosis in patients with CRC.
Moreover, MGHS comprises only five genes, making it easier to
detect compared with TIDE and TIS.
To conclude, in the present study, scRNA-seq,
RNA-seq and microarray data were integrated to develop and validate
a macrophage-related prognostic model for CRC. A total of two
distinct subtypes, C1 and C2, were identified within the CRC
population and a prognostic model based on genes differentially
expressed in these subtypes was established. The analysis of
prognosis and immune characteristics across various risk groups
revealed that higher risk scores is associated with poorer survival
outcomes, lower tumor mutational burden, MSI-L status, decreased
tumor purity and higher TIDE score. The present prognostic model
shows promise as a potential biomarker for risk stratification and
predicting treatment response in patients with CRC. Future
well-designed prospective studies are essential to validate and
further explore the clinical implications of the present
findings.
Supplementary Material
Supporting Data
Acknowledgements
Not applicable.
Funding
This work was supported by The National Natural Science
Foundation of China (grant no. 82204877), Xi'an municipal Health
Commission research project (grant no. 2020qn07), The Intramural
Fund of North Sichuan Medical College (grant no. CBY21-QD31) and
Nanchong City Talent Development Fund (grant no. CBY23-NCR06).
Availability of data and materials
The data generated in the present study may be
requested from the corresponding author.
Authors' contributions
YF, QT, CL and KP were involved in the
conceptualization, formal analysis, data collection, visualization,
and writing the first draft of manuscript; KP, JYG, TH, JW and ZC
performed the data validation, statistical analysis, data
interpretation and figure editing; and KP, CL and YF supervised the
study and modified the final manuscript. All authors read and
approved the final version of the manuscript. CL and KP confirm the
authenticity of all the raw data.
Ethics approval and consent to
participate
The collection of human tissues was approved by The
Medical Ethics Committee of the Second Affiliated Hospital of Xi'an
Jiaotong University (Xi'an, China; approval no. 2023R063). All
methods were carried out in accordance with relevant guidelines and
regulations. Written informed consent was obtained from all
individuals or individuals' guardians. The study was performed
under the principles of the Declaration of Helsinki.
Patient consent for publication
Not applicable.
Competing interests
The authors declare that they have no competing
interests.
Glossary
Abbreviations
Abbreviations:
|
TAMs
|
tumor-associated macrophages
|
|
CRC
|
colorectal cancer
|
|
ScRNA-seq
|
single-cell RNA sequencing
|
|
GEO
|
Gene Expression Omnibus
|
|
WGCNA
|
weighted gene correlation network
analysis
|
|
NMF
|
non-negative matrix factorization
|
|
TCGA
|
The Cancer Genome Atlas
|
|
TMB
|
tumor mutation burden
|
|
MSI
|
microsatellite instability
|
|
ICIs
|
immune checkpoint inhibitors
|
|
dMMR
|
deficient mismatch repair protein
|
|
MSI-H
|
high microsatellite instability
|
|
pMMR
|
proficient mismatch repair
|
|
MSS
|
microsatellite stability
|
|
TME
|
tumor microenvironment
|
|
TOM
|
topological overlap matrix
|
|
DEGs
|
differential expression genes
|
|
TMA
|
tissue microarray
|
|
IHC
|
Immunohistochemistry
|
|
TIDE
|
Tumor Immune Dysfunction and
Exclusion
|
|
IPS
|
immunophenoscore
|
|
TCIA
|
The Cancer Immunome Atlas
|
|
TIS
|
tumor inflammation signature
|
|
GSEA
|
gene set enrichment analysis
|
|
MGHS
|
macrophages gene hub signature
|
|
ICB
|
immune checkpoint blockade
|
|
TMIT
|
tumor microenvironment immune
type
|
References
|
1
|
Siegel RL, Miller KD, Fuchs HE and Jemal
A: Cancer statistics, 2022. CA Cancer J Clin. 72:7–33. 2022.
View Article : Google Scholar : PubMed/NCBI
|
|
2
|
Ladabaum U, Dominitz JA, Kahi C and Schoen
RE: Strategies for colorectal cancer screening. Gastroenterology.
158:418–432. 2020. View Article : Google Scholar : PubMed/NCBI
|
|
3
|
Han L, Dai W, Mo S, Xiang W, Li Q, Xu Y,
Cai G and Wang R: Nomogram of conditional survival probability of
long-term survival for metastatic colorectal cancer: A real-world
data retrospective cohort study from SEER database. Int J Surg.
92:1060132021. View Article : Google Scholar : PubMed/NCBI
|
|
4
|
Kahi CJ, Boland CR, Dominitz JA,
Giardiello FM, Johnson DA, Kaltenbach T, Lieberman D, Levin TR,
Robertson DJ and Rex DK: Colonoscopy surveillance after colorectal
cancer resection: Recommendations of the US multi-society task
force on colorectal cancer. Am J Gastroenterol. 111:337–346; quiz
347. 2016. View Article : Google Scholar : PubMed/NCBI
|
|
5
|
Biller LH and Schrag D: Diagnosis and
treatment of metastatic colorectal cancer: A review. JAMA.
325:669–685. 2021. View Article : Google Scholar : PubMed/NCBI
|
|
6
|
Siegel RL, Miller KD, Sauer AG, Fedewa SA,
Butterly LF, Anderson JC, Cercek A, Smith RA and Jemal A:
Colorectal cancer statistics, 2020. CA Cancer J Clin. 70:145–164.
2020. View Article : Google Scholar : PubMed/NCBI
|
|
7
|
Osseis M, Nehmeh WA, Rassy N, Derienne J,
Noun R, Salloum C, Rassy E, Boussios S and Azoulay D: Surgery for
T4 colorectal cancer in older patients: Determinants of outcomes. J
Pers Med. 12:15342022. View Article : Google Scholar : PubMed/NCBI
|
|
8
|
Chan TA, Yarchoan M, Jaffee E, Swanton C,
Quezada SA, Stenzinger A and Peters S: Development of tumor
mutation burden as an immunotherapy biomarker: Utility for the
oncology clinic. Ann Oncol. 30:44–56. 2019. View Article : Google Scholar : PubMed/NCBI
|
|
9
|
Samstein RM, Lee CH, Shoushtari AN,
Hellmann MD, Shen R, Janjigian YY, Barron DA, Zehir A, Jordan EJ,
Omuro A, et al: Tumor mutational load predicts survival after
immunotherapy across multiple cancer types. Nat Genet. 51:202–206.
2019. View Article : Google Scholar : PubMed/NCBI
|
|
10
|
Riley RS, June CH, Langer R and Mitchell
MJ: Delivery technologies for cancer immunotherapy. Nat Rev Drug
Discov. 18:175–196. 2019. View Article : Google Scholar : PubMed/NCBI
|
|
11
|
Overman MJ, Lonardi S, Wong KYM, Lenz HJ,
Gelsomino F, Aglietta M, Morse MA, Van Cutsem E, McDermott R, Hill
A, et al: Durable clinical benefit with nivolumab plus ipilimumab
in DNA mismatch repair-deficient/microsatellite instability-high
metastatic colorectal cancer. J Clin Oncol. 36:773–779. 2018.
View Article : Google Scholar : PubMed/NCBI
|
|
12
|
Overman MJ, McDermott R, Leach JL, Lonardi
S, Lenz HJ, Morse MA, Desai J, Hill A, Axelson M, Moss RA, et al:
Nivolumab in patients with metastatic DNA mismatch repair-deficient
or microsatellite instability-high colorectal cancer (CheckMate
142): An open-label, multicentre, phase 2 study. Lancet Oncol.
18:1182–1191. 2017. View Article : Google Scholar : PubMed/NCBI
|
|
13
|
Ganesh K, Stadler ZK, Cercek A, Mendelsohn
RB, Shia J, Segal NH and Diaz LA Jr: Immunotherapy in colorectal
cancer: Rationale, challenges and potential. Nat Rev Gastroenterol
Hepatol. 16:361–375. 2019. View Article : Google Scholar : PubMed/NCBI
|
|
14
|
Adeleke S, Haslam A, Choy A, Diaz-Cano S,
Galante JR, Mikropoulos C and Boussios S: Microsatellite
instability testing in colorectal patients with Lynch syndrome:
Lessons learned from a case report and how to avoid such pitfalls.
Per Med. 19:277–286. 2022. View Article : Google Scholar : PubMed/NCBI
|
|
15
|
Krenkel O and Tacke F: Liver macrophages
in tissue homeostasis and disease. Nat Rev Immunol. 17:306–321.
2017. View Article : Google Scholar : PubMed/NCBI
|
|
16
|
Ruffell B and Coussens LM: Macrophages and
therapeutic resistance in cancer. Cancer Cell. 27:462–472. 2015.
View Article : Google Scholar : PubMed/NCBI
|
|
17
|
Mantovani A, Bottazzi B, Colotta F,
Sozzani S and Ruco L: The origin and function of tumor-associated
macrophages. Immunol Today. 13:265–270. 1992. View Article : Google Scholar : PubMed/NCBI
|
|
18
|
Ginhoux F, Schultze JL, Murray PJ, Ochando
J and Biswas SK: New insights into the multidimensional concept of
macrophage ontogeny, activation and function. Nat Immunol.
17:34–40. 2016. View Article : Google Scholar : PubMed/NCBI
|
|
19
|
Mantovani A, Marchesi F, Malesci A, Laghi
L and Allavena P: Tumour-associated macrophages as treatment
targets in oncology. Nat Rev Clin Oncol. 14:399–416. 2017.
View Article : Google Scholar : PubMed/NCBI
|
|
20
|
Pan Y, Yu Y, Wang X and Zhang T:
Tumor-associated macrophages in tumor immunity. Front Immunol.
11:5830842020. View Article : Google Scholar : PubMed/NCBI
|
|
21
|
An Y and Yang Q: Tumor-associated
macrophage-targeted therapeutics in ovarian cancer. Int J Cancer.
149:21–30. 2021. View Article : Google Scholar : PubMed/NCBI
|
|
22
|
Jung KY, Cho SW, Kim YA, Kim D, Oh BC,
Park DJ and Park YJ: Cancers with higher density of
tumor-associated macrophages were associated with poor survival
rates. J Pathol Transl Med. 49:318–324. 2015. View Article : Google Scholar : PubMed/NCBI
|
|
23
|
Yeung OW, Lo CM, Ling CC, Qi X, Geng W, Li
CX, Ng KT, Forbes SJ, Guan XY, Poon RTP, et al: Alternatively
activated (M2) macrophages promote tumour growth and invasiveness
in hepatocellular carcinoma. J Hepatol. 62:607–616. 2015.
View Article : Google Scholar : PubMed/NCBI
|
|
24
|
Zhou SL, Zhou ZJ, Hu ZQ, Huang XW, Wang Z,
Chen EB, Fan J, Cao Y, Dai Z and Zhou J: Tumor-associated
neutrophils recruit macrophages and T-regulatory cells to promote
progression of hepatocellular carcinoma and resistance to
sorafenib. Gastroenterology. 150:1646–1658.e1617. 2016. View Article : Google Scholar : PubMed/NCBI
|
|
25
|
Gubin MM, Esaulova E, Ward JP, Malkova ON,
Runci D, Wong P, Noguchi T, Arthur CD, Meng W, Alspach E, et al:
High-dimensional analysis delineates myeloid and lymphoid
compartment remodeling during successful immune-checkpoint cancer
therapy. Cell. 175:1014–1030.e1019. 2018. View Article : Google Scholar : PubMed/NCBI
|
|
26
|
Molgora M, Esaulova E, Vermi W, Hou J,
Chen Y, Luo J, Brioschi S, Bugatti M, Omodei AS, Ricci B, et al:
TREM2 modulation remodels the tumor myeloid landscape enhancing
Anti-PD-1 immunotherapy. Cell. 182:886–900.e817. 2020. View Article : Google Scholar : PubMed/NCBI
|
|
27
|
Xiong H, Mittman S, Rodriguez R,
Moskalenko M, Pacheco-Sanchez P, Yang Y, Nickles D and Cubas R:
Anti-PD-L1 treatment results in functional remodeling of the
macrophage compartment. Cancer Res. 79:1493–1506. 2019. View Article : Google Scholar : PubMed/NCBI
|
|
28
|
Boussios S, Ozturk MA, Moschetta M,
Karathanasi A, Zakynthinakis-Kyriakou N, Katsanos KH, Christodoulou
DK and Pavlidis N: The developing story of predictive biomarkers in
colorectal cancer. J Pers Med. 9:122019. View Article : Google Scholar : PubMed/NCBI
|
|
29
|
Chen H, Ye F and Guo G: Revolutionizing
immunology with single-cell RNA sequencing. Cell Mol Immunol.
16:242–249. 2019. View Article : Google Scholar : PubMed/NCBI
|
|
30
|
Liang L, Yu J, Li J, Li N, Liu J, Xiu L,
Zeng J, Wang T and Wu L: Integration of scRNA-Seq and bulk RNA-Seq
to analyse the heterogeneity of ovarian cancer immune cells and
establish a molecular risk model. Front Oncol. 11:7110202021.
View Article : Google Scholar : PubMed/NCBI
|
|
31
|
Bao X, Shi R, Zhao T, Wang Y, Anastasov N,
Rosemann M and Fang W: Integrated analysis of single-cell RNA-seq
and bulk RNA-seq unravels tumour heterogeneity plus M2-like
tumour-associated macrophage infiltration and aggressiveness in
TNBC. Cancer Immunol Immunother. 70:189–202. 2021. View Article : Google Scholar : PubMed/NCBI
|
|
32
|
Chen Z, Yu M, Yan J, Guo L, Zhang B, Liu
S, Lei J, Zhang W, Zhou B, Gao J, et al: PNOC expressed by B cells
in cholangiocarcinoma was survival related and LAIR2 could be a T
cell exhaustion biomarker in tumor microenvironment:
Characterization of immune microenvironment combining single-cell
and bulk sequencing technology. Front Immunol. 12:6472092021.
View Article : Google Scholar : PubMed/NCBI
|
|
33
|
Li X, Liao Z, Deng Z, Chen N and Zhao L:
Combining bulk and single-cell RNA-sequencing data to reveal gene
expression pattern of chondrocytes in the osteoarthritic knee.
Bioengineered. 12:997–1007. 2021. View Article : Google Scholar : PubMed/NCBI
|
|
34
|
Shi L, Mao H and Ma J: Integrated analysis
of tumor-associated macrophages and M2 macrophages in CRC:
Unraveling molecular heterogeneity and developing a novel risk
signature. BMC Med Genomics. 17:1452024. View Article : Google Scholar : PubMed/NCBI
|
|
35
|
Khaliq AM, Erdogan C, Kurt Z, Turgut SS,
Grunvald MW, Rand T, Khare S, Borgia JA, Hayden DM, Pappas SG, et
al: Refining colorectal cancer classification and clinical
stratification through a single-cell atlas. Genome Biol.
23:1132022. View Article : Google Scholar : PubMed/NCBI
|
|
36
|
Langfelder P and Horvath S: WGCNA: An R
package for weighted correlation network analysis. BMC
Bioinformatics. 9:5592008. View Article : Google Scholar : PubMed/NCBI
|
|
37
|
Brunet JP, Tamayo P, Golub TR and Mesirov
JP: Metagenes and molecular pattern discovery using matrix
factorization. Proc Natl Acad Sci USA. 101:4164–4169. 2004.
View Article : Google Scholar : PubMed/NCBI
|
|
38
|
Newman AM, Liu CL, Green MR, Gentles AJ,
Feng W, Xu Y, Hoang CD, Diehn M and Alizadeh AA: Robust enumeration
of cell subsets from tissue expression profiles. Nat Methods.
12:453–457. 2015. View Article : Google Scholar : PubMed/NCBI
|
|
39
|
Charoentong P, Finotello F, Angelova M,
Mayer C, Efremova M, Rieder D, Hackl H and Trajanoski Z: Pan-cancer
immunogenomic analyses reveal genotype-immunophenotype
relationships and predictors of response to checkpoint blockade.
Cell Rep. 18:248–262. 2017. View Article : Google Scholar : PubMed/NCBI
|
|
40
|
Mariathasan S, Turley SJ, Nickles D,
Castiglioni A, Yuen K, Wang Y, Kadel EE III, Koeppen H, Astarita
JL, Cubas R, et al: TGFβ attenuates tumour response to PD-L1
blockade by contributing to exclusion of T cells. Nature.
554:544–548. 2018. View Article : Google Scholar : PubMed/NCBI
|
|
41
|
Ayers M, Lunceford J, Nebozhyn M, Murphy
E, Loboda A, Kaufman DR, Albright A, Cheng JD, Kang SP, Shankaran
V, et al: IFN-γ-related mRNA profile predicts clinical response to
PD-1 blockade. J Clin Invest. 127:2930–2940. 2017. View Article : Google Scholar : PubMed/NCBI
|
|
42
|
Jiang L, Liu JY, Shi Y, Tang B, He T, Liu
JJ, Fan JY, Wu B, Xu XH, Zhao YL, et al: MTMR2 promotes invasion
and metastasis of gastric cancer via inactivating IFNγ/STAT1
signaling. J Exp Clin Cancer Res. 38:2062019. View Article : Google Scholar : PubMed/NCBI
|
|
43
|
Reiner A, Spona J, Reiner G, Schemper M,
Kolb R, Kwasny W, Függer R, Jakesz R and Holzner JH: Estrogen
receptor analysis on biopsies and fine-needle aspirates from human
breast carcinoma. Correlation of biochemical and
immunohistochemical methods using monoclonal antireceptor
antibodies. Am J Pathol. 125:443–449. 1986.PubMed/NCBI
|
|
44
|
Snyder A, Makarov V, Merghoub T, Yuan J,
Zaretsky JM, Desrichard A, Walsh LA, Postow MA, Wong P, Ho TS, et
al: Genetic basis for clinical response to CTLA-4 blockade in
melanoma. N Engl J Med. 371:2189–2199. 2014. View Article : Google Scholar : PubMed/NCBI
|
|
45
|
Zhou KI, Hanks BA and Strickler JH:
Management of microsatellite instability high (MSI-H)
gastroesophageal adenocarcinoma. J Gastrointest Cancer. 55:483–496.
2024. View Article : Google Scholar : PubMed/NCBI
|
|
46
|
Wu Z, Huang X, Han X, Li Z, Zhu Q, Yan J,
Yu S, Jin Z, Wang Z, Zheng Q and Wang Y: The chemokine CXCL9
expression is associated with better prognosis for colorectal
carcinoma patients. Biomed Pharmacother. 78:8–13. 2016. View Article : Google Scholar : PubMed/NCBI
|
|
47
|
Sathe A, Mason K, Grimes SM, Zhou Z, Lau
BT, Bai X, Su A, Tan X, Lee H, Suarez CJ, et al: Colorectal cancer
metastases in the liver establish immunosuppressive spatial
networking between tumor-associated SPP1+ macrophages and
fibroblasts. Clin Cancer Res. 29:244–260. 2023. View Article : Google Scholar : PubMed/NCBI
|
|
48
|
Cabrero-de Las Heras S, Hernández-Yagüe X,
González A, Losa F, Soler G, Bugés C, Baraibar I, Esteve A,
Pardo-Cea MÁ, Ree AH, et al: Changes in serum CXCL13 levels are
associated with outcomes of colorectal cancer patients undergoing
first-line oxaliplatin-based treatment. Biomed Pharmacother.
176:1168572024. View Article : Google Scholar : PubMed/NCBI
|
|
49
|
Ding L, Getz G, Wheeler DA, Mardis ER,
McLellan MD, Cibulskis K, Sougnez C, Greulich H, Muzny DM, Morgan
MB, et al: Somatic mutations affect key pathways in lung
adenocarcinoma. Nature. 455:1069–1075. 2008. View Article : Google Scholar : PubMed/NCBI
|
|
50
|
Langnaese K, Colleaux L, Kloos DU, Fontes
M and Wieacker P: Cloning of Z39Ig, a novel gene with
immunoglobulin-like domains located on human chromosome X. Biochim
Biophys Acta. 1492:522–525. 2000. View Article : Google Scholar : PubMed/NCBI
|
|
51
|
Small AG, Al-Baghdadi M, Quach A, Hii C
and Ferrante A: Complement receptor immunoglobulin: A control point
in infection and immunity, inflammation and cancer. Swiss Med Wkly.
146:w143012016.PubMed/NCBI
|
|
52
|
Helmy KY, Katschke KJ Jr, Gorgani NN,
Kljavin NM, Elliott JM, Diehl L, Scales SJ, Ghilardi N and van
Lookeren Campagne M: CRIg: A macrophage complement receptor
required for phagocytosis of circulating pathogens. Cell.
124:915–927. 2006. View Article : Google Scholar : PubMed/NCBI
|
|
53
|
Chow A, Schad S, Green MD, Hellmann MD,
Allaj V, Ceglia N, Zago G, Shah NS, Sharma SK, Mattar M, et al:
Tim-4+ cavity-resident macrophages impair anti-tumor
CD8+ T cell immunity. Cancer Cell. 39:973–988.e979.
2021. View Article : Google Scholar : PubMed/NCBI
|
|
54
|
Li J, Diao B, Guo S, Huang X, Yang C, Feng
Z, Yan W, Ning Q, Zheng L, Chen Y and Wu Y: VSIG4 inhibits
proinflammatory macrophage activation by reprogramming
mitochondrial pyruvate metabolism. Nat Commun. 8:13222017.
View Article : Google Scholar : PubMed/NCBI
|
|
55
|
Vogt L, Schmitz N, Kurrer MO, Bauer M,
Hinton HI, Behnke S, Gatto D, Sebbel P, Beerli RR, Sonderegger I,
et al: VSIG4, a B7 family-related protein, is a negative regulator
of T cell activation. J Clin Invest. 116:2817–2826. 2006.
View Article : Google Scholar : PubMed/NCBI
|
|
56
|
Srirussamee K, Mobini S, Cassidy NJ and
Cartmell SH: Direct electrical stimulation enhances osteogenesis by
inducing Bmp2 and Spp1 expressions from macrophages and
preosteoblasts. Biotechnol Bioeng. 116:3421–3432. 2019. View Article : Google Scholar : PubMed/NCBI
|
|
57
|
Wei J, Marisetty A, Schrand B,
Gabrusiewicz K, Hashimoto Y, Ott M, Grami Z, Kong LY, Ling X,
Caruso H, et al: Osteopontin mediates glioblastoma-associated
macrophage infiltration and is a potential therapeutic target. J
Clin Invest. 129:137–149. 2019. View Article : Google Scholar : PubMed/NCBI
|
|
58
|
Su X, Xu BH, Zhou DL, Ye ZL, He HC, Yang
XH, Zhang X, Liu Q, Ma JJ, Shao Q, et al: Polymorphisms in
matricellular SPP1 and SPARC contribute to susceptibility to
papillary thyroid cancer. Genomics. 112:4959–4967. 2020. View Article : Google Scholar : PubMed/NCBI
|
|
59
|
Chen P, Zhao D, Li J, Liang X, Li J, Chang
A, Henry VK, Lan Z, Spring DJ, Rao G, et al: Symbiotic
macrophage-glioma cell interactions reveal synthetic lethality in
PTEN-null glioma. Cancer Cell. 35:868–884.e866. 2019. View Article : Google Scholar : PubMed/NCBI
|
|
60
|
Zhang Y, Du W, Chen Z and Xiang C:
Upregulation of PD-L1 by SPP1 mediates macrophage polarization and
facilitates immune escape in lung adenocarcinoma. Exp Cell Res.
359:449–457. 2017. View Article : Google Scholar : PubMed/NCBI
|
|
61
|
Hurley PJ, Hughes RM, Simons BW, Huang J,
Miller RM, Shinder B, Haffner MC, Esopi D, Kimura Y, Jabbari J, et
al: Androgen-regulated SPARCL1 in the tumor microenvironment
inhibits metastatic progression. Cancer Res. 75:4322–4334. 2015.
View Article : Google Scholar : PubMed/NCBI
|
|
62
|
Naschberger E, Liebl A, Schellerer VS,
Schütz M, Britzen-Laurent N, Kölbel P, Schaal U, Haep L,
Regensburger D, Wittmann T, et al: Matricellular protein SPARCL1
regulates tumor microenvironment-dependent endothelial cell
heterogeneity in colorectal carcinoma. J Clin Invest.
126:4187–4204. 2016. View Article : Google Scholar : PubMed/NCBI
|
|
63
|
Zhao SJ, Jiang YQ, Xu NW, Li Q, Zhang Q,
Wang SY, Li J, Wang YH, Zhang YL, Jiang SH, et al: SPARCL1
suppresses osteosarcoma metastasis and recruits macrophages by
activation of canonical WNT/β-catenin signaling through
stabilization of the WNT-receptor complex. Oncogene. 37:1049–1061.
2018. View Article : Google Scholar : PubMed/NCBI
|
|
64
|
Wu L, Sun S, Qu F, Sun M, Liu X, Sun Q,
Cheng L, Zheng Y and Su G: CXCL9 influences the tumor immune
microenvironment by stimulating JAK/STAT pathway in triple-negative
breast cancer. Cancer Immunol Immunother. 72:1479–1492. 2023.
View Article : Google Scholar : PubMed/NCBI
|
|
65
|
Yang M, Lu J, Zhang G, Wang Y, He M, Xu Q,
Xu C and Liu H: CXCL13 shapes immunoactive tumor microenvironment
and enhances the efficacy of PD-1 checkpoint blockade in high-grade
serous ovarian cancer. J Immunother Cancer. 9:e0011362021.
View Article : Google Scholar : PubMed/NCBI
|
|
66
|
Marcovecchio PM, Thomas G and
Salek-Ardakani S: CXCL9-expressing tumor-associated macrophages:
New players in the fight against cancer. J Immunother Cancer.
9:e0020452021. View Article : Google Scholar : PubMed/NCBI
|
|
67
|
Xie Y, Chen Z, Zhong Q, Zheng Z, Chen Y,
Shangguan W, Zhang Y, Yang J, Zhu D and Xie W: M2 macrophages
secrete CXCL13 to promote renal cell carcinoma migration, invasion,
and EMT. Cancer Cell Int. 21:6772021. View Article : Google Scholar : PubMed/NCBI
|
|
68
|
Zhao S, Mi Y, Guan B, Zheng B, Wei P, Gu
Y, Zhang Z, Cai S, Xu Y, Li X, et al: Tumor-derived exosomal
miR-934 induces macrophage M2 polarization to promote liver
metastasis of colorectal cancer. J Hematol Oncol. 13:1562020.
View Article : Google Scholar : PubMed/NCBI
|
|
69
|
Huang D, Sun W, Zhou Y, Li P, Chen F, Chen
H, Xia D, Xu E, Lai M, Wu Y and Zhang H: Mutations of key driver
genes in colorectal cancer progression and metastasis. Cancer
Metastasis Rev. 37:173–187. 2018. View Article : Google Scholar : PubMed/NCBI
|
|
70
|
Popat S, Hubner R and Houlston RS:
Systematic review of microsatellite instability and colorectal
cancer prognosis. J Clin Oncol. 23:609–618. 2005. View Article : Google Scholar : PubMed/NCBI
|
|
71
|
Ward R, Meagher A, Tomlinson I, O'Connor
T, Norrie M, Wu R and Hawkins N: Microsatellite instability and the
clinicopathological features of sporadic colorectal cancer. Gut.
48:821–829. 2001. View Article : Google Scholar : PubMed/NCBI
|
|
72
|
García-Marín R, Reda S, Riobello C, Cabal
VN, Suárez-Fernández L, Vivanco B, Álvarez-Marcos C, López F,
Llorente JL and Hermsen MA: Prognostic and therapeutic implications
of immune classification by CD8(+) tumor-infiltrating lymphocytes
and PD-L1 expression in sinonasal squamous cell carcinoma. Int J
Mol Sci. 22:69262021. View Article : Google Scholar : PubMed/NCBI
|
|
73
|
Zhang Y, Wang X, Shi M, Song Y, Yu J and
Han S: Programmed death ligand 1 and tumor-infiltrating
CD8+ T lymphocytes are associated with the clinical
features in meningioma. BMC Cancer. 22:11712022. View Article : Google Scholar : PubMed/NCBI
|
|
74
|
Chen YP, Zhang Y, Lv JW, Li YQ, Wang YQ,
He QM, Yang XJ, Sun Y, Mao YP, Yun JP, et al: Genomic analysis of
tumor microenvironment immune types across 14 solid cancer types:
Immunotherapeutic implications. Theranostics. 7:3585–3594. 2017.
View Article : Google Scholar : PubMed/NCBI
|