Introduction
Hepatocellular carcinoma (HCC) ranks sixth and third
in terms of global cancer morbidity and mortality, respectively
(1). Liver cancer has become a
major public health problem. Hepatitis B is one of the most
important causes of liver cancer (2). The main pathological types of liver
cancer include HCC and cholangiocarcinoma and HCC accounts for
nearly 80% of cases. Early symptoms of liver cancer are not
obvious; therefore, most patients are diagnosed at a middle or
advanced stage. At present, surgical resection is the main
treatment method for liver cancer worldwide and other methods such
as transcatheter arterial chemoembolization (TACE), radiotherapy
and immunotherapy are auxiliary (3). However, the benefits of various
treatments are limited and overall survival (OS) remains low.
Therefore, it is necessary to explore the causes of liver cancer
recurrence after treatment and intervene to improve treatment
efficacy.
TACE is a first-line treatment for unresectable HCC.
The principle of TACE involves selectively or superselectively
inserting a catheter into the tumor-feeding artery, followed by
administration of embolic and chemotherapeutic agents. This induces
ischemic necrosis of the tumor, thereby inhibiting its progression
and improving quality of life.
Depending on the operation time and method, TACE can
be divided into assistant, conventional and drug-eluting TACE
(4). However, there remains some
controversy surrounding TACE. Due to the use of chemotherapeutic
drugs, some patients experience a transient decrease in liver
function following surgery (5).
Furthermore, the abundant blood supply of liver cancer, production
of new blood vessels following TACE, establishment of collateral
circulation and other factors have made it difficult to achieve
ideal therapeutic effects with simple TACE (6). There are also significant differences
in the efficacy of TACE for different patients. To address this,
the Japan Society of Hepatology introduced and subsequently revised
the concept of TACE failure/refractoriness to improve evaluation of
patient responses (7).
Investigation of the molecular mechanisms underlying
TACE resistance is crucial for improving its therapeutic efficacy
(8). In recent years, the
combination of TACE with systemic therapies, particularly targeted
therapies and immune checkpoint inhibitors (ICIs), has shown
potential in prolonging progression-free survival and enhancing OS
(9). For example, the combination
of TACE with targeted drugs such as sorafenib and lenvatinib, as
well as immunotherapies such as pembrolizumab, has demonstrated
synergistic effects in several studies (10–12).
However, despite the promising outcomes in some patients, the
overall prognosis for HCC remains suboptimal, partly due to the
development of resistance and recurrence following TACE (13). Consequently, further research into
the mechanisms of TACE resistance and their interaction with
combination therapy is essential for optimizing treatment protocols
and improving patient outcomes.
Transcription factors (TFs) are proteins that
regulate the transcription of genetic information from DNA to mRNA
by binding to specific DNA sequences (14). TFs ensure that various genes are
expressed inside the cell at the right time and in the right
amount. There are >1,600 TFs in humans and most of them are
involved in regulating a variety of important cellular functions,
including division and death, as well as embryonic development
(15). TFs are closely related to
the occurrence and development of tumors. E-box binding zinc finger
protein 2 can bind to the hepatitis B virus (HBV) core promoter,
thereby inhibiting its activity and reducing the occurrence of
HBV-induced liver cancer (16).
Transcription termination factor (TTF)1 can affect proliferation of
hepatoma cells by regulating the activity of ribosomes (17). Metastasis of liver cancer is also
regulated by TFs, such as the transcription factor forkhead box P4,
which can enhance its expression by directly binding to the
promoter region of the SLUG gene and then transcribe a
series of proteins downstream of EMT to promote liver cancer
metastasis (18). TFs can regulate
genes related to drug resistance, such as MDR1 and
TWIST. At present, research on the role of TFs in TACE
resistance remains limited and further exploration is needed.
The present study combined TFs with TACE resistance
and used weighted gene co-expression network analysis (WGCNA) to
screen out HUB genes related to TACE nonresponse. Least
absolute shrinkage and selection operator (LASSO)-Cox regression
was used to build a prognosis-related predictive model and possible
roles of TFs in the model of TACE resistance were analyzed in
relation to immune microenvironment, drug sensitivity, single cells
and cell experiments. It is expected that the present study will
serve as a new resource for determining TACE effectiveness and the
best course of treatment for liver cancer.
Materials and methods
Datasets and preprocessing
The present study included sequencing data (TPM
format) from TCGA-LIHC (portal.gdc.cancer.gov/). Patients with
incomplete follow-up information, 0 days of survival and repeated
sequencing samples from the same patient were excluded. A total of
365 tumor samples were included for bioinformatics analysis and
model construction. With same inclusion criteria, 231 HCC patients
in the ICGC-LIHC (https://dcc.icgc.org/projects/LIRI-JP) cohort and 221
in the GSE14520 dataset were included for external validation. To
identify genes associated with TACE resistance, the GSE104580
cohort (100 TACE responders and 100 non-responders) in the GEO
database (https://www.ncbi.nlm.nih.gov/geo/) was obtained and
further analysis was performed. When performing internal and
external validation, the sva R package (v3.46.0) (19) was used for background correction and
normalization to ensure comparability of validation (Fig. S1). A total of 1,639 TFs were
extracted based on previous studies (20–22).
GSE125449 is a single-cell sequencing set for LIHC and its
processing pipeline is from the TISCH database. R software (version
4.0.5) (23) was used to conduct
all of the analyses.
Differentially expressed TF
identification and enrichment analysis
In GSE104580, differentially expressed genes (DEGs)
between different response states were identified using the limma R
package (version 3.52.0) (24) with
P<0.05 and |log2FC|>0.5 as thresholds; adjusted P<0.05.
The top 20 up-/downregulated differentially expressed TFs (DETFs)
were plotted using the pheatmap R package (version 1.0.12)
(25) after intersection with 1,639
TFs.
Gene Ontology (GO) was used to annotate the
biological process, molecular function and cellular component of
genes. Gene pathways were annotated using the Kyoto Encyclopedia of
Genes and Genomes (KEGG). Significantly enriched pathways were
indicated by P-values and q-values <0.05. The clusterprofiler R
package (v4.4.0) (26) was used for
enrichment analysis of DETF-related functions and pathways (GO and
KEGG), with P<0.05 as the threshold.
TACE refractoriness-related TFs
identification and enrichment analysis
The present study took as input the ensemble of TFs
in GSE10458 and removed genes with a standard deviation of 0 in
each sample. To eliminate outlier genes and samples, R software
package WGCNA goodSamplesGenes technique (version 1.68) (27) was used. WGCNA was then used to
create a scale-free co-expression network. A soft threshold of 1–25
was used for topological calculations and the relation matrix was
converted into an adjacency matrix using the best soft threshold. A
topological overlap matrix (TOM) was created from the results and
average link hierarchical clustering was performed. TOM
classification of the associated modules was used and each module
had ≥50 genes. The modules with a distance of <0.8 were combined
and the correlation between the combined modules and TACE response
was calculated. Finally, the DETFs and TFs in the co-expressed core
module were overlapped and the identified TFs were used as TACE
refractoriness-related TFs (TRTs). Enrichment analysis further
explored the potential functions of DETFs and enriched pathways (GO
and KEGG) using the clusterprofiler package, with P<0.05 as the
threshold.
Construction of a nomogram and
prognostic model
TCGA-LIHC cohort was used for modeling and the
GSE14520 and ICGC-LIHC cohorts for external validation. In
TCGA-LIHC, univariate Cox regression analysis was first used to
filter out TFs with no prognostic significance in TRTs (P<0.05).
To prevent overfitting effects, using LASSO regression, 10-fold
cross-validation and 1,000 cycles with 1,000 random stimulations, a
risk model was developed. The risk score formula was established by
multivariate Cox regression analysis (stepwise) with integration
coefficients and gene expression values. The patients were divided
into high-risk and low-risk groups based on the median value of the
risk score formula. Univariate and multivariate Cox regression
analyses were used to assess the prognostic value of risk scores
across the entire dataset and an external validation dataset.
Time-dependent receiver operating characteristic (ROC) curves were
used to compare the predictive accuracy of risk scores with
traditional clinicopathological parameters. Prognostic nomograms
were constructed using the replot R package (version 1.0.0)
(28) and validated using
calibration curves.
Immune landscape analysis
To assess the quantity of immune cells in various
samples, several methods were used simultaneously, including TIMER
(version 2.0) (29), CIBERSORT
(version 1.06) (30), QUANTISEQ
(version 1.0) (31), MCP-counter
(version 1.2.0) (32), XCELL
(version 1.1.0) (33) and EPIC
(version 1.1) (34). In addition,
the ESTIMATE algorithm (v1.0.13) (35) was used to calculate the immune
score; the interstitial score to reflect the microenvironmental
status (36). The tumor
microenvironment (TME) is constructed by a variety of cell types.
Thorsson et al (37) defined
six immunoexpression signature subtypes based on the gene
expression profile of all solid tumors in TCGA, including: Wound
Healing (Immune C1), IFN-γ Dominant (Immune C2), Inflammatory
(Immune C3), Lymphocyte Depleted (Immune C4), Immunologically Quiet
(Immune C5) and TGF-bβ Dominant (Immune C6). The present study
classified patients based on immune expression signatures.
Drug sensitivity analysis
The present study obtained (38) half-maximal inhibitory concentration
(IC50) values of commonly used chemotherapeutic drugs
for liver cancer from the Genomics of Cancer Drug Sensitivity
(GDSC) database (https://www.cancerrxgene.org/) and used R software.
The PRrophytic R package (v1.0.2) (39) was used for calculation. By using the
Wilcoxon signed rank test, the differences in IC50
between various risk categories were examined. Boxplots were used
to depict the results.
Cell lines and culture conditions
Every cell line was bought from the National
Certified Cell Center for Cultural Collections (Shanghai, China).
Huh7 cells were cultured in Dulbecco's modified Eagle's medium
(Gibco; Thermo Fisher Scientific, Inc.) supplemented with 1%
penicillin-streptomycin and 10% fetal bovine serum. SNU-387 cells
were cultured in RPMI medium (HyClone; Cytiva) supplemented with
10% fetal bovine serum and 1% penicillin-streptomycin. A cell
incubator was used for cell culture, which was performed at 37°C
with 5% CO2 and 10% humidity. The cell lines used in the
presence of mycoplasma were investigated in the present study.
Protein staining
Tumor tissue samples were fixed with 10% formalin at
room temperature for 24 h. Subsequently, the samples were embedded
in paraffin and sectioned at a thickness of 4 microns to allow for
optimal staining and microscopic observation. Antigen retrieval was
conducted at 95°C using citrate buffer (pH 6.0) to expose antigenic
sites, followed by washing with phosphate-buffered saline (PBS)
three times for 5 min each. Endogenous peroxidase activity was
blocked using 3% hydrogen peroxide at room temperature for 10 min
to prevent non-specific background staining. The sections were
incubated with rabbit anti-XYZ antibody (cat. number: ab11174;
Abcam), at a dilution of 1:200 at 4°C overnight, and detection was
performed using DAB substrate and sections were counterstained with
0.1% hematoxylin solution at room temperature for 5 min. Images
were captured using a light microscope at 40× magnification to
document the staining results and assess the presence and
localization of the target protein within the tissue samples.
Cell viability and drug
sensitivity
Cells were seeded in 96-well plates at 5,000
cells/well and placed in a 37°C, 5% CO2 incubator for 48
h. To simulate the TACE environment, another set of cells was
placed in a 37°C, 5% CO2, 1% O2 incubator for
48 h. According to the concentration gradient, the experimental
group was treated with lobaplatin (cat. no. H20050309; Hainan
Changan International Pharmaceutical Co. Ltd.). The plates were
taken out of the incubator after 48 h and put in a dark place so
that 10 µl of CCK8 reagent (cat. no. A311-02; Vazyme Biotech Co.,
Ltd.) could be added to each well. The plates were returned to the
incubator for 1–2 h. Optical density was determined using a
microplate reader, (Multiskan FC; Thermo Fisher Scientific,
Inc.).
Reverse transcription-quantitative
(RT-q) PCR
For RNA extraction, ~5,000 cells per well were
seeded in a 96-well plate. RNA isolation kit (cat. no. RC112-01;
Vazyme Biotech Co., Ltd.) was used to extract total RNA and a cDNA
synthesis kit (cat. no. R233-01; Vazyme Biotech Co., Ltd.) was used
to create cDNA. All steps were performed according to the
manufacturer's protocols. Using SteponePlus (Applied Biosystems;
Thermo Fisher Scientific, Inc.), RT-qPCR was performed using 10 µM
primers and SYBR qPCR Master Mix (cat. no. Q511-02; Vazyme Biotech
Co., Ltd.). PCR cycling conditions were as follows: Initial
denaturation at 95°C for 2 min, followed by 40 cycles of
denaturation at 95°C for 30 sec, annealing at 60°C for 30 sec, and
extension at 72°C for 1 min. The relative expression levels were
determined using the ΔΔCq method (40). Relative expression values were
normalized to the control gene (GADPH). The primer pairs used in
the present study are shown in Table
I.
 | Table I.PCR primer sequences. |
Table I.
PCR primer sequences.
| Gene | Primer |
|---|
| CENPA | Forward:
AAGAGCACACACCTCTTGATAA |
|
| Reverse:
CATGTAAGGTGAGGAGATAGGC |
| KLF2 | Forward:
CTTCGGTCTCTTCGACGAC |
|
| Reverse:
GTAGCTGCAGGTGTGAGTG |
| CBX2 | Forward:
GACTTAGATGCTAAGAGGGGTC |
|
| Reverse:
CTTCTTCCGGATGGGATCCTTC |
| KCMF1 | Forward:
GTGGATCACGAGGTTAGTTCAGGAC |
|
| Reverse:
CCGAGTAGCAGGAATTACAGGCATC |
Statistical analysis
For the IC50 results, statistical
analysis of optical density values was performed using GraphPad
Prism version 8.0 (Dotmatics). Data are presented as mean ±
standard deviation derived from three independent experiments
conducted in triplicate (n=3). For the RT-qPCR, the data were
represented as mean ± SD from three independent experiments (n=3).
The statistical significance of differences in gene expression
levels between the two cell lines was evaluated using an unpaired
Student's t-test. The statistical analyses were performed using
GraphPad Prism version 8.0 (Dotmatics). P<0.05 was considered to
indicate a statistically significant difference.
Results
Identification of specific TRTs
To explore potential TRTs in HCC, a differential
gene expression study was conducted in the GSE104580 dataset on
patients who had TACE responses and those who had none. Among 1,639
TFs, 158 DETFs were identified using the limma package, including
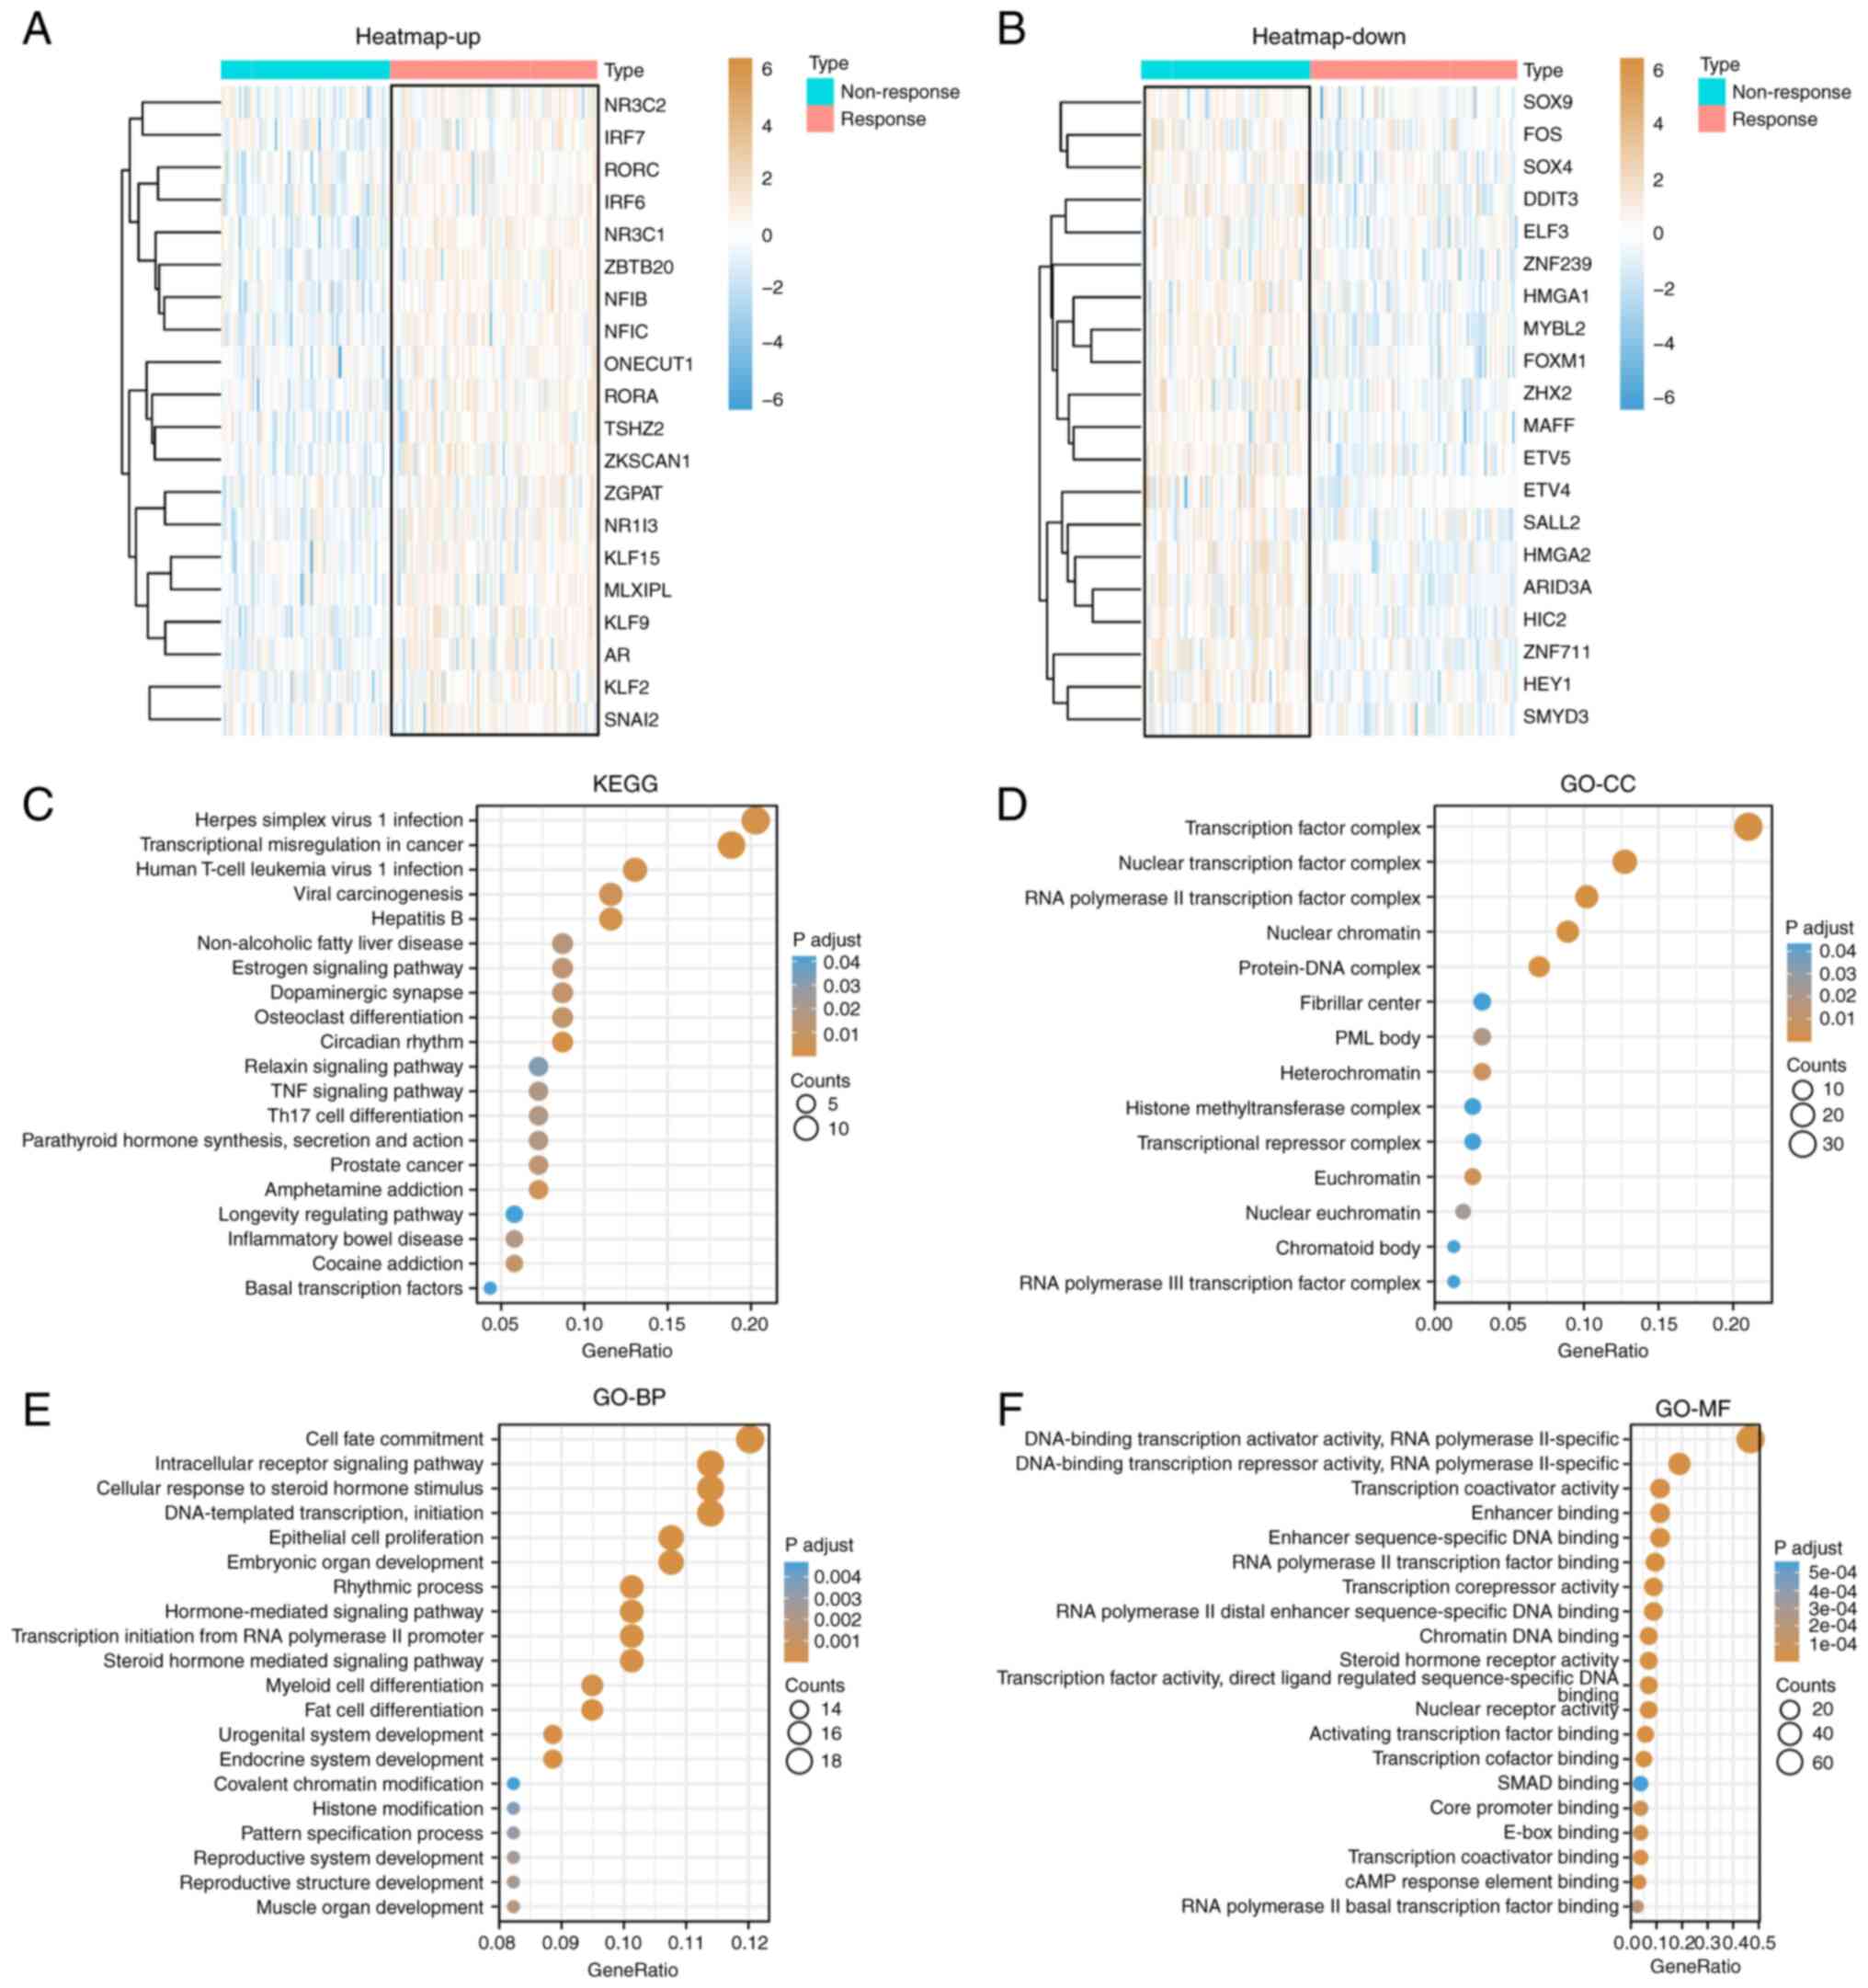
78 up- and 80 downregulated (P<0.05; |log2FC|>0.5). The heat
map showed the top 20 upregulated (Fig.
1A) and downregulated (Fig. 1B)
DEGs and DETFs. The clusterProfiler package was used to analyze the
DETFs. Fig. 1C shows the top 20
KEGG signaling pathways that may be related to TACE responses,
including ‘transcriptional misregulation in cancer’, ‘circadian
rhythm’, ‘herpes simplex virus 1 infection’, ‘hepatitis B’, ‘human
T-cell leukemia virus 1 infection’ and ‘amphetamine addiction’.
Fig. 1D-F shows GO terms that may
be related to the TACE response. The cellular component part mainly
included ‘transcription factor complex’, ‘nuclear’, ‘transcription
factor complex’, ‘RNA polymerase II transcription factor complex’,
‘protein-DNA complex’ and ‘nuclear chromatin’; the biological
process part mainly included ‘primary miRNA transcription by RNA
polymerase II’, ‘tissue development’, ‘cell fate commitment’,
‘endocrine system development’, ‘DNA-templated transcription’ and
‘initiation’; and the molecular function part mainly included
‘enhancer-sequence-specific DNA binding’, ‘enhancer binding’ and
‘RNA polymerase II distal enhancer sequence-specific DNA
binding’.
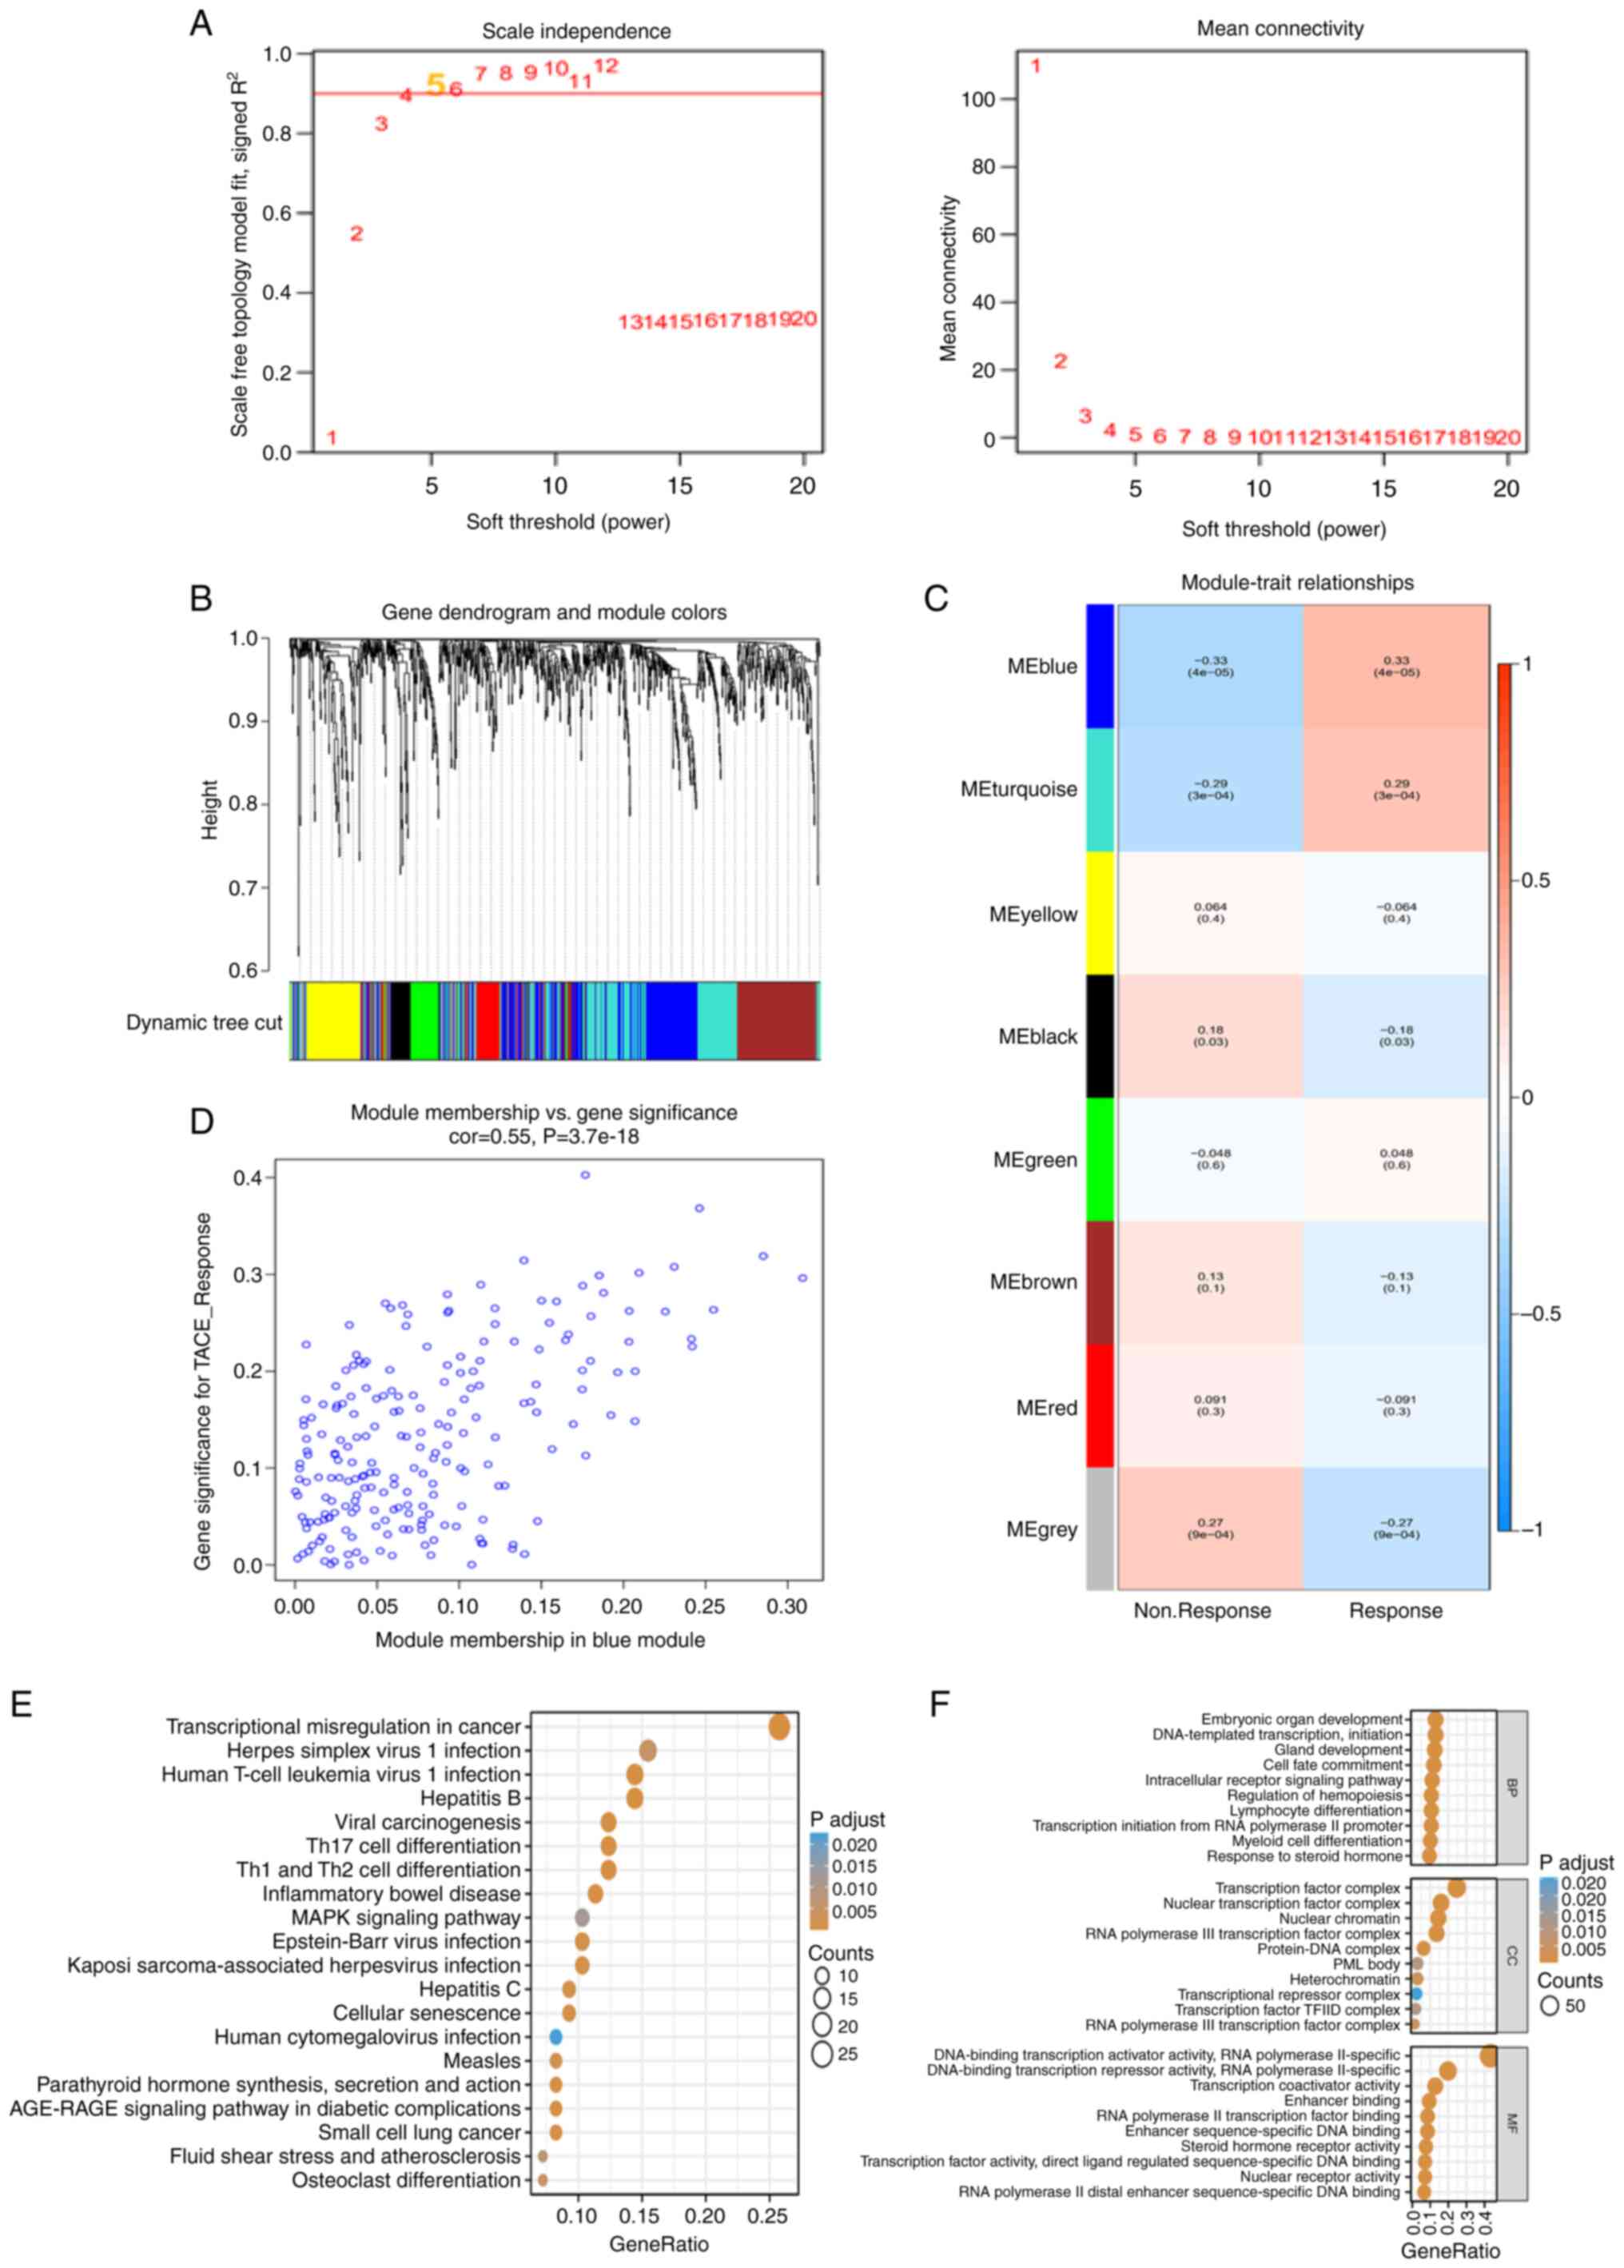
With a good association with TACE response, WGCNA
was used to build co-expression networks and modules containing the
DETFs. All TFs in GSE10458 were used as input genes for WGCNA.
After determining the optimal soft threshold of 5 (Fig. 2A), according to the dynamic
tree-cutting technique, all of the TFs were clustered using a
TOM-based dissimilarity metric, partitioning the tree into eight
modules (Fig. 2B). The correlation
of each module with TACE response was calculated (Fig. 2C). The blue module showed a strong
positive correlation with TACE response (Fig. 2D). The GO and KEGG pathway
enrichment results of the 212 TFs in the co-expressed blue module
were similar to the previous enrichment results for DETFs. The KEGG
pathways mainly included ‘transcriptional misregulation in cancer’,
‘inflammatory bowel disease’, ‘Th1 and Th2 cell differentiation’,
‘Th17 cell differentiation’ and ‘hepatitis B’ (Fig. 2E). The GO terms mainly included
‘transcription initiation from RNA polymerase II promoter’, ‘cell
fate commitment’, ‘intracellular receptor signaling pathway’ and
‘embryonic organ development’ (Fig.
2F). The 158 DETFs in the aforementioned TACE response and
nonresponse and the 212 TFs in the co-expressed blue module were
overlapped and 65 TFs as TRTs were identified for subsequent
analysis.
Construction of a prognostic TRT
signature
To identify key TRTs associated with TACE response,
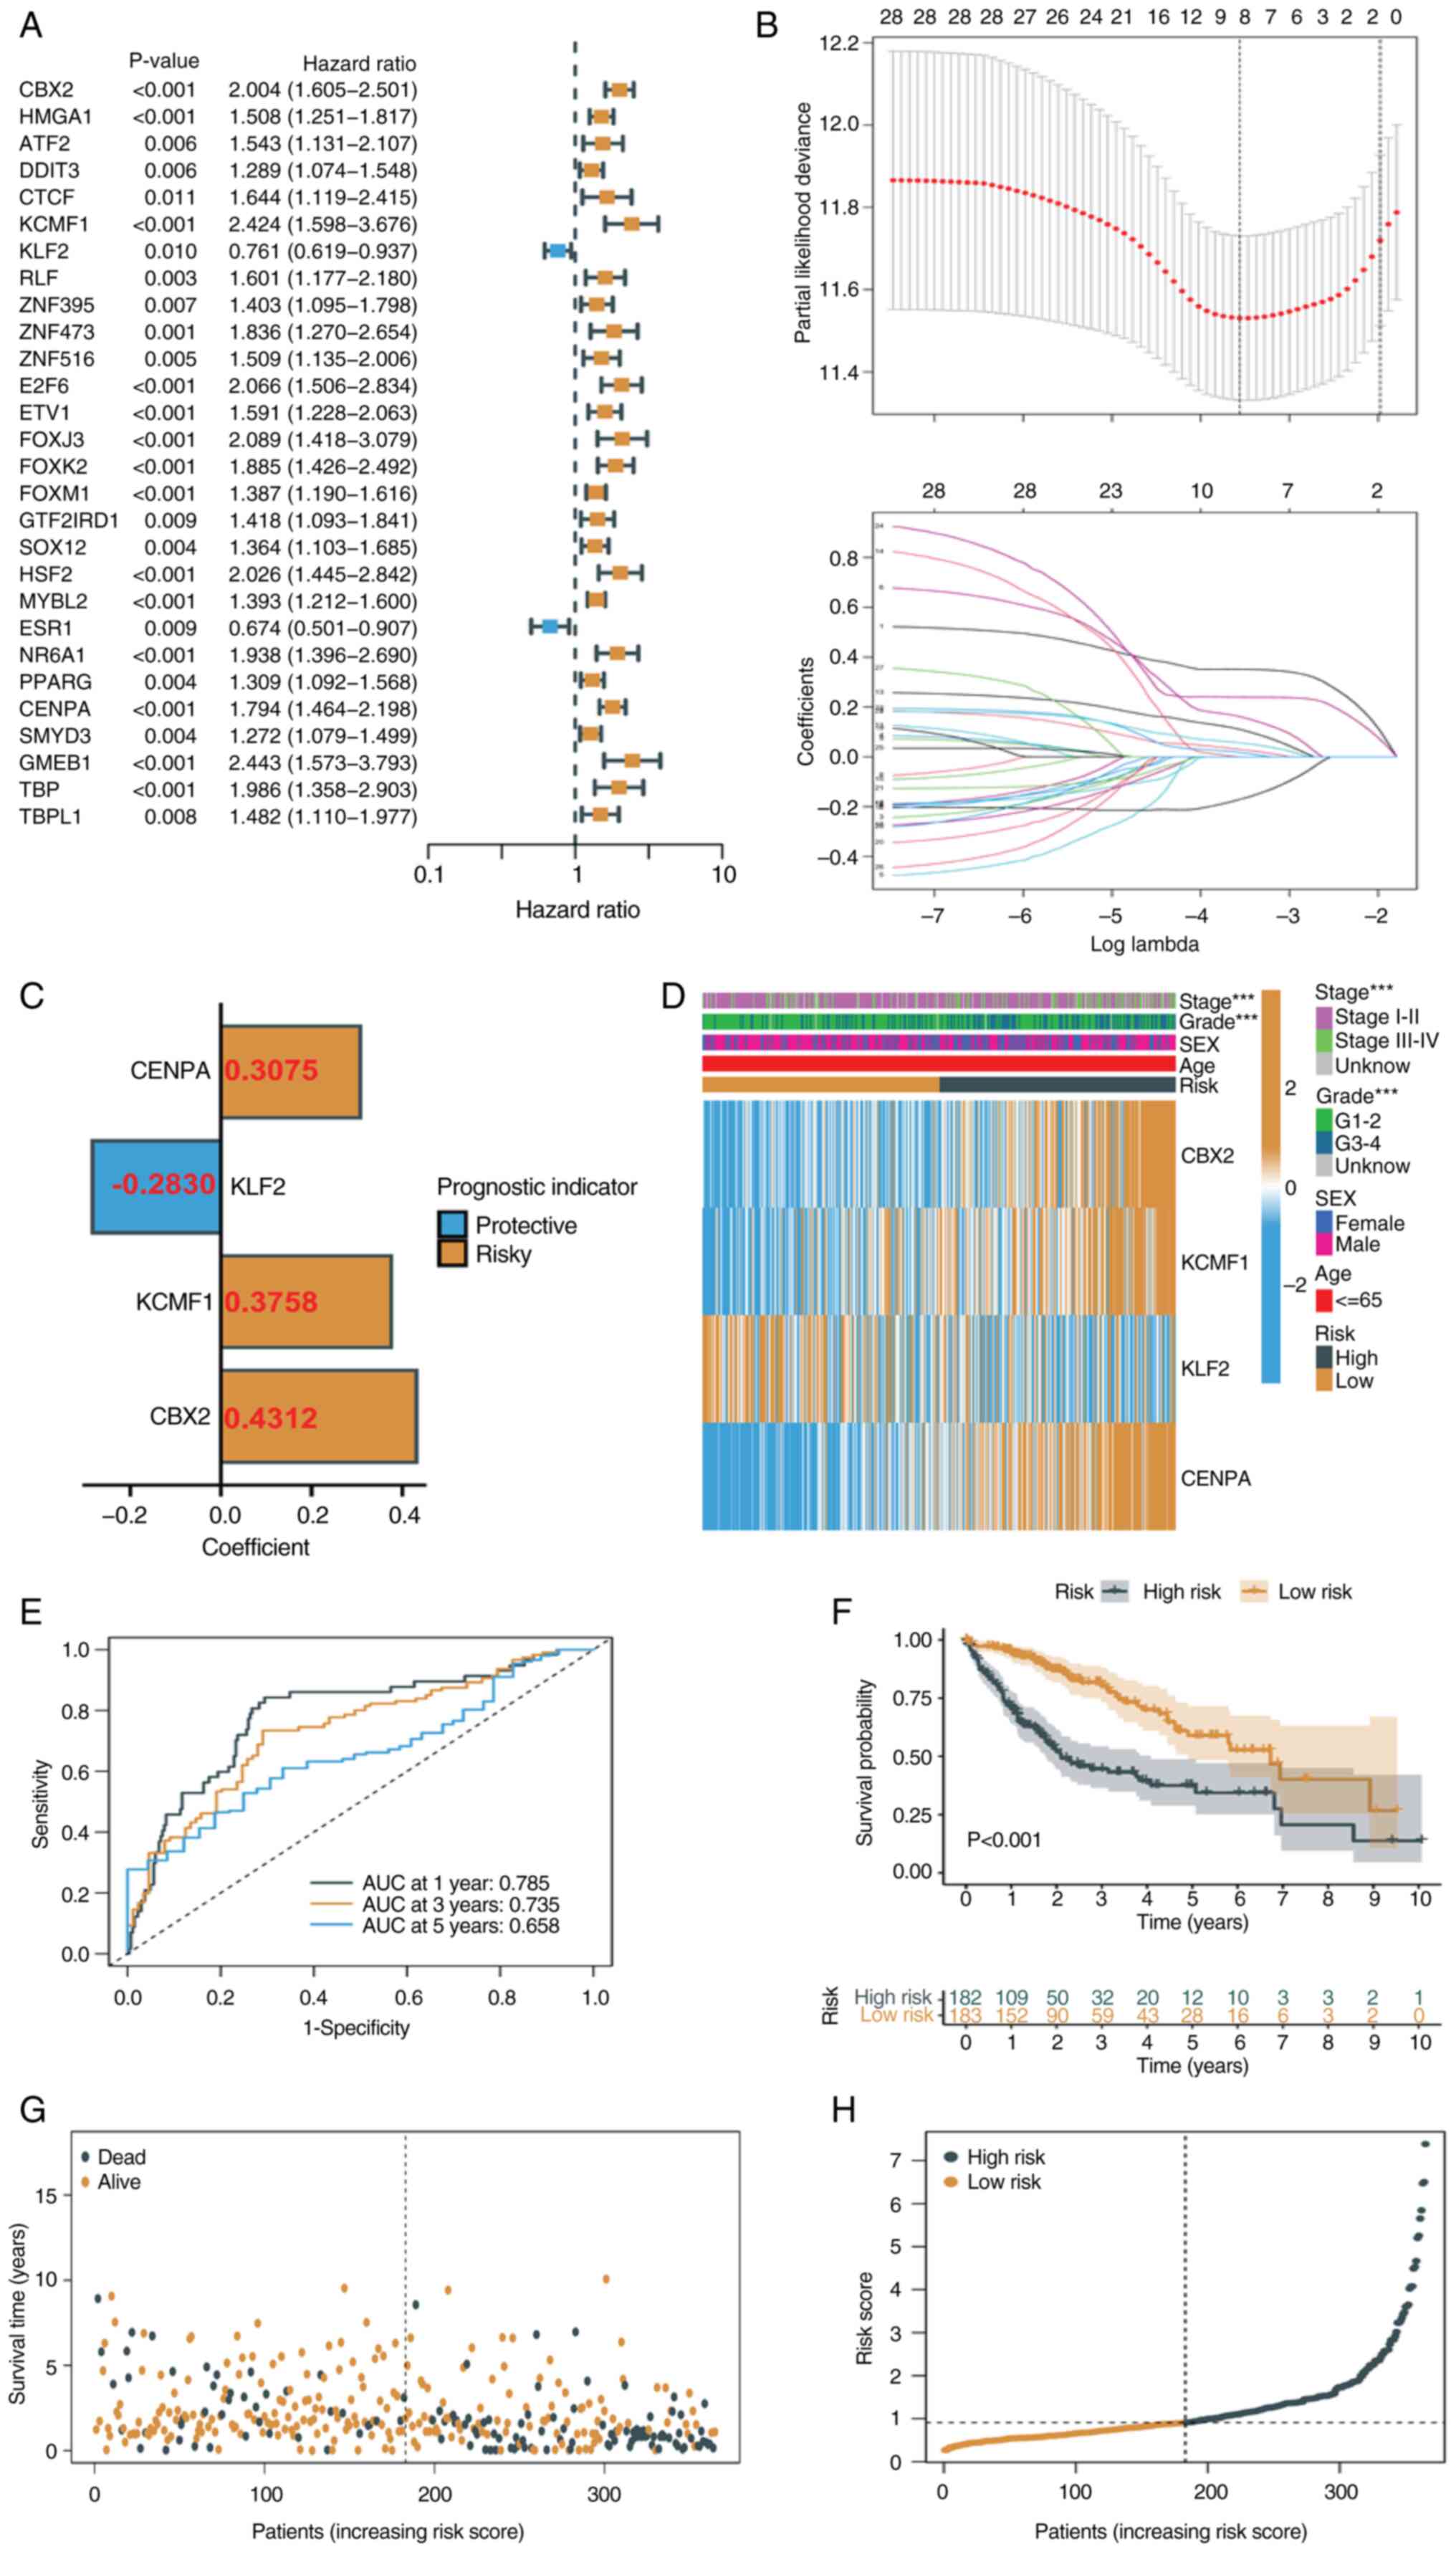
univariate Cox regression analysis was used to identify TRTs
significantly associated with prognosis in TCGA-LIHC cohort
(Fig. 3A). The present study
obtained 28 TRTs associated with prognosis (all P<0.05). Based
on univariate Cox regression analysis, redundant TRTs were removed
using LASSO regression analysis (enter method) for further
screening (Fig. 3B). The best
eigenvalue was 8. Multivariate Cox regression analysis (stepwise
method) was performed on the eight TRTs following LASSO regression
and four TRTs involved in modeling were identified, namely CENPA,
KLF2, KCMF1 and CBX2 (Fig. 3C). A
risk score was calculated for each patient based on the
coefficients and expression levels of each TRT (Fig. 3C to assess prognosis. The heat map
showed the expression of the four TRTs in the high- and low-risk
groups, as well as the relationship between the high- and low-risk
groups and the associated traits (Fig.
3D). ROC curves for 1-, 3- and 5-year survival prediction of
patients showed that an area under the curve >0.7 indicating the
ability to strongly predict prognosis (Fig. 3E). Kaplan-Meier analysis showed that
patients with low risk scores had significantly longer survival
times than patients with high risk scores (Fig. 3F). The risk distribution map also
showed that survival time decreased significantly with increasing
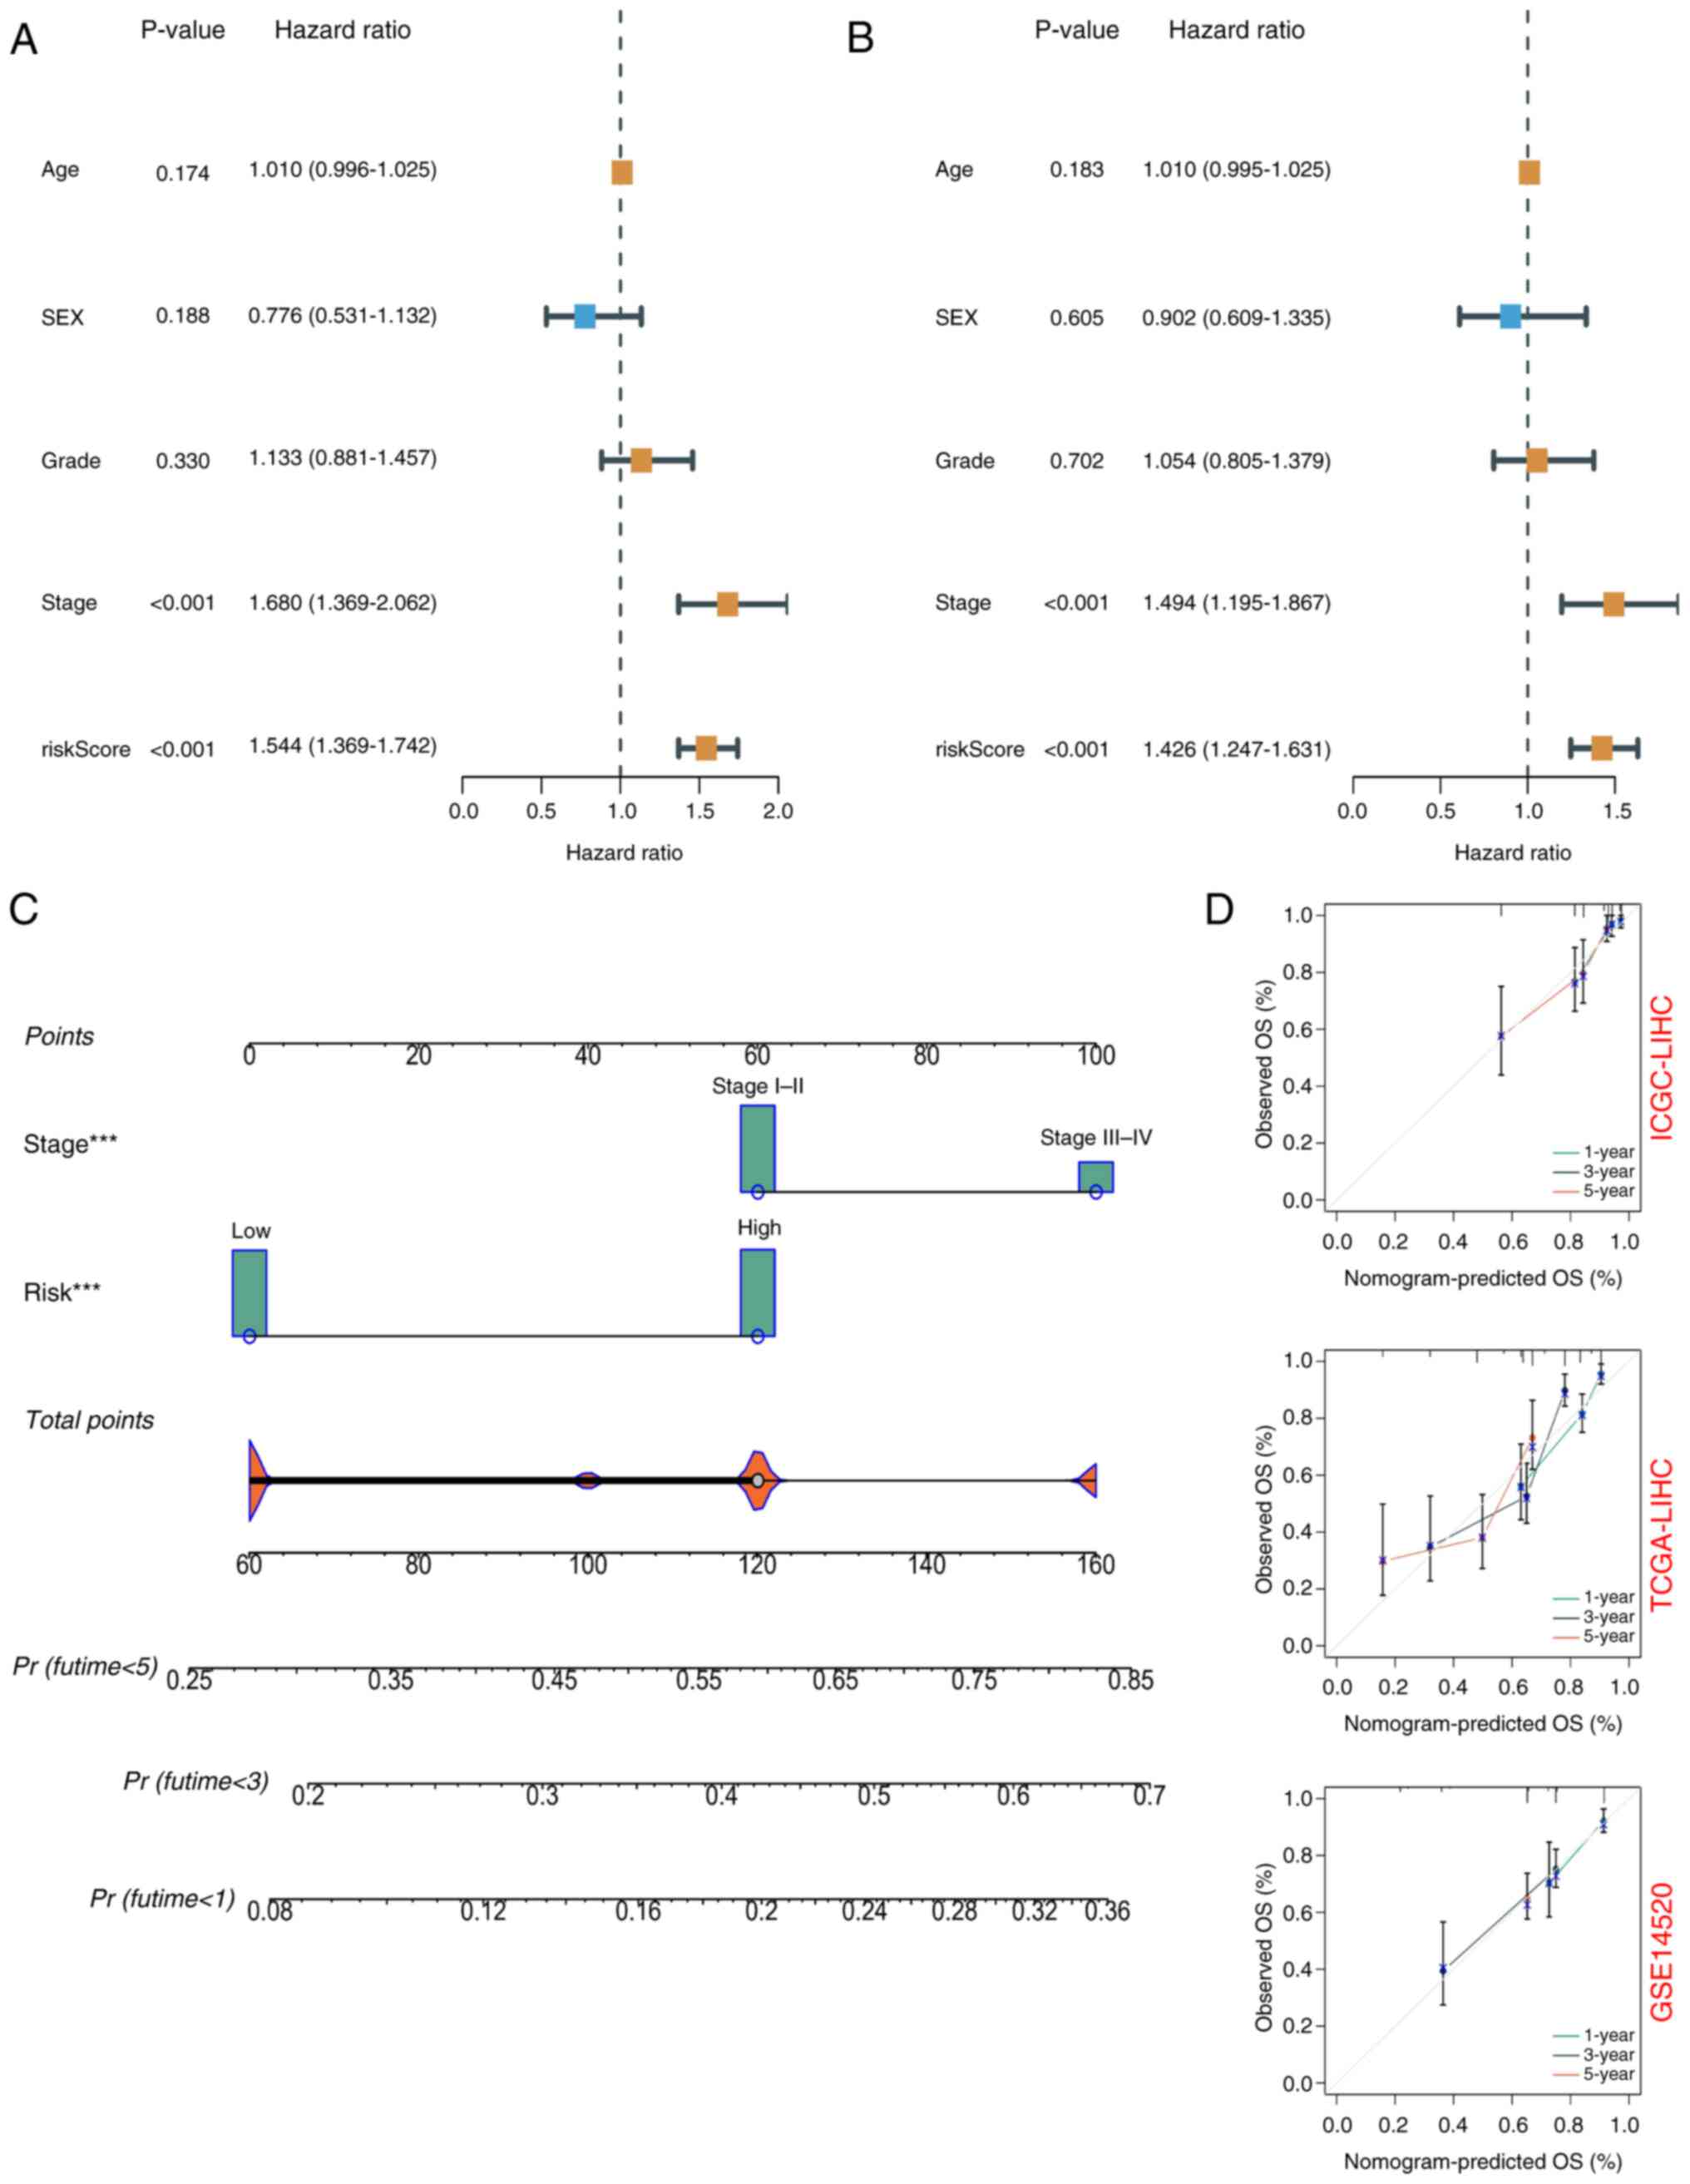
risk score (Fig. 3G and H). The
prognostic value of the risk signatures were assessed according to
risk score, age, sex, tumor stage and tumor grade. According to
univariate Cox regression analysis, the risk score was
significantly associated with OS [hazard ratio (HR)=1.544, 95%
confidence interval (CI)=1.369–1.742] (Fig. 4A). Multivariate Cox regression
analysis showed that risk score was an independent prognostic
factor (HR=1.426, 95% CI=1.247–1.631) (Fig. 4B). Nomograms and calibration plots
were used to quantify the contribution of individual factors to
clinical prognosis and validate the model (Fig. 4C and D). The prognostic model had
good predictive ability in the three cohorts (TCGA, ICGC and
GSE14520). The predicted line segments in the calibration curves in
the different datasets were all close to the actual line
segments.
Validation of prognostic TRT signature
in the external datasets
The present study risk-scored patients in the
external validation cohort ICGC-LIHC and the GSE14520 dataset using
the same formula and cutoff as for TCGA-LIHC, with high- and
low-risk groups, to confirm the external validity of the prognostic
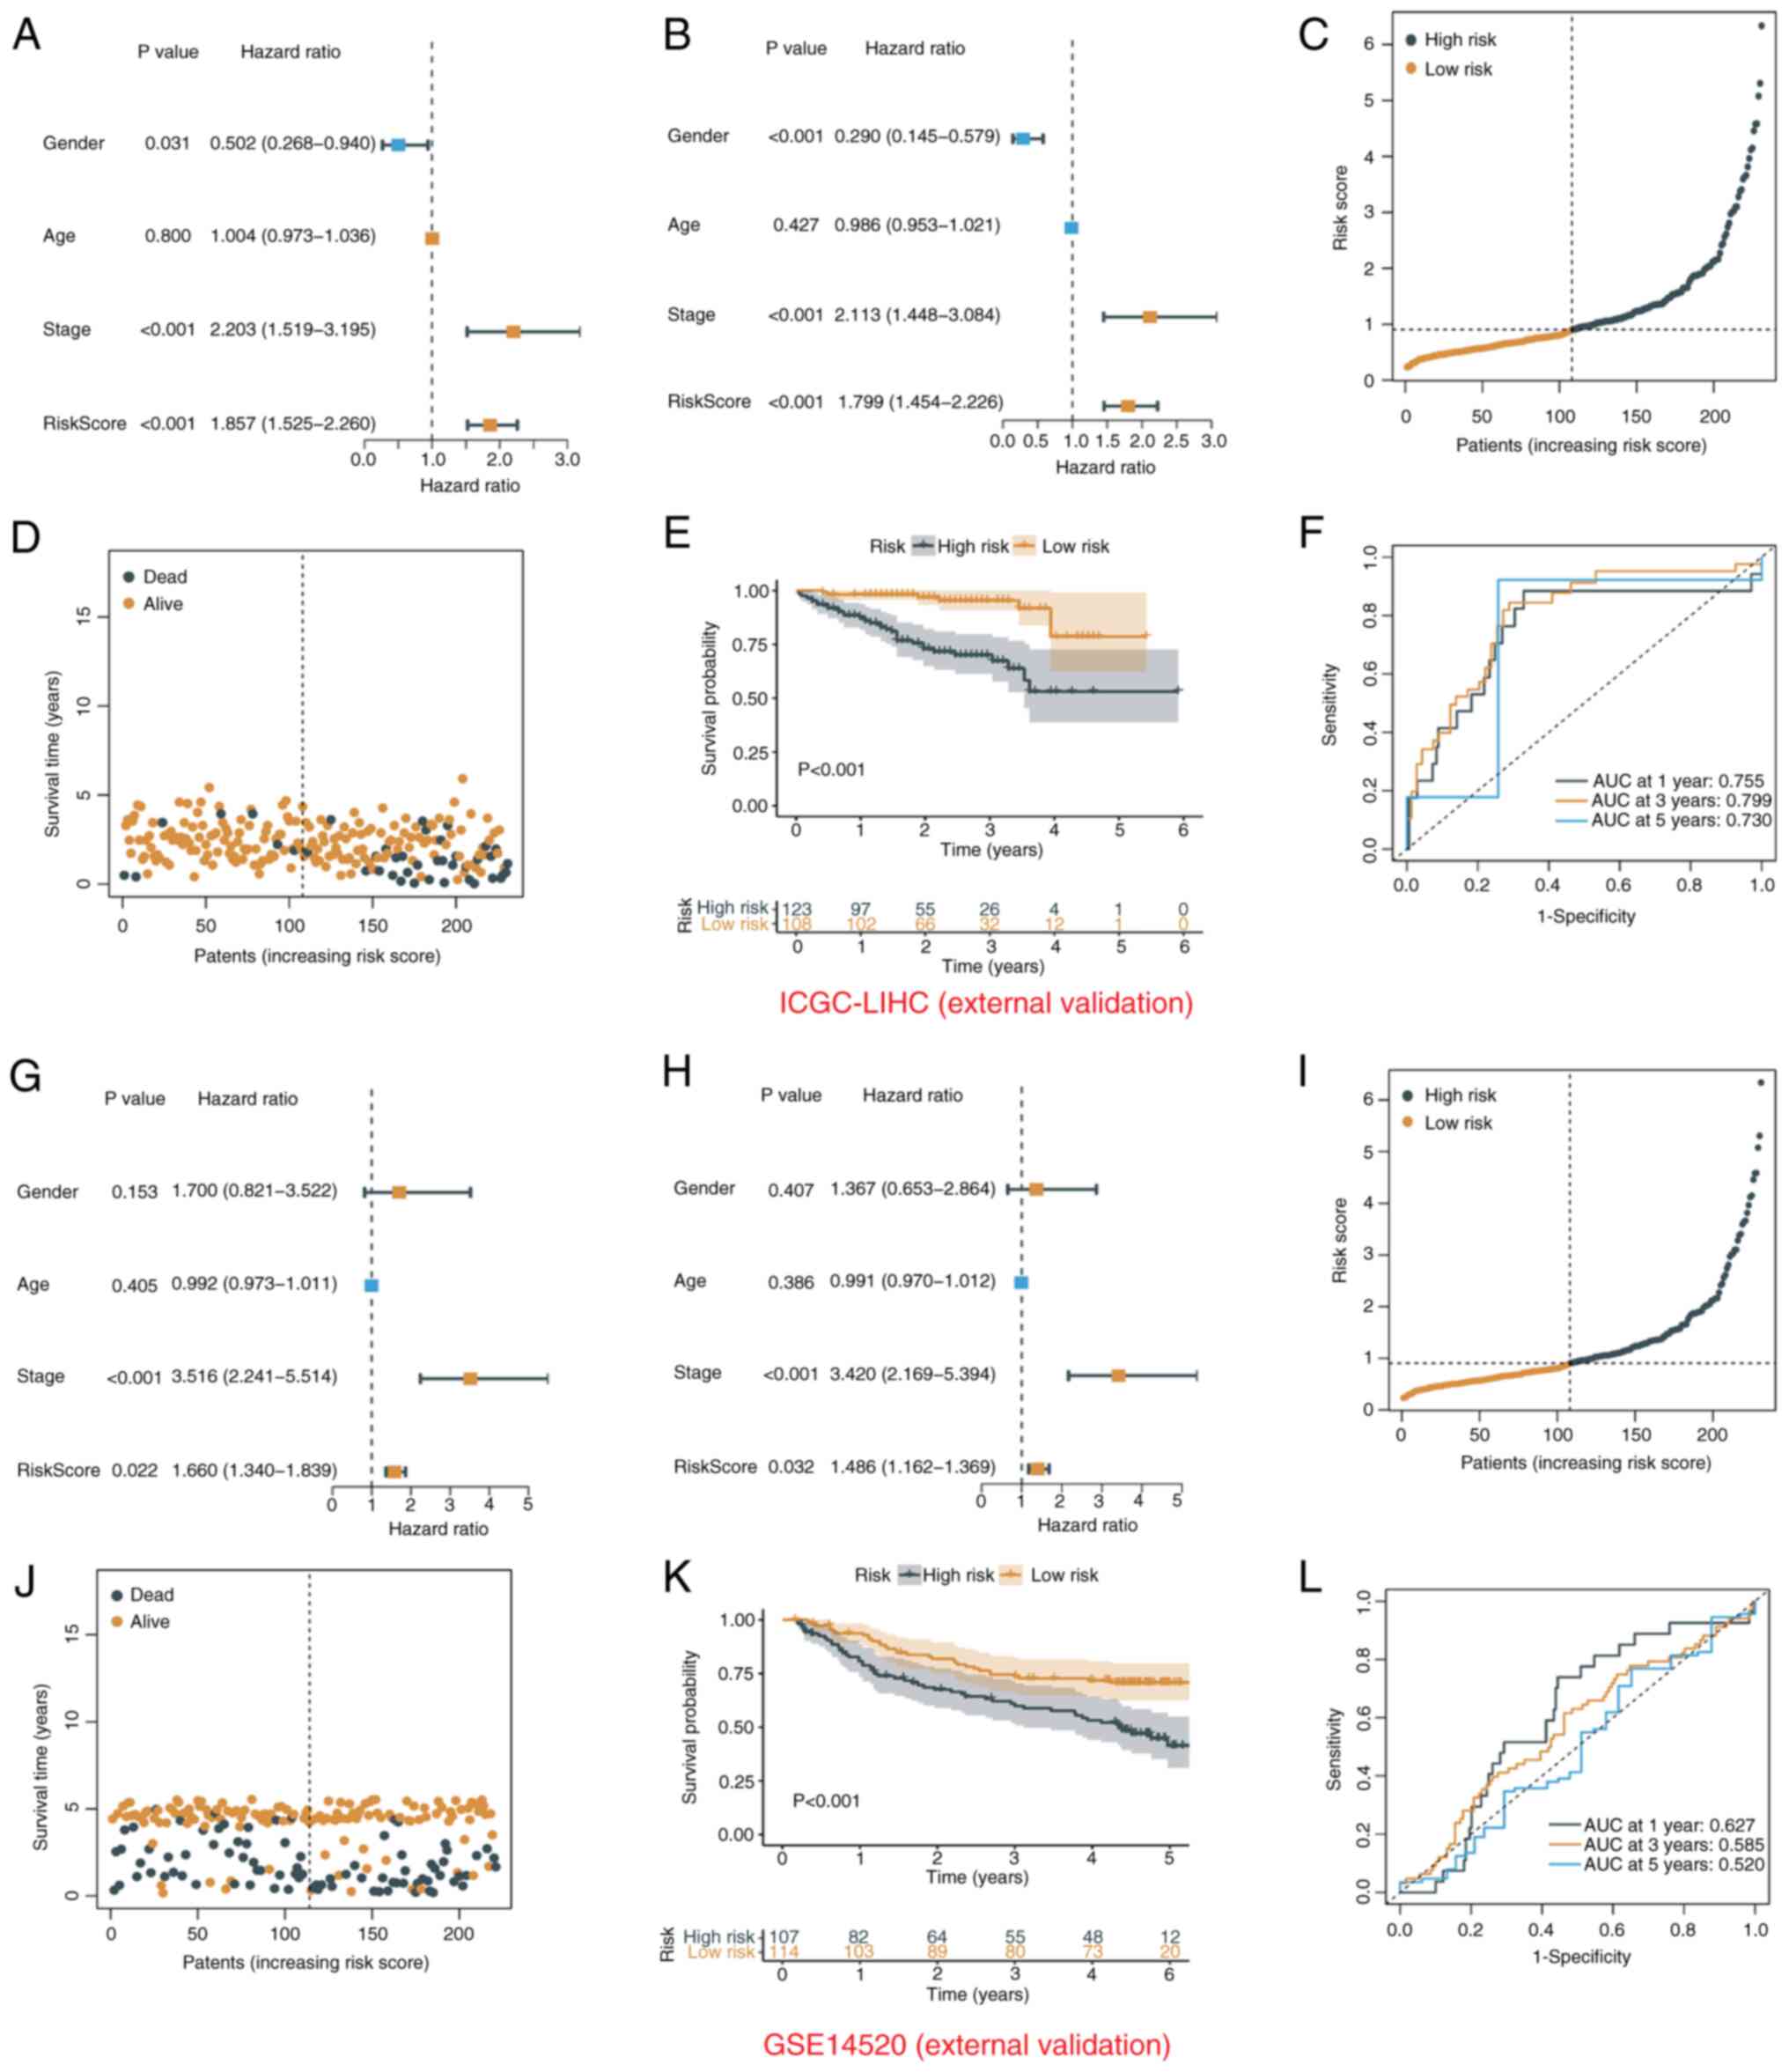
model. A total of 108 low-risk and 123 high-risk patients from the
ICGC-LIHC group were found. In the GSE14520 cohort, 107 high-risk
and 114 low-risk patients were identified. In the ICGC-LIHC cohort,
the risk score was an independent prognostic indicator (Fig. 5A and B) and survival time decreased
significantly with increasing risk score (Fig. 5C-E). ROC curve analysis also showed
the excellent predictive power of the risk score (1-year AUC,
0.755; 3-year AUC, 0.799; 5-year AUC, 0.730; Fig. 5F). In the GSE14520 cohort, the risk
score was also an independent prognostic factor and a good
predictor of survival risk (Fig.
5G-L).
Analysis of immune infiltration
In addition to TACE therapy, patients with liver
cancer can also receive immunotherapy to improve the therapeutic
effect. Immune infiltrating cells are a key part of the TME, which
is vital for tumor development, therapy response and patient
prognosis. The present study assessed TME as a whole in TCGA-LIHC
cohort using the ESTIMATE algorithm and found that tumor purity
scores increased and immune scores decreased as the risk scores
increased (Fig. 6A and B).
Increasing evidence suggests that there is a strong correlation
between enhanced stem-cell-related biomarker expression in tumor
cells and drug resistance, cancer recurrence and tumor growth
(41). Thus, the relationship
between the risk scores and DNA stem cell score (DNAss) and RNA
stem cell score (RNAss) were evaluated. The present study revealed
a substantial positive correlation between the risk score and DNA
and RNA concentrations. The gene mutation status of the groups with
high and low risk scores was also compared. Considering the
important effect of stemness index on immunotherapy, correlation
analysis showed that DNAss and RNAss increased with risk score
(Fig. 6C and D). The identified
immune subtypes were analyzed. Thorsson et al (19) defined six immunoexpression signature
subtypes based on the gene expression profile of all solid tumors
in TCGA, including Wound Healing (Immune C1), IFN-γ Dominant
(Immune C2), Inflammatory (Immune C3), Lymphocyte Depleted (Immune
C4), Immunologically Quiet (Immune C5) and TGF-β Dominant (Immune
C6). The present study found a higher proportion of the lymphocyte
depleted subtype in high-risk patients and the highest expression
of the risk scores in the Wound Healing subtype (Fig. 6E and F). To determine the number of
immune cells present in various samples, a variety of algorithms
were used, including TIMER, CIBERSORT, QUANTISEQ, MCP-counter,
XCELL and EPIC. The abundance of killer immune cells, such as
CD4+ and CD8+ T cells, increased as the risk
score increased (Fig. 6G). At the
same time, there were also differences in the distribution of
immune cells among the different risk subtypes (Fig. 6H). To verify the survival prediction
and treatment reflection predictive value of the risk score in the
immunotherapy cohort, it was tested in different Imvigor-210
immunotherapy cohorts. The results showed that the risk score also
had a prognostic value in different immunotherapy cohorts (Fig. 6I). In low-risk patients, there was
an improved response to immunotherapy, with complete
response/partial response accounting for 29% compared with 17% in
high-risk patients (Fig. 6J).
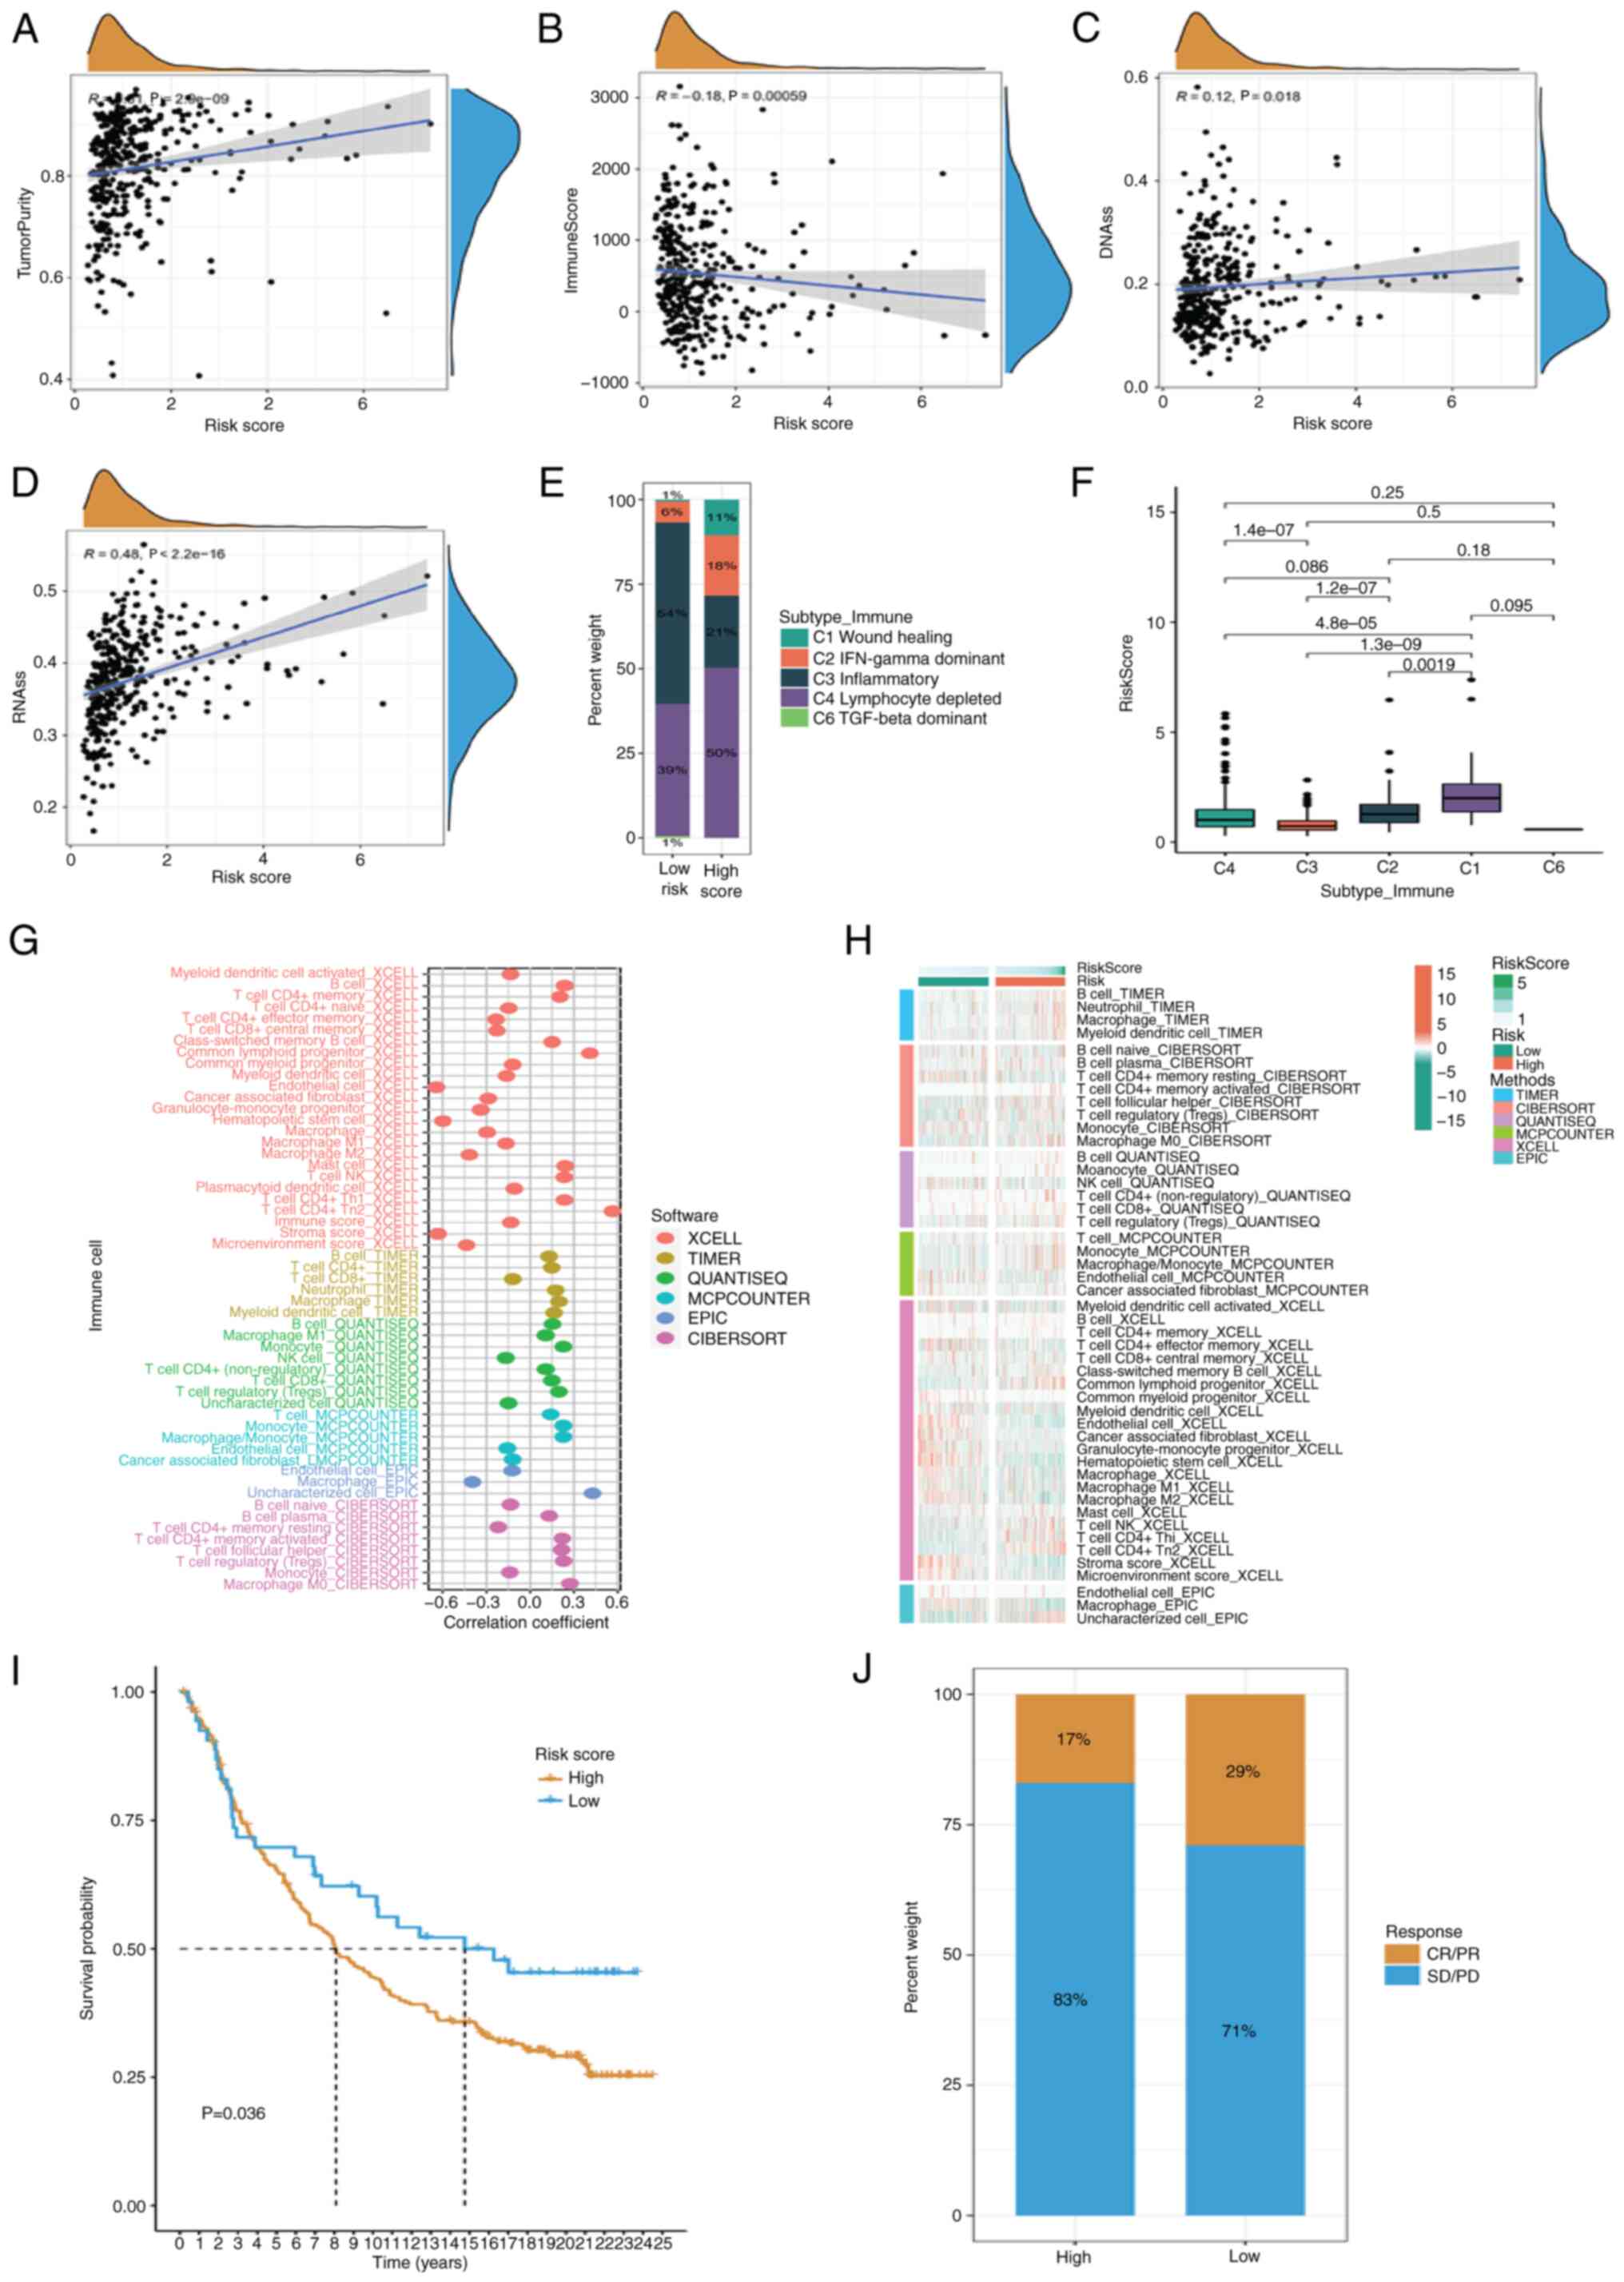 | Figure 6.Analysis of immune infiltration.
ESTIMATE algorithm was used to evaluate TME. (A) Tumor purity, (B)
immune score, (C) correlation of DNAss and (D) RNAss with different
risk score. (E and F) Percentage of identified immune subtypes in
patients at different risk. (G) Different algorithms such as TIMER,
CIBERSORT, QUANTISEQ, MCP-counter, XCELL and EPIC were used to
estimate immune cell abundance in different samples. (H)
Differences in the distribution of immune cells in different risk
subtypes. (I) Imvigor-210 immunotherapy cohort was used to validate
the prognostic value of risk scores. (J) Proportion of complete/PR
and SD/PD in different risk groups. DNAss, DNA stem cell score;
RNAss, RNA stem cell score; PR, Partial Response; SD, Stable
Disease; PD, Progressive Disease |
Expression and prognostic profile of
four TRTs
The present study compared the expression profiles
of four TRTs in normal and tumor tissues obtained from TCGA and
Genotype-Tissue Expression databases, including paired and unpaired
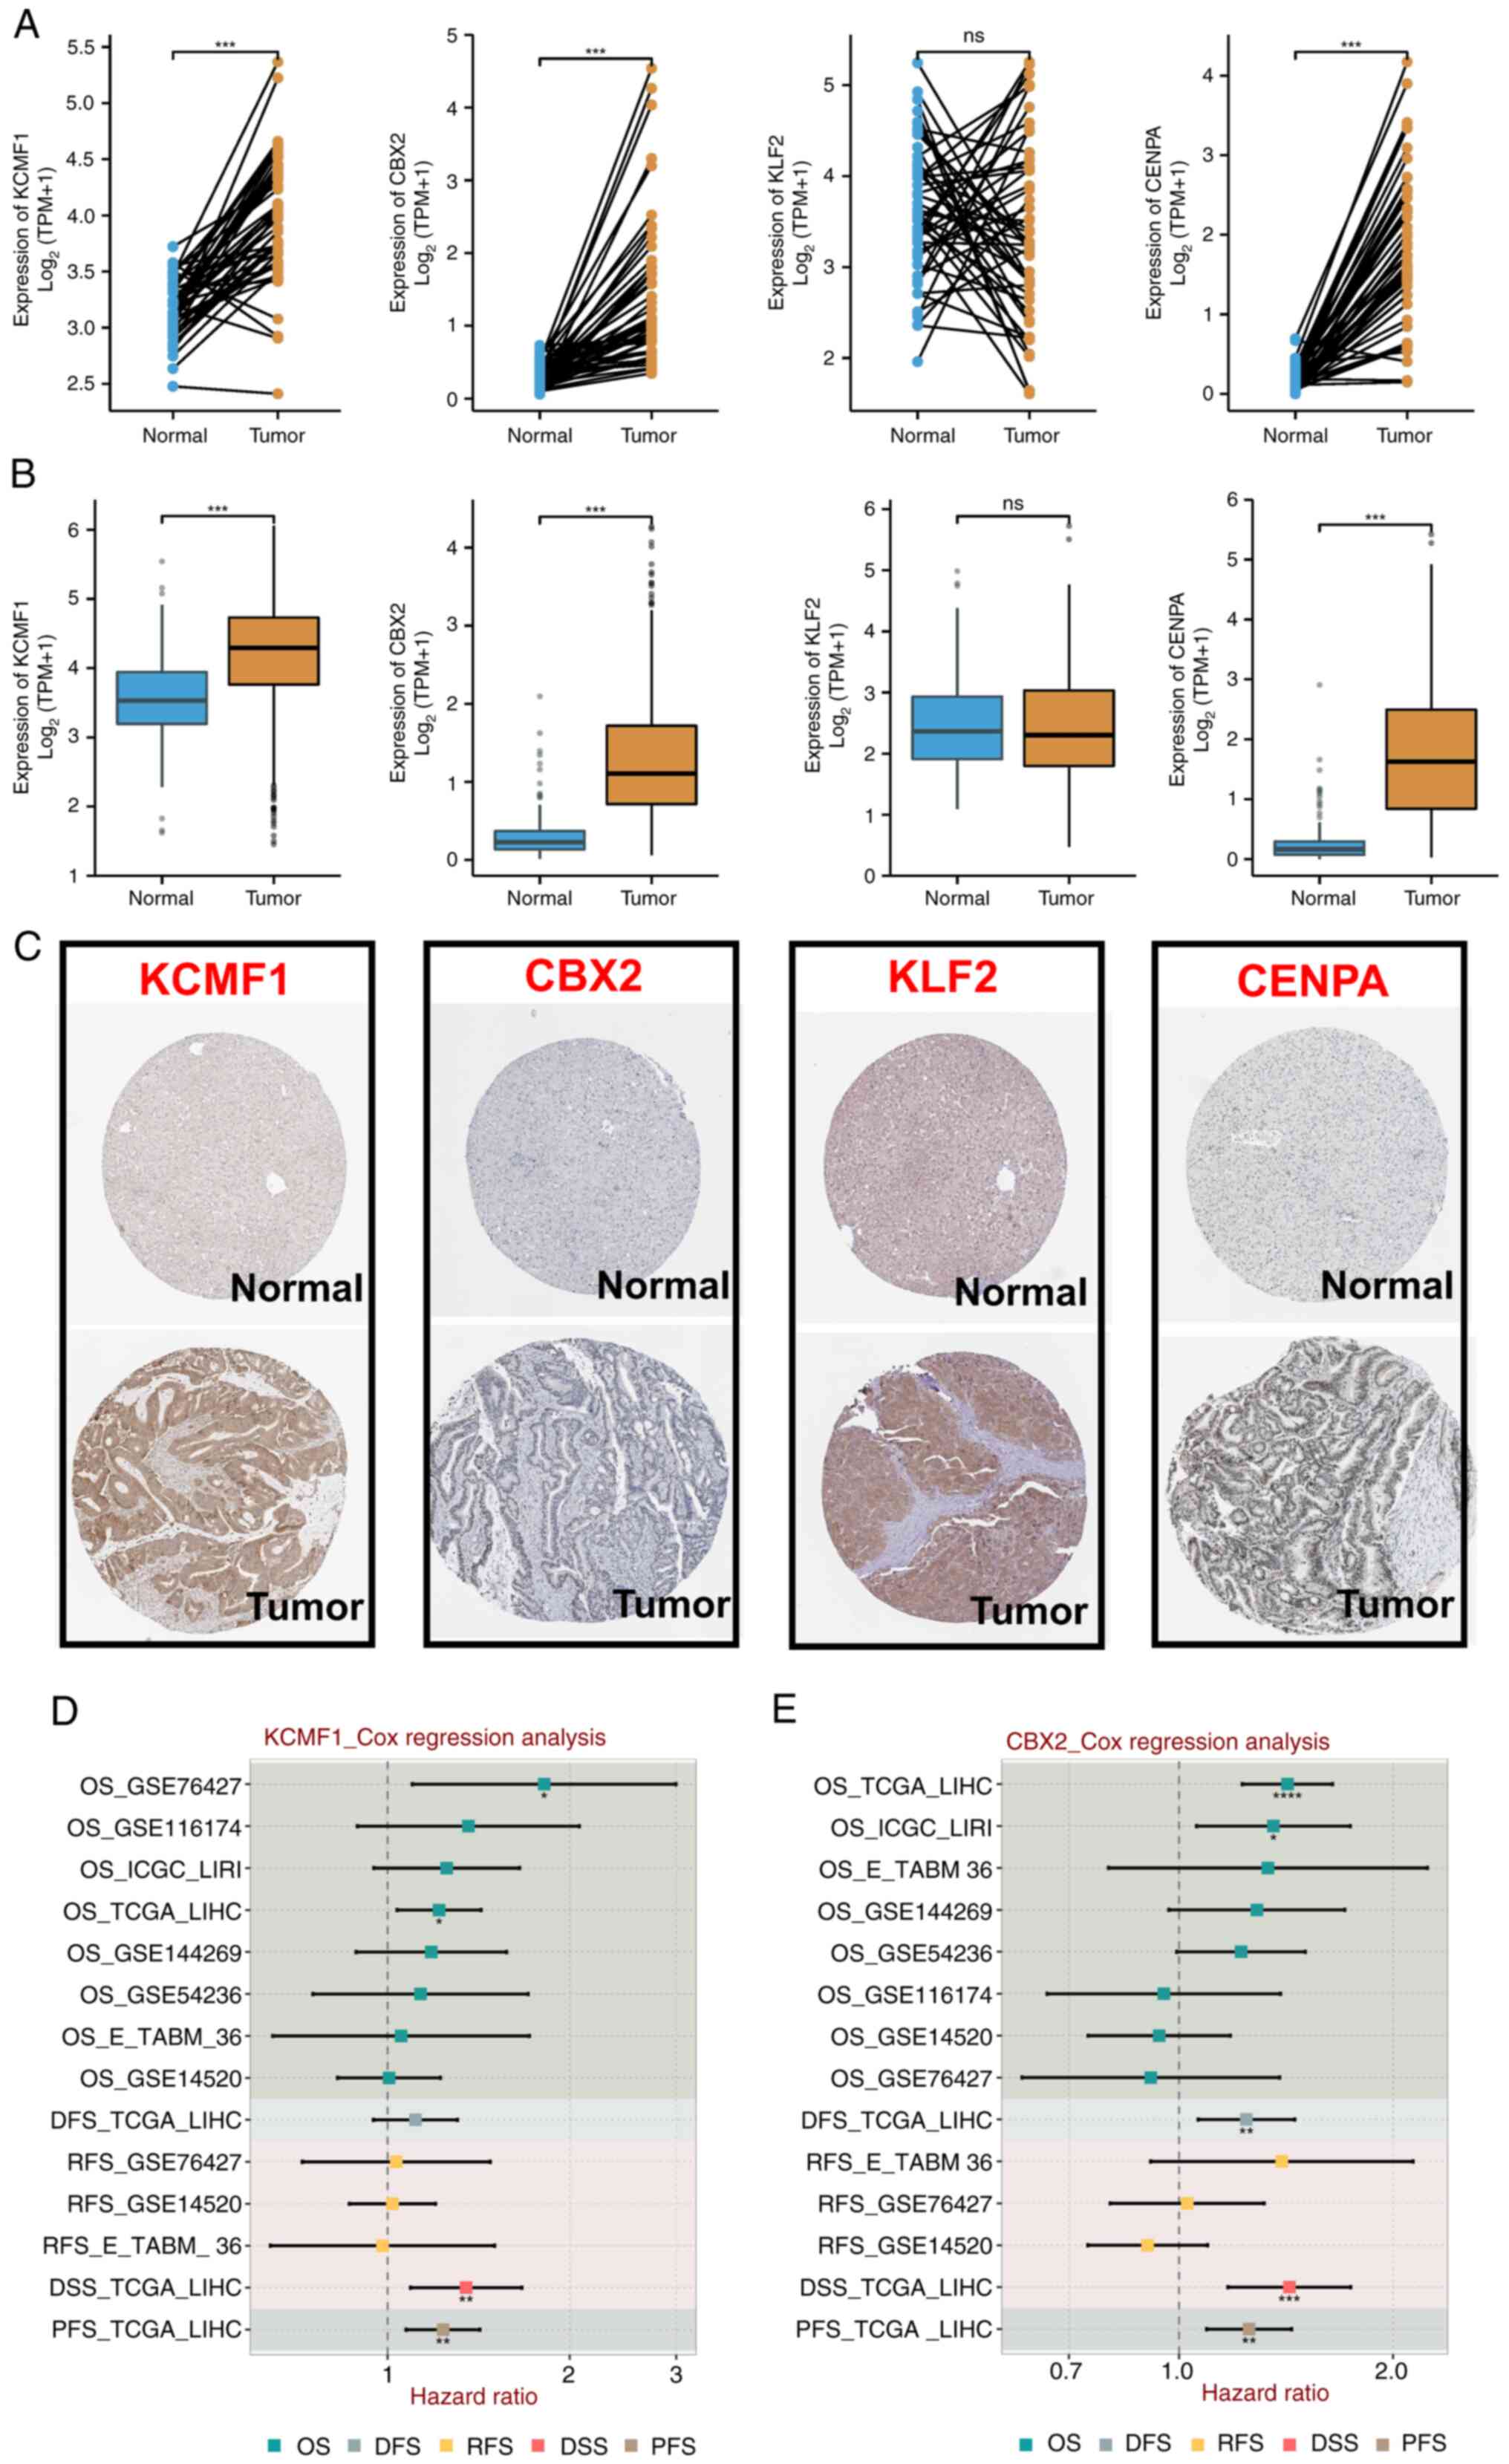
samples. Expression of CENPA, KCMF1 and CBX2 in tumor tissues was
significantly higher than in normal tissues, while expression of
KLF2 was not significantly different (Fig. 7A and B). Expression of the
aforementioned four TRTs in different groups in the Human Protein
Atlas (HPA) database were detected. Protein expression was more
consistent with mRNA expression. Compared with normal tissue,
protein staining in tumor tissue was stronger (Fig. 7C). Cox regression analysis was
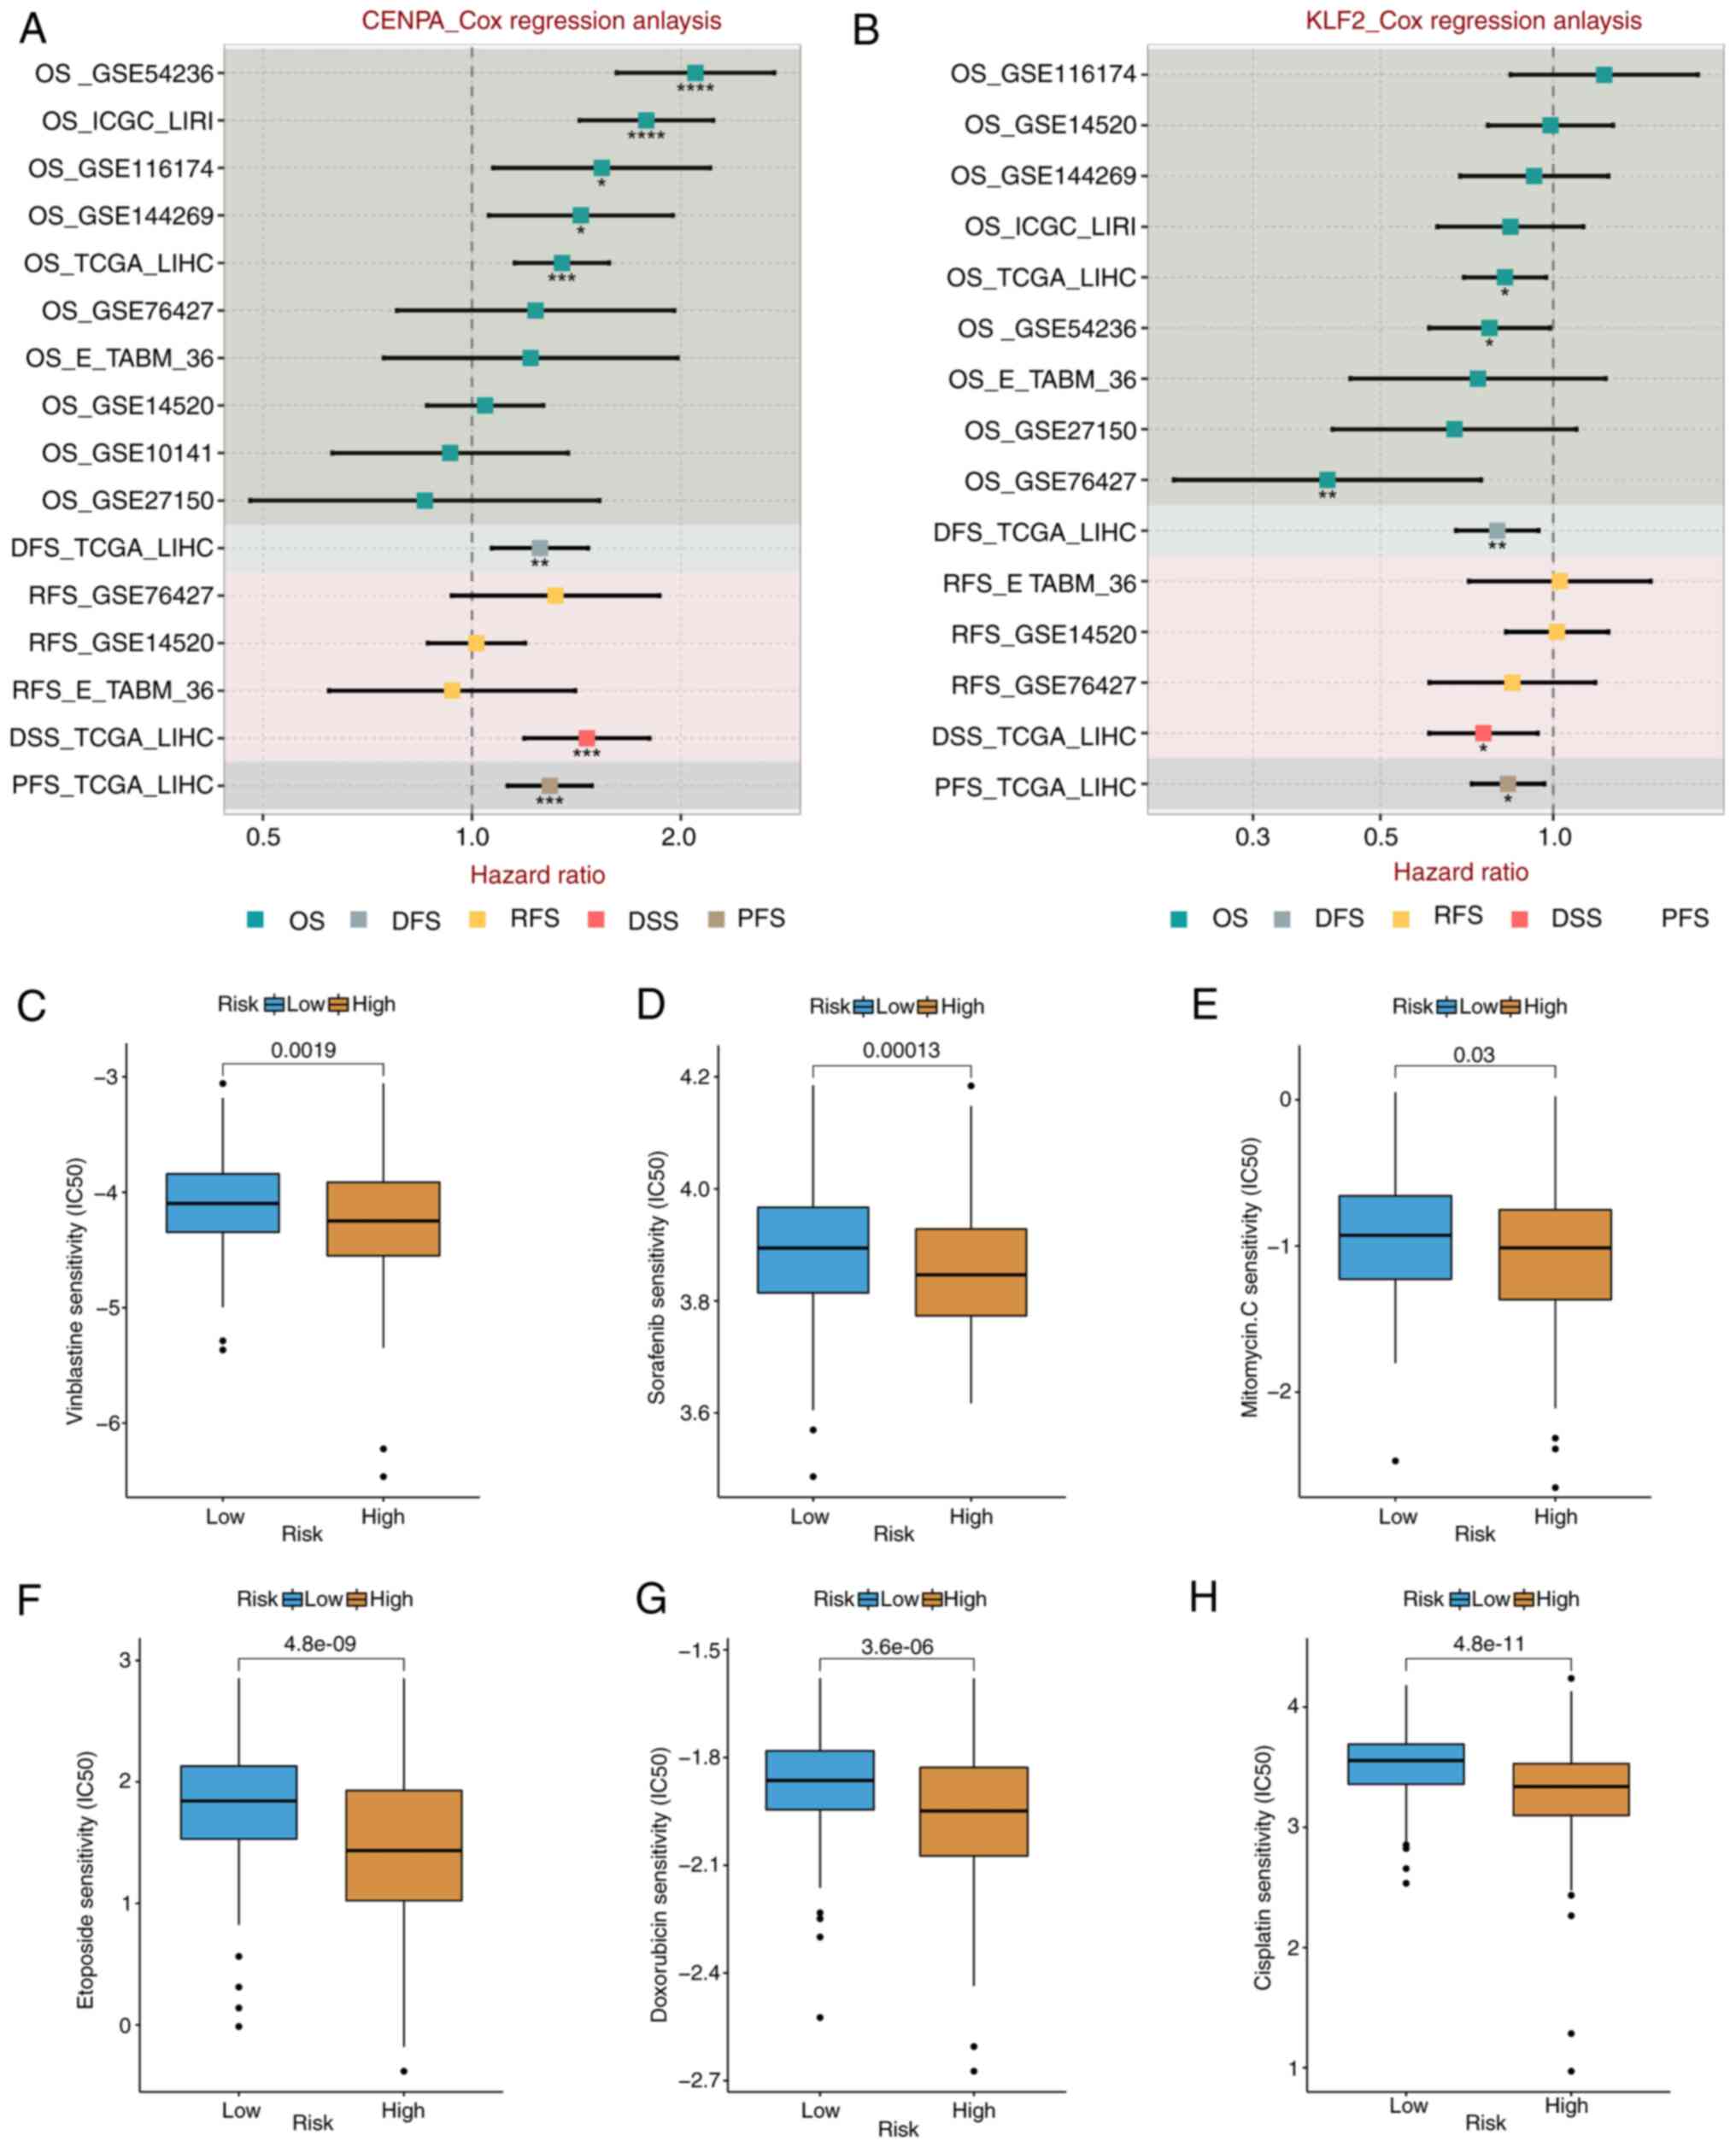
performed on expression of CENPA, KCMF1, CBX2, KLF2 and various
prognostic outcomes in multiple HCC cohorts. KCMF1 was a risk
factor in four cohorts (Fig. 7D);
CBX2 was a risk factor in cohorts (Fig.
7E); CENPA was a risk factor in eight cohorts (Fig. 8A); and KLF2 was a protective factor
in six cohorts (Fig. 8B). These
results demonstrated that the prognostic indicators of different
TRTs were consistent.
Drug sensitivity analysis
Due to the limitations of systemic chemotherapy,
most patients with advanced HCC have the option of local therapy
based on TACE, which delivers chemotherapeutic drugs to the region
surrounding the tumor (42).
According to the enrichment analysis discussed aforementioned,
patients in the various risk groups may have variable medication
sensitivity and metabolism. The present study measured
IC50 values of the drugs frequently used in the
treatment of HCC, such as vincristine, sorafenib, mitomycin,
etoposide, doxorubicin and cisplatin. The IC50 value of
platinum was significantly lower in the high-risk group than in the
low-risk group (both P<0.05) (Fig.
8C-H). These results suggested that high-risk patients were
more sensitive to commonly used chemotherapy and targeted drug
therapy for HCC.
Risk score at a single-cell level
treated with ICIs
Considering bulk-RNA-sequencing data, risk scores
based on CENPA, KLF2, KCMF1 and CBX2 are good indicators of TME.
Therefore, analyses were performed in the GSE125449 single-cell
sequencing dataset, to assess changes in risk scores in various
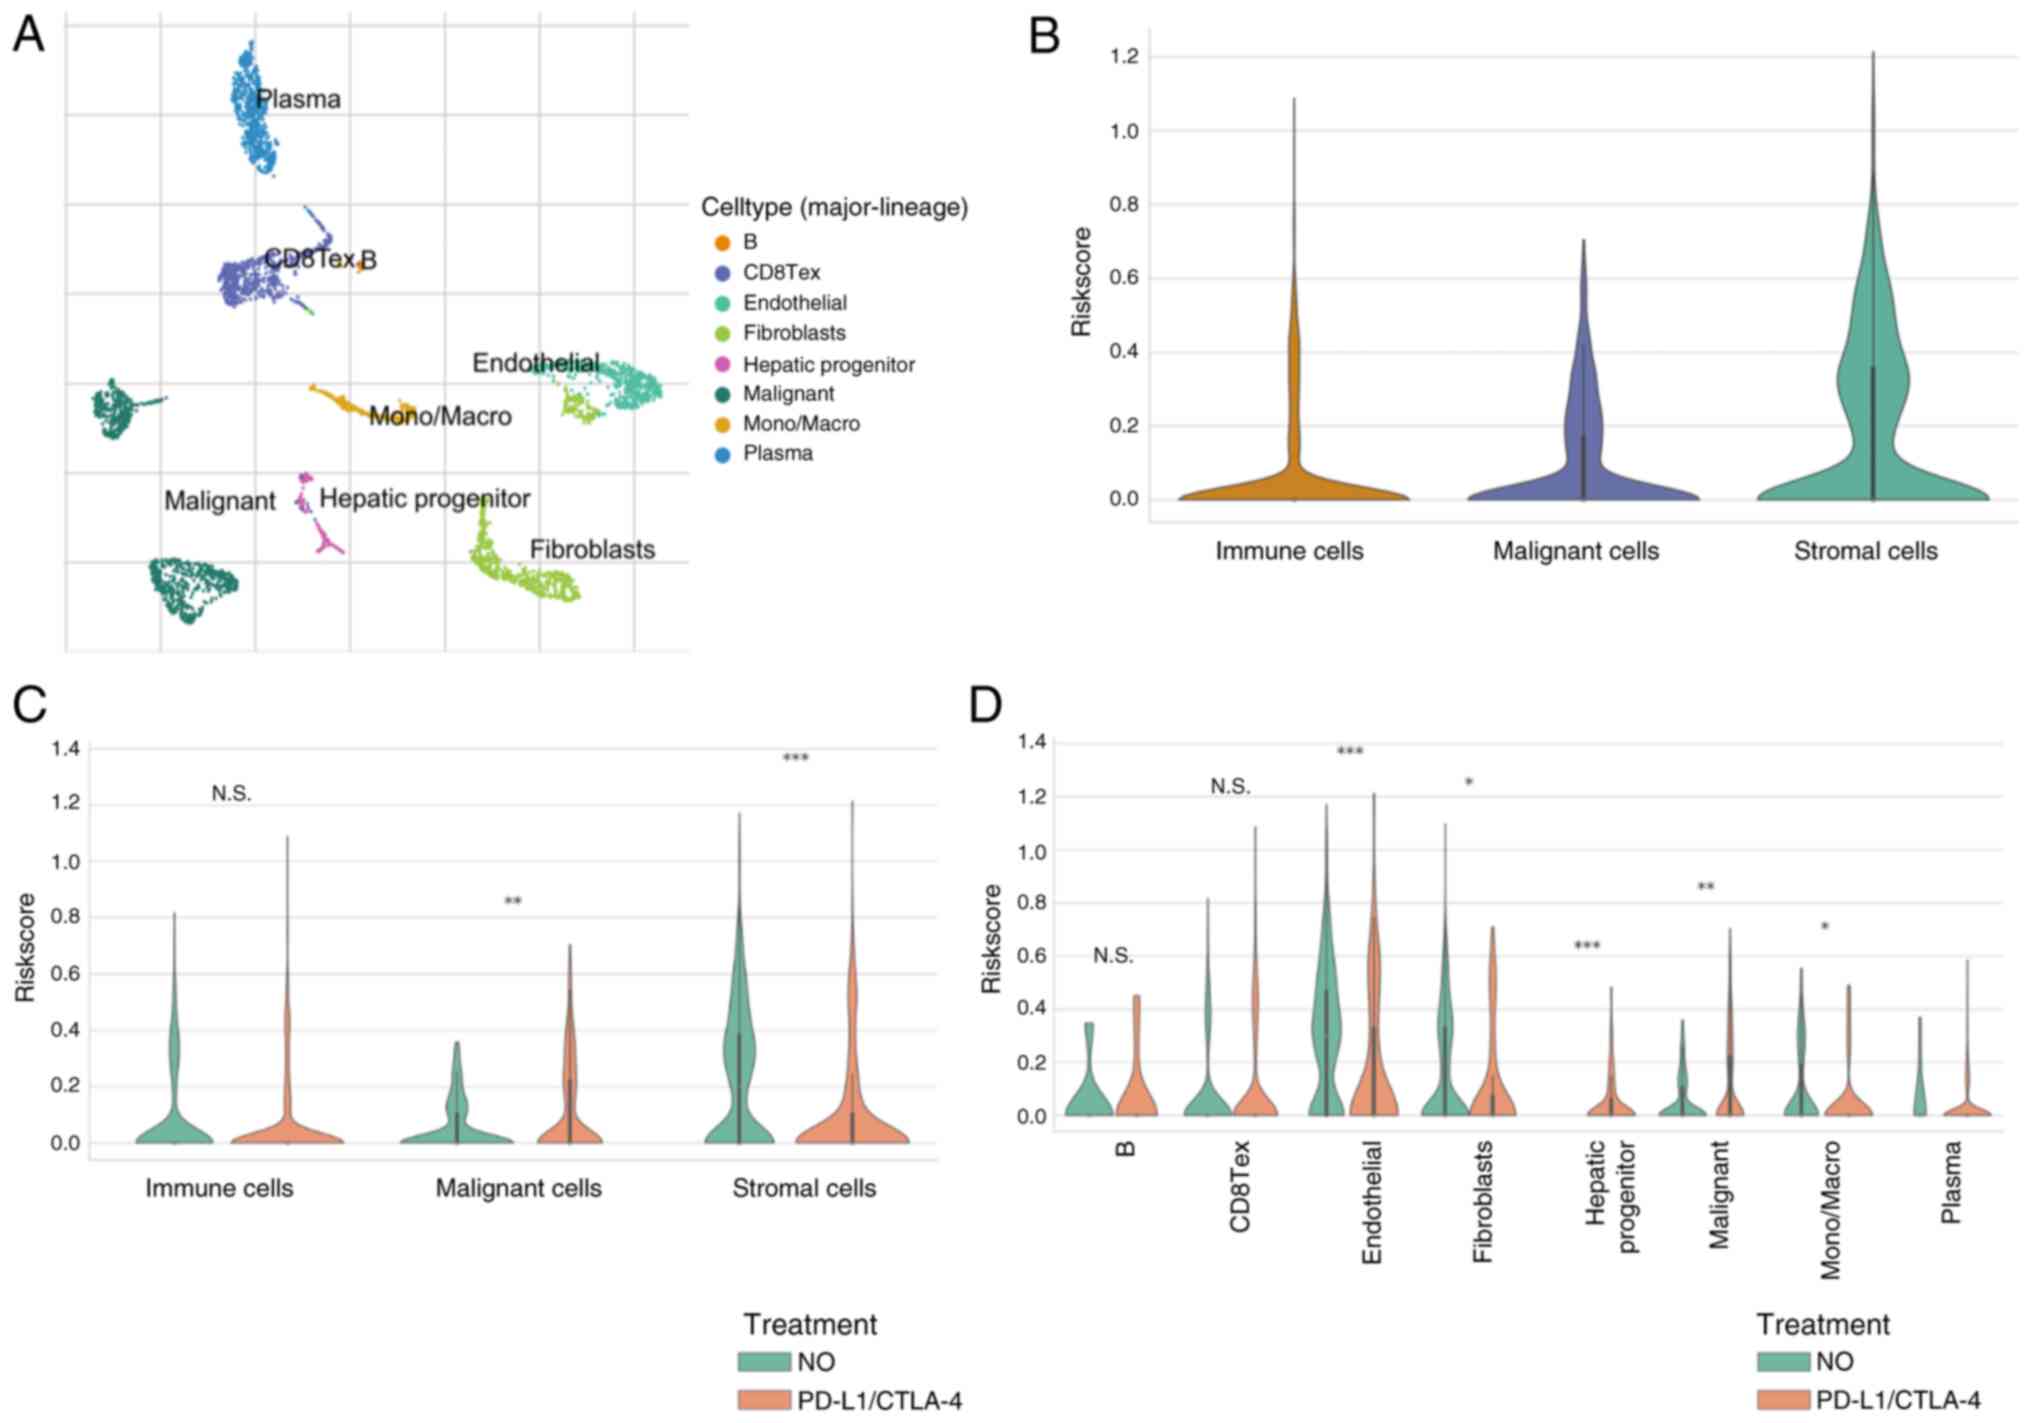
types of cell before and after ICI treatment. The GSE125449
single-cell sequencing dataset was annotated based on the TISCH
database (Fig. 9A) and the risk
scores in different cells were calculated. Expression of risk
scores was higher in interstitial cells (Fig. 9B). After treatment with ICIs, the
risk score increased in tumor cells but decreased in stromal cells
(Fig. 9C). Cell-type-specific
analyses was performed and showed that the risk scores in liver
progenitors changed significantly after ICI treatment (Fig. 9D).
Validation of TRTs in HCC cell
lines
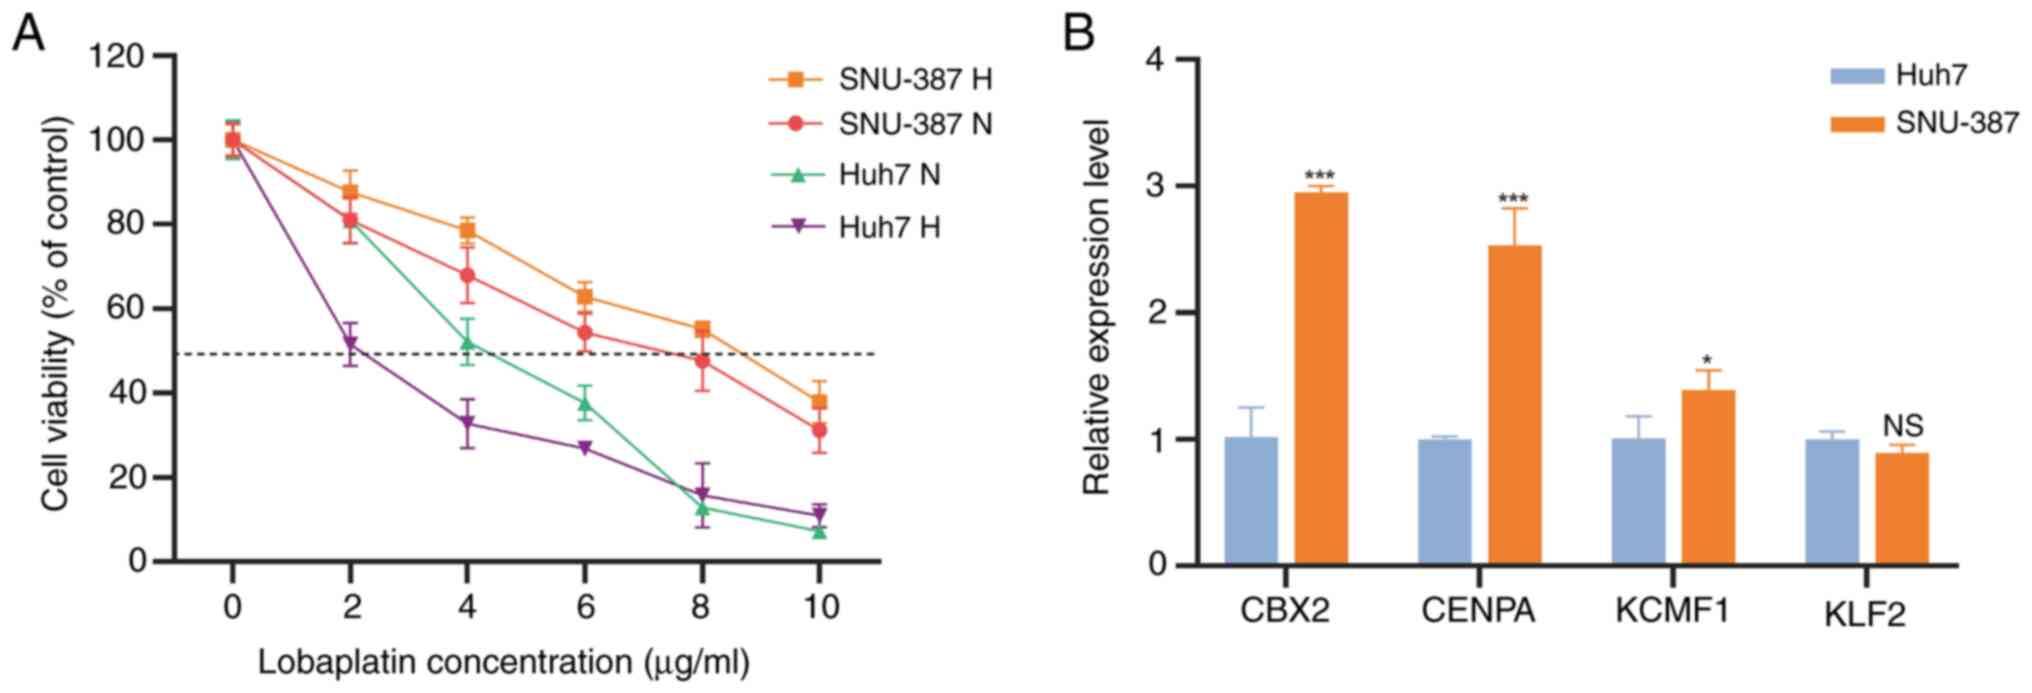
SNU-387 and Huh7 cells were simultaneously cultured
under hypoxia (1% O2) and normoxia for 48 h to mimic
TACE. The present study detected the IC50 of lobaplatin,
the first-line drug for TACE treatment, in these cell types.
Compared with normal oxygen concentration, the IC50 of
SNU-387 lobaplatin cultured under hypoxia was significantly higher,
while that of Huh7 was significantly lower (Fig. 10A). This indicates that SNU-387 is
a TACE-resistant cell line and Huh7 is a TACE nonresistant cell
line. We detected expression of the four TRTs in these two cell
lines. CENPA, KCMF1 and CBX2, which are high-risk factors, were
higher in the resistant cell line SNU-387 than in Huh7 cells.
However, KLF2, the protective factor, showed no difference in
expression between the two cell lines (Fig. 10B).
Discussion
Primary liver cancer, characterized by high
incidence and mortality rates, is a malignant tumor that poses a
serious threat to the lives and health of patients (43). Despite continuous advances in
treatment methods in recent years, the overall efficacy of liver
cancer therapy remains suboptimal. The present study explored the
mechanisms by which TFs influence liver cancer, thereby providing
new insights for improving therapeutic strategies.
The limited effectiveness of current treatments
prompts a critical re-evaluation of existing therapeutic approaches
and highlights gaps in our understanding. While the pivotal role of
TFs in tumor progression is well recognized, their specific
mechanisms in TACE remain inadequately elucidated. This knowledge
gap presents a crucial research opportunity to delve into the
function of TFs and to investigate their role in TACE resistance,
ultimately aiming to optimize treatment regimens.
TFs play a crucial role in tumor progression by
sustaining tumor stemness and regulating the TME, thereby driving
cancer development (44). As our
understanding of the functions of TFs deepens, it is expected that
in the next 5 years, there will be more research focused on their
application in TACE. Specifically, studies on how targeting TFs can
overcome TACE resistance could lead to significant breakthroughs in
liver cancer treatment (45).
Given the critical role of TFs and poor prognosis of
patients following TACE, the present study developed a prognostic
model based on TFs to more accurately assess patient risk and guide
personalized treatment. The model demonstrated potential value in
evaluating the efficacy of TACE, particularly in predicting the
prognosis of high-risk patients. However, the limitations of the
model cannot be overlooked, primarily concerning the sources and
quality of the data. Future research should focus on validating the
model and exploring its applicability across different
populations.
The present study systematically analyzed the role
of transcription-related genes in TACE of HCC patients. It screened
and constructed the predictive model including CENPA, KLF2, KCMF1
and CBX2 for risk assessment of liver cancer patients to determine
the degree of benefit from TACE. Among these genes, CENPA, which
encodes a protein that epigenetically determines the location of
the centromere on each chromosome (46), was significantly upregulated in
liver cancer tissues. It is considered important for metastatic
ability and advanced disease status and may be a biomarker of poor
prognosis and a high likelihood of recurrence (47). As a protective factor in this model,
KLF2 (a host TF that regulates C-C chemokine receptor 5 expression
in CD4+ T cells) is involved in a variety of biochemical
processes in humans, including lung development, embryonic
erythropoiesis, epithelial integrity, T cell viability and
adipogenesis (48). Although KLF2
has been shown to play a role in promoting tumor progression in a
variety of tumors, there may be changes in a number of pathways due
to the unique hypoxia and chemotherapeutic drug microenvironment of
TACE (49), which needs to be
further explored. There are few reports on the relationship between
KCMF1 and tumors. As an evolutionarily highly conserved protein,
increased expression of KCMF1 in the nucleus may be closely related
to pancreatic cancer in mice and humans (50). CBX2 is associated with prognosis of
liver cancer (51).
The present study intersected the genes in the TF
module most associated with TACE response in GSE104580 with the
differential genes in this dataset. As the GSE104580 dataset lacks
survival data, the intersected gene set was placed in TCGA-LIHC
cohort for LASSO-Cox analysis and four TRTs were identified to
build a predictive model. Based on the predictive model, the
patients were divided into high- and low-risk groups and the
stability of the model verified. Immunotherapy provides a new
option for liver cancer. The combination of TACE and immunotherapy
has become a new strategy for advanced liver cancer. It has been
shown that immunotherapy after TACE can prolong and maximize the
immune response to liver cancer by preventing T-cell exhaustion
(12). The combination of TACE and
programmed death protein-1 in the treatment of advanced HCC can
significantly prolong OS (11).
Immune scores were significantly lower in high-risk patients.
Comparing the identified immune subtypes, a higher proportion of
the Lymphocyte Depleted subtype was found in high-risk patients.
After analysis using various immune infiltration algorithms, it was
found that the abundance of killer immune cells, such as
CD4+ and CD8+ T cells, was increased in
high-risk patients. KLF2 in the model negatively controlled the
responsiveness of CD8+ T cells to the C-X-C chemokine
receptor 3 ligand CXCL10, which is consistent with the results of
the present study (52). Sorafenib,
doxorubicin and cisplatin are the first-line drugs for TACE and the
IC50 in the high-risk group was significantly lower than
that in the low-risk group. This suggested that high-risk patients
may be superior candidates for TACE and targeted drug therapy.
Single-cell analysis can provide guidance for precise immunotherapy
of tumors. Mesenchymal stem/stromal cells have high
immunomodulatory activity, are easy to obtain and isolate and have
a strong tropism for inflamed and damaged tissues (53). RNA was extracted from common liver
cancer cell lines. RT-qPCR of genes in the four models revealed the
highest expression of CENPA, CBX2 and CENPA in resistant cells,
which was consistent with the hypothesis.
The present study focused on TFs closely related to
TACE. The predictive model based on TFs was constructed to predict
the prognosis of TACE patients. It was hypothesized that this model
can provide new options for combined immunization and targeted
therapy for TACE patients. However, the present study still had
some limitations. First, the data were from public databases and
lacked more data for verification. Second, the specific regulatory
mechanism between TFs and TACE resistance remain to be elucidated,
which requires further research.
The prognosis and TME status of liver cancer
patients following TACE can be assessed using the predictive model
based on the TF correlation created in the present study. This
predictive model provides a reliable and simplified method to guide
the clinical treatment of HCC patients.
Supplementary Material
Supporting Data
Acknowledgements
Not applicable.
Funding
The present study was supported by Scientific research project
of Jiangsu Provincial Health Commission (project no. Z2022054).
Availability of data and materials
The data generated in the present study are included
in the figures and/or tables of this article.
Authors' contributions
YS and JShi contributed to the conceptualization. XW
and FJ performed the data analyses. JShen participated in data
analysis and study design. JShi wrote the manuscript. JShen
reviewed and edited the manuscript. YS and JShen confirm the
authenticity of all the raw data. JZ interpreted data. All authors
read and approved the final manuscript.
Ethics approval and informed consent
Not applicable.
Patient consent for publication
Not applicable.
Competing interests
The authors declare that they have no competing
interests.
Glossary
Abbreviations
Abbreviations:
|
TACE
|
transcatheter arterial
chemoembolization
|
|
HCC
|
hepatocellular carcinoma
|
|
TFs
|
transcription factors
|
|
OS
|
overall survival
|
|
TRTs
|
TACE refractoriness-related
transcription factors
|
|
TCGA
|
The Cancer Genome Atlas
|
|
GEO
|
Gene Expression Omnibus
|
|
WGCNA
|
weighted gene co-expression network
analysis
|
|
LASSO
|
least absolute shrinkage and selection
operator
|
|
ROC
|
receiver operating characteristic
|
|
IC50
|
half-maximal inhibitory
concentration
|
|
TME
|
tumor microenvironment
|
|
RT-qPCR
|
reverse transcription-quantitative
PCR
|
|
DEGs
|
differentially expressed genes
|
|
DETFs
|
differentially expressed transcription
factors
|
|
GO
|
Gene Ontology
|
|
KEGG
|
Kyoto Encyclopedia of Genes and
Genomes
|
|
TOM
|
topological overlap matrix
|
|
ICIs
|
immune checkpoint inhibitors
|
|
HBV
|
Hepatitis B virus
|
|
HPA
|
Human Protein Atlas
|
|
MSCs
|
mesenchymal stem/stromal cells
|
|
GDSC
|
Genomics of Cancer Drug
Sensitivity
|
References
|
1
|
Bray F, Laversanne M, Sung H, Ferlay J,
Siegel RL, Soerjomataram I and Jemal A: Global cancer statistics
2022: GLOBOCAN estimates of incidence and mortality worldwide for
36 cancers in 185 countries. CA Cancer J Clin. 74:229–263. 2024.
View Article : Google Scholar : PubMed/NCBI
|
|
2
|
Di Bisceglie AM: Hepatitis B and
hepatocellular carcinoma. Hepatology. 49 (5 Suppl):S56–S60. 2009.
View Article : Google Scholar : PubMed/NCBI
|
|
3
|
Deng ZJ, Li L, Teng YX, Zhang YQ, Zhang
YX, Liu HT, Huang JL, Liu ZX, Ma L and Zhong JH: Treatments of
hepatocellular carcinoma with portal vein tumor thrombus: Current
status and controversy. J Clin Transl Hepatol. 10:147–158. 2022.
View Article : Google Scholar : PubMed/NCBI
|
|
4
|
Frenette CT, Osorio RC, Stark J, Fok B,
Boktour MR, Guy J, Rhee J and Osorio RW: Conventional TACE and
drug-eluting bead TACE as locoregional therapy before orthotopic
liver transplantation: Comparison of explant pathologic response.
Transplantation. 98:781–787. 2014. View Article : Google Scholar : PubMed/NCBI
|
|
5
|
Miksad RA, Ogasawara S, Xia F, Fellous M
and Piscaglia F: Liver function changes after transarterial
chemoembolization in US hepatocellular carcinoma patients: The
LiverT study. BMC Cancer. 19:7952019. View Article : Google Scholar : PubMed/NCBI
|
|
6
|
Sergio A, Cristofori C, Cardin R, Pivetta
G, Ragazzi R, Baldan A, Girardi L, Cillo U, Burra P, Giacomin A and
Farinati F: Transcatheter arterial chemoembolization (TACE) in
hepatocellular carcinoma (HCC): The role of angiogenesis and
invasiveness. Am J Gastroenterol. 103:914–921. 2008. View Article : Google Scholar : PubMed/NCBI
|
|
7
|
Kudo M, Matsui O, Izumi N, Kadoya M,
Okusaka T, Miyayama S, Yamakado K, Tsuchiya K, Ueshima K, Hiraoka
A, et al: Transarterial chemoembolization failure/refractoriness:
JSH-LCSGJ criteria 2014 update. Oncology. 87 (Suppl 1):S22–S31.
2014. View Article : Google Scholar
|
|
8
|
Sahin TK, Rizzo A, Aksoy S and Guven DC:
Prognostic significance of the royal Marsden hospital (RMH) score
in patients with cancer: A systematic review and Meta-analysis.
Cancers (Basel). 16:18352024. View Article : Google Scholar : PubMed/NCBI
|
|
9
|
Rizzo A, Ricci AD and Brandi G:
Trans-arterial chemoembolization plus systemic treatments for
hepatocellular carcinoma: An update. J Pers Med. 12:17882022.
View Article : Google Scholar : PubMed/NCBI
|
|
10
|
Rizzo A, Dadduzio V, Ricci AD, Massari F,
Di Federico A, Gadaleta-Caldarola G and Brandi G: Lenvatinib plus
pembrolizumab: The next frontier for the treatment of
hepatocellular carcinoma? Expert Opin Investig Drugs. 31:371–378.
2022. View Article : Google Scholar : PubMed/NCBI
|
|
11
|
Qin J, Huang Y, Zhou H and Yi S: Efficacy
of sorafenib combined with immunotherapy following transarterial
chemoembolization for advanced hepatocellular carcinoma: A
Propensity Score Analysis. Front Oncol. 12:8071022022. View Article : Google Scholar : PubMed/NCBI
|
|
12
|
Zhang JX, Chen P, Liu S, Zu QQ, Shi HB and
Zhou CG: Safety and efficacy of transarterial chemoembolization and
immune checkpoint inhibition with camrelizumab for treatment of
unresectable hepatocellular carcinoma. J Hepatocell Carcinoma.
9:265–272. 2022. View Article : Google Scholar : PubMed/NCBI
|
|
13
|
Rizzo A, Ricci AD and Brandi G: Systemic
adjuvant treatment in hepatocellular carcinoma: Tempted to do
something rather than nothing. Future Oncol. 16:2587–2589. 2020.
View Article : Google Scholar : PubMed/NCBI
|
|
14
|
Latchman DS: Transcription factors: An
overview. Int J Biochem Cell Biol. 29:1305–1312. 1997. View Article : Google Scholar : PubMed/NCBI
|
|
15
|
Bushweller JH: Targeting transcription
factors in cancer-from undruggable to reality. Nat Rev Cancer.
19:611–624. 2019. View Article : Google Scholar : PubMed/NCBI
|
|
16
|
He Q, Li W, Ren J, Huang Y, Huang Y, Hu Q,
Chen J and Chen W: ZEB2 inhibits HBV transcription and replication
by targeting its core promoter. Oncotarget. 7:16003–16011. 2016.
View Article : Google Scholar : PubMed/NCBI
|
|
17
|
Takada H and Kurisaki A: Emerging roles of
nucleolar and ribosomal proteins in cancer, development, and aging.
Cell Mol Life Sci. 72:4015–4025. 2015. View Article : Google Scholar : PubMed/NCBI
|
|
18
|
Zhang G and Zhang G: Upregulation of FoxP4
in HCC promotes migration and invasion through regulation of EMT.
Oncol Lett. 17:3944–3951. 2019.PubMed/NCBI
|
|
19
|
replot (Version sva v3.46.0) [Computer
software], . 2023.Retrieved from. https://github.com/jtleek/sva-devel
|
|
20
|
Lambert SA, Jolma A, Campitelli LF, Das
PK, Yin Y, Albu M, Chen X, Taipale J, Hughes TR and Weirauch MT:
The human transcription factors. Cell. 172:650–665. 2018.
View Article : Google Scholar : PubMed/NCBI
|
|
21
|
Hume MA, Barrera LA, Gisselbrecht SS and
Bulyk ML: UniPROBE, update 2015: New tools and content for the
online database of protein-binding microarray data on protein-DNA
interactions. Nucleic Acids Res. 43((Database Issue)): D117–D122.
2015. View Article : Google Scholar : PubMed/NCBI
|
|
22
|
Wingender E, Schoeps T, Haubrock M, Krull
M and Dönitz J: TFClass: Expanding the classification of human
transcription factors to their mammalian orthologs. Nucleic Acids
Res. 46:D343–D347. 2018. View Article : Google Scholar : PubMed/NCBI
|
|
23
|
replot (Version 4.0.5) [Computer
software], . 2023.Retrieved from. http://www.R-project.org/
|
|
24
|
replot (Version limma v3.52.0) [Computer
software], . 2023.Retrieved from. https://bioconductor.org/packages/release/bioc/html/limma.html
|
|
25
|
replot (Version pheatmap v1.0.12)
[Computer software], . 2019.Retrieved from. https://cran.r-project.org/web/packages/pheatmap/index.html
|
|
26
|
replot (Version clusterProfiler v4.4.0)
[Computer software], . 2023.Retrieved from. https://bioconductor.org/packages/release/bioc/html/clusterProfiler.html
|
|
27
|
replot (Version WGCNA v1.68) [Computer
software], . 2021.Retrieved from. https://cran.r-project.org/web/packages/WGCNA/index.html
|
|
28
|
replot (Version v1.0.0) [Computer
software], . 2023.Retrieved from. https://cran.r-project.org/web/packages/replot/index.html
|
|
29
|
replot (Version TIMER v2.0) [Computer
software], . 2020.Retrieved from. http://timer.cistrome.org/
|
|
30
|
replot (Version CIBERSORT v1.06) [Computer
software], . 2015.Retrieved from. https://cibersort.stanford.edu/
|
|
31
|
replot (Version quanTIseq v1.0) [Computer
software], . 2019.Retrieved from. https://icbi.i-med.ac.at/software/quantiseq/doc/
|
|
32
|
replot (Version MCP-counter v1.2.0)
[Computer software], . 2021.Retrieved from. https://github.com/ebecht/MCPcounter
|
|
33
|
replot (Version xCell v1.1.0) [Computer
software], . 2017.Retrieved from. https://xcell.ucsf.edu/
|
|
34
|
replot (Version EPIC v1.1) [Computer
software], . 2020.Retrieved from. https://gfellerlab.shinyapps.io/EPIC_1-1/
|
|
35
|
replot (Version ESTIMATE v1.0.13)
[Computer software], . 2013.Retrieved from. https://bioinformatics.mdanderson.org/estimate/
|
|
36
|
Yoshihara K, Shahmoradgoli M, Martinez E,
Vegesna R, Kim H, Torres-Garcia W, Treviño V, Shen H, Laird PW,
Levine DA, et al: Inferring tumour purity and stromal and immune
cell admixture from expression data. Nat Commun. 4:26122013.
View Article : Google Scholar : PubMed/NCBI
|
|
37
|
Thorsson V, Gibbs DL, Brown SD, Wolf D,
Bortone DS, Ou Yang TH, Porta-Pardo E, Gao GF, Plaisier CL, Eddy
JA, et al: The immune landscape of cancer. Immunity. 48:812–30.e14.
2018. View Article : Google Scholar : PubMed/NCBI
|
|
38
|
Geeleher P, Cox NJ and Huang RS: Clinical
drug response can be predicted using baseline gene expression
levels and in vitro drug sensitivity in cell lines. Genome Biol.
15:R472014. View Article : Google Scholar : PubMed/NCBI
|
|
39
|
replot (Version pRRophetic v1.0.2)
[Computer software], . 2024.Retrieved from. https://github.com/paulgeeleher/pRRophetic2
|
|
40
|
Livak KJ and Schmittgen TD: Analysis of
relative gene expression data using real-time quantitative PCR and
the 2(−Delta Delta C(T)) method. Methods. 25:402–408. 2001.
View Article : Google Scholar : PubMed/NCBI
|
|
41
|
Luo Q and Vogeli TA: A Methylation-Based
reclassification of bladder cancer based on immune cell genes.
Cancers (Basel). 12:30542020. View Article : Google Scholar : PubMed/NCBI
|
|
42
|
Shin SW: The current practice of
transarterial chemoembolization for the treatment of hepatocellular
carcinoma. Korean J Radiol. 10:425–434. 2009. View Article : Google Scholar : PubMed/NCBI
|
|
43
|
Ananthakrishnan A, Gogineni V and Saeian
K: Epidemiology of primary and secondary liver cancers. Semin
Intervent Radiol. 23:47–63. 2006. View Article : Google Scholar : PubMed/NCBI
|
|
44
|
Islam Z, Ali AM, Naik A, Eldaw M, Decock J
and Kolatkar PR: Transcription Factors: The Fulcrum Between Cell
Development and Carcinogenesis. Front Oncol. 11:6813772021.
View Article : Google Scholar : PubMed/NCBI
|
|
45
|
Caamano J and Hunter CA: NF-kappaB family
of transcription factors: Central regulators of innate and adaptive
immune functions. Clin Microbiol Rev. 15:414–429. 2002. View Article : Google Scholar : PubMed/NCBI
|
|
46
|
Fachinetti D, Folco HD, Nechemia-Arbely Y,
Valente LP, Nguyen K, Wong AJ, Zhu Q, Holland AJ, Desai A, Jansen
LE and Cleveland DW: A two-step mechanism for epigenetic
specification of centromere identity and function. Nat Cell Biol.
15:1056–1066. 2013. View Article : Google Scholar : PubMed/NCBI
|
|
47
|
Mahlke MA and Nechemia-Arbely Y: Guarding
the Genome: CENP-A-Chromatin in health and cancer. Genes (Basel).
11:8102020. View Article : Google Scholar : PubMed/NCBI
|
|
48
|
Pearson R, Fleetwood J, Eaton S, Crossley
M and Bao S: Kruppel-like transcription factors: A functional
family. Int J Biochem Cell Biol. 40:1996–2001. 2008. View Article : Google Scholar : PubMed/NCBI
|
|
49
|
Suzuki H, Ohshima N, Tatei K, Taniguchi T,
Sato S and Izumi T: The role of autonomously secreted
PGE2 and its autocrine/paracrine effect on bone matrix
mineralization at the different stages of differentiating MC3T3-E1
cells. Biochem Biophys Res Commun. 524:929–935. 2020. View Article : Google Scholar : PubMed/NCBI
|
|
50
|
Beilke S, Oswald F, Genze F, Wirth T,
Adler G and Wagner M: The zinc-finger protein KCMF1 is
overexpressed during pancreatic cancer development and
downregulation of KCMF1 inhibits pancreatic cancer development in
mice. Oncogene. 29:4058–4067. 2010. View Article : Google Scholar : PubMed/NCBI
|
|
51
|
Wang X, Lu Y, Li C, Larbi A and Feng L,
Shen Q, Chong MS, Lim WS and Feng L: Associations of lifestyle
activities and a heathy diet with frailty in old age: A
Community-based study in Singapore. Aging (Albany NY). 12:288–308.
2020. View Article : Google Scholar : PubMed/NCBI
|
|
52
|
Preston GC, Feijoo-Carnero C, Schurch N,
Cowling VH and Cantrell DA: The impact of KLF2 modulation on the
transcriptional program and function of CD8 T cells. PLoS One.
8:e775372013. View Article : Google Scholar : PubMed/NCBI
|
|
53
|
Zhuang WZ, Lin YH, Su LJ, Wu MS, Jeng HY,
Chang HC, Huang YH and Ling TY: Mesenchymal stem/stromal Cell-based
therapy: Mechanism, systemic safety and biodistribution for
precision clinical applications. J Biomed Sci. 28:282021.
View Article : Google Scholar : PubMed/NCBI
|


