Introduction
Thyroid cancers (TCs) are the predominant malignant
neoplasms in the endocrine system, originating from thyroid
follicular or parafollicular epithelial cells. The global incidence
of TCs has increased significantly in recent years, with
projections indicating continued growth over the next two decades
(1,2).
Advancements in ultrasound detection technologies
have led to a rise in the diagnosis of thyroid malignancies,
particularly papillary thyroid carcinomas (PTCs). PTCs are a type
of differentiated thyroid carcinomas (DTCs), which account for
>90% of all DTCs (3). While PTC
progresses gradually and can be managed with surgical intervention
and radioactive iodine ablation, certain individuals may exhibit
numerous lymph node (LN) metastases at the time of PTC detection,
resulting in an unfavorable prognosis, elevated recurrence rate and
significant mortality risk (4,5). It
remains largely elusive whether the cellular microenvironment of
PTC differs from that of the adjacent tissue and the mechanism by
which immune cells orchestrate PTC-LN metastasis.
Prior research utilizing RNA-sequencing (RNA-seq)
and deconvolution algorithms have revealed numerous immune cells
that are associated with PTC. Specifically, advanced PTC exhibited
a greater infiltration of immune cells in comparison to early PTC
and normal tissues. Evidence increasingly suggests that
tumor-associated macrophages (TAMs), dendritic cells (DCs), mast
cells and regulatory T cells (Tregs) play key roles in PTC
progression (6–10). While numerous simulated methods may
measure the amount of immune cell infiltration from RNA-seq data
sets, their overall evaluation may obscure important distinctions
between different cell types. The advent of single-cell
(sc)RNA-seq, however, has allowed for a more detailed analysis of
immune-cell subpopulations and their interactions within the tumor
microenvironment (TME), offering novel insights into the biology of
PTC metastasis.
The objective of the present study was to
investigate the immunological atlas of PTC by utilizing scRNA-seq
of tumor tissues from two patients with PTC. These patients had
varying degrees of LN metastases and adjacent normal tissue. The
findings unveiled notable variations in cellular constituents and
the immunological microenvironments of tumor tissues compared to
non-tumor (NT) tissue.
The present study found that TAMs, or alternatively
activated (M2) macrophages, conventional-type 2 DCs (cDC2s), Tregs,
monocytes and B cells have various roles in tumor progression or
metastasis. An analysis of crosstalk between different cell types
was also conducted. The present study aimed to enhance the
comprehension of the PTC immune cell atlas and its associations
with tumorigenic growth. This research offers valuable insights
into the immune dynamics of PTC and could inform future
immunotherapeutic strategies.
Materials and methods
Clinical samples
In the present study, the specimens from two female
patients with PTC who underwent surgery at Jining First People's
Hospital (Jining, China) and whose diagnosis was confirmed by
histology were included. A metastatic PTC (PTC-M) tumor and its
adjacent NT tissues were collected from a 44-year-old patient in
June 2022, whose PTC metastasized to LNs in the III/IV/V/VI area of
the left neck and VI regions of the right neck. Another tumor
sample was taken from a 64-year-old patient with PTC without any
metastasis in the LNs in the bilateral cervical area in June 2022.
Both patients carried a BRAF gene mutation (V600E) that was
revealed by PCR sequencing (data not shown) (11). The study was approved by the Ethics
Committee of Jining First People's Hospital (Jining, China). All
procedures carried out in this study were in line with ethical
standards of the Helsinki Declaration (revised in 2013) and written
informed consent was obtained from all participants. Although
patient samples were collected after ethical approval was granted,
the analysis performed was retrospective in nature, as the samples
were collected after diagnosis and did not involve patient
follow-up.
Tissue dissociation and
preparation
The fresh tissues were stored in
sCelLive® Tissue Preservation Solution (Singleron
Biotechnologies) on ice after surgical removal within 30 min. The
specimens were washed with Hank's Balanced Salt Solution three
times, minced into small pieces and then digested with 3 ml
sCelLive® Tissue Dissociation Solution (Singleron
Biotechnologies) using the PythoN® Tissue Dissociation
System (Singleron Biotechnologies) at 37°C for 15 min. The cell
suspension was collected and filtered through a 40-micron sterile
strainer. The mixture was then centrifuged at 300 × g and 4°C for 5
min, and following removal of the supernatant, the pellet was
gently suspended with PBS. Finally, the samples were stained with
0.4% Trypan blue, mixed thoroughly at room temperature and
immediately evaluated for cell viability under a microscope.
Reverse transcription (RT),
amplification and library construction
Single-cell suspensions (2×10⁵ cells/ml)
in PBS were loaded onto a microwell chip using the
Matrix® Single Cell Processing System (Singleron
Biotechnologies). The scRNA-seq libraries were constructed
according to the protocol of the GEXSCOPE® Single Cell
RNA Library Kits (Singleron Biotechnologies) as previously
described (12). Briefly, Barcoding
Beads are collected from the microwell chip, followed by reverse
transcription of the mRNA captured by the Barcoding Beads and to
obtain cDNA, PCR amplification. The amplified cDNA was then
fragmented and ligated with sequencing adapters. Individual
libraries were diluted to 4 nM, pooled and sequenced on a Novaseq
6,000 (Illumina, Inc.) with 150 bp paired-end reads.
Analysis of raw read data
Raw reads from scRNA-seq were processed to generate
gene expression matrixes using the CeleScope (https://github.com/singleron-RD/CeleScope) v1.9.0
pipeline. In brief, raw reads were first treated with CeleScope to
remove low-quality reads with Cutadapt v.1.17 (13) to trim poly-A tail and adapter
sequences. The cell barcode and Unique Molecular Indentifier (UMI)
were extracted. Subsequently, STAR v2.6.1a (14) was used to map reads to the reference
genome GRCh38 (Ensembl v92 annotation) (Index
of/pub/release-92/fasta/homo_sapiens). The counts of UMI and genes
in each cell were acquired with feature Counts v2.0.1 (15) software and used to generate
expression matrix files for subsequent analysis.
Quality control, dimension reduction
and clustering
Cells were filtered by gene counts <200 and the
top 2% gene counts and the top 2% UMI counts. Cells with >30%
mitochondrial content were removed. After filtering, 23,949 cells
were retained for the downstream analyses, with on average 2,905
genes and 9,155 UMIs per cell. Functions from Seurat v3.1.2
(16) were used for dimension
reduction and clustering. Subsequently, the NormalizeData and
ScaleData functions were employed to normalize and scale all gene
expression and the top 2000 variable genes were selected with the
FindVariableFeautres function for principal component analysis.
Using the top 20 principal components, cells were separated into
multiple clusters with FindClusters. Cell clusters were visualized
using t-Distributed Stochastic Neighbor Embedding (t-SNE) or
Uniform Manifold Approximation and Projection (UMAP) with Seurat
functions RunTSNE and RunUMAP.
Analysis of differentially expressed
genes (DEGs)
To identify DEGs, the Seurat FindMarkers function
was used based on the Wilcox likelihood-ratio test with default
parameters and the genes expressed in >10% of the cells in a
cluster and with an average log (fold change) value >0.25 were
selected as DEGs. For the cell type annotation of each cluster, the
expression of canonical markers found in the DEGs was combined with
information from the literature and the expression of markers of
each cell type was displayed using heatmaps/dot plots/violin plots
that were generated with Seurat's DoHeatmap/DotPlot/Vlnplot
function. Doublet cells were identified as expressing markers for
different cell types and removed manually.
Cell type annotation
The cell type identity of each cluster was
determined based on the expression of canonical markers found in
the DEGs using the SynEcoSys® database (https://singleron.bio). Heatmaps/dot plots/violin
plots displaying the expression of markers used to identify each
cell type were generated by Seurat v3.1.2
DoHeatmap/DotPlot/Vlnplot.
Pathway enrichment analysis
To investigate the potential functions of DEGs, Gene
Ontology (GO) and Kyoto Encyclopedia of Genes and Genomes (KEGG)
were used with the ‘clusterProfiler’ R package v4.0.2 (17). Pathways with an adjusted P<0.05
were considered as significantly enriched. GO gene sets, including
molecular function, biological process and cellular component
categories, were used as references.
For Gene Set Variation Analysis (GSVA) pathway
enrichment analysis, the average gene expression of each cell type
was used as input data using the GSVA package (18).
Trajectory analysis
The cell differentiation trajectory was
reconstructed with Monocle2 (19).
DEGs were used to sort cells in an order of spatial-temporal
differentiation. The DDRTree function was used to perform
FindVairableFeatures and dimension-reduction. Finally, the
trajectory was visualized using the plot_cell_trajectory function.
Next, CytoTRACE (v0.3.3) (20) (a
computational method that predicts the differentiation state of
cells from scRNA-seq data using gene counts and expression) was
used to predict the differentiation potential of monocyte
subpopulations.
Cell-cell interaction analysis
The cell-cell interaction analysis was performed
using CellPhoneDB v2.1.7 (21)
based on known receptor-ligand interactions between two cell
types/subtypes. Cluster labels of all cells were randomly permuted
1,000 times to calculate the null distribution of average
ligand-receptor expression levels of the interacting clusters. The
individual ligand or receptor expression was thresholded with a
cut-off value based on the average log gene expression distribution
for all genes across all of the cell types. The significant
cell-cell interactions were defined as having P<0.05 and only
receptors and ligands expressed in a threshold percentage of
>0.1 of the cells in the specific cluster.
Multiplex immunohistochemistry (mIHC)
assay and analysis
The Opal protocol staining approach was utilized to
conduct mIHC staining, as previously described (22). mIHC was performed by several rounds
of staining, each including a protein block with 1% BSA followed by
addition of primary antibody and corresponding secondary
horseradish peroxidase-conjugated antibody against mouse or rabbit
immunoglobulins (ARH1001EA; Akoya Biosciences). The slides were
then incubated in different Opal fluorophores (1:100) diluted in 1X
Plus Amplification Diluent (ARD1001EA; Akoya Biosciences). After
tyramide signal amplification and covalent linkage of the
individual Opal fluorophores (NEL861001KT; Akoya Biosciences) to
the relevant epitope or epitopes, the primary and secondary
antibodies were removed via antigen retrieval, as previously
mentioned, and the next cycle of immunostaining was initiated. The
primary antibodies and Opal fluorophores were as follows: Lysosomal
associated membrane protein 3 (LAMP3; cat. no. ab134045; diluted
1:100; Abcam) was labeled using Akoya Opal fluorophores 520. C-C
motif chemokine receptor 4 (CCR4; cat. no. NBPI-86584; diluted
1:100; Novus Biologicals) was labeled using Akoya Opal fluorophores
620. CD4 (cat. no. ab133616; diluted 1:100; Abcam) was labeled
using Akoya Opal fluorophores 690. The nucleus was labeled with
DAPI (diluted 1:100; Akoya). The cover-slipping of all sections was
performed using Anti-Fade Fluorescence Mounting Medium (cat. no.
ab104135; Abcam). Multichannel imaging was performed on a
PANNORAMIC SCAN II Imaging System (3Dhistech Kft.). Image analysis
was performed in QuPath V.0.5.1 (Queen's University) (23).
Results
A single-cell expression atlas of the
PTC microenvironmen
Single-cell RNA-seq analyse was performed on both
metastatic tumor and adjacent NT tissues from a PTC case with
aggressive metastasis (PTC-M). Additionally, the tumor tissue
collected from a patient with non-metastatic PTC served as a
control for comparison with the metastatic tumor. The clinical
information of the patients was collected at the time of
recruitment and was described in the methods section.
After stringent quality filtering, a total of 23,401
single cells were included in the analysis. Transcriptional data
from all of the cells were integrated and low-resolution
t-distributed stochastic neighbor embedding clustering was used to
identify eight major cell populations. These populations were
labeled as T cells (CD3D, CD3E, CD2, TRAC, TRBC1 and
TRBC2), B cells (MS4A1, CD79A and CD79B),
plasma cells (JCHAIN, MZB1 and IGHG1), mononuclear
phagocytes (MPs) (LYZ, CD14, C1QC, MRC1, CD68, CD163, CD1C
and LAMP3), endothelial cells (PECAM1, VWF, CLDN5 and
CDH5), mural cells (ACTA2, TAGLN, MYLK, MYL9, PDGFRB
and NOTCH3), plasmacytoid dendritic cells (pDCs) (IL3RA,
CLEC4C, LILRB4 and LILRA4) and epithelial cells
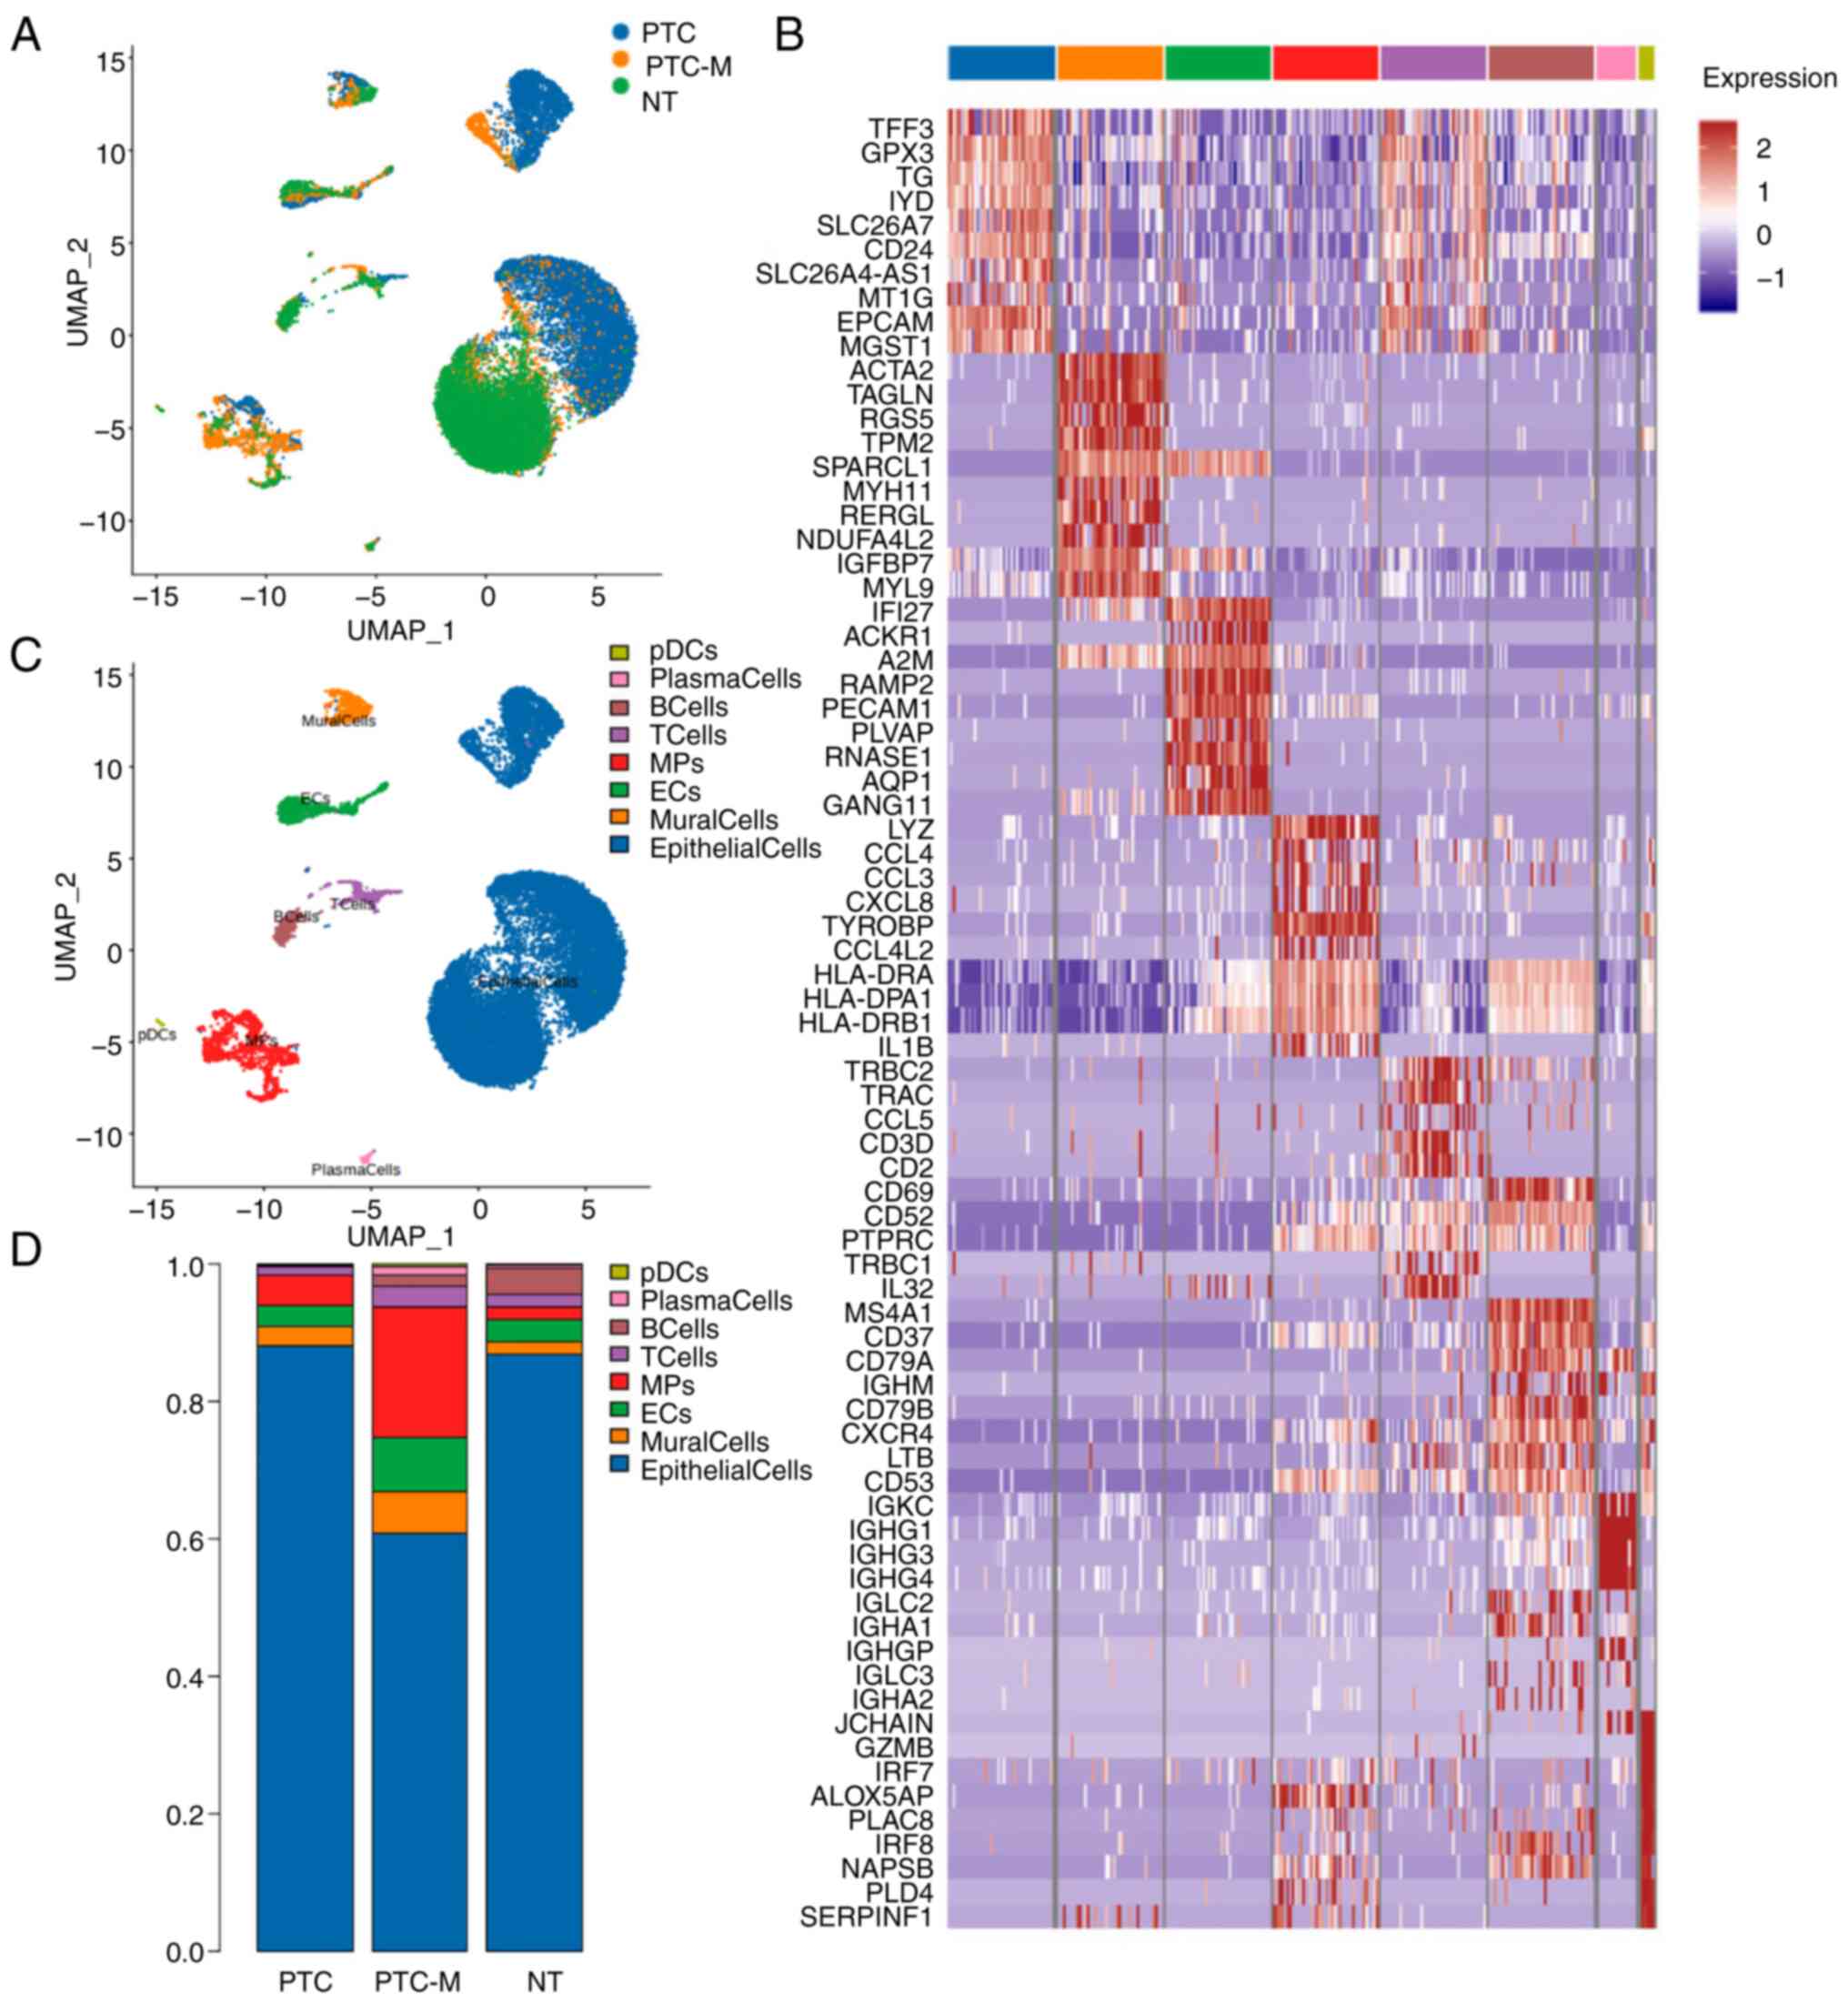
(EPCAM, TG, DIO2, TACSTD2 and KRT19) (Fig. 1). A notable infiltration of MPs was
observed in the PTC-M sample, where MPs accounted for 18.97% of
total cells (998 cells), compared to only 1.92% in NT (148 cells)
and 4.54% in PTC tissues (476 cells) (Fig. 1D). Fig.
1B displays the most distinct DEGs for each cell
population.
Subtyping of MPs and their
contributions to the immune microenvironment of PTC
MPs in PTC displayed increased expression of
inflammation-related genes, including immune proteins (LYZ) and
inflammatory cytokines (CCL4, CCL3, CXCL8, CCL4L2 and IL1B), as
well as human leukocyte antigens (HLA) (HLA-DRA, HLA-DPA1 and
HLA-DRB1) (Fig. 1B). DEG analysis
revealed that the MPs in the PTC-M tumor tissue expressed a higher
level of immune-suppression-related genes, such as MRC1, CD163,
CCL18, SPP1, CCL2, CCR2, CD40, CCL17 and CCL22, whereas
exhibiting lower levels of TNF, IL1B and RGS1
(Fig. S1A) when compared to the
MPs from NT. The GO and KEGG analyses showed that the upregulated
genes in MPs from PTC-M were mostly enriched in pathways related to
the immune-inflammatory response, including ‘neutrophil
activation’, ‘neutrophil degranulation’, ‘Staphylococcus
aureus infection’ and ‘tuberculosis’ (Fig. S1B and C).
By conducting UMAP analysis, four distinct MP
subgroups infiltrating the tumors were identified: Monocytes
(LYZ, CD14, FCN1, VCAN and FCGR3A), macrophages
(LYZ, MRC1, CD68, CD163, C1QC, APOE and MARCO), cDC2s
(CD1C, CD1E and FCER1A) and mature DCs (LYZ,
LAMP3 and CCR7) (Fig.
2A). Further analysis demonstrated that cDC2s and macrophages
made up 42.67 and 40.45% of MPs in the PTC-M sample, respectively.
In the NT sample, monocytes were the most common MPs (52.89% of
MPs; Fig. 2C and D). Although a
similar percentage of macrophage cells and cDC2s was found in PTC-M
and PTC, the number of both subtypes of MP cell in PTC-M was
~2-fold higher than that in PTC (Fig.
2D). The top DEGs of each MP subtype are listed in Fig. 2B.
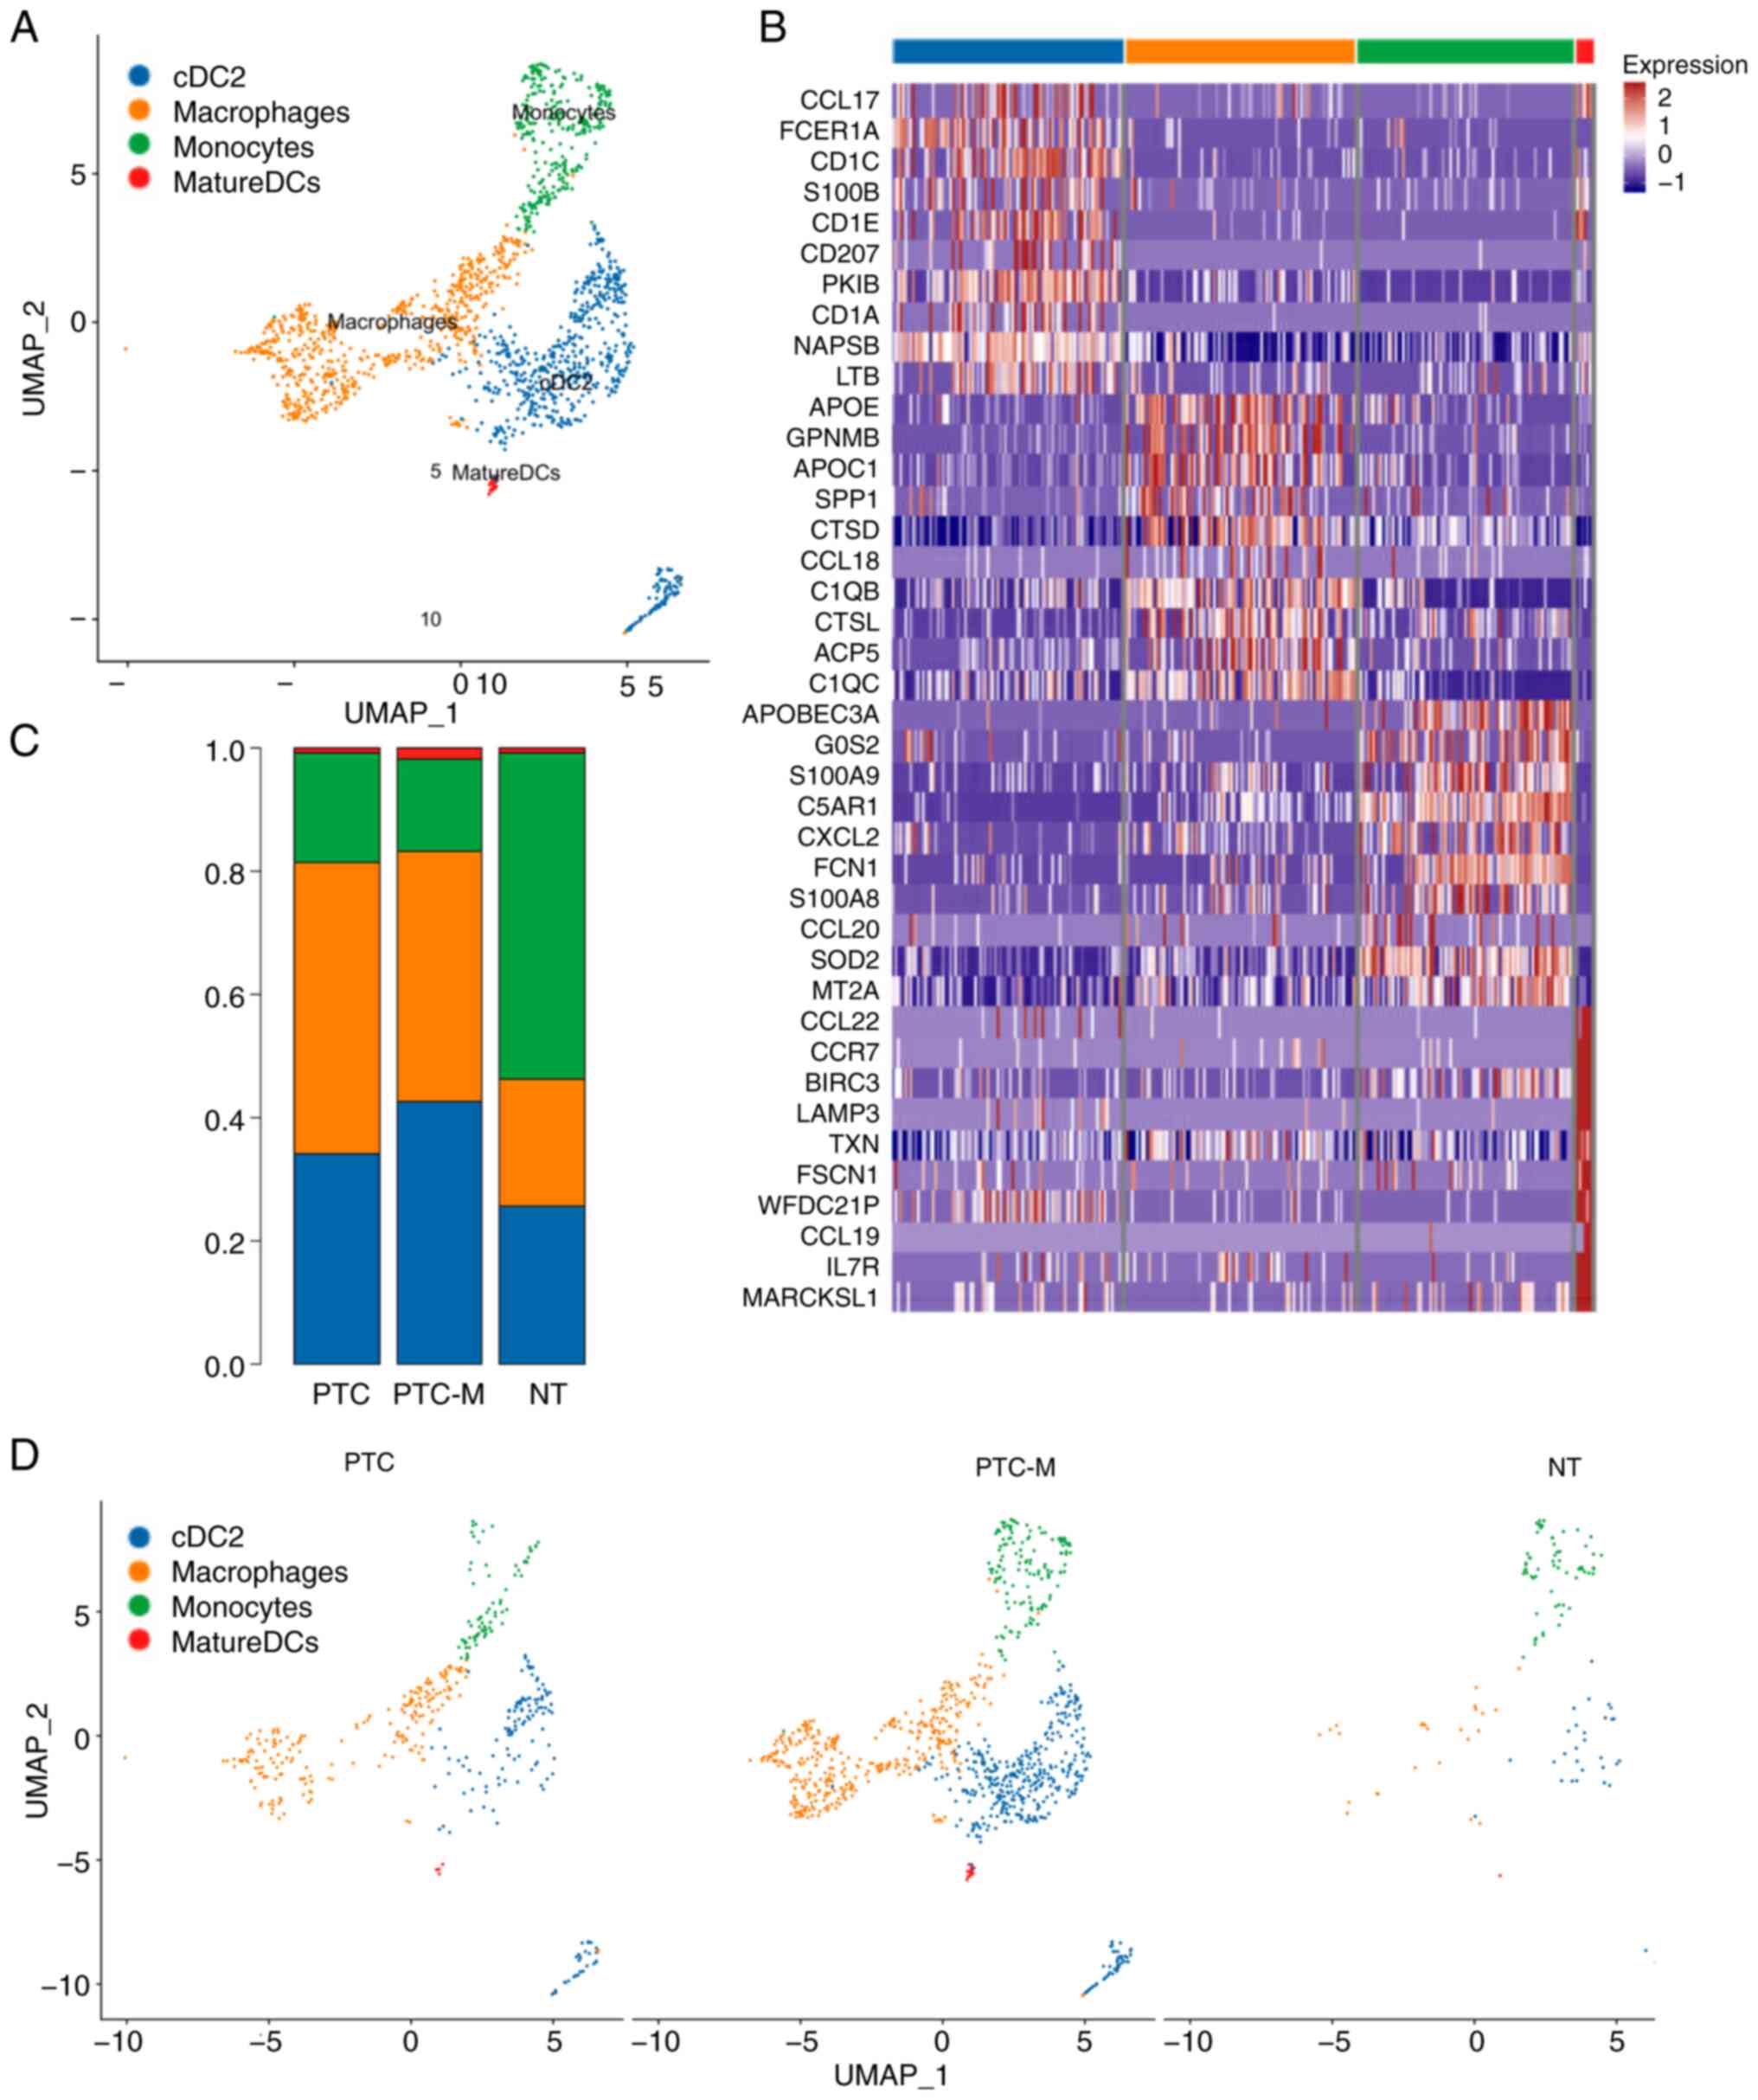 | Figure 2.Identification and transcriptional
characterization of MP subtypes. (A) UMAP projection of the four
subtypes of MPs. (B) Heatmap of the top marker genes of monocytes,
macrophages, cDC2 and mature DCs. (C) The composition of each MP
subtype is displayed in a bar graph, with different colors
representing the proportions of various MP subtypes in PTC, PTC-M
and NT. (D) Different colors represent various MP subtypes,
illustrating their composition in PTC, PTC-M and NT. cDC2s,
conventional-type 2 dendritic cells; PTC-M, metastatic papillary
thyroid cancer; NT, non-tumor; MP, mononuclear phagocyte; UMAP,
Uniform Manifold Approximation and Projection. |
Immune-suppressive
MRC1+CCL18+ M2 macrophages are enriched in
PTC and PTC-M tissues
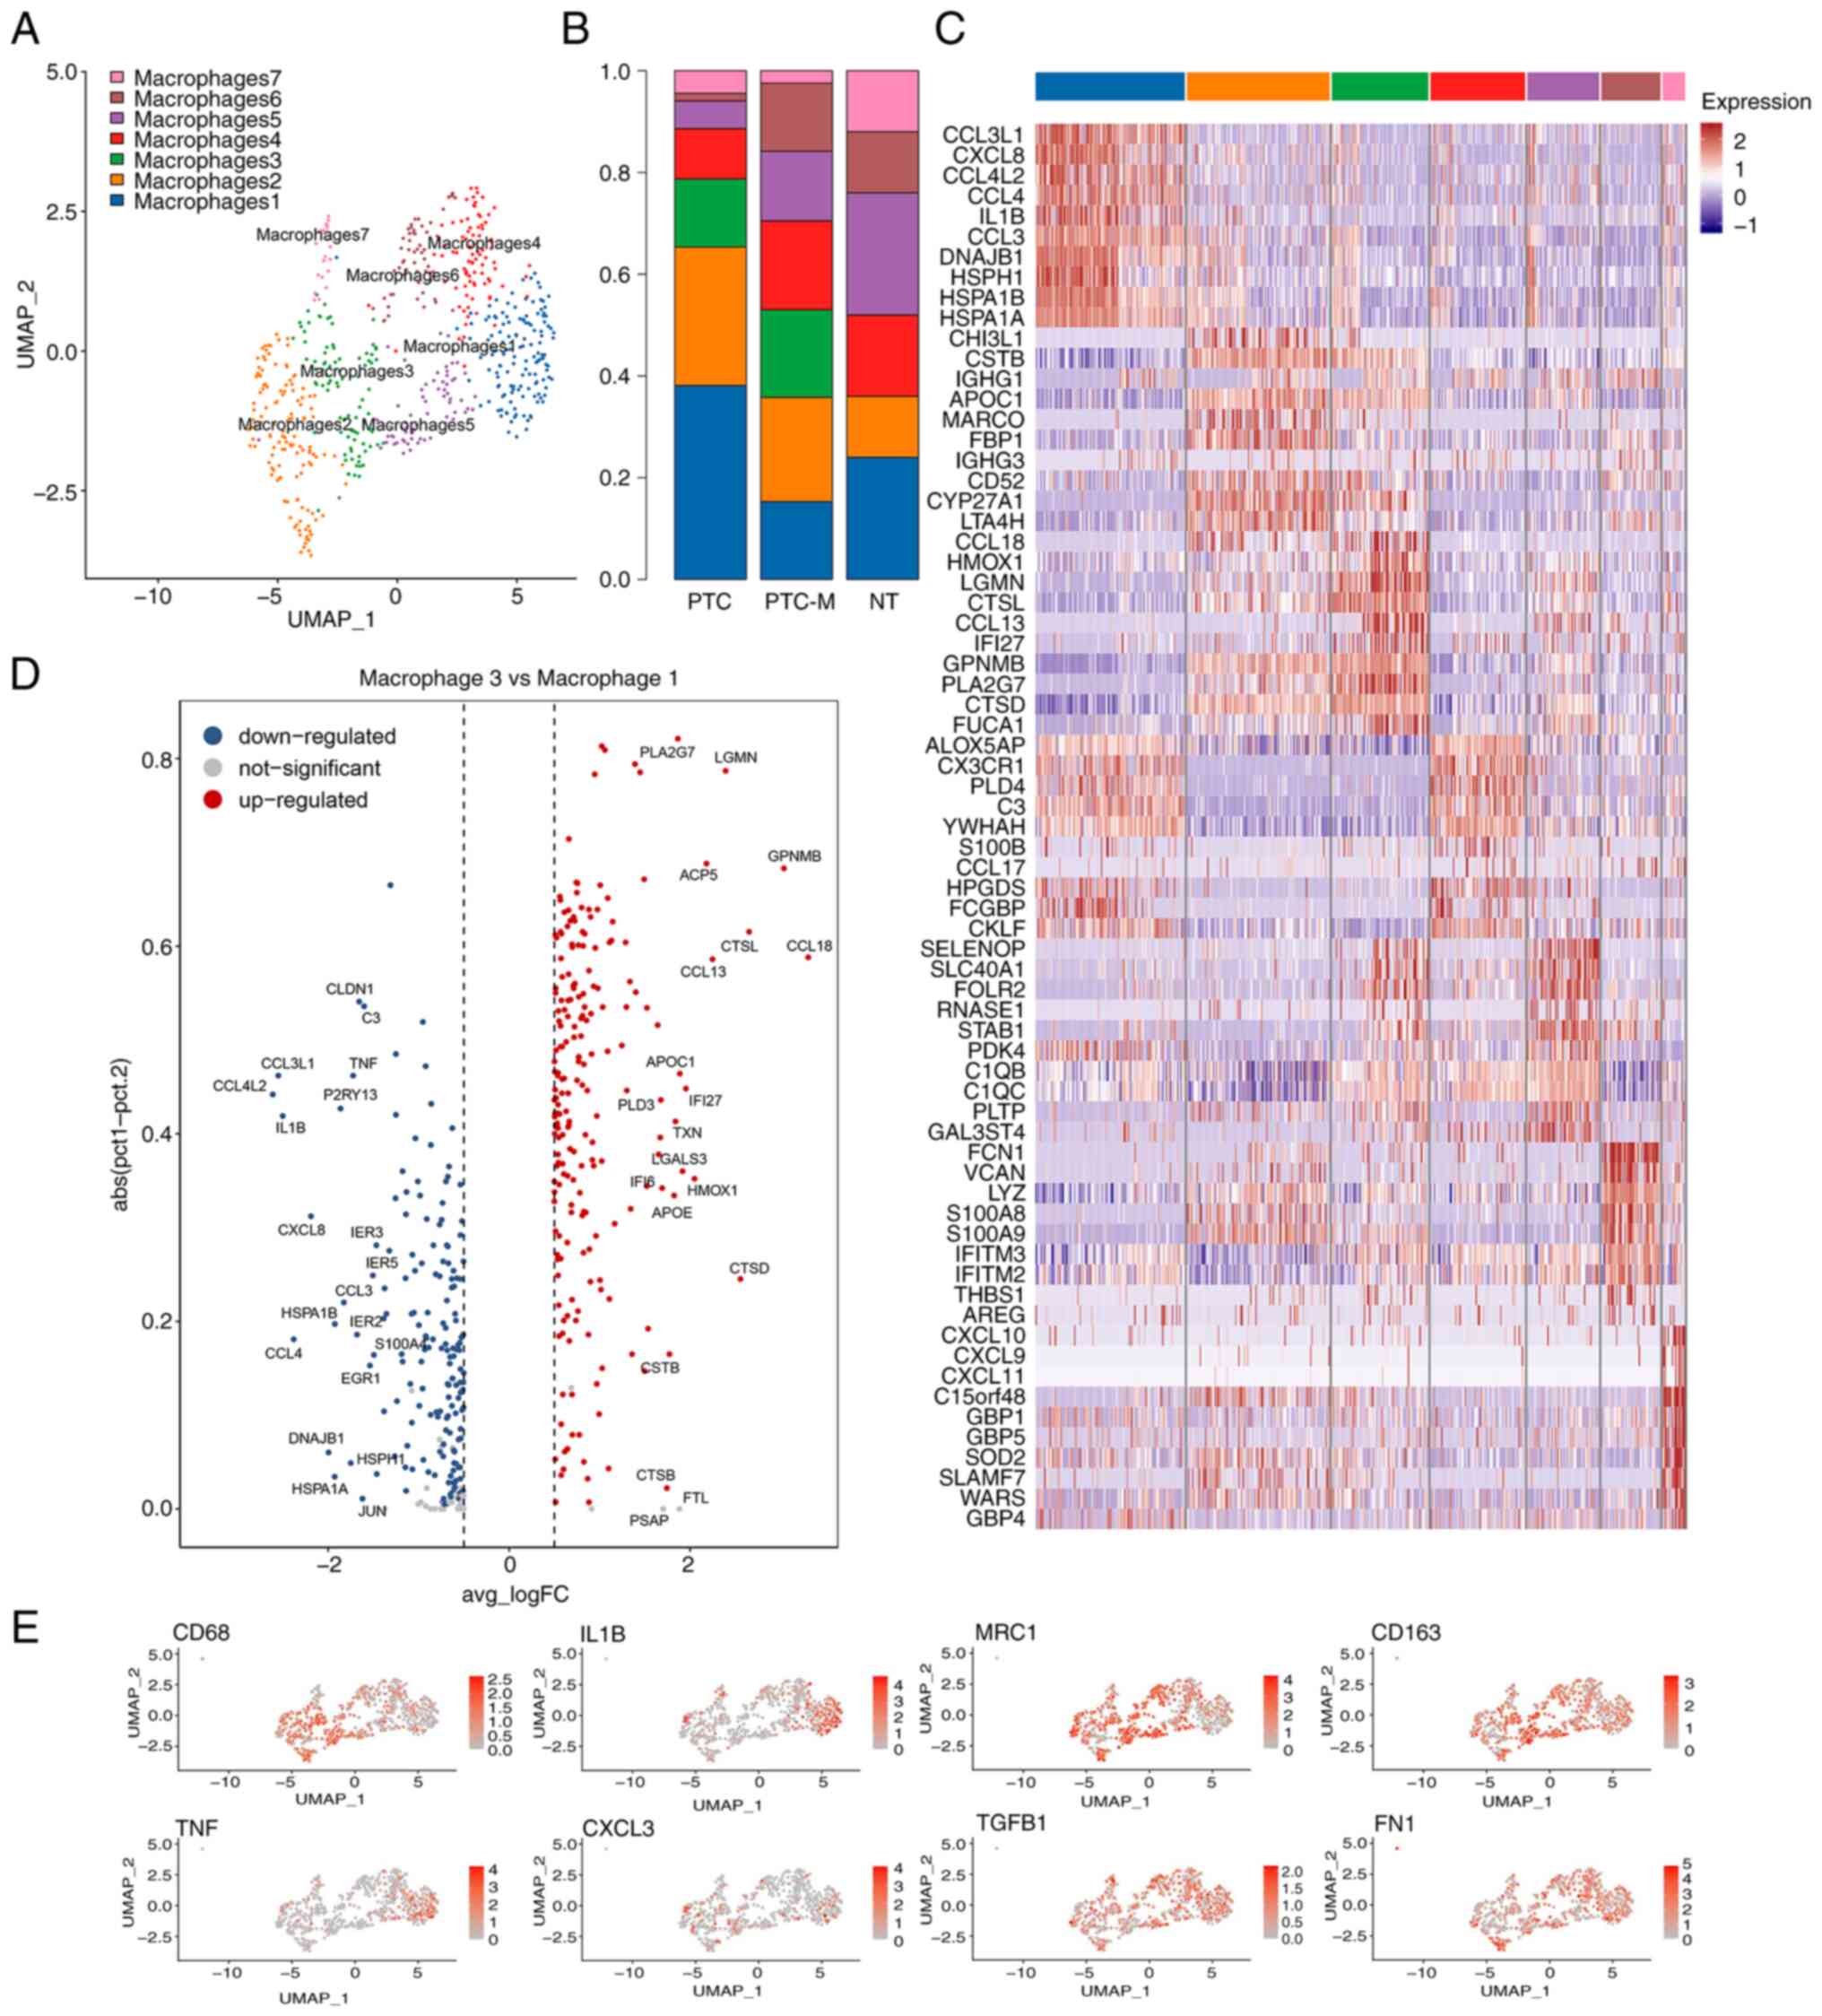
Macrophages were then annotated using UMAP and they
were classified into 7 different clusters (Fig. 3A). Of note, the macrophage c3
cluster was solely enriched in PTC and PTC-M tumor tissues
(Fig. 3A and B), demonstrating the
unique tumor-associated function of immune-regulating macrophages.
In addition, the macrophage c3 and c5 clusters expressed high
levels of MRC1, CD163 and TGFB and low levels of
IL1B, TNF and RGS1, which correspond to the
alternatively-activated M2 subtype (Fig. 3C and D and Table SI) (24–26).
It was also observed that CCL18, SPP1, GPNMB, CCL2, CCL8 and
C1QA were upregulated in the macrophage c3 cluster
(MRC1+CCL18+ M2), while in the
macrophage c5 cluster, the expression of C1QB, C1QC and
SLC40A1 was elevated (Fig.
3C; Table SI).
To analyze the TMEs potentially mediated by unique
macrophage subtypes, DEG analysis was performed between the
macrophage c1 and c3 clusters. Fig.
3D shows that in the macrophage c1 cluster, IL1B, TNF
and RGS1, which are markers of classically-activated M1-type
macrophages, were highly expressed (26), whereas the macrophage c3 subtype has
a broad spectrum of molecules that are critical for pro-M2
conversions, such as GPNMB, or for inflammation, such as
CTSL, APOE and PLA2G7 (27–30).
Furthermore, GO annotation analysis revealed ‘positive regulation
of cytokine production’, ‘leucocyte cell-cell adhesion’ and ‘T-cell
activation’ in c1 macrophages, while ‘neutrophil activation’ and
‘neutrophil-mediated immunity’ were more likely activated in c3
macrophages. In addition, KEGG enrichment analysis showed that c3
macrophage-expressed genes were enriched in the ‘lysosome’,
‘phagosome’, ‘oxidative phosphorylation’ and ‘cholesterol
metabolism pathways’ (Fig. S2).
Expression of classical macrophage M1 and M2 marker genes is shown
in Fig. 3E. Since c1 was annotated
as M1-like, while c3 and c5 were denoted as M2-like macrophages,
the data revealed that the ratio of M2-like/M1-like macrophages
substantially increased in the progressively advanced stage (38/77
in PTC vs. 113/56 in PTC-M) of PTC (Fig. 3B).
UMAP analysis was used to sub-classify the monocytes
into 8 clusters. However, it was not possible to tell the
difference between functional differences or differences in the
make-up of groups in the PTC, PTC-M and NT samples. A cell
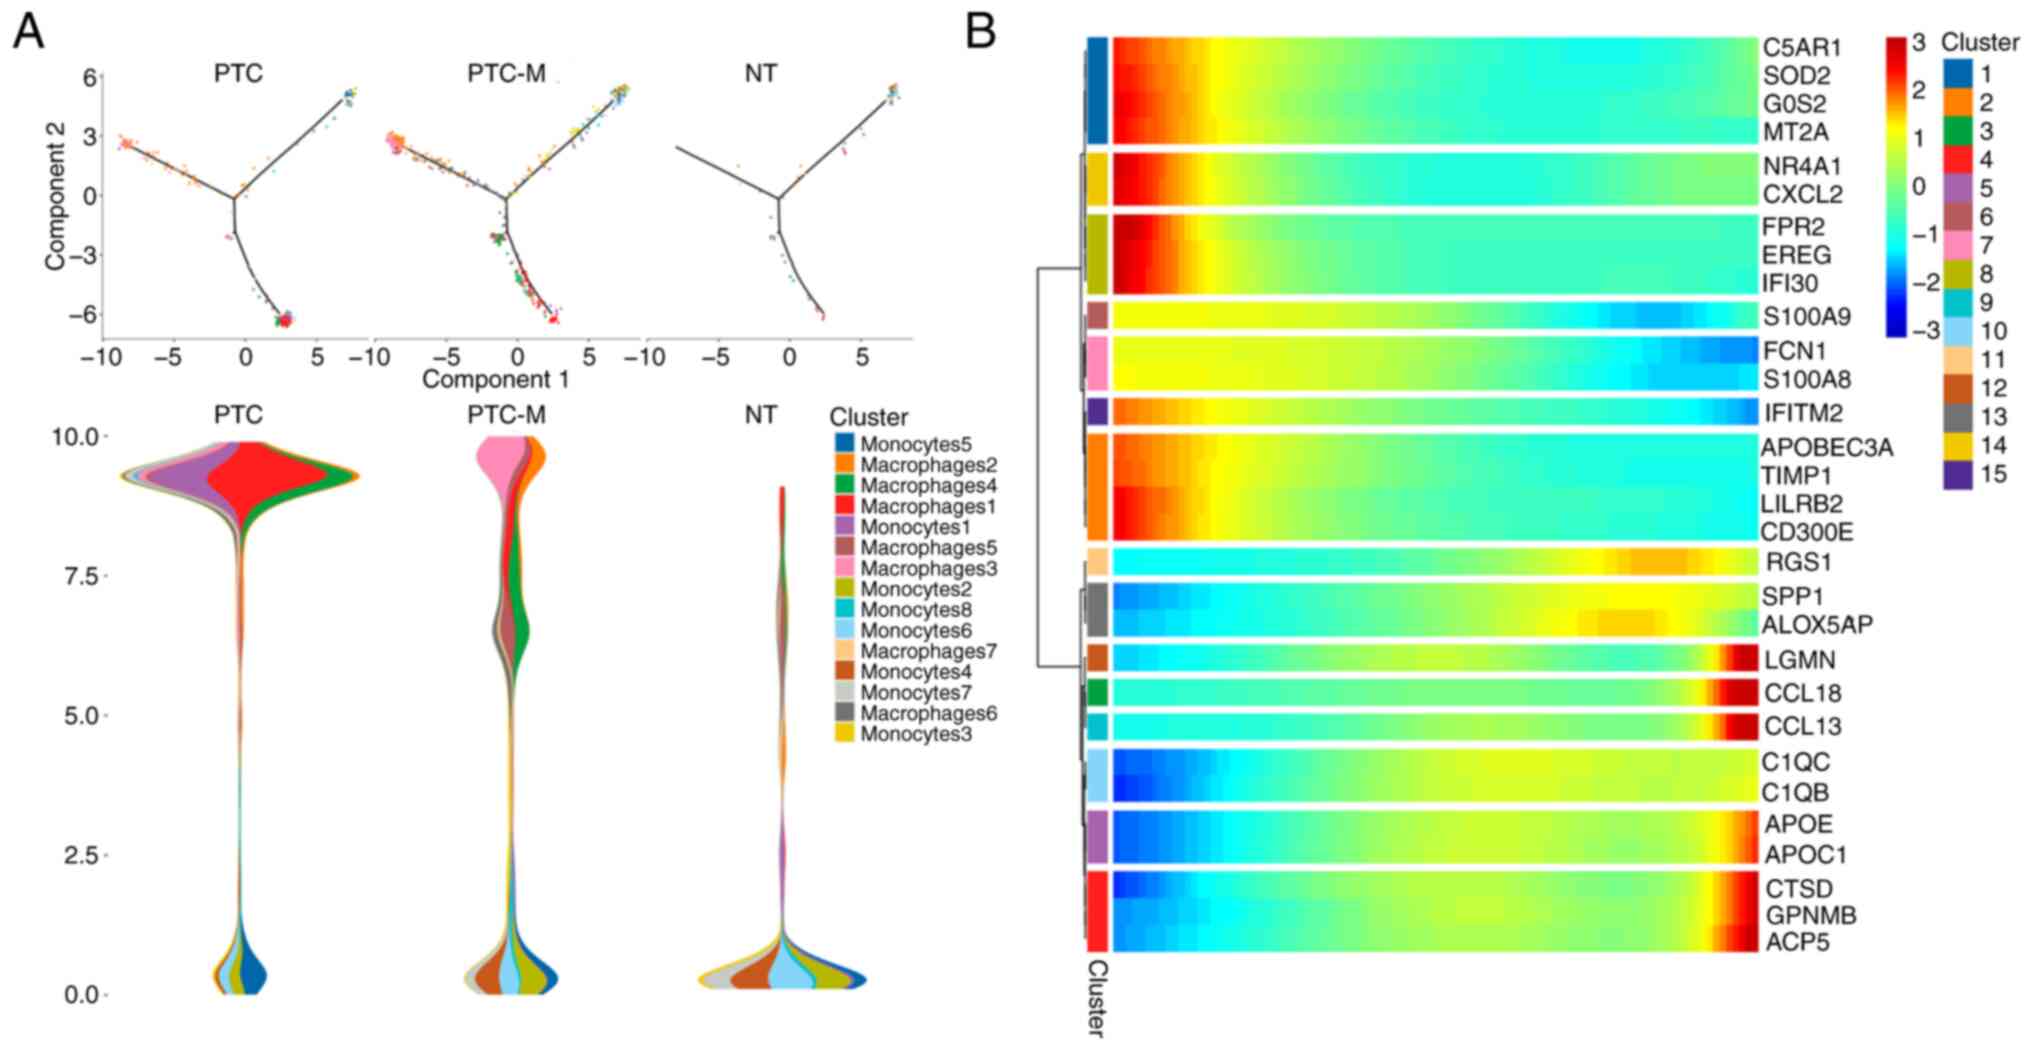
trajectory analysis was then performed to further investigate the
potential transition between cell types. The pseudotime trajectory
axis derived from Monocle indicates that monocytes could
transdifferentiate into macrophage clusters, particularly c1 and c3
macrophages. The results illustrated that most monocytes remained
quiescent in the NT sample, while they preferentially
differentiated into the M1-like c1 macrophages in the PTC sample
and more cells were directed towards the M2-like c3 macrophages in
the PTC-M sample (Fig. 4A).
Pseudotemporal expression patterns of representative genes also
indicated the transition of monocytes into various macrophage
clusters (Fig. 4B). These findings
clearly outline the potential paths of differentiation for
monocytes at a signal-cell level and suggest that they have the
ability to give rise to a metastatic environment.
LAMP3+CCL22+ DCs
with potential immune-suppressive capacity in PTC-M sample
DCs have a crucial function in presenting antigens,
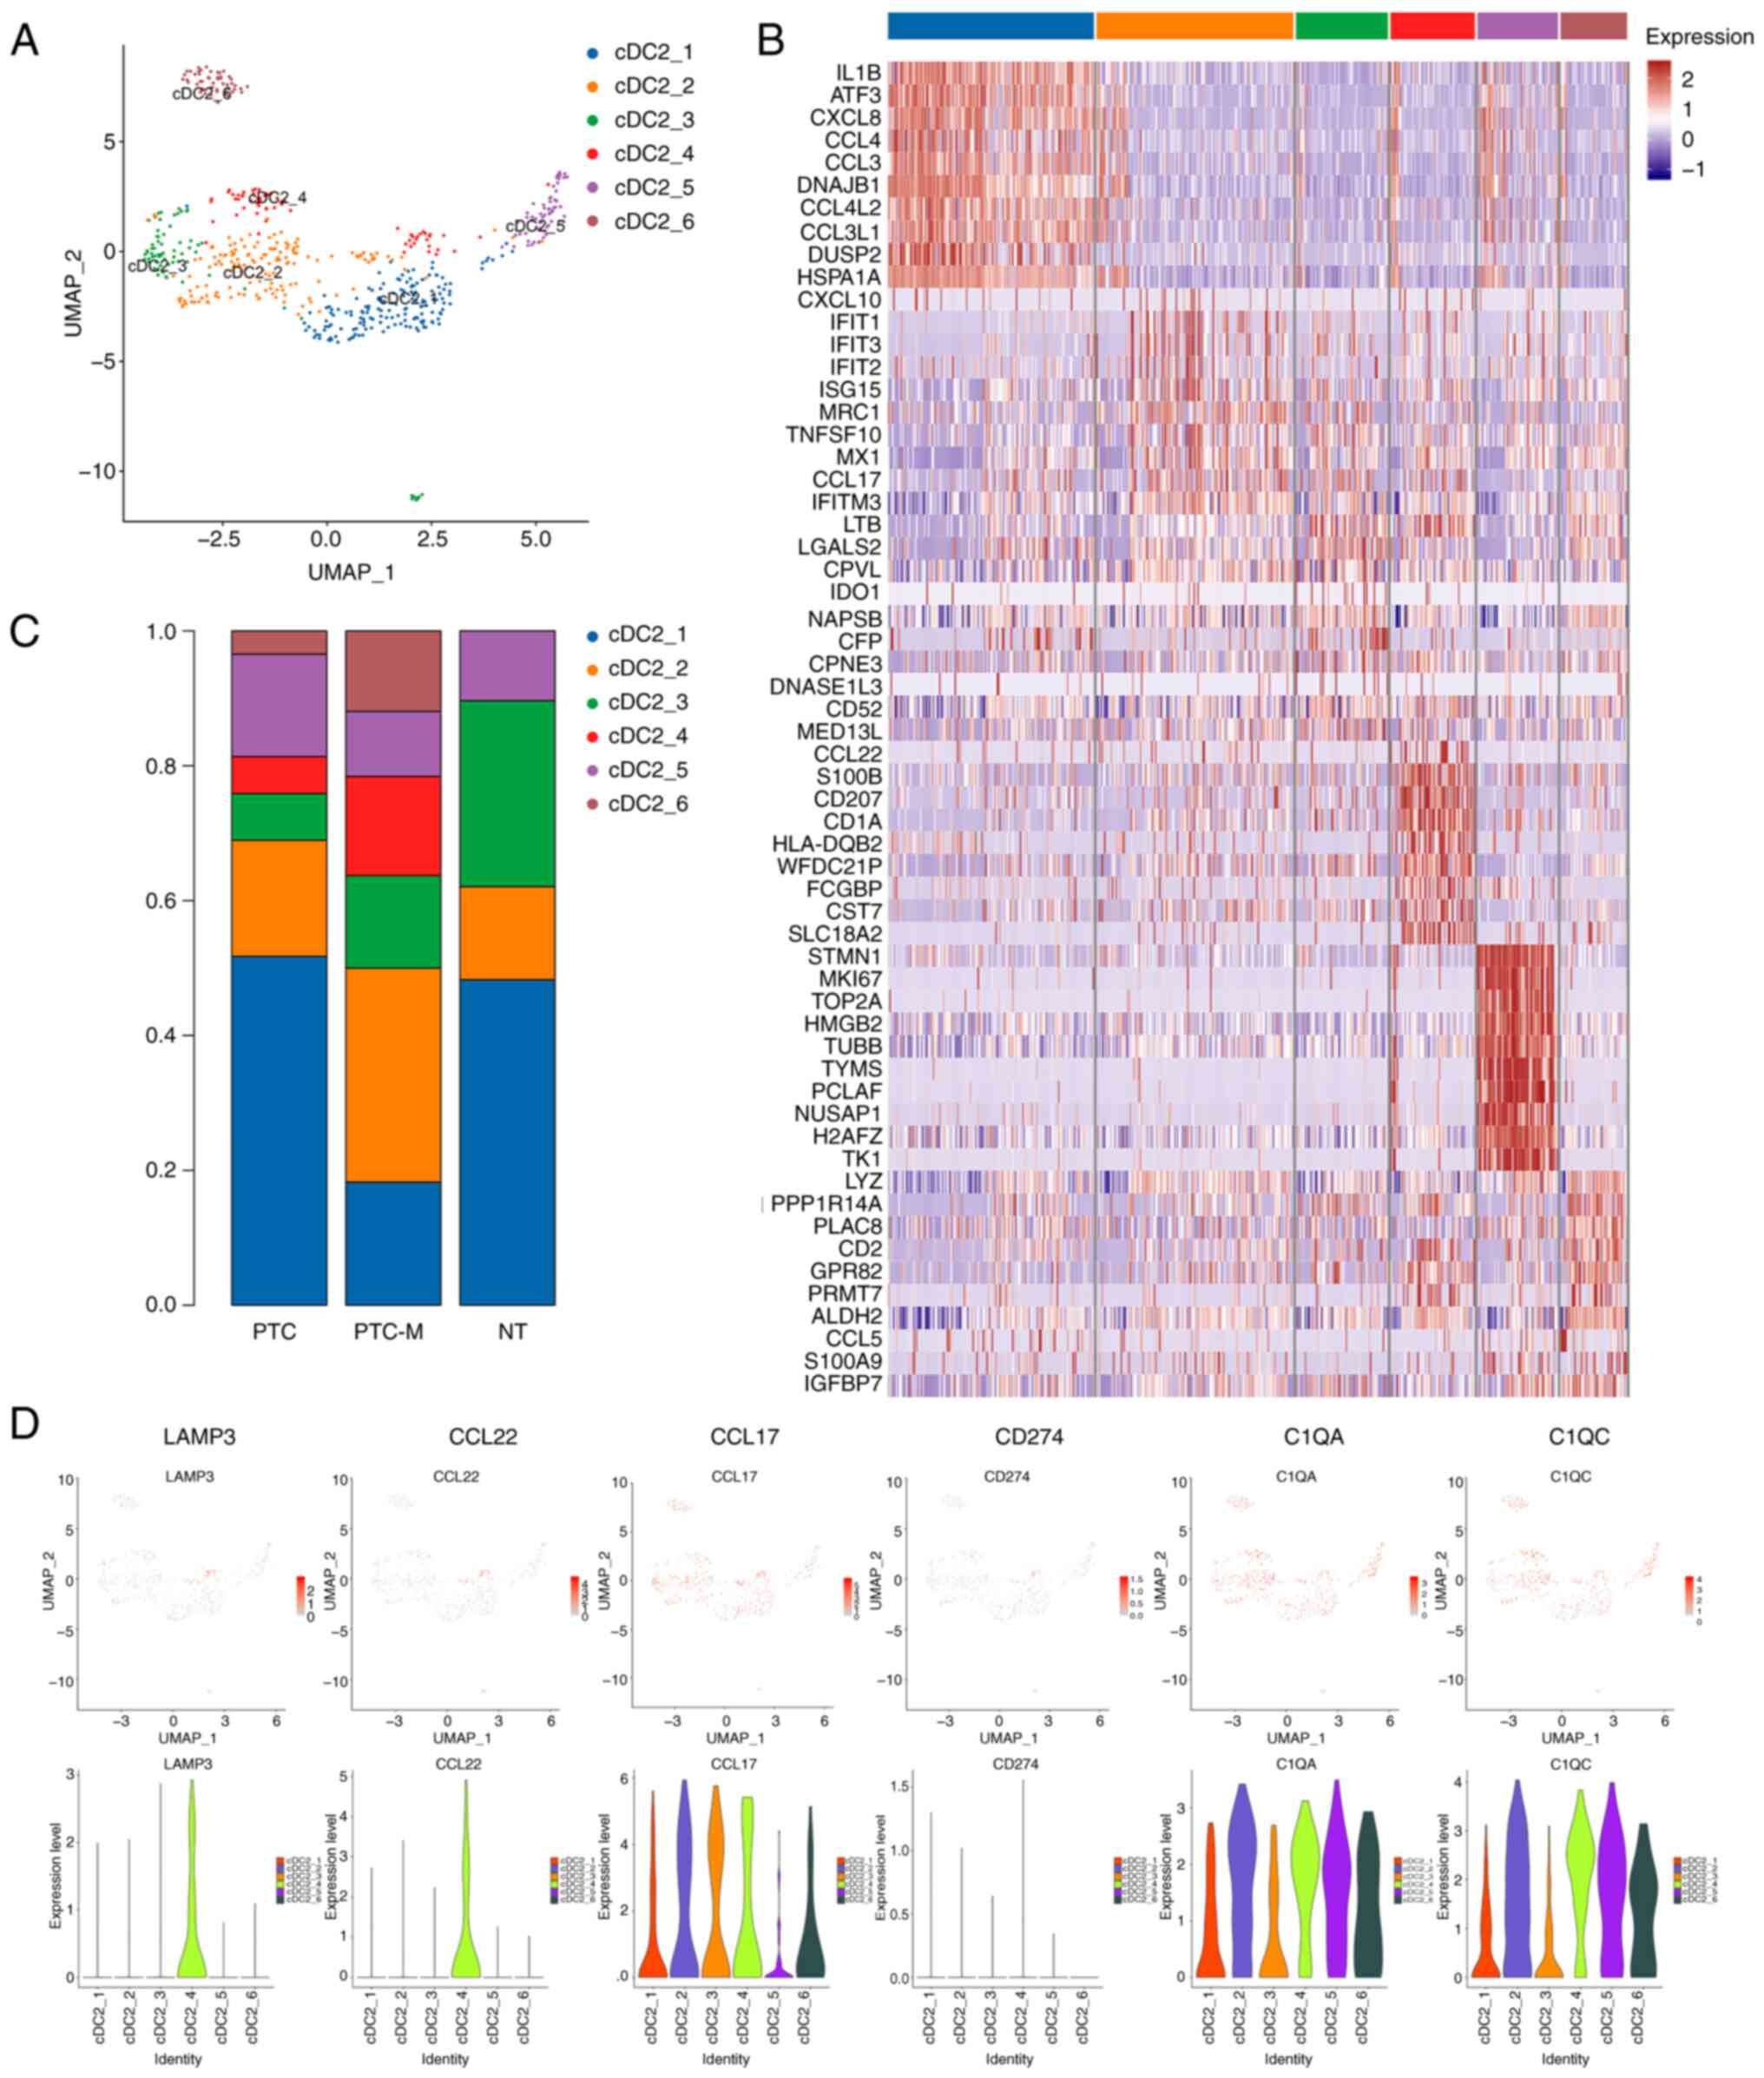
initiating T-cell responses and migrating to lymph nodes (31). By applying a UMAP analysis, 6
clusters of cDC2s were identified (Fig.
5A and C). The cDC2 c1 cluster was the predominant cluster in
the NT tissue and exhibited significant expression of IL1B,
CCL3, CCL4, ATF3 and CXCL8 (Fig. 5B). The cDC2 clusters c2, c4 and c6
showed significant enrichment in the PTC-M sample. The cDC2 c4
cluster was specifically studied because it shared similarities
with the subtype of ‘mature DCs enriched in immunoregulatory
molecules’ (mregDCs) that have the ability to migrate towards lymph
nodes (32–34). The mregDCs-like cluster exhibited
simultaneous expression of type 2 T-helper cell responsive genes
(CCL22 and CCL17) and other immune-regulatory genes
(C1QA and C1QC), along with the DC maturation genes
LAMP3, CD40 and CD80 (Fig. 5B; Table
SII). By utilizing the feature plot and violin plot, it was
possible to identify that the cDC2 c4 cells formed a distinct
cluster characterized by elevated expression of immune-suppressive
genes LAMP3 and CCL22
(LAMP3+CCL22+ DC)
(Fig. 5D). Based on these
observations, it may be proposed that the cDC2 c4 cluster likely
functions as mregDCs, contributing to migration and the
establishment of an immune-suppressive microenvironment in
PTC-M.
Tumor-associated immune cell subtypes'
crosstalk and their impact on the PTC microenvironment
To elucidate the interactions between different
immune cell subtypes in the PTC microenvironment, a CellPhoneDB
analysis was performed, focusing on ligand-receptor (L-R)
interactions among macrophages, DCs and T cells (21). Based on the prior analysis, it was
found that the majority of the projected crosstalk took place
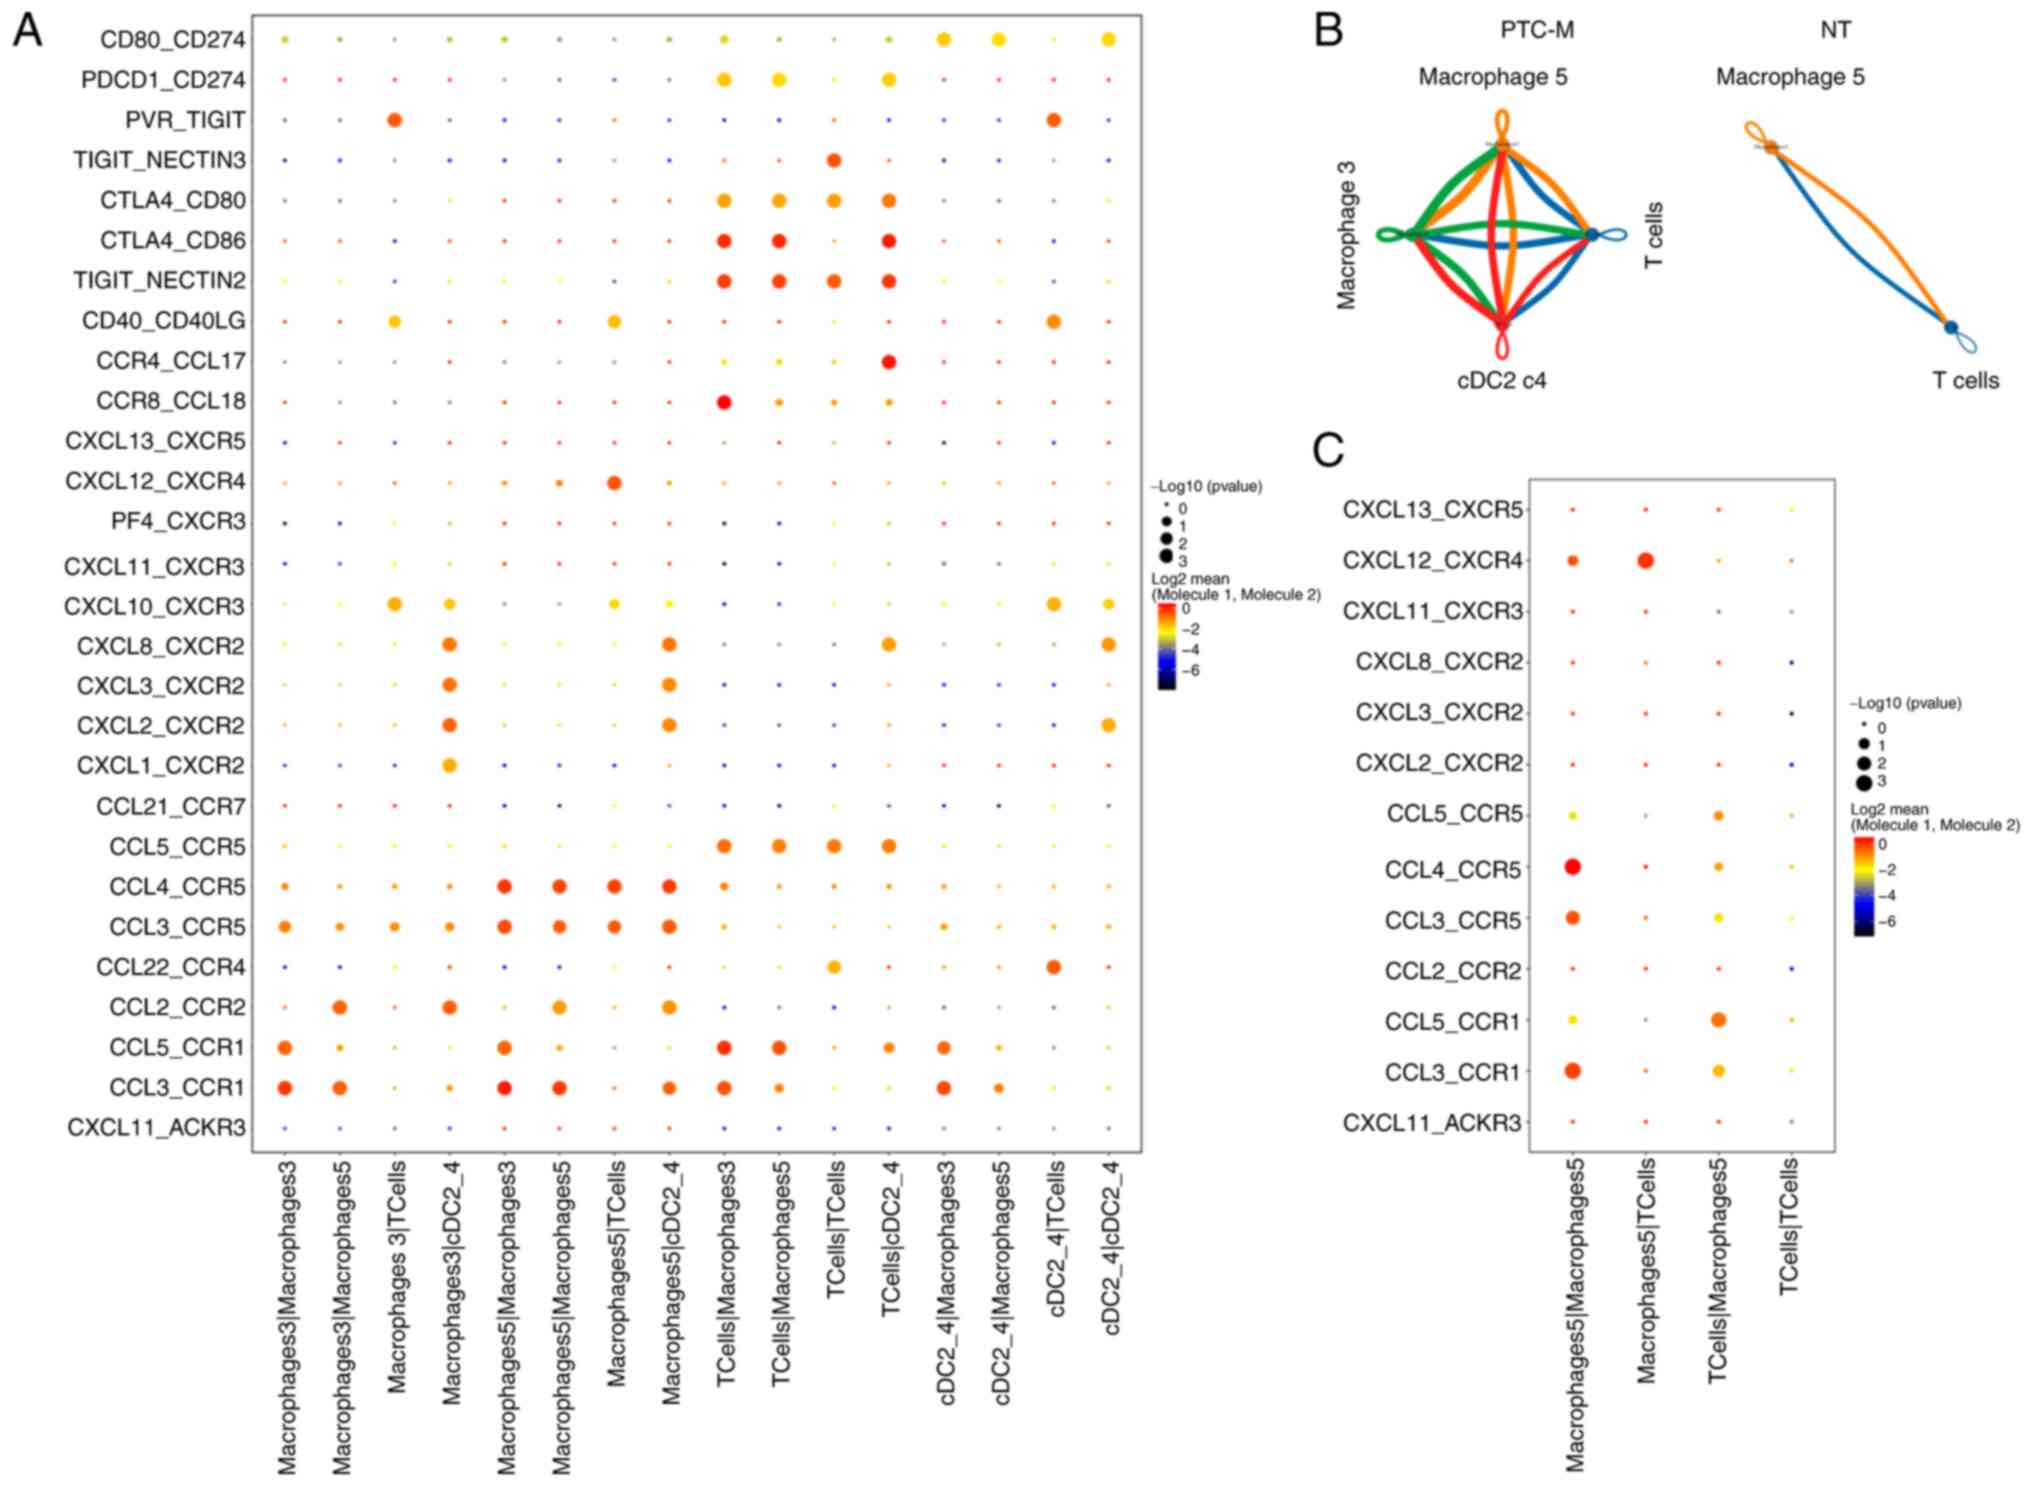
between macrophages c3, c5, cDCs c2 and T cells (Fig. 6A and B). Treg markers, such as TIGIT
and CTLA-4, were expected to facilitate various immune-suppressive
interactions between macrophages and DCs (35). In addition, it was projected that
macrophage c3 and cDCs c2 could interact with Treg cells through
the CCL18-CCR8 complex and CCL22-CCR4 complex,
respectively (Fig. 6A) (36). The presence of cell-cell contacts
was predominantly observed in the PTC-M sample, while being rare in
the NT sample (Fig. 6B and C). It
is worth mentioning that there are likely communications between
cDCs c2 and macrophages in the tumor-associated environment and
these communications are projected to be facilitated by the
CXCL2/3/8-CXCR2 complex (Fig. 6A;
Table SIII). In summary, the
present data showed that the cDCs c2 subtypes had the strongest
association with CD4+ T cells in terms of L-R pair and
were possibly linked to the infiltration or dysfunction of T-cell
subtypes.
cDC2s associated with CD4+
T and Treg cell infiltration in the advanced stage of PTC
In order to comprehend the function of T cells in
the microenvironment, UMAP was used to categorize T cells into four
distinct subclasses, including CD4+ naive T cells
(CD4, CCR7, LEF1, SELL, TCF7 and IL7R), Treg cells
(CD3D, FOXP3, IL2RA, CTLA4 and IKZF2), CD8+ effector
T cells (CD3D, CD8A/B, NKG7, GZMA and GNLY) and
proliferating T cells (TOP2A, MKI67 and CD3D)
(Fig. 7A and C). Unsurprisingly,
PTC-M tissue exhibited over four times the amount of T-cell
infiltration and a greater proportion of Tregs compared to NT and
PTC tissues, indicating a more immune-suppressive milieu in PTC-M
(Fig. 7C). Fig. 7B displays the manifestation of
distinct T-cell marker genes. Based on the examination of cell-cell
communication, it was observed that the majority of interactions
took place between the cDC c2 cluster and T cells (Fig. 6B; Table
SIII). Upon further examination, the application of mIHC
staining on PTC-M tumor sections allowed for the clear observation
of the close proximity of LAMP3+ mregDCs and CCR4+ T
cells (Fig. 7D). The
ligand-receptor pair showed a specific enrichment in the PTC-M
tissue, indicating its connection with the development of tumors
and the metastasis of cancer in this particular malignancy.
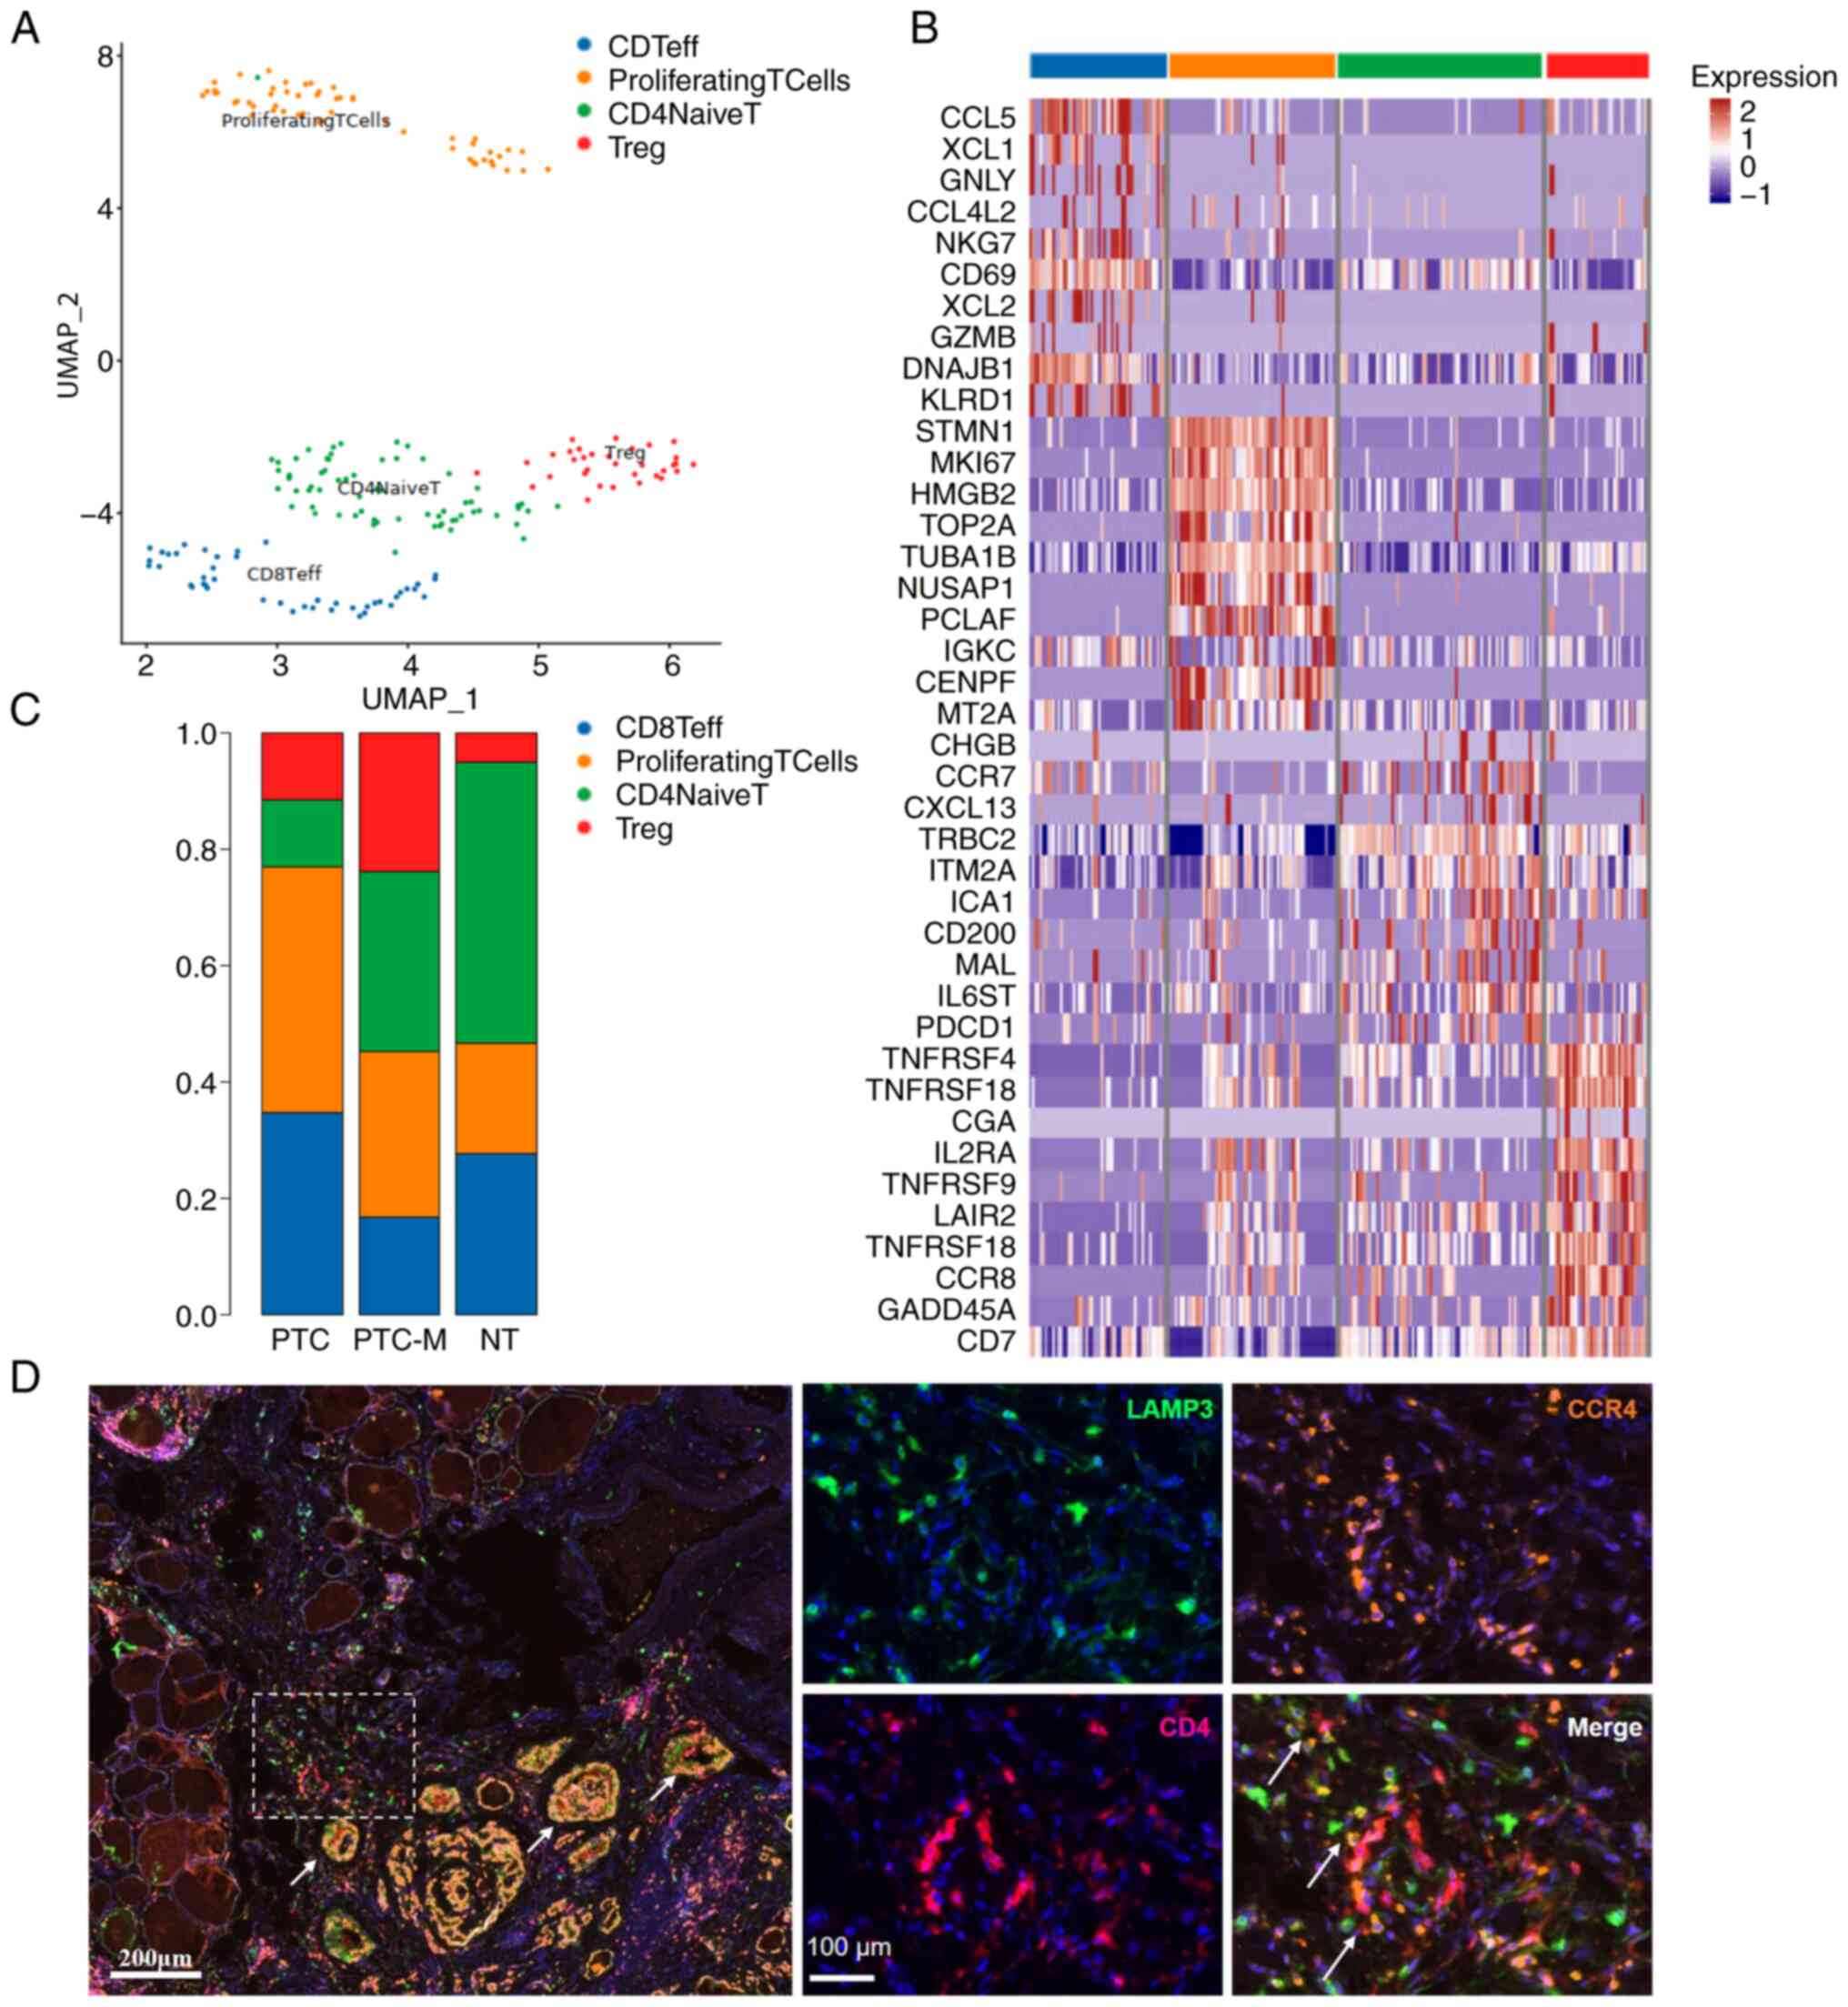 | Figure 7.Characterization of Tregs and their
crosstalk with mregDCs in PTC tissues. (A) UMAP projection of the
different types of T cells. (B) Heatmap showing differential
expression of genes in T-cell clusters. (C) Percentage of Teff
cells, Treg cells, proliferating T cells and Naïve T cells in PTC,
PTC-M and NT tissues. (D) Representative image illustrating the
interaction between mregDCs and Tregs in PTC-M tissue, which was
immuno-stained by multicolor immunohistochemistry with antibodies
against LAMP3 (green), CD4 (red) and CCR4 (purple). The scale bar
in the larger figure to the left represents 200 µm, with a
magnification of ×4. The scale bar in the right figure represents
100 mm and white arrows indicate the colocalization. PTC-M,
metastatic papillary thyroid cancer; NT, non-tumor; UMAP, Uniform
Manifold Approximation and Projection; mregDCs, mature dendritic
cells enriched in immunoregulatory molecules; Treg cell,
T-regulatory cell; Teff cell, effector T cell. |
Discussion
Currently, there is a limited understanding of the
specific immune cells involved in aggressive thyroid tumors. The
present study focused on characterizing the immune microenvironment
in PTCs. The results demonstrated that the PTC with metastases
exhibited a higher degree of immune infiltration. Tumor-associated
M2 macrophages, DCs and Treg cells collaborated to create a
tumor-promoting environment within the tumor tissue. In contrast, B
cells, monocytes and M1 macrophages, which are typically beneficial
in healthy tissues, are significantly reduced in PTC tumors. In the
present investigation, a small population of NK cells and
neutrophils was observed. However, it was not possible to
categorize them into distinct clusters and the knowledge of the
role of NK cells and neutrophils in the immune milieu of PTC thus
remains limited. Various computational methods have been used to
analyze PTC data in the TCGA cohort. These methods indicate that
the presence of immune cells that promote tumor growth was
significantly higher throughout the occurrence and advancement of
PTC (6,9,37).
Furthermore, it was hypothesized that TAMs and DCs produced from
PTCs could potentially play a role in the differentiation of Tregs
and the subsequent suppression or evasion of the immune system
(7,10,38).
Our findings provide strong evidence that an inflammatory
environment plays a critical role in PTC progression and is
particularly prominent in advanced stages. The immuno-suppressive
environment in PTC is predominantly regulated by mononuclear
phagocytes, specifically macrophages and dendritic cells, based on
the percentage of immune cells. In particular, a group of M2-like
macrophages expressing MRC1 and CCL18
(MRC1+CCL18+ M2), as well as a
group of cDC cells expressing LAMP3 and CCL22, which
have characteristics similar to mregDCs, were identified.
Furthermore, there was a noticeable abundance of these two groups
of cells in metastasis-associated immune infiltration, accompanied
by a greater ratio of Treg cells in the aggressive PTC-M. These
cells could exert a pivotal influence on the development of tumors
and the metastasis of cancer cells, which warranted a thorough
examination of their associations.
M2-like TAMs have been detected in cases of lung
cancer, breast cancer and hepatocellular carcinomas (33,39–41).
The metastatic lesion of colorectal cancer in the liver is
characterized by the infiltration of immunosuppressive cells,
specifically SPP1+ macrophages and
MRC1+CCL18+ M2-like macrophages
(25). In the present study, a
similar TAM subtype was discovered in the PTC tumors that has both
a high phagocytosis capability and a strong oxidative
phosphorylation signature.
Recent studies have also identified distinct cDC
clusters in hepatocellular carcinoma, lung cancer, neck squamous
cell carcinoma (42) and
non-malignant inflamed tissue (43). The mature cDCs expressing LAMP3,
CCL22 and CCL19 found in hepatocellular carcinoma are
capable of migrating from tumors to lymph nodes. Despite certain
variations in the expression profiles, these cells exhibited
similarities to a subtype of mature dendritic cells that are
abundant in immunoregulatory molecules. They were classified as
mregDCs.
Within the PTC-M sample, a robust infiltration of
dendritic cells was detected that harbored a specific subtype of
LAMP3+CCL22+CCL17+
mregDCs. The CellPhoneDB study showed that both
MRC1+CCL18+ macrophages and
LAMP3+CCL22+ mregDCs in the
PTC-M tissue communicated with Tregs through several
ligand-receptor complexes, particularly CCL22-CCR4 and CCL18-CCR8.
Through the utilization of mIHC, it was possible to observe the
contact between LAMP3+CCL22+
mregDCs and Tregs. The mregDC cluster cells are expected to
interact with Tregs through the ligand-receptor pairs
CCL22-CCR4 and CCL17-CCR4, which then leads to the
activation of Tregs and their infiltration into the tumor
microenvironment. This observation indicates that immunotherapy
targeting cytokines/chemokines could be a promising method for
treating advanced PTC (44,45). In addition, CellPhoneDB predicted
interactions between LAMP3+CCL22+ cDCs and
MRC1+CCL18+ macrophages through CXCR2-CXCL2/3/8 complexes,
highlighting the need for further research to elucidate the
regulatory mechanisms between these myeloid cells.
One limitation of the present study is the
relatively small sample size, which may impact the generalizability
of the present findings. While the single-cell RNA sequencing data
provide valuable insight into the immune landscape of PTC, the
limited number of samples reduces the statistical power and may not
fully capture the heterogeneity of the immune microenvironment,
particularly across different patient populations. In addition, our
findings lack functional experimental validation, which is
necessary to confirm the specific roles of immune cell subtypes,
such as M2 macrophages and mregDCs, in tumor progression. Future
studies with larger cohorts and functional assays are essential to
validate these observations and further explore the underlying
mechanisms in PTC.
To summarize, the present single-cell analysis of
immune cells in metastatic and non-metastatic PTC provides evidence
of the presence and makeup of immune cells in PTCs at a
single-cellular level. Our research reveals distinct lineages and
aggressive associations among macrophages, cDCs and Tregs clusters
in advanced PTC. These findings offer vital knowledge and tools for
further exploration of metastatic PTC and may guide the development
of new treatment options for advanced PTC.
Supplementary Material
Supporting Data
Supporting Data
Supporting Data
Supporting Data
Acknowledgements
Not applicable.
Funding
This study was supported by grants from the Doctoral Fund of
Jining First People's Hospital (grant no. 2020005), Jining Key
Research and Development Program (grant nos. 2022YXNS133,
2023YXNS075 and 2023YXNS223), Shandong Medical and Health Science
and Technology Development Plan Project (grant no. 202101040510),
the National Natural Science Foundation of China (grant nos.
82074360), the Natural Science Foundation of Shandong Province
(grant no. ZR2022LZY027) and the Young Taishan Scholars Program of
Shandong Province (grant no. tsqn201909200).
Availability of data and materials
All data are available in the main manuscript or
supplemental data. The raw sequencing data reported in this paper
have been deposited in the Genome Sequence Archive (Genomics,
Proteomics & Bioinformatics 2021) at the National Genomics Data
Center (Nucleic Acids Res 2022), China National Center for
Bioinformation/Beijing Institute of Genomics, Chinese Academy of
Sciences (PRJCA027425). These data are publicly accessible at
https://ngdc.cncb.ac.cn/gsa-human/browse/HRA007797.
Author's contributions
Conceptualization was performed by SJ and BL. Data
was analyzed by NZ, SZ, QW, XT, LL and QL. SZ, QW, SW and QL
performed the experiments. Original draft preparation was by NZ,
SZ, QW and QL. Sample collection was performed by XL. Manuscript
reviewing and editing was performed by LL, SW and QL. LL, XT and QL
visualized the study. SJ supervised the study, and SJ and QL
acquired funding. QL and SJ confirm the authenticity of all the raw
data. All authors have read and approved the final version of the
manuscript.
Ethics approval and consent to
participate
This work was reviewed and approved by the Ethics
Committee of Jining First People's Hospital (Jining, China;
approval no. 2021-038). The patients/participants provided their
written informed consent to participate in this study in June 2022.
The study was performed in accordance with the Declaration of
Helsinki.
Patient consent for publication
Written consent was obtained from the participants
to publish their patient data.
Competing interests
The authors declare that they have no competing
interests.
Glossary
Abbreviations
Abbreviations:
|
PTC
|
papillary thyroid cancer
|
|
LN
|
lymph node
|
|
scRNA-seq
|
single-cell RNA sequencing
|
|
DCs
|
dendritic cells
|
|
PTC-M
|
metastatic PTC
|
|
cDC2s
|
conventional-type 2 DCs
|
|
Tregs
|
regulatory T cells
|
|
TAMs
|
tumor-associated macrophages
|
|
TME
|
tumor microenvironment
|
|
NT
|
non-tumor
|
|
GO
|
Gene Ontology
|
|
KEGG
|
Kyoto Encyclopedia of Genes and
Genomes
|
|
UMAP
|
Uniform Manifold Approximation and
Projection
|
References
|
1
|
Pizzato M, Li M, Vignat J, Laversanne M,
Singh D, La Vecchia C and Vaccarella S: The epidemiological
landscape of thyroid cancer worldwide: GLOBOCAN estimates for
incidence and mortality rates in 2020. Lancet Diabetes Endocrinol.
10:264–272. 2022. View Article : Google Scholar : PubMed/NCBI
|
|
2
|
Cheng F, Xiao J, Shao C, Huang F, Wang L,
Ju Y and Jia H: Burden of Thyroid Cancer From 1990 to 2019 and
Projections of Incidence and Mortality Until 2039 in China:
Findings From Global Burden of Disease Study. Front Endocrinol
(Lausanne). 12:7382132021. View Article : Google Scholar : PubMed/NCBI
|
|
3
|
Cabanillas ME, McFadden DG and Durante C:
Thyroid cancer. Lancet. 388:2783–2795. 2016. View Article : Google Scholar : PubMed/NCBI
|
|
4
|
Suh YJ, Kwon H, Kim SJ, Choi JY, Lee KE,
Park YJ, Park DJ and Youn YK: Factors affecting the locoregional
recurrence of conventional papillary thyroid carcinoma after
surgery: A Retrospective Analysis of 3381 Patients. Ann Surg Oncol.
22:3543–3549. 2015. View Article : Google Scholar : PubMed/NCBI
|
|
5
|
Zhan L, Feng HF, Yu XZ, Li LR, Song JL, Tu
Y, Yuan JP, Chen C and Sun SR: Clinical and prognosis value of the
number of metastatic lymph nodes in patients with papillary thyroid
carcinoma. BMC Surg. 22:2352022. View Article : Google Scholar : PubMed/NCBI
|
|
6
|
Pu W, Shi X, Yu P, Zhang M, Liu Z, Tan L,
Han P, Wang Y, Ji D, Gan H, et al: Single-cell transcriptomic
analysis of the tumor ecosystems underlying initiation and
progression of papillary thyroid carcinoma. Nat Commun.
12:60582021. View Article : Google Scholar : PubMed/NCBI
|
|
7
|
Xie Z, Li X, He Y, Wu S, Wang S, Sun J, He
Y, Lun Y and Zhang J: Immune cell confrontation in the papillary
thyroid carcinoma microenvironment. Front Endocrinol (Lausanne).
11:5706042020. View Article : Google Scholar : PubMed/NCBI
|
|
8
|
Galdiero MR, Varricchi G and Marone G: The
immune network in thyroid cancer. Oncoimmunology. 5:e11685562016.
View Article : Google Scholar : PubMed/NCBI
|
|
9
|
Yan T, Qiu W, Weng H, Fan Y, Zhou G and
Yang Z: Single-Cell transcriptomic analysis of ecosystems in
papillary thyroid carcinoma progression. Front Endocrinol
(Lausanne). 12:7295652021. View Article : Google Scholar : PubMed/NCBI
|
|
10
|
Bergdorf K, Ferguson DC, Mehrad M, Ely K,
Stricker T and Weiss VL: Papillary thyroid carcinoma behavior:
Clues in the tumor microenvironment. Endocr Relat Cancer.
26:601–614. 2019. View Article : Google Scholar : PubMed/NCBI
|
|
11
|
Bentz BG, Miller BT, Holden JA, Rowe LR
and Bentz JS: B-RAF V600E mutational analysis of fine needle
aspirates correlates with diagnosis of thyroid nodules. Otolaryngol
Head Neck Surg. 140:709–714. 2009. View Article : Google Scholar : PubMed/NCBI
|
|
12
|
Dura B, Choi JY, Zhang K, Damsky W,
Thakral D, Bosenberg M, Craft J and Fan R: scFTD-seq: Freeze-thaw
lysis based, portable approach toward highly distributed
single-cell 3′ mRNA profiling. Nucleic Acids Res. 47:e162019.
View Article : Google Scholar : PubMed/NCBI
|
|
13
|
Martin M: Cutadapt removes adapter
sequences from high-throughput sequencing reads. EMBnet J.
17:10–12. 2011. View Article : Google Scholar
|
|
14
|
Dobin A, Davis CA, Schlesinger F, Drenkow
J, Zaleski C, Jha S, Batut P, Chaisson M and Gingeras TR: STAR:
Ultrafast universal RNA-seq aligner. Bioinformatics. 29:15–21.
2013. View Article : Google Scholar : PubMed/NCBI
|
|
15
|
Liao Y, Smyth GK and Shi W: featureCounts:
An efficient general purpose program for assigning sequence reads
to genomic features. Bioinformatics. 30:923–930. 2014. View Article : Google Scholar : PubMed/NCBI
|
|
16
|
Satija R, Farrell JA, Gennert D, Schier AF
and Regev A: Spatial reconstruction of single-cell gene expression
data. Nat Biotechnol. 33:495–502. 2015. View Article : Google Scholar : PubMed/NCBI
|
|
17
|
Yu G, Wang LG, Han Y and He QY:
clusterProfiler: An R package for comparing biological themes among
gene clusters. OMICS. 16:284–287. 2012. View Article : Google Scholar : PubMed/NCBI
|
|
18
|
Hänzelmann S, Castelo R and Guinney J:
GSVA: Gene set variation analysis for microarray and RNA-seq data.
BMC Bioinformatics. 14:72013. View Article : Google Scholar : PubMed/NCBI
|
|
19
|
Qiu X, Hill A, Packer J, Lin D, Ma YA and
Trapnell C: Single-cell mRNA quantification and differential
analysis with Census. Nat Methods. 14:309–315. 2017. View Article : Google Scholar : PubMed/NCBI
|
|
20
|
Gulati GS, Sikandar SS, Wesche DJ,
Manjunath A, Bharadwaj A, Berger MJ, Ilagan F, Kuo AH, Hsieh RW,
Cai S, et al: Single-cell transcriptional diversity is a hallmark
of developmental potential. Science. 367:405–411. 2020. View Article : Google Scholar : PubMed/NCBI
|
|
21
|
Efremova M, Vento-Tormo M, Teichmann SA
and Vento-Tormo R: CellPhoneDB: Inferring cell-cell communication
from combined expression of multi-subunit ligand-receptor
complexes. Nat Protoc. 15:1484–1506. 2020. View Article : Google Scholar : PubMed/NCBI
|
|
22
|
Carstens JL, Correa de Sampaio P, Yang D,
Barua S, Wang H, Rao A, Allison JP, LeBleu VS and Kalluri R:
Spatial computation of intratumoral T cells correlates with
survival of patients with pancreatic cancer. Nat Commun.
8:150952017. View Article : Google Scholar : PubMed/NCBI
|
|
23
|
Bankhead P, Loughrey MB, Fernández JA,
Dombrowski Y, McArt DG, Dunne PD, McQuaid S, Gray RT, Murray LJ,
Coleman HG, et al: QuPath: Open source software for digital
pathology image analysis. Sci Rep. 7:168782017. View Article : Google Scholar : PubMed/NCBI
|
|
24
|
Skytthe MK, Graversen JH and Moestrup SK:
Targeting of CD163+ Macrophages in Inflammatory and Malignant
Diseases. Int J Mol Sci. 21:54972020. View Article : Google Scholar : PubMed/NCBI
|
|
25
|
Wu Y, Yang S, Ma J, Chen Z, Song G, Rao D,
Cheng Y, Huang S, Liu Y, Jiang S, et al: Spatiotemporal immune
landscape of colorectal cancer liver metastasis at single-cell
level. Cancer Discov. 12:134–153. 2022. View Article : Google Scholar : PubMed/NCBI
|
|
26
|
Huang X, Li Y, Fu M and Xin HB: Polarizing
macrophages in vitro. Methods Mol Biol. 1784:119–126. 2018.
View Article : Google Scholar : PubMed/NCBI
|
|
27
|
Lv SL, Zeng ZF, Gan WQ, Wang WQ, Li TG,
Hou YF, Yan Z, Zhang RX and Yang M: Lp-PLA2 inhibition prevents Ang
II-induced cardiac inflammation and fibrosis by blocking macrophage
NLRP3 inflammasome activation. Acta Pharmacol Sin. 42:2016–2032.
2021. View Article : Google Scholar : PubMed/NCBI
|
|
28
|
Tang TT, Lv LL, Pan MM, Wen Y, Wang B, Li
ZL, Wu M, Wang FM, Crowley SD and Liu BC: Hydroxychloroquine
attenuates renal ischemia/reperfusion injury by inhibiting
cathepsin mediated NLRP3 inflammasome activation. Cell Death Dis.
9:3512018. View Article : Google Scholar : PubMed/NCBI
|
|
29
|
Rebeck GW: The role of APOE on lipid
homeostasis and inflammation in normal brains. J Lipid Res.
58:1493–1499. 2017. View Article : Google Scholar : PubMed/NCBI
|
|
30
|
Zhou L, Zhuo H, Ouyang H, Liu Y, Yuan F,
Sun L, Liu F and Liu H: Glycoprotein non-metastatic melanoma
protein b (Gpnmb) is highly expressed in macrophages of acute
injured kidney and promotes M2 macrophages polarization. Cell
Immunol. 316:53–60. 2017. View Article : Google Scholar : PubMed/NCBI
|
|
31
|
Guilliams M, Ginhoux F, Jakubzick C, Naik
SH, Onai N, Schraml BU, Segura E, Tussiwand R and Yona S: Dendritic
cells, monocytes and macrophages: A unified nomenclature based on
ontogeny. Nat Rev Immunol. 14:571–578. 2014. View Article : Google Scholar : PubMed/NCBI
|
|
32
|
Maier B, Leader AM, Chen ST, Tung N, Chang
C, LeBerichel J, Chudnovskiy A, Maskey S, Walker L, Finnigan JP, et
al: A conserved dendritic-cell regulatory program limits antitumour
immunity. Nature. 580:257–262. 2020. View Article : Google Scholar : PubMed/NCBI
|
|
33
|
Zhang Q, He Y, Luo N, Patel SJ, Han Y, Gao
R, Modak M, Carotta S, Haslinger C, Kind D, et al: Landscape and
dynamics of single immune cells in hepatocellular carcinoma. Cell.
179:829–845.e20. 2019. View Article : Google Scholar : PubMed/NCBI
|
|
34
|
Liu W, Hu H, Shao Z, Lv X, Zhang Z, Deng
X, Song Q, Han Y, Guo T, Xiong L, et al: Characterizing the tumor
microenvironment at the single-cell level reveals a novel immune
evasion mechanism in osteosarcoma. Bone Res. 11:42023. View Article : Google Scholar : PubMed/NCBI
|
|
35
|
Rowshanravan B, Halliday N and Sansom DM:
CTLA-4: A moving target in immunotherapy. Blood. 131:58–67. 2018.
View Article : Google Scholar : PubMed/NCBI
|
|
36
|
Rapp M, Wintergerst MWM, Kunz WG, Vetter
VK, Knott MML, Lisowski D, Haubner S, Moder S, Thaler R, Eiber S,
et al: CCL22 controls immunity by promoting regulatory T cell
communication with dendritic cells in lymph nodes. J Exp Med.
216:1170–1181. 2019. View Article : Google Scholar : PubMed/NCBI
|
|
37
|
Yin H, Tang Y, Guo Y and Wen S: Immune
microenvironment of thyroid cancer. J Cancer. 11:4884–4896. 2020.
View Article : Google Scholar : PubMed/NCBI
|
|
38
|
Yu H, Huang X, Liu X, Jin H, Zhang G,
Zhang Q and Yu J: Regulatory T cells and plasmacytoid dendritic
cells contribute to the immune escape of papillary thyroid cancer
coexisting with multinodular non-toxic goiter. Endocrine.
44:172–181. 2013. View Article : Google Scholar : PubMed/NCBI
|
|
39
|
He D, Wang D, Lu P, Yang N, Xue Z, Zhu X,
Zhang P and Fan G: Single-cell RNA sequencing reveals heterogeneous
tumor and immune cell populations in early-stage lung
adenocarcinomas harboring EGFR mutations. Oncogene. 40:355–368.
2021. View Article : Google Scholar : PubMed/NCBI
|
|
40
|
Choi J, Gyamfi J, Jang H and Koo JS: The
role of tumor-associated macrophage in breast cancer biology.
Histol Histopathol. 33:133–145. 2018.PubMed/NCBI
|
|
41
|
Chung W, Eum HH, Lee HO, Lee KM, Lee HB,
Kim KT, Ryu HS, Kim S, Lee JE, Park YH, et al: Single-cell RNA-seq
enables comprehensive tumour and immune cell profiling in primary
breast cancer. Nat Commun. 8:150812017. View Article : Google Scholar : PubMed/NCBI
|
|
42
|
Fan C, Wu J, Shen Y, Hu H, Wang Q, Mao Y,
Ye B and Xiang M: Hypoxia promotes the tolerogenic phenotype of
plasmacytoid dendritic cells in head and neck squamous cell
carcinoma. Cancer Med. 11:922–930. 2022. View Article : Google Scholar : PubMed/NCBI
|
|
43
|
Zhang QY, Ye XP, Zhou Z, Zhu CF, Li R,
Fang Y, Zhang RJ, Li L, Liu W, Wang Z, et al: Lymphocyte
infiltration and thyrocyte destruction are driven by stromal and
immune cell components in Hashimoto's thyroiditis. Nat Commun.
13:7752022. View Article : Google Scholar : PubMed/NCBI
|
|
44
|
Propper DJ and Balkwill FR: Harnessing
cytokines and chemokines for cancer therapy. Nat Rev Clin Oncol.
19:237–253. 2022. View Article : Google Scholar : PubMed/NCBI
|
|
45
|
Berlato C, Khan MN, Schioppa T, Thompson
R, Maniati E, Montfort A, Jangani M, Canosa M, Kulbe H, Hagemann
UB, et al: A CCR4 antagonist reverses the tumor-promoting
microenvironment of renal cancer. J Clin Invest. 127:801–813. 2017.
View Article : Google Scholar : PubMed/NCBI
|


