Introduction
Lung cancer, a malignancy arising from the bronchial
mucosal epithelium and mucous glands, was estimated to account for
~2.2 million new cases of cancer and 1.8 million deaths worldwide
in 2020 (1). Lung cancer is broadly
classified into small cell lung cancer (SCLC), which comprises ~15%
of cases, and non-SCLC (NSCLC), which comprises ~75% of cases
(2). NSCLC can be further
histologically subdivided into lung adenocarcinoma (LUAD), large
cell carcinoma and lung squamous cell carcinoma (3). LUAD accounts for ~50% of all lung
cancer diagnoses, with the majority of patients receiving their
diagnosis at either intermediate or advanced stages (4). Therapy for patients with LUAD
typically involves a combination of chemotherapy, immunotherapy,
targeted therapy, radiation and surgery; however, the 5-year
survival rate for LUAD patients remains at ~15% (5). In addition, these treatments are
frequently associated with marked therapy-related toxicity and
surgical risks, resulting in poor clinical outcomes for those with
advanced LUAD. Therefore, the development of strategies to identify
patients who may benefit from more aggressive therapeutic
interventions is urgently required. Consequently, the
identification of novel diagnostic biomarkers for prognostication
and therapeutic response in patients with LUAD is critically
important.
Cell death is a crucial physiological process in all
living organisms, as it plays a key role in embryonic development,
the upkeep of organ structure and function, tumor formation and
immune responses (6). Programmed
cell death (PCD) is an important mode of cell death, characterized
by various complex mechanisms that interact with each other. PCD
comprises a broad spectrum of distinct cellular death mechanisms,
including necroptosis, apoptosis, pyroptosis, ferroptosis,
lysosome-dependent cell death, entotic cell death, parthanatos,
oxeiptosis, autophagy, alkaliptosis, disulfidptosis and
cuproptosis, (7). PCD is essential
for modulating the immunosuppressive environment within tumors,
influencing patient prognosis and determining treatment
responsiveness (8). In recent
years, numerous researchers have demonstrated that apoptotic
inducers prolong the survival of patients with advanced, metastatic
or recurrent tumors, by reducing recurrence and metastasis
(9). Autophagy is a mechanism with
both detrimental and beneficial effects, as it confers
chemoresistance and promotes cell survival, while in some cases, it
also enhances sensitivity to chemotherapy and leads to cell death.
Clinical studies have explored the use of small molecule modulators
and natural compounds targeting autophagy to modify cancer cell
responses to chemotherapy, achieving varying degrees of success
(10). Cuproptosis (11), ferroptosis (12), PANoptosis (13) and disulfidptosis (14) have emerged as important areas of
research, closely associated with the tumor immune
microenvironment. In addition, researchers have constructed
predictive models based on PCD-related genes (PRGs), which have
achieved success in malignant tumors such as lung cancer (15), hepatocellular carcinoma (16) and gastric cancer (17). Thus, the examination of genes
associated with PCD may assist clinicians in the prediction of
survival outcomes and the development of personalized treatment
strategies for patients with cancer. Nonetheless, numerous studies
focus on a single mechanism of PCD, which introduces limitations.
It remains necessary to enhance the effectiveness of PCD-based
predictive models. With the discovery of several new types of PCD,
including PANoptosis, cuproptosis and disulfidptosis, it is crucial
to update the molecular functions, prognostic value and expression
patterns of PRGs in LUAD.
Neurotrophic factors (NTs) are crucial in the
development, survival and health of the central and peripheral
nervous systems. The mammalian NT family includes nerve growth
factor, brain-derived neurotrophic factor (BDNF), NT-3 and NT-4/5
(18). Previous studies have shown
that both squamous cell carcinoma and LUAD exhibit elevated
expression levels of BDNF at the protein and mRNA levels (18,19).
BDNF activity is mediated by its high-affinity tyrosine kinase
receptor, known as tropomyosin receptor kinase B (TrkB). This
activates various downstream signaling pathways, including the
PI3K/AKT, RAS/ERK, Jak/STAT, phospholipase C/protein kinase C and
AMP-activated protein kinase/acetyl CoA carboxylase pathways,
thereby promoting lung cancer growth, metastasis and
chemoresistance (20,21). Clinical analysis has also confirmed
that high BDNF expression is associated with poor prognosis in
patients with lung cancer (22).
Although the role of BDNF in the promotion of lung cancer growth is
well established, preliminary investigations suggest that BDNF may
also be involved in the regulation of PCD, thereby influencing the
survival and invasiveness of lung cancer cells.
The aim of the present study was to identify genes
associated with 15 distinct PCD types that are differentially
expressed between LUAD and normal samples, and to develop a
predictive tool to investigate the potential role of PRGs in LUAD.
With the increased application of personalized medicine and
immunotherapy in clinical practice, immune infiltration has
increasingly become a key prognostic marker for various cancer
types (23). Therefore, the present
study also aimed to predict biomarkers of the tumor
microenvironment (TME), characterize the immune landscape, assess
drug sensitivities and analyze somatic mutations in patients
stratified by risk, as well as to propose novel clinical therapies
for those with LUAD. Furthermore, through bioinformatics, Mendelian
randomization (MR) and cellular experiments, the study investigated
the critical role of BDNF in the regulation of PCD in lung cancer.
The findings of the study may provide valuable insights that could
contribute to personalized treatment strategies for patients with
lung cancer.
Materials and methods
Acquisition of RNA-sequencing
transcriptomic data
RNA-sequencing transcriptomic information and
associated clinical data for 15 patterns of PCD were obtained from
The Cancer Genome Atlas (TCGA; https://portal.gdc.cancer.gov/; using lung
adenocarcinoma as a key word). This dataset comprised 412 LUAD
cases with 43 adjacent normal tissue samples. Clinical variables
for the patients were collected, included sex, age, tumor stage and
Tumor-Node-Metastasis (TNM) classification. In total, 1,670 PRGs
were acquired via screening the GeneCards database (https://www.genecards.org/) and reviewing relevant
literature. Expression data for these 1,670 PRGs were extracted
from TCGA LUAD cohort for further analysis. To validate the
findings obtained from TCGA data, four datasets from the Gene
Expression Omnibus (GEO; http://www.ncbi.nlm.nih.gov/geo) were employed:
GSE8894 (24), GSE31201 (25), GSE30219 (26) and GSE42127 (27). A comprehensive list of the analyzed
genes is presented in Table
SI.
Identification of PRGs in LUAD
Wilcoxon test in R (version R 4.1.2; www.r-project.org) was used to determine
differentially expressed PRGs between adjacent normal and LUAD
tissues. The criteria for significance included a false discovery
rate (FDR) <0.05 and an absolute log2-fold change
>1. The vioplot R package (https://rdocumentation.org/packages/vioplot/versions/0.4.0)
was utilized to produce heatmaps and volcano plots, which visually
depict the differential expression of PRGs in LUAD compared with
that in adjacent normal tissue.
Weighted gene co-expression network
analysis (WGCNA)
WGCNA is a comprehensive biological approach widely
employed to analyze genetic association patterns across diverse
samples, which is particularly effective for the identification of
highly co-expressed genes. By examining the interrelatedness of
genes and their associations with phenotypic traits, WGCNA
facilitates the identification of potential candidate markers
(28). Using the WGCNA R package
(http://www.genetics.ucla.edu/labs/horvath/CoexpressionNetwork/Rpackages/WGCNA/Tutorials/index.html),
a gene co-expression network for PCD was developed. The selection
of the soft threshold power was performed using the
pickSoftThreshold function within the WGCNA package. Pearson's
correlation analysis was then performed to evaluate the
relationships between the LUAD index and module eigengenes. The
maximum Pearson correlation coefficient was used to identify the
key module most closely correlated with the LUAD index. Genes
intersecting within this module were considered candidate hub genes
relevant to PCD in LUAD. To further investigate the relationships
among PRGs, Spearman's correlation analysis was conducted.
Protein-protein interactions (PPIs) of PCD-related proteins were
investigated using the STRING database (https://string-db.org/), resulting in the
establishment of a PPI network. Critical modules and hub genes were
identified using the cytohubba and MCODE plugins in Cytoscape 3.9.1
(https://cytoscape.org/). In addition, Gene
Ontology (GO; http://geneontology.org/) and Kyoto Encyclopedia of
Genes and Genomes (KEGG; http://www.kegg.jp) pathway analyses were performed to
functionally annotate the PRGs.
Evaluation and verification of the
prognostic significance of PRGs in patients with LUAD
The associations between the PRGs and overall
survival (OS) were assessed using univariate Cox regression
analysis. To refine the selection of candidate genes and construct
a prognostic model, the least absolute shrinkage and selection
operator (LASSO) regression algorithm was employed via the R
package glmnet (https://rdocumentation.org/packages/glmnet/versions/4.1–7).
Ultimately, six genes, along with their associated coefficients,
were retained, with the penalty parameter (λ) selected based on the
minimum criteria. The risk score was calculated by multiplying the
gene expression levels obtained from the LASSO Cox regression model
by their corresponding coefficients. This risk score was then
applied to classify the patients with LUAD into high- and low-risk
groups. Kaplan-Meier survival analysis was performed to compare the
OS probability between these groups, and receiver operating
characteristic (ROC) curve analysis was conducted using the
survminer (https://rdocumentation.org/packages/survminer/versions/0.4.9),
timeROC (https://rdocumentation.org/packages/timeROC/versions/0.4)
and survival (version 2.41-0; http://github.com/therneau/survival) R packages. In
addition, relevant clinical variables across different risk groups
were compared using the χ2 test, and the results were
visualized as a heatmap.
To validate the prognostic signature, the
aforementioned GSE8894, GSE31201, GSE30219 and GSE42127 GEO
datasets were used. Univariate and multivariate Cox regression
analyses were conducted using the survivalROC and survival R
packages to evaluate whether the risk score served as an
independent prognosticative indicator. In addition, prognostic
nomograms were developed using the rms (https://rdocumentation.org/packages/rms/versions/6.5–0)
R package, incorporating risk scores and clinical stage to predict
the OS of patients with LUAD. Calibration plots were constructed to
evaluate the concordance between the predicted and observed 1-, 2-,
3- and 5-year OS rates.
Gene set enrichment analysis (GSEA)
based on the signature
GSEA was employed to identify potential mechanisms
by analyzing the enriched pathways in the low- and high-risk
groups. The reference gene sets included HALLMARK, C2:KEGG and
C5:GO. The criteria for examination were a normalized enrichment
score >1, q-value <0.25, and nominal P-value <0.05.
Immune landscape analysis
The profiles of immune components were assessed
using several algorithms, including QUANTISEQ, TIMER, XCELL, EPIC,
MCPcounter and CIBERSORT, with visualization facilitated by the
limma R (https://rdocumentation.org/packages/limma/versions/3.28.14)
package. Gene set variation analysis and single-sample GSEA
(ssGSEA) were employed to evaluate immune function and immune cell
subset infiltration. The ESTIMATE algorithm was utilized to
calculate stromal, immune and tumor purity scores on the basis of
the proportions of stromal and immune cells. Additionally, the
expression of major histocompatibility complex (MHC) molecules was
analyzed using specific signatures. Differentially expressed common
immune checkpoints, including members of the tumor necrosis factor
receptor superfamily, programmed cell death protein 1 (PD-1),
cytotoxic T lymphocyte-associated protein 4 (CTLA4), programmed
cell death ligand 1 (PD-L1) and T-cell immune receptor with
immunoglobulin and immunoreceptor tyrosine-based inhibitory motif
domains, were visualized using boxplots. The tumor immune
dysfunction and exclusion (TIDE) database (tide.dfci.harvard.edu/)
was used to calculate TIDE scores, which predict the response to
immune checkpoint inhibitor therapies, for patients with LUAD in
TCGA dataset. For single-cell analysis, t-distributed stochastic
neighbor embedding was employed to visualize the expression of six
signature DRGs within the TME. Single-cell sequencing aids in the
identification of specific gene expression patterns across distinct
cell populations, thereby enhancing our understanding of the
functions of prognostic genes in different cell types.
Subsequently, the correlations of the six DRGs with various immune
cell interactions were analyzed, including B cells, T cells,
natural killer (NK) cells, monocytes, macrophages, dendritic cells
(DCs) and neutrophils, using the tidyverse R package. These immune
cells were further categorized into naive, memory, activated and
resting states. To investigate the impact of varying levels of BDNF
gene expression on the response of patients with lung cancer to
immune checkpoint inhibitor therapy, four cohorts of patients with
NSCLC treated with PD-1/PD-L1 inhibitor were analyzed, including
patients undergoing systemic therapy and neoadjuvant therapy:
GSE207422 (29), GSE111414
(30), GSE126044 (31) and GSE135222 (32).
Analysis of malignancy characteristics
across different risk groups
Stemness, epithelial-mesenchymal transition (EMT),
angiogenic activity and tumorigenic cytokines serve as crucial
indicators of malignant tumor properties. Scores for these
characteristics in every tumor sample were calculated using the
ssGSEA algorithm. Tumor stemness indices (TSIs) for patients
diagnosed with LUAD were obtained from prior research (33), which identified that TSIs correlate
with higher levels of tumor dedifferentiation and the presence of
tumor stem cells. Somatic mutation data were obtained from TCGA,
and gene mutation analysis was conducted employing the maftools R
package. The tumor mutation burden (TMB) was computed for every
patient and compared between the two risk groups. TMB score-based
survival analysis was also performed. The cBioPortal for Cancer
Genomics database (http://www.cbioportal.org/) was adopted to visualize
somatic mutations in the key DRG signature.
Potential drug prediction
The limma R package was used to detect
differentially expressed genes between the two risk groups, which
were subsequently used for small-molecule drug screening. The list
of differentially expressed genes was submitted to the Connectivity
Map database (CMap; http://clue.io/) to identify
potential compounds relevant to the six-gene signature. The CMap
database features gene expression profiles derived from nine cancer
cell lines treated with 2,429 compounds, each with detailed
annotations (34). Connectivity
scores were calculated by matching CMap data with the expression
levels of the six signature genes, in which these scores were
negatively correlated with the treatment effects of the compounds.
The pRRophetic (https://github.com/paulgeeleher/pRRophetic2) R package
was also used to predict the half-maximal inhibitory concentration
(IC50) values for standard chemotherapeutics in
different risk subgroups. Subsequently, the three-dimensional
structures of potential therapeutic compounds were retrieved from
the PubChem database (https://pubchem.ncbi.nlm.nih.gov/).
Sulforhodamine B assays
Given the limited research on the role of honokiol
in inducing PCD in lung adenocarcinoma and as honokiol was among
the top 10 drugs identified by CMap with the highest enrichment
scores, this compound was selected for further study. A549 cells
were treated with honokiol, and sulforhodamine B (SRB) assays along
with JC-1 staining were performed to validate the predictive
accuracy of the CMap drug analysis. Honokiol and Taxol were
obtained from Selleck Chemicals. For the SRB assay, A549 cells were
seeded at a density of 8,000 cells per well in 96-well plates and
incubated under standard conditions (37°C in 5% CO2) for
24 h. Honokiol (0, 20, 40, 60 or 80 µM) and Taxol (0, 20, 40, 60 or
80 nM) were added to the treatment groups. Following 24 and 48 h of
incubation, the SRB method was used to evaluate cell viability.
JC-1 staining assays
A549 cells were seeded into 6-well plates at a
density of 1×10⁶ cells per well and subjected to the
following treatments to form groups: Control (DMEM only), honokiol
(50 µM), Taxol (50 nM), and a combination of honokiol (50 µM) +
Taxol (50 nM). The cells were incubated at 37°C with 5%
CO2 for 24 h. Subsequently, staining was performed
following the instructions provided with the JC-1 assay kit
(IJ03009; Beijing Solarbio Science & Technology Co., Ltd.).
Fluorescence images were captured using a fluorescence microscope
(Axio Observer A1; Zeiss AG), and the fluorescence intensity ratio
was quantified using ImageJ v1.8.0 (National Institutes of
Health).
Validation of the protein expression
of the six prognosis-relevant genes
Immunohistochemistry data from the Human Protein
Atlas (HPA; http://www.proteinatlas.org/) were used to validate
the expression of the proteins corresponding to the prognostic
genes in LUAD samples compared with normal lung samples.
MR
Two-sample MR was employed to investigate the
relationship between the risk of LUAD and hub genes, with single
nucleotide polymorphisms (SNPs) defined as instrumental variables
(IVs). Hub gene data were sourced from the Genome Wide Association
Study database (https://gwas.mrcieu.ac.uk/). The core gene BDNF (id:
prot-a-2122), and LUAD (id: ebi-a-GCST004744, containing 11,273
LUAD samples, 55,483 normal samples and 7,849,324 SNPs) as the
representative disease, were selected for MR analysis. The analysis
was conducted using the TwoSampleMR package, with inverse variance
weighting (IVW) to evaluate the association between the hub gene
expression value and the risk of LUAD. The MR-Egger method was
applied for extra sensitivity analysis.
Cell culture and preparation of BDNF
knockdown Lewis lung carcinoma (LLC) cells
The lung cancer A549 (CCL-185™), LLC
(CRL-1642™) and H1975 (CRL-5908™) cell lines,
and the normal human bronchial epithelial BEAS-2B
(CRL-9609™) cell line were purchased from the American
Type Culture Collection. These cells were cultured in DMEM
(C11875500BT; Gibco; Thermo Fisher Scientific, Inc.) into which 1%
penicillin-streptomycin (15070063; Gibco; Thermo Fisher Scientific,
Inc.) and 10% fetal bovine serum (10099-141; Gibco; Thermo Fisher
Scientific, Inc.) were added. The cells were kept in an incubator
at 37°C with 5% CO2.
The small interfering RNA (siRNA) sequences and
expression plasmids were designed and synthesized by Guangzhou
RiboBio Co., Ltd. Specific siRNAs targeting BDNF (siBDNF-1 sense,
5′-TCCTTTTCCTTACTATGGTTATT-3′ and antisense,
5′-AAUAACCAUACUAAGGAAAAGGA-3′; and siBDNF-2 sense,
5′-TTCCTTACTATGGTTATTTCATA-3′ and antisense,
5′-UAUGAAAUAACCAUAGUAAGGAA-3′) and control siRNA (sense,
5′-TCCCAAATCGTCTGACCGATGATCCGTTCAAGAGACGGATCATCGGTCAGACGATTTT-3′
and antisense,
5′-AAAAUCGUCUGACCGAUGAUCCGUCUCUGAACGGAUCAUCGGUCAGACGAUUUGGGA-3′)
were purchased from Santa Cruz Biotechnology, Inc. Prior to
transfection, LLC cells were plated into 6-well culture plates and
allowed to grow until reaching 70–80% confluence within 24 ho.
According to the manufacturer's protocol, siRNA transfection was
performed using Lipofectamine® 3000 (Invitrogen; Thermo
Fisher Scientific, Inc.) and siRNAs (50 nM). The transfection
process was maintained in an incubator (37°C, 5% CO2)
for 8 h, after which the medium was replaced with fresh complete
medium for an additional 48 h of incubation. Subsequently, the
cells were harvested for further experiments.
Reverse transcription-quantitative
polymerase chain reaction (RT-qPCR)
Total RNA was isolated from the cell lines using
TRIzol® reagent (cat. no. 15596-026; Ambion; Thermo
Fisher Scientific, Inc.). Total RNA was isolated from A549, LLC and
BEAS-2B cells. The RNA purity and concentration were measured
according to the ratio of absorbance at 260 and 280 nm, using a
NanoDrop spectrophotometer (Thermo Fisher Scientific, Inc.). The
RNA was then reverse-transcribed into cDNA using the
PrimeScript® RT reagent (Takara Bio, Inc.) according to
the manufacturer's protocol. The thermocycling protocol was as
follows: Amplification step, 94°C for 5 min; followed by 35 cycles
of denaturation for 1 min at 94°C, 1 min of annealing at 55°C,
elongation at 72°C for 1 min and a final extension step at 72°C for
1 min. The cDNA then served as the template for qPCR, with β-actin
as the reference gene. Standard two-step qPCR amplification was
conducted using SYBR Green I (10222ES60; Shanghai Yeasen
Biotechnology Co., Ltd.) according to the manufacturer's protocol.
A total of 20 µl qPCR reaction system contained 6 µl nuclease-free
water, 10 µl SYBR Premix Ex Taq II (2X), 0.4 µl ROX Reference Dye
II, 2 µl cDNA, 0.8 µl forward primer (10 µM) and 0.8 µl reverse
primer (10 µM). The thermocycling conditions were as follows: 95°C
for 30 sec; followed by 40 cycles of denaturation at 95°C for 5
sec, annealing at 60°C for 34 sec, elongation at 95°C for 15 sec,
and extension at 60°C for 1 min. Gene expression levels were
calculated using the 2−ΔΔCq method (35). The primers used are listed in
Table SII.
Wound healing and colony formation
assay
For the colony formation assay, transfected cells in
the logarithmic growth phase were seeded at a density of 1,000
cells/well into a 6-well plate. After cultivation for 10 days (37°C
in 5% CO2), the cells were fixed with methanol for 20
min at room temperature, and then stained with 0.1% crystal violet
for 15 min at room temperature. Images of the colonies formed in
each well were captured and the number of colonies was manually
counted. In this study, clusters of cells containing >50 cells
were considered colonies. For the wound healing assay, transfected
cells were seeded at a density of 2×10⁵ cells/well in a
6-well plate. After incubation for 24 h, a scratch tool was used to
form a wound in the cell monolayer, and the medium was then
replaced with serum-free medium. Images of the wound were captured
at 0 h and 48 h using a light microscope. ImageJ v1.8.0 (National
Institutes of Health) was used to evaluate the cell migration rate
as follows: Wound closure surface area / wound total surface area
×100.
Western blotting
Total cellular proteins were extracted from
transfected cells using RIPA lysis buffer, and their concentrations
were measured with the Thermo BCA Protein Assay kit (Thermo Fisher
Scientific, Inc.). The proteins were subsequently denatured at 95°C
for 5 min in a water bath, separated on a 10% SDS-PAGE gel by
electrophoresis, and transferred onto a 0.45-µm PVDF membrane. The
membrane was then blocked with 5% skimmed milk at room temperature
for 1 h, followed by the addition of primary antibody (pRIPK1,
1:1,000, cat. no. HY-p81539, MedChemExpress; RIPK1, 1:1,000, cat.
no. 3493T, Cell Signaling Technology, Inc.; Cleaved CASP8, 1:1,000,
cat. no. 8592T, Cell Signaling Technology, Inc.; CASP8, 1:1,000,
cat. no. 4790T, Cell Signaling Technology, Inc.; Cleaved CASP1,
1:1,000, cat. no. HY-p80587, MedChemExpress; CASP1, 1:1,000, cat.
no. HY-p81232, Cell Signaling Technology, Inc.; β-actin, 1:2,000,
cat. no. 81115-1, Proteintech Group, Inc.) and incubation at 4°C
overnight. After washing with TBST, the membrane was incubated with
secondary antibody (anti-rabbit IgG, HRP-linked antibody, 1:3,000,
cat. no. 7074P2, Cell Signaling Technology, Inc.) for 1 h at room
temperature and washed again with TBST. Finally, a
chemiluminescence reagent (Shanghai Biyuntian Biotechnology Co.,
Ltd.) was applied, and the membranes were developed using an
automatic chemiluminescence imaging system (Odyssey; LI-COR
Biotechnology).
Statistical methods
All data were statistically analyzed using R
software (version 4.2.1; www.r-project.org) with a two-tailed P-value of
<0.05 considered to indicate a statistically significant
difference. Kaplan-Meier analysis and log-rank test were conducted
to compare the OS of the groups. Independent predictors were
examined using Cox regression analysis. Hazard ratios (HRs) and 95%
confidence intervals (CIs) were used to describe relative risk.
Correlation analyses were performed using Spearman's method.
Categorical variables of clinical factors (sex, stage, age and TNM
status) were analyzed using the χ2 test or Fisher's
exact test. Student's t-test was used to compare two groups of
normally distributed data, while ANOVA with Tukey's post hoc test
was employed for multiple-group comparisons. Wilcoxon's test was
employed for comparing ordinal and non-normally distributed data
between subgroups. Data from cellular experiments were processed
using GraphPad Prism 7.0 software (Dotmatics). The data are
expressed as the mean ± SD from a minimum of three replicates.
Results
Detection of differentially expressed
PRGs in LUAD
Differential expression of the 1,670 PRGs identified
from TCGA was analyzed between LUAD samples (n=412) and adjacent
normal tissues (n=43). The volcano plot (Fig. 1A) and heatmap (Fig. 1B) demonstrated that 310 PRGs were
significantly differentially expressed between the LUAD and normal
tissues.
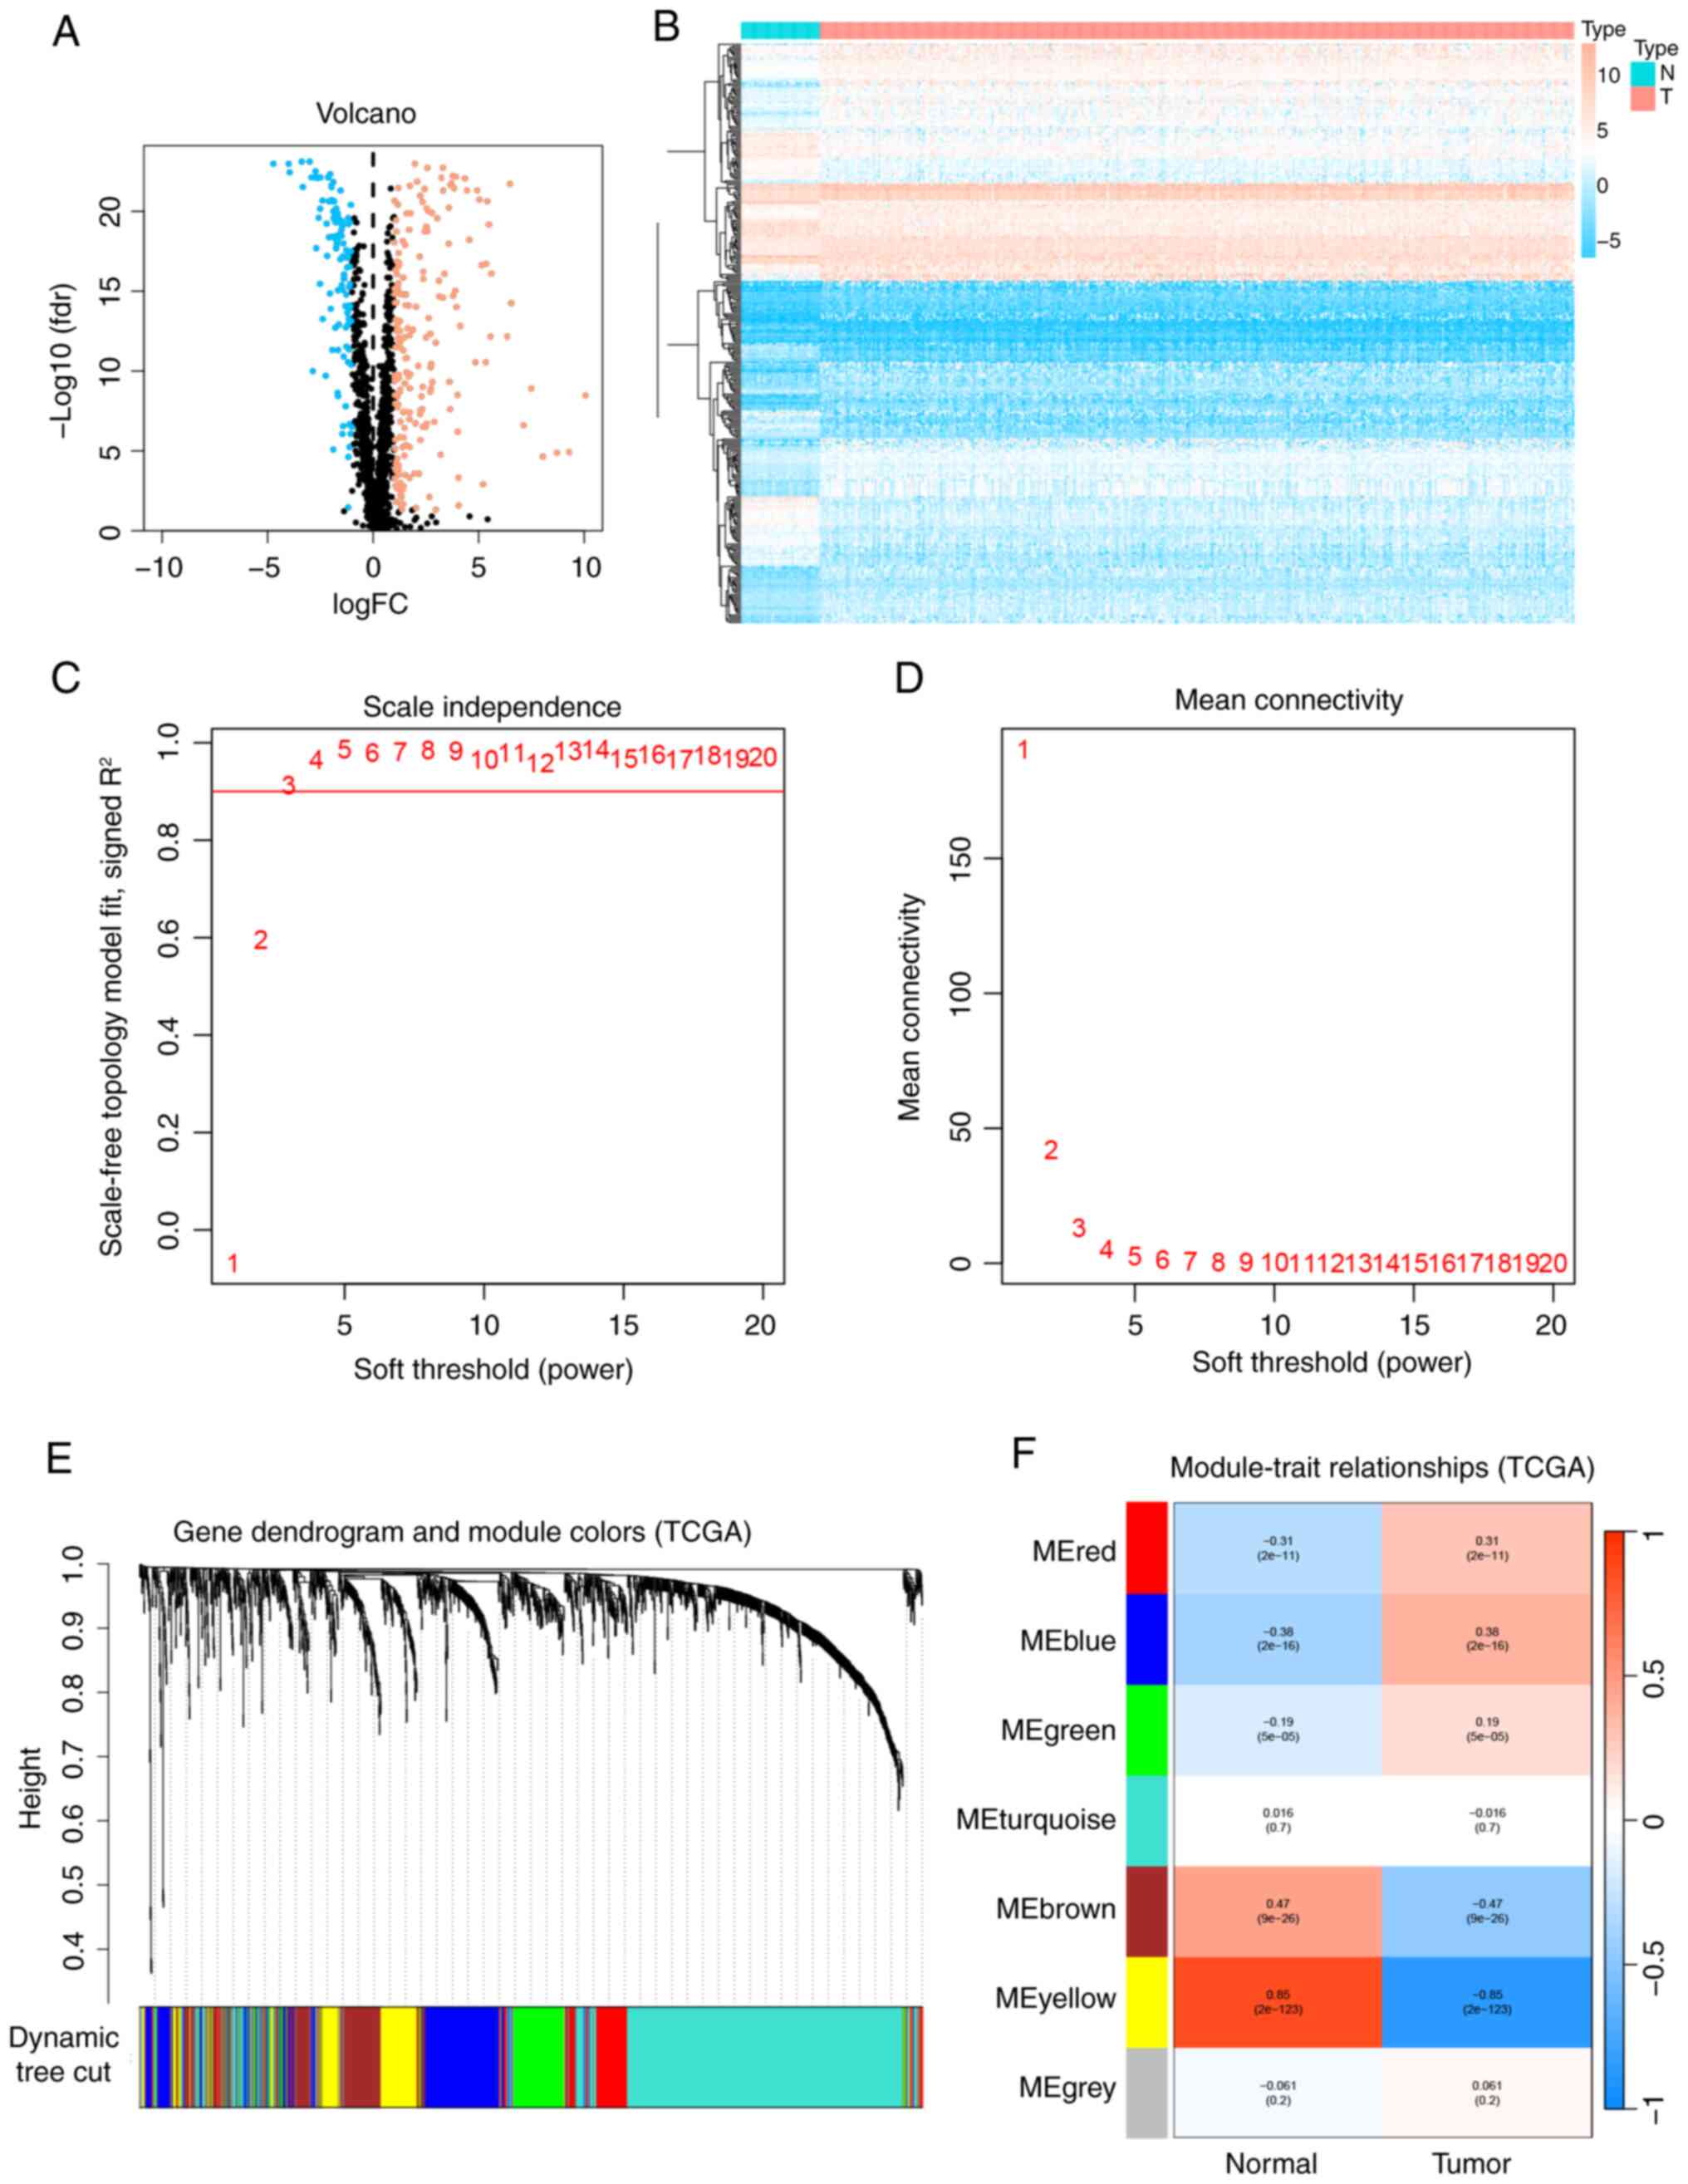 | Figure 1.WGCNA and differential gene
expression analysis between LUAD and normal samples. (A) Volcano
plot illustrating the differential expression analysis of TCGA
data. (B) Heatmap depicting the differential expression analysis of
TCGA data. Blue indicates downregulated genes, red indicates
upregulated genes and black denotes genes without significantly
differential expression. (C) Scale independence analysis and (D)
mean connectivity analysis conducted using WGCNA. (E) Dendrogram
showing the clustering of all genes in TCGA data, based on a
topological overlap matrix (1-TOM). Each branch in the dendrogram
corresponds to a gene, and different colors represent distinct
co-expression modules. (F) Module-trait heatmap displaying the
correlation between gene modules and LUAD within TCGA data, with
correlation coefficients (above) and P-values (below) indicated for
each module. LUAD, lung adenocarcinoma; TCGA, The Cancer Genome
Atlas; WGCNA, weighted gene co-expression network analysis; fdr,
false discovery rate; FC, fold change; N, normal samples; T, tumor
samples; ME, module eigengene. |
Construction of WGCNA network and
identification of PCD-related module in LUAD
To determine the association between potential gene
modules and LUAD, a WGCNA was performed on all candidate genes from
the LUAD dataset from TCGA. The WGCNA R package was used to develop
a system with the optimum efficacy value (β=3, R2=0.9;
Fig. 1C and D). The 1,670 PRGs were
grouped into seven modules based on their co-expression patterns,
including the gray module. The clustering analysis results for all
samples are shown in Fig. 1E, and
the co-expression modules are visually represented in Fig. 1F using different colors. The results
of the module correlation analysis indicate that the yellow module
is the most strongly correlated with LUAD (r=−0.85;
P<0.0001).
GO/KEGG enrichment analyses and PPI
network analysis for core genes
To determine the core differentially expressed PRGs
in LUAD, the 310 differentially expressed genes from TCGA and the
yellow module (150 genes) from the WGCNA analysis were imported
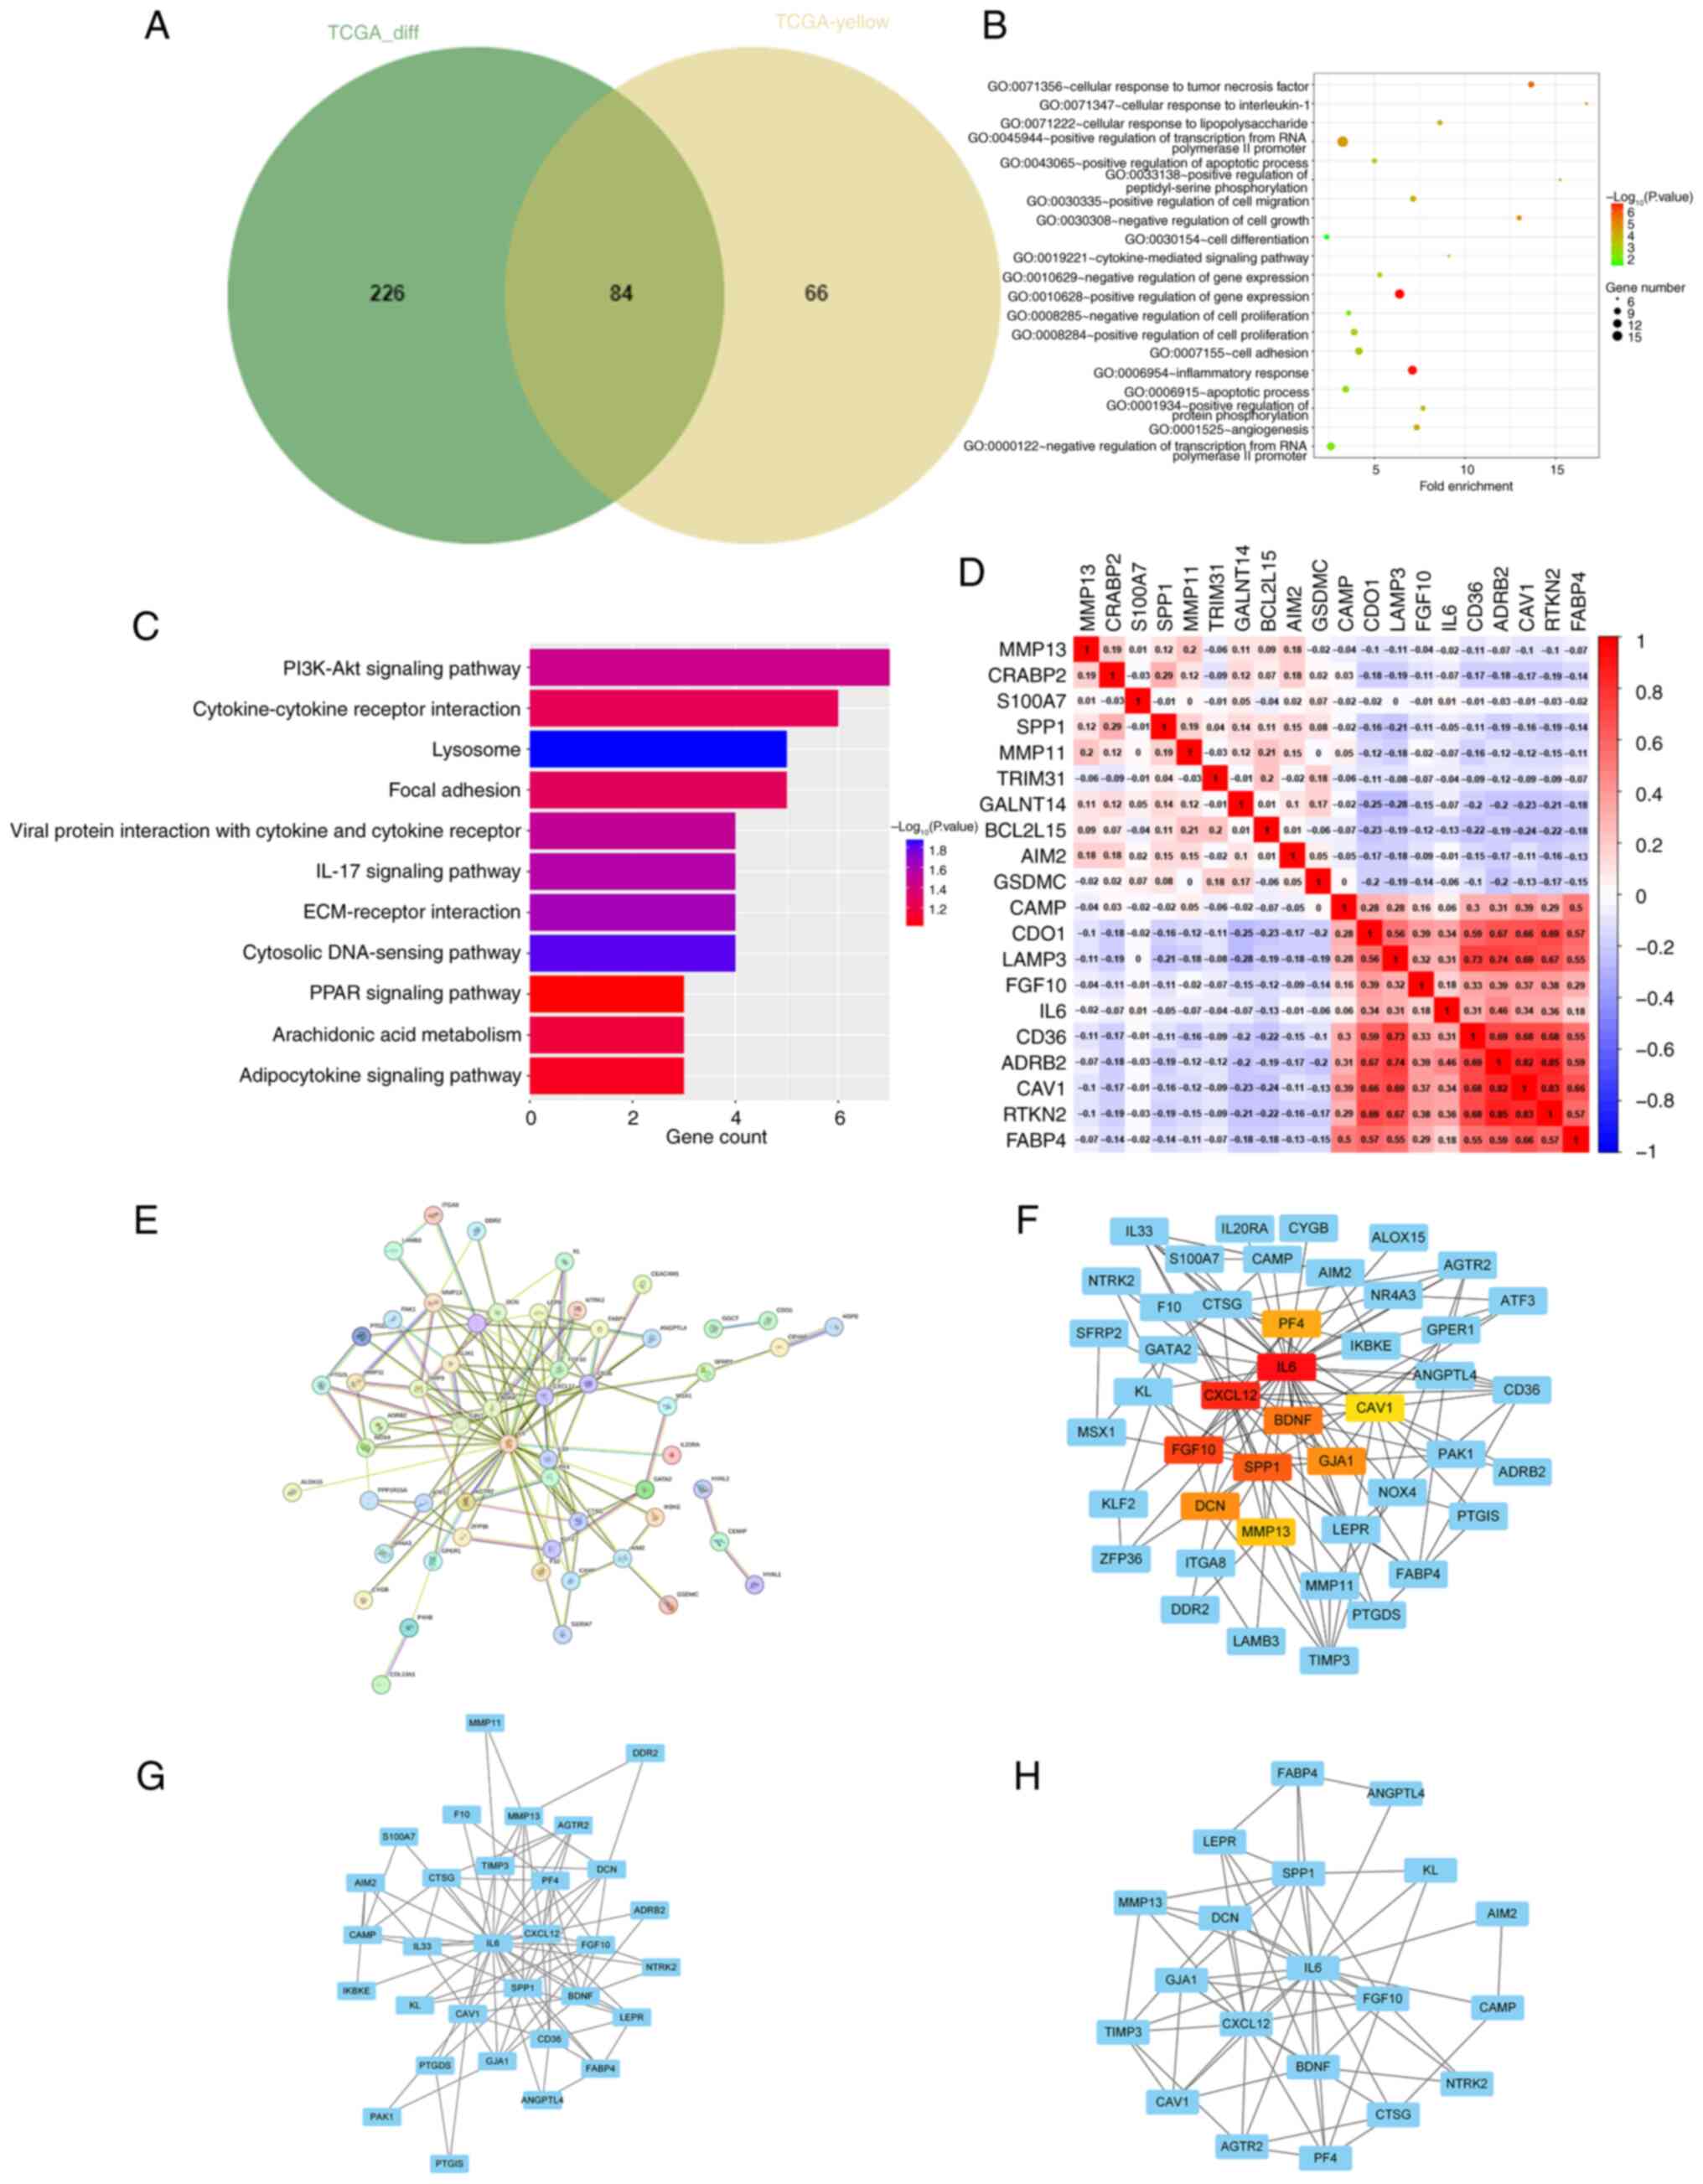
into a Venn diagram. There were 84 overlapping genes that were
identified as core genes for subsequent analysis (Fig. 2A). Subsequently, the differentially
expressed genes were subjected to GO and KEGG pathway enrichment
analyses. The GO analyses revealed that the genes were
predominantly enriched in ‘cellular response to interleukin-1’,
‘cellular response to tumor necrosis factor’, ‘inflammatory
response’, ‘apoptotic process’ and ‘positive regulation of
apoptotic process’ (Fig. 2B). The
KEGG analyses revealed that the genes were predominantly enriched
in ‘PI3K-Akt signaling pathway’, ‘IL-17 signaling pathway’,
‘ECM-receptor interaction’, ‘Cytokine-cytokine receptor
interaction’ and ‘PPAR signaling pathway’ (Fig. 2C). Correlations between the
downregulated and upregulated genes are illustrated in Fig. 2D. A PPI network was then constructed
utilizing Cytoscape software in conjunction with the STRING
database (Fig. 2E). From this
network, the top 10 hub genes were identified through degree
analysis. These were PF4, IL6, CXCL12, BDNF, CAV1, FGF10, SPP1,
GJA1, DCN and MMP13, as shown in Fig.
2F (colored nodes). Additionally, two modules were identified
using the MCODE plugin (Fig. 2G and
H).
Six-gene risk signature independently
predicts outcome in patients with LUAD
Considering the association between PCD regulators
and OS in patients with LUAD, univariate Cox regression analysis
was conducted on the expression levels of 84 PRGs to assess their
clinical relevance, and the top 20 PRGs with hazard ratios are
displayed in a forest chart. The analysis revealed that adrenergic
receptor b2 (ADRB2), microtubule associated protein 6 (MAP6) and
recombinant integrin α8 functioned as protective factors, while
BDNF, G protein-coupled estrogen receptor 1 (GPER1),
angiopoietin-like protein 4 (ANGPTL4) and laminin b3 (LAMB3) were
identified as risk factors (Fig.
3A). Additionally, correlation analyses showed that most of
these protective and risk factor genes were interrelated (Fig. 3B).
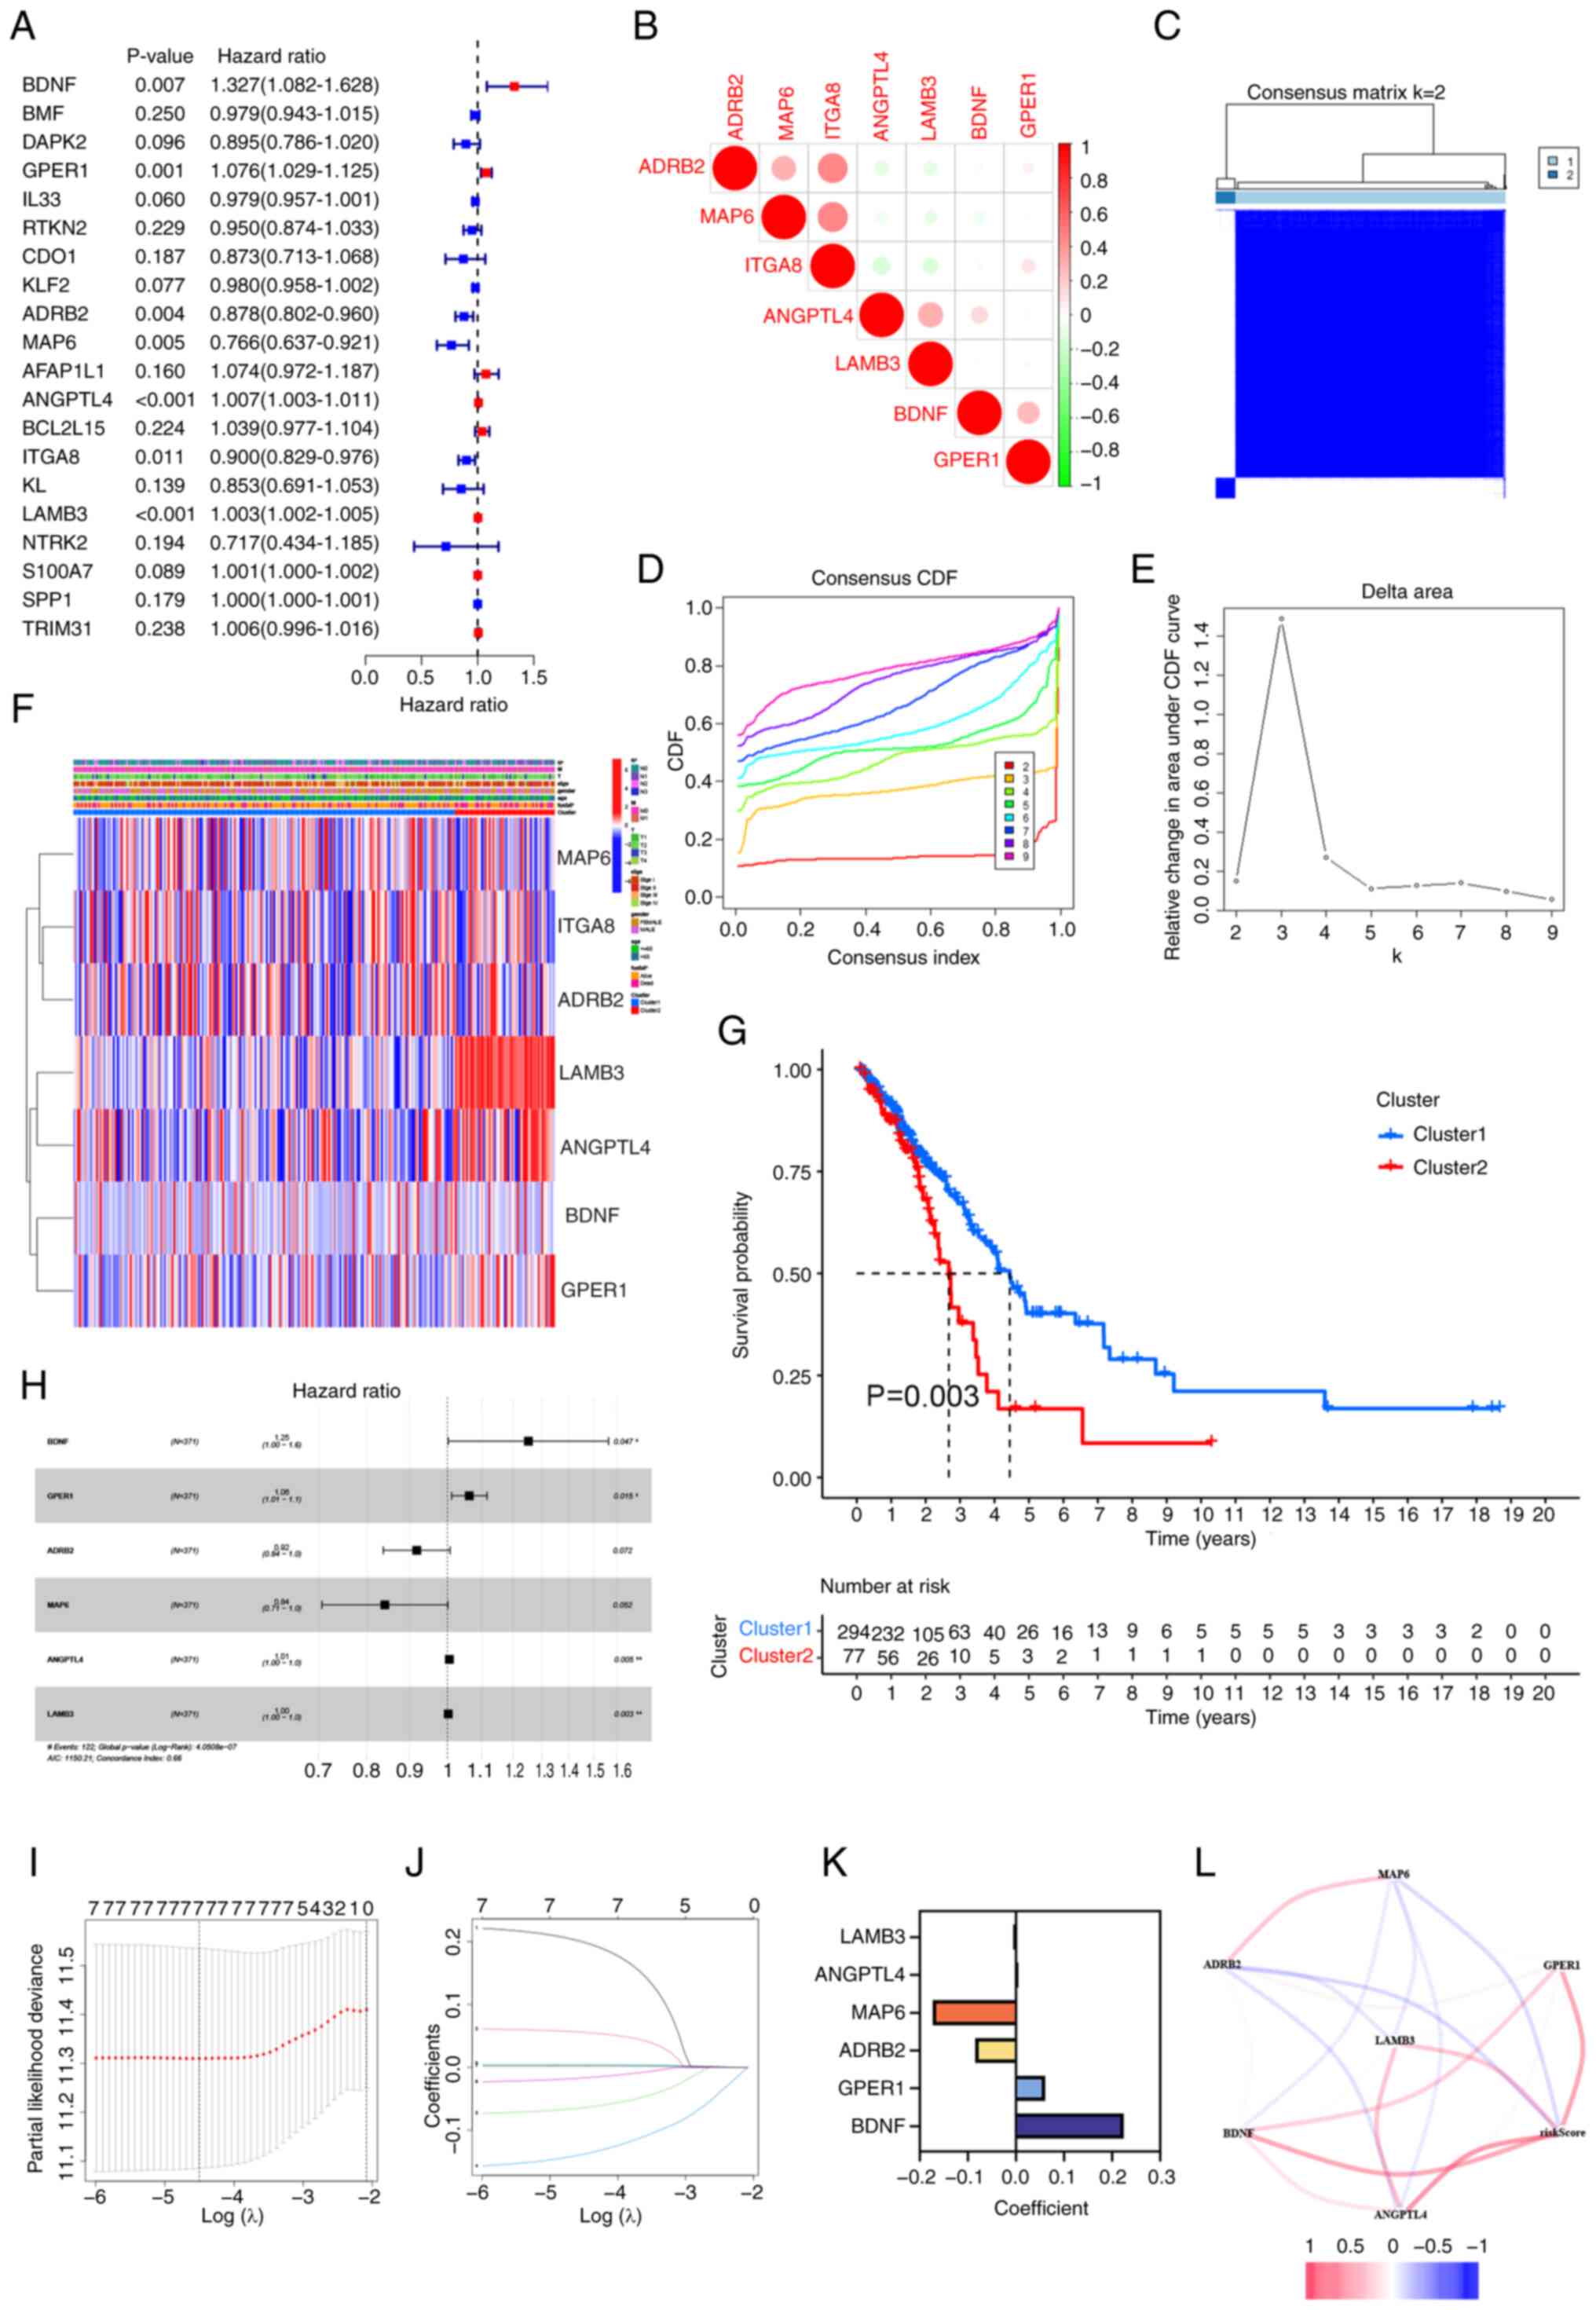 | Figure 3.Two clusters of PRGs can predict OS
in lung adenocarcinoma and establishment of a prognostic risk
model. (A) Forest plot illustrating the results of univariate Cox
regression analysis for 20 PRGs. (B) Correlation matrix of
signature PRGs. (C) Cluster analysis showing the correlation
between subgroups with k=2 clusters. (D) CDF plot for cluster
numbers k=2-9. (E) Relative change in the area under the CDF curve
for k=2-9. (F) Heatmap displaying the clinicopathological features
and gene expression levels of the two clusters, with blue
indicating low expression and red indicating high expression. (G)
Comparison of OS between the two clusters. (H) Univariate Cox
regression analysis of the six key PRGs: BDNF, GPER1, ADRB2, MAP6,
ANGPTL4 and LAMB3. (I) The cross-validation curve of the seven
prognosis-related PRGs. The X-axis represents the logarithm of the
penalty coefficient, log(λ), while the Y-axis denotes the
likelihood deviance. The left dashed line indicates λ min,
representing the λ value at which the model achieves the best fit.
(J) The LASSO coefficient path plot of the seven prognosis-related
PRGs. Each curve represents the trajectory of changes in the
coefficient of each variable. The vertical axis indicates the
coefficient values, the lower horizontal axis corresponds to
log(λ), and the upper horizontal axis shows the number of non-zero
coefficients in the model at that point. (K) Correlation
coefficients of the six PRGs incorporated into the prognostic
signature. (L) Correlations among the prognostic genes. PRGs,
programmed cell death-related genes; OS, overall survival; CDF,
cumulative distribution function; BDNF, brain-derived neurotrophic
factor; GPER1, G protein-coupled estrogen receptor 1; ADRB2,
adrenergic receptor b2; MAP6, microtubule associated protein 6;
ANGPTL4, angiopoietin-like protein 4; LAMB3, laminin b3. |
To examine the clinical relevance of the PRGs
further, patients with LUAD were grouped into subcategories
according to their gene expression profiles. Optimal clustering was
achieved with k=2, resulting in the separation of the patients into
two distinct and non-overlapping groups (Figs. 3C-E). Significant variations in OS,
age, stage and sex between these clusters were then assessed. The
results indicated that patients in cluster 1 had an improved
prognosis (P=0.003) compared with that of patients in cluster 2
(Fig. 3G). Additionally, cluster 1
exhibited lower N stages compared with cluster 2 (Fig. 3F). In summary, consensus clustering
revealed a notable association between PRG expression patterns and
different clinical parameters.
LASSO Cox regression analysis indicated that
BNDF, GPER1, ANGPTL4 and LAMB3 have the highest
predictive capabilities (Fig. 3H),
as these were risk genes with HR ≥1. By contrast, ADRB2 and
MAP6 were protective genes with HR <1. In addition, the
LASSO Cox regression analysis identified six genes with the highest
predictive power (Fig. 3I and J).
By utilizing the coefficients derived from the LASSO algorithm, six
optimal genes, namely BDNF, GPER1, ANGPTL4, LAMB3, ADRB2 and
MAP6, were used to construct the risk model (Fig. 3K). Accordingly, the risk score
derived from these coefficients may be calculated as follows: Risk
score = (0.224877 × expression level of BDNF) + (0.060886 ×
expression level of GPER1)-(−0.08495 × expression level of
ADRB2)-(−0.17324 × expression level of
MAP6)-(0.005609 × expression level of
ANGPTL4)-0.002494 × expression level of LAMB3). The
associations between the risk score and the six genes are
illustrated in Fig. 3L.
To assess the survival prediction value of these
gene signature models, patients with LUAD were categorized into
low- and high-risk groups according to the median risk score. A
heatmap of clinically relevant characteristics was created to
illustrate the differential expression of the six prognostic PRGs
between the high- and low-risk groups (Fig. 4A). Significant variations in the
clinical data were observed for sex (P<0.001), follow-up status
(P<0.001), stage (P<0.05), lymph node metastasis (P<0.001)
and tumor extent (P<0.01). Cox univariate analysis revealed that
risk scores, tumor stage, tumor extent and lymph node metastasis
were significantly associated with OS in patients with LUAD
(P<0.001; Fig. 4B). Multivariate
Cox regression analysis was then conducted to evaluate whether the
risk score independently predicts OS in patients with LUAD,
independent of other clinicopathological characteristics. The
results demonstrated that the risk score (P<0.001), stage
(P=0.008), and M stage (P=0.043) were independently associated with
OS (P<0.001; Fig. 4C). In
summary, the six-gene risk signature predicts the prognosis of
patients with LUAD independently of other clinicopathological
factors, including grade, histological age, sex and TNM stage.
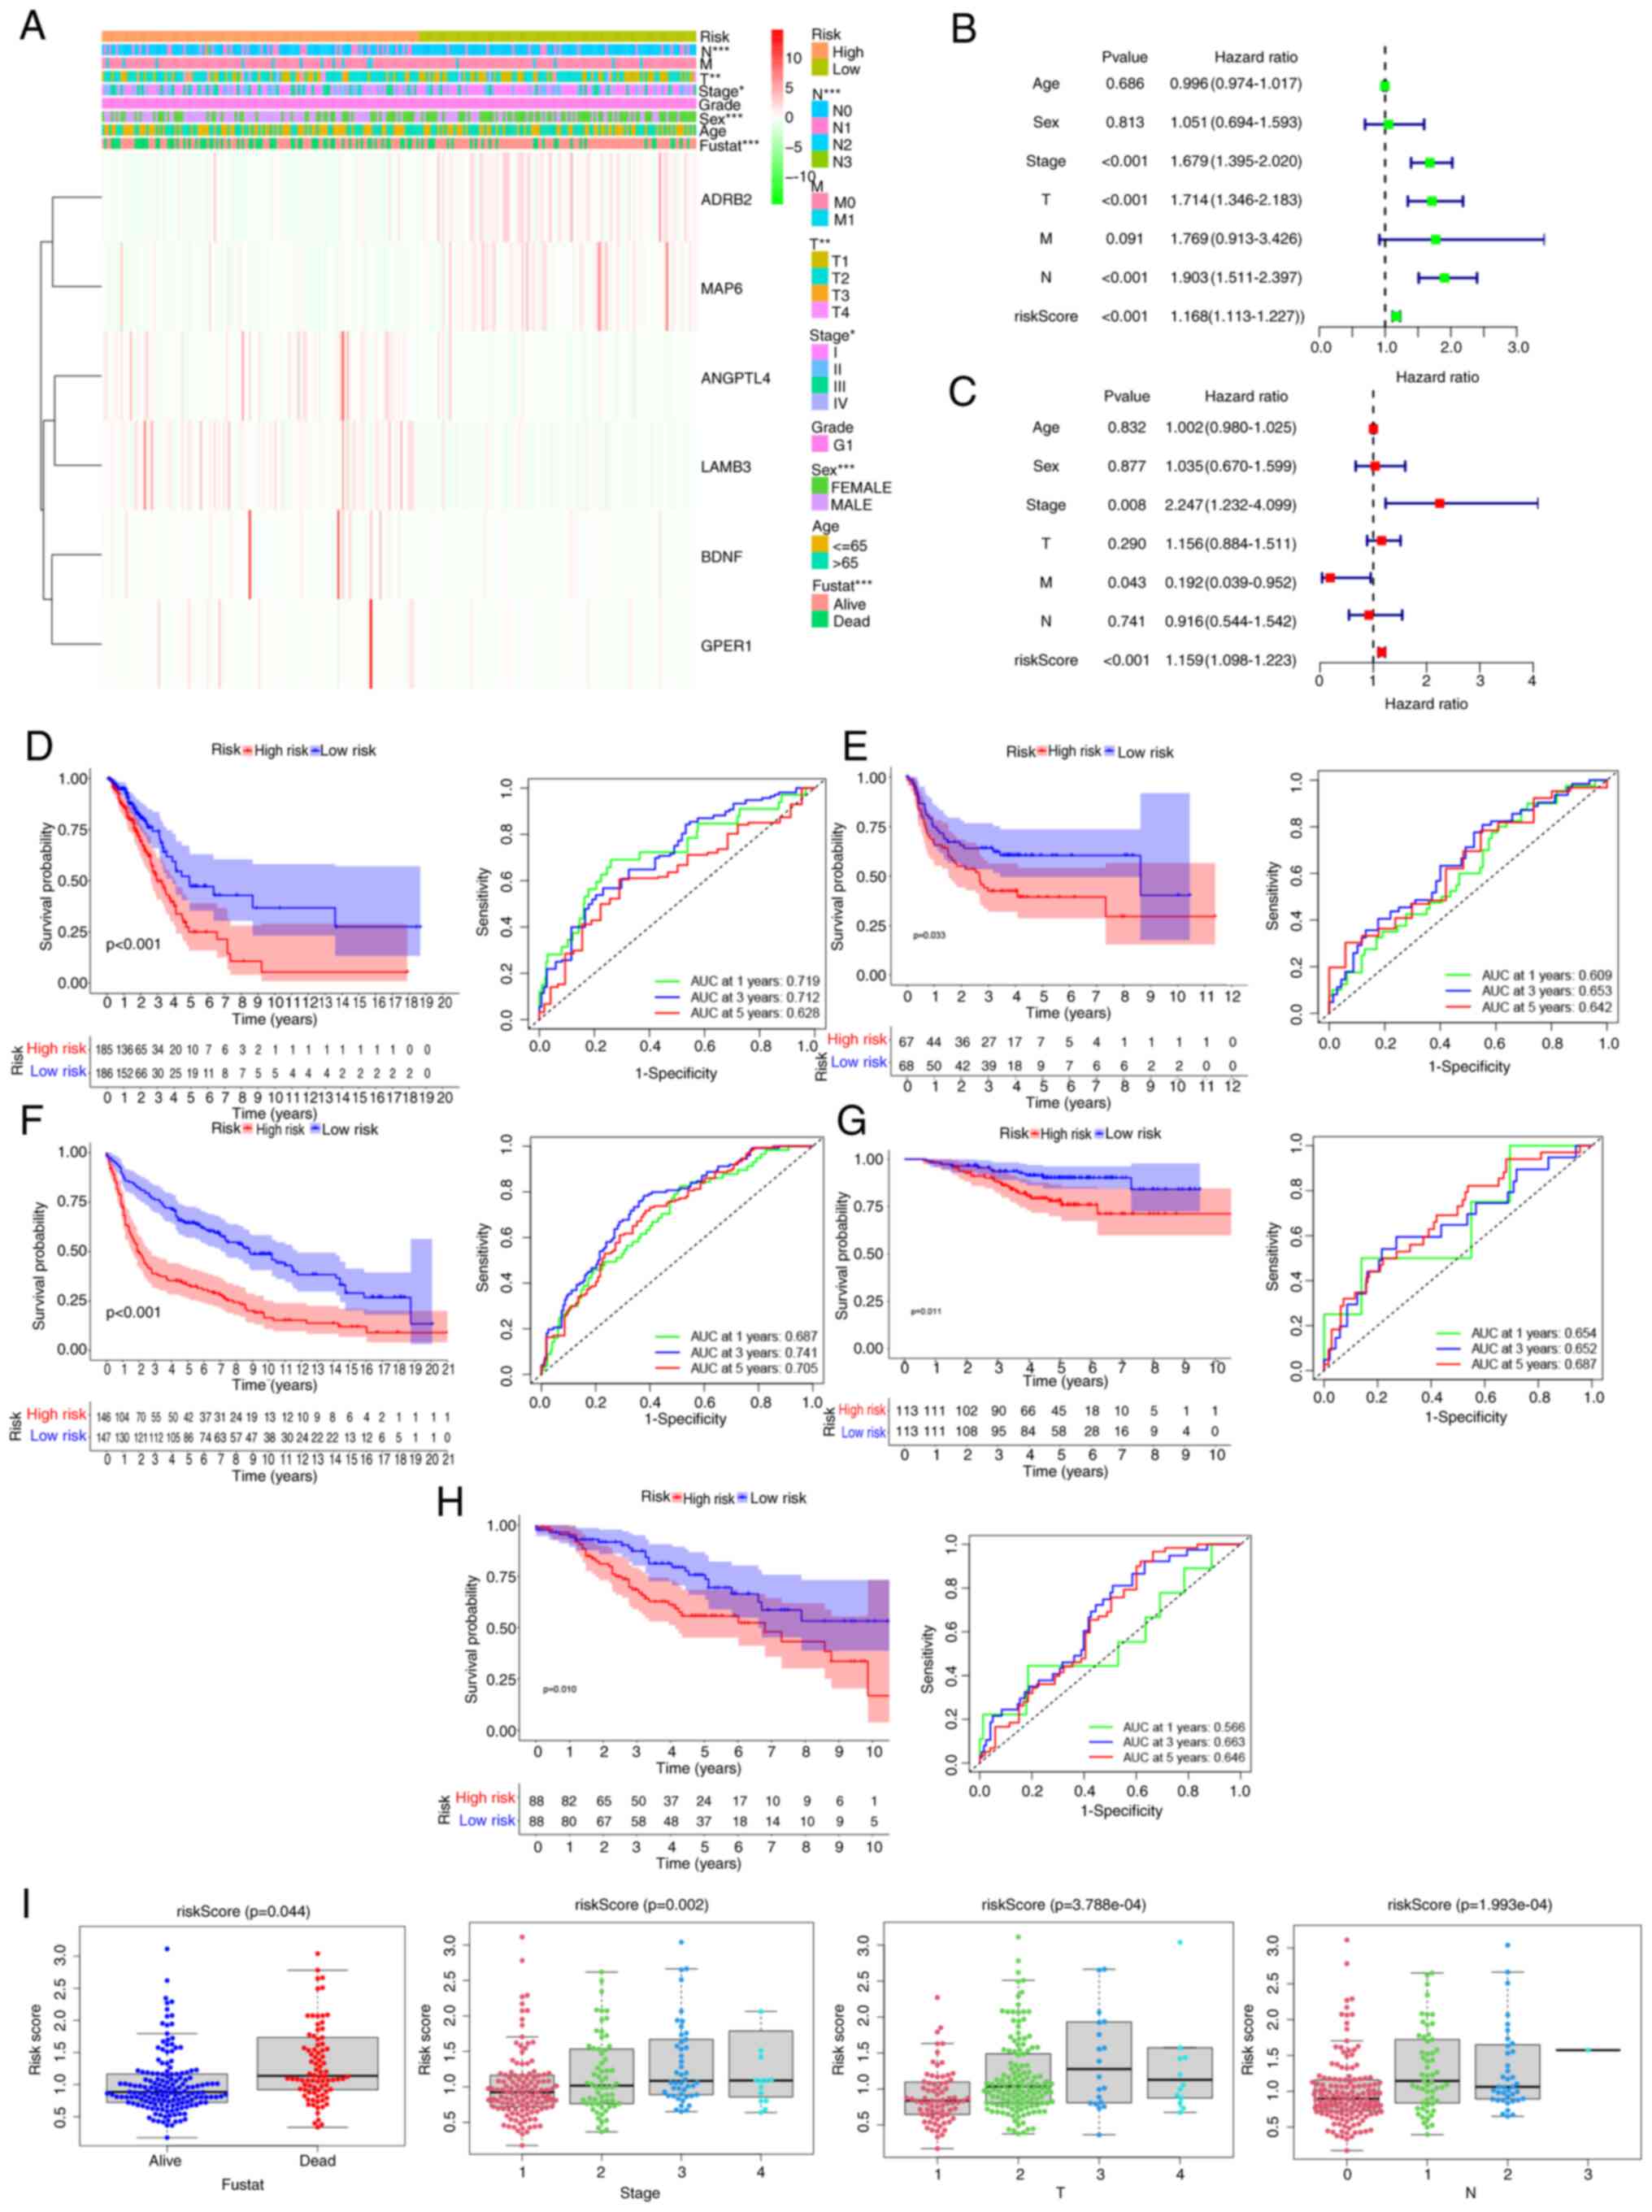 | Figure 4.Performance validation of the
prognostic model. (A) Heatmap illustrating the expression levels of
the six programmed cell death-related genes and distribution of
clinicopathological features in two risk populations. (B)
Univariate and (C) multivariate Cox regression analysis of
clinicopathological factors and overall survival. (D) Analysis of
survival curves (left panel) and ROC curves (right panel) for The
Cancer Genome Atlas cohort. Survival curves (left panel) and ROC
curves (right panel) for the (E) GSE8894, (F) GSE31201, (G)
GSE30219 and (H) GSE42127 datasets. (I) Variations in risk scores
among subgroups with differing clinicopathological factors. ROC,
receiver operating characteristic; fustat, follow-up stage; AUC,
area under the curve; BDNF, brain-derived neurotrophic factor;
GPER1, G protein-coupled estrogen receptor 1; ADRB2, adrenergic
receptor b2; MAP6, microtubule associated protein 6; ANGPTL4,
angiopoietin-like protein 4; LAMB3, laminin b3. |
Survival analysis and ROC curve
evaluation using the prognostic model
Survival analyses were conducted using data from 371
patients with LUAD from TCGA, and the results showed that the OS of
high-risk patients was significantly poorer compared with that of
patients in the low-risk group (P<0.001; Fig. 4D). The 5-year OS rates were 48.3%
for the low-risk group and 24.5% for the high-risk group. ROC curve
analysis demonstrated that the area under the curve (AUC) for 1-,
3- and 5-year OS was 0.719, 0.712 and 0.628, respectively,
indicating a strong predictive power for clinical outcomes. In
additional, the distribution of risk scores among the patients with
LUAD was determined, and survival status illustrated utilizing a
dot matrix (Fig. S1).
The predictive capacity of the risk model was
assessed in four GEO datasets for validation. Patients in the
cohorts were classified into low- and high-risk groups based on the
cutoff value of TCGA cohort. Survival analysis outcomes indicated
that the low-risk group experienced significantly improved OS
(GSE8894, P=0.033; GSE31201, P<0.001; GSE30219, P=0.011; and
GSE42127, P=0.01) compared with that of the high-risk group
(Figs. 4E-H). This finding is
consistent with the results observed in TCGA cohort. The AUC for
1-year OS ranged from 0.566 to 0.719, for 3-year OS from 0.652 to
0.741 and for 5-year OS from 0.642 to 0.705. These findings
validate the predictive accuracy of the risk model (Figs. 4E-H). Analysis of risk scores among
various clinicopathological factors revealed that patients who died
had a higher risk score than those who survived (P=0.044), and
patients with more advanced disease, those with T2-4 tumors
(P=0.0003), N1-3 status (P=0.0001) and stage II–IV (P=0.002), had
higher risk scores. Consequently, higher risk scores were found to
be associated with more advanced tumor stages (Fig. 4I).
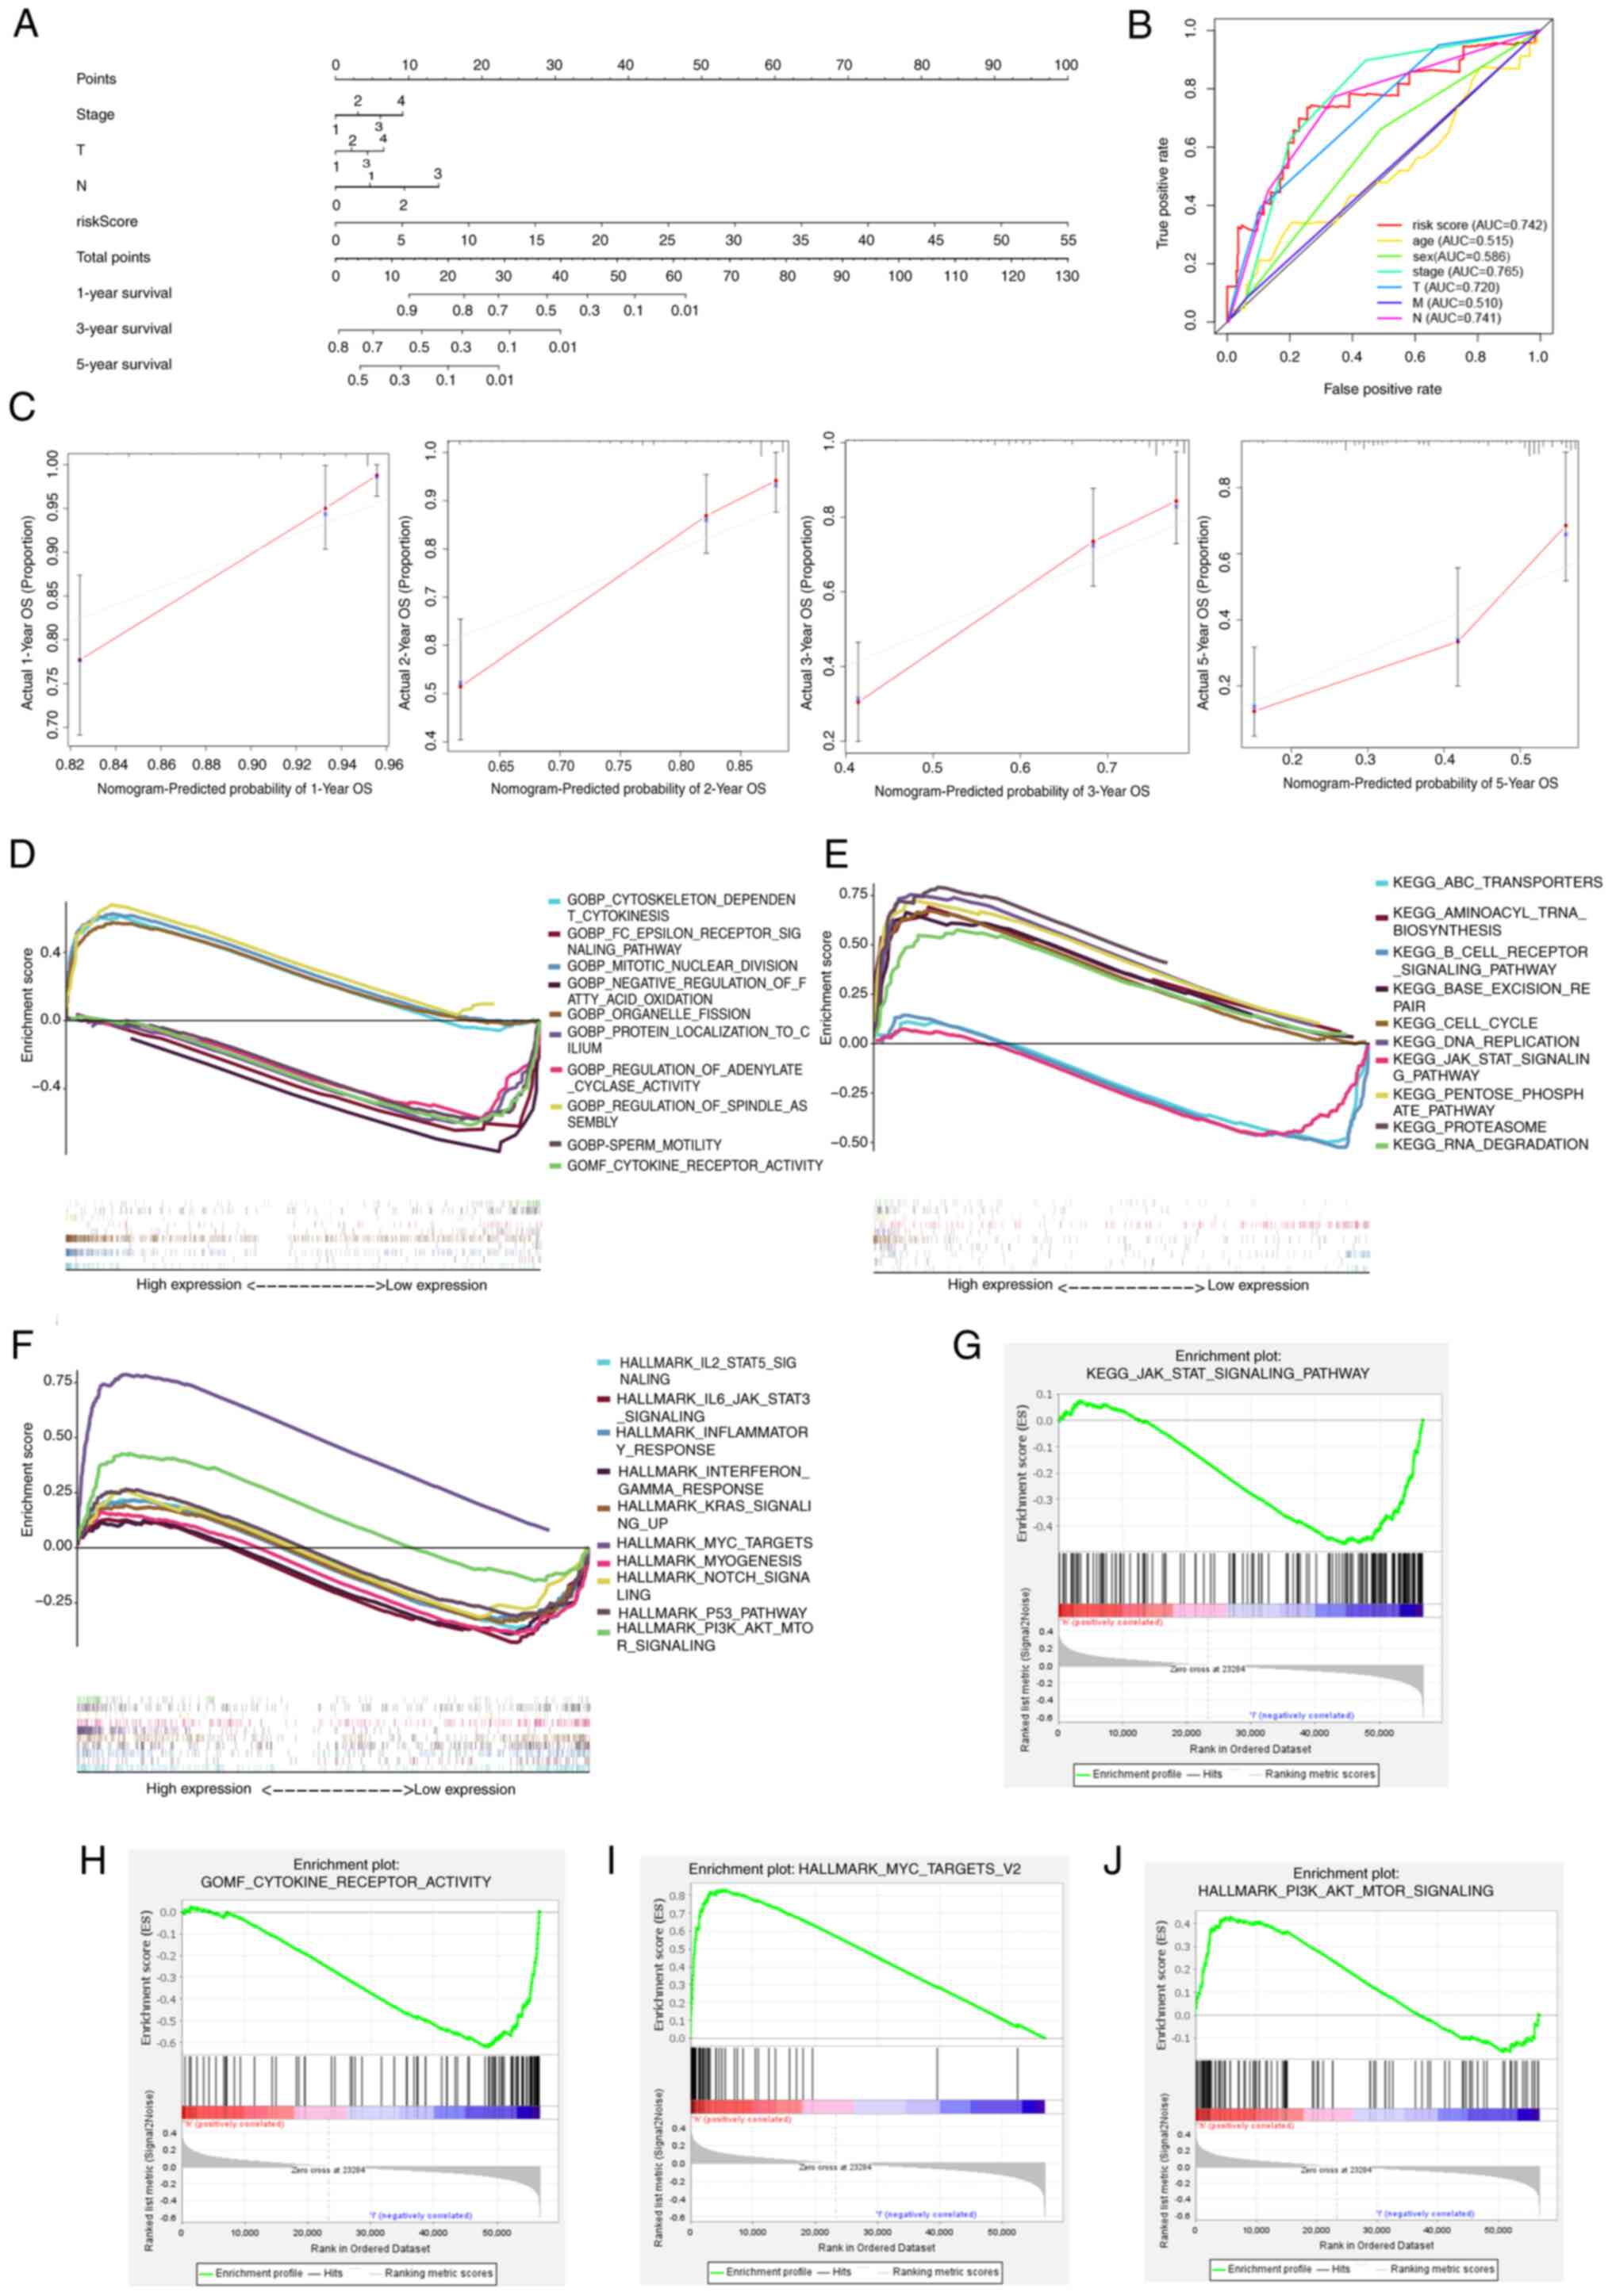
Construction of a nomogram
To support the clinical implementation of the model,
a comprehensive prognostic nomogram was developed incorporating the
LUAD stage and risk score (Fig.
5A). This nomogram effectively predicted the 1-, 3- and 5-year
OS of patients with LUAD. The AUC for the risk score was 0.742,
indicating a strong association between the predictive
effectiveness of the model and the tumor stage (Fig. 5B). These results confirm the good
predictive value of the model for patients with LUAD. Calibration
plots indicated a strong agreement between the actual and predicted
survival rates at 1-, 2-, 3- and 5- years (Fig. 5C).
Biological functional enrichment
analysis of prognostic signature of PRGs
Enrichment analyses were performed using GO
(Fig. 5D), KEGG (Fig. 5E) and HALLMARK (Fig. 5F) databases to identify PRGs with
differential expression between the high- and low-risk groups and
to explore subgroup survival benefits associated with biological
processes and signal pathways. The analyses revealed that high-risk
groups were associated with weaker immune response and
inflammation-related functions, including ‘JAK-STAT signaling
pathway’, ‘IL6-JAK-STAT signaling’, ‘cytokine receptor activity’,
‘inflammatory response’, ‘cytokine receptor activity’ and
‘interferon gamma response’. Conversely, cancer-promoting functions
such as ‘DNA replication’, ‘MYC targets’ and ‘PI3K-AKT-MTOR
signaling’ were upregulated in the high-risk group, indicating
their association with worse prognosis. Selected results of the
enrichment are depicted in Figs.
5G-J.
Correlation of immune infiltration and
malignant features with prognosis-related PRGs
Functional enrichment analyses indicated that the
primary roles of the PRGs encompass inflammation, immune response
and PCD. Therefore, an immune infiltration analysis was performed
to confirm these results. Using the CIBERSORT, MCPcounter, TIMER,
QUANTISEQ, XCELL and EPIC algorithms, the levels of DCs
(P<0.01), CD8+ T cells (CIBERSORT, P=0.006; and
XCELL, P=0.003), T-helper 1 (Th1) cells (XCELL, P=0.017), NK
(XCELL, P<0.001) and B cell plasma (XCELL, P=0.016) were
observed to be lower in the high-risk group compared with those in
the low-risk group, However, M2 macrophages (CIBERSORT, XCELL and
QUANTISEQ, P<0.05) and cancer-associated fibroblast (CAF)
(MCPCOUNTER and EPIC, P<0.05) levels were revealed to be higher
in the high-risk group than in the low-risk group (Fig. 6A and B). The difference in
expression of these factors suggests that immune infiltration may
influence patient prognosis. Moreover, the quantification of
enrichment fractions suggests that reduced immune function may
impact the prognosis of patients in the high-risk groups, due to an
association with cytolytic activity (P<0.05), C-C chemokine
receptor (P<0.05), human leukocyte antigen (P<0.001),
check-point (P<0.01), T cell co-stimulation and interferon
response (P<0.05) (Fig. 6C). The
ESTIMATE algorithm indicated higher tumor purity (P<0.001), as
well as lower immune (P<0.001), ESTIMATE (P<0.001) and
stromal (P<0.001) scores, in the high-risk group compared with
the low-risk group (Fig. 6D). By
contrast, the expression of MHC molecules was significantly higher
in the low-risk group (Fig. 6E).
Additionally, a distinct association was observed between the
low-risk group and elevated expression of multiple immune
checkpoints, such as TIGIT (P<0.01), CD276 (P<0.001), CTLA4
(P<0.01) and CD244 (P<0.001) (Fig. 6F), suggesting that these patients
could be advantageously treated with immune checkpoint inhibitors.
Notably, the low-risk group also exhibited higher tumor TIDE
(P<0.001) and M2 tumor-associated macrophage scores (P=0.004),
and lower levels of CAFs (P=0.004) and myeloid-derived suppressor
cells (P<0.001) (Fig. 6G).
Furthermore, lower TSIs, including differentially methylated
probes-based stemness index (P=0.016), epiregulin-mDNA stemness
index (P<0.001), enhancer-based stemness index (P=0.004) and
mRNA stemness index (P<0.001), were observed in the low-risk
group (Fig. 6H). The high-risk
group had a lower stemness score (P=0.014) but a higher angiogenic
activity score (P<0.001) (Fig.
6I). No significant differences in tumorigenic cytokines or EMT
scores were identified between the high- and low-risk groups.
Moreover, assessment of the correlation of the risk score with
malignant features (Fig. 6J)
indicated that the risk score had an association with angiogenic
activity score (R=0.35, P<0.001) and stemness score (R=−0.15,
P=0.004).
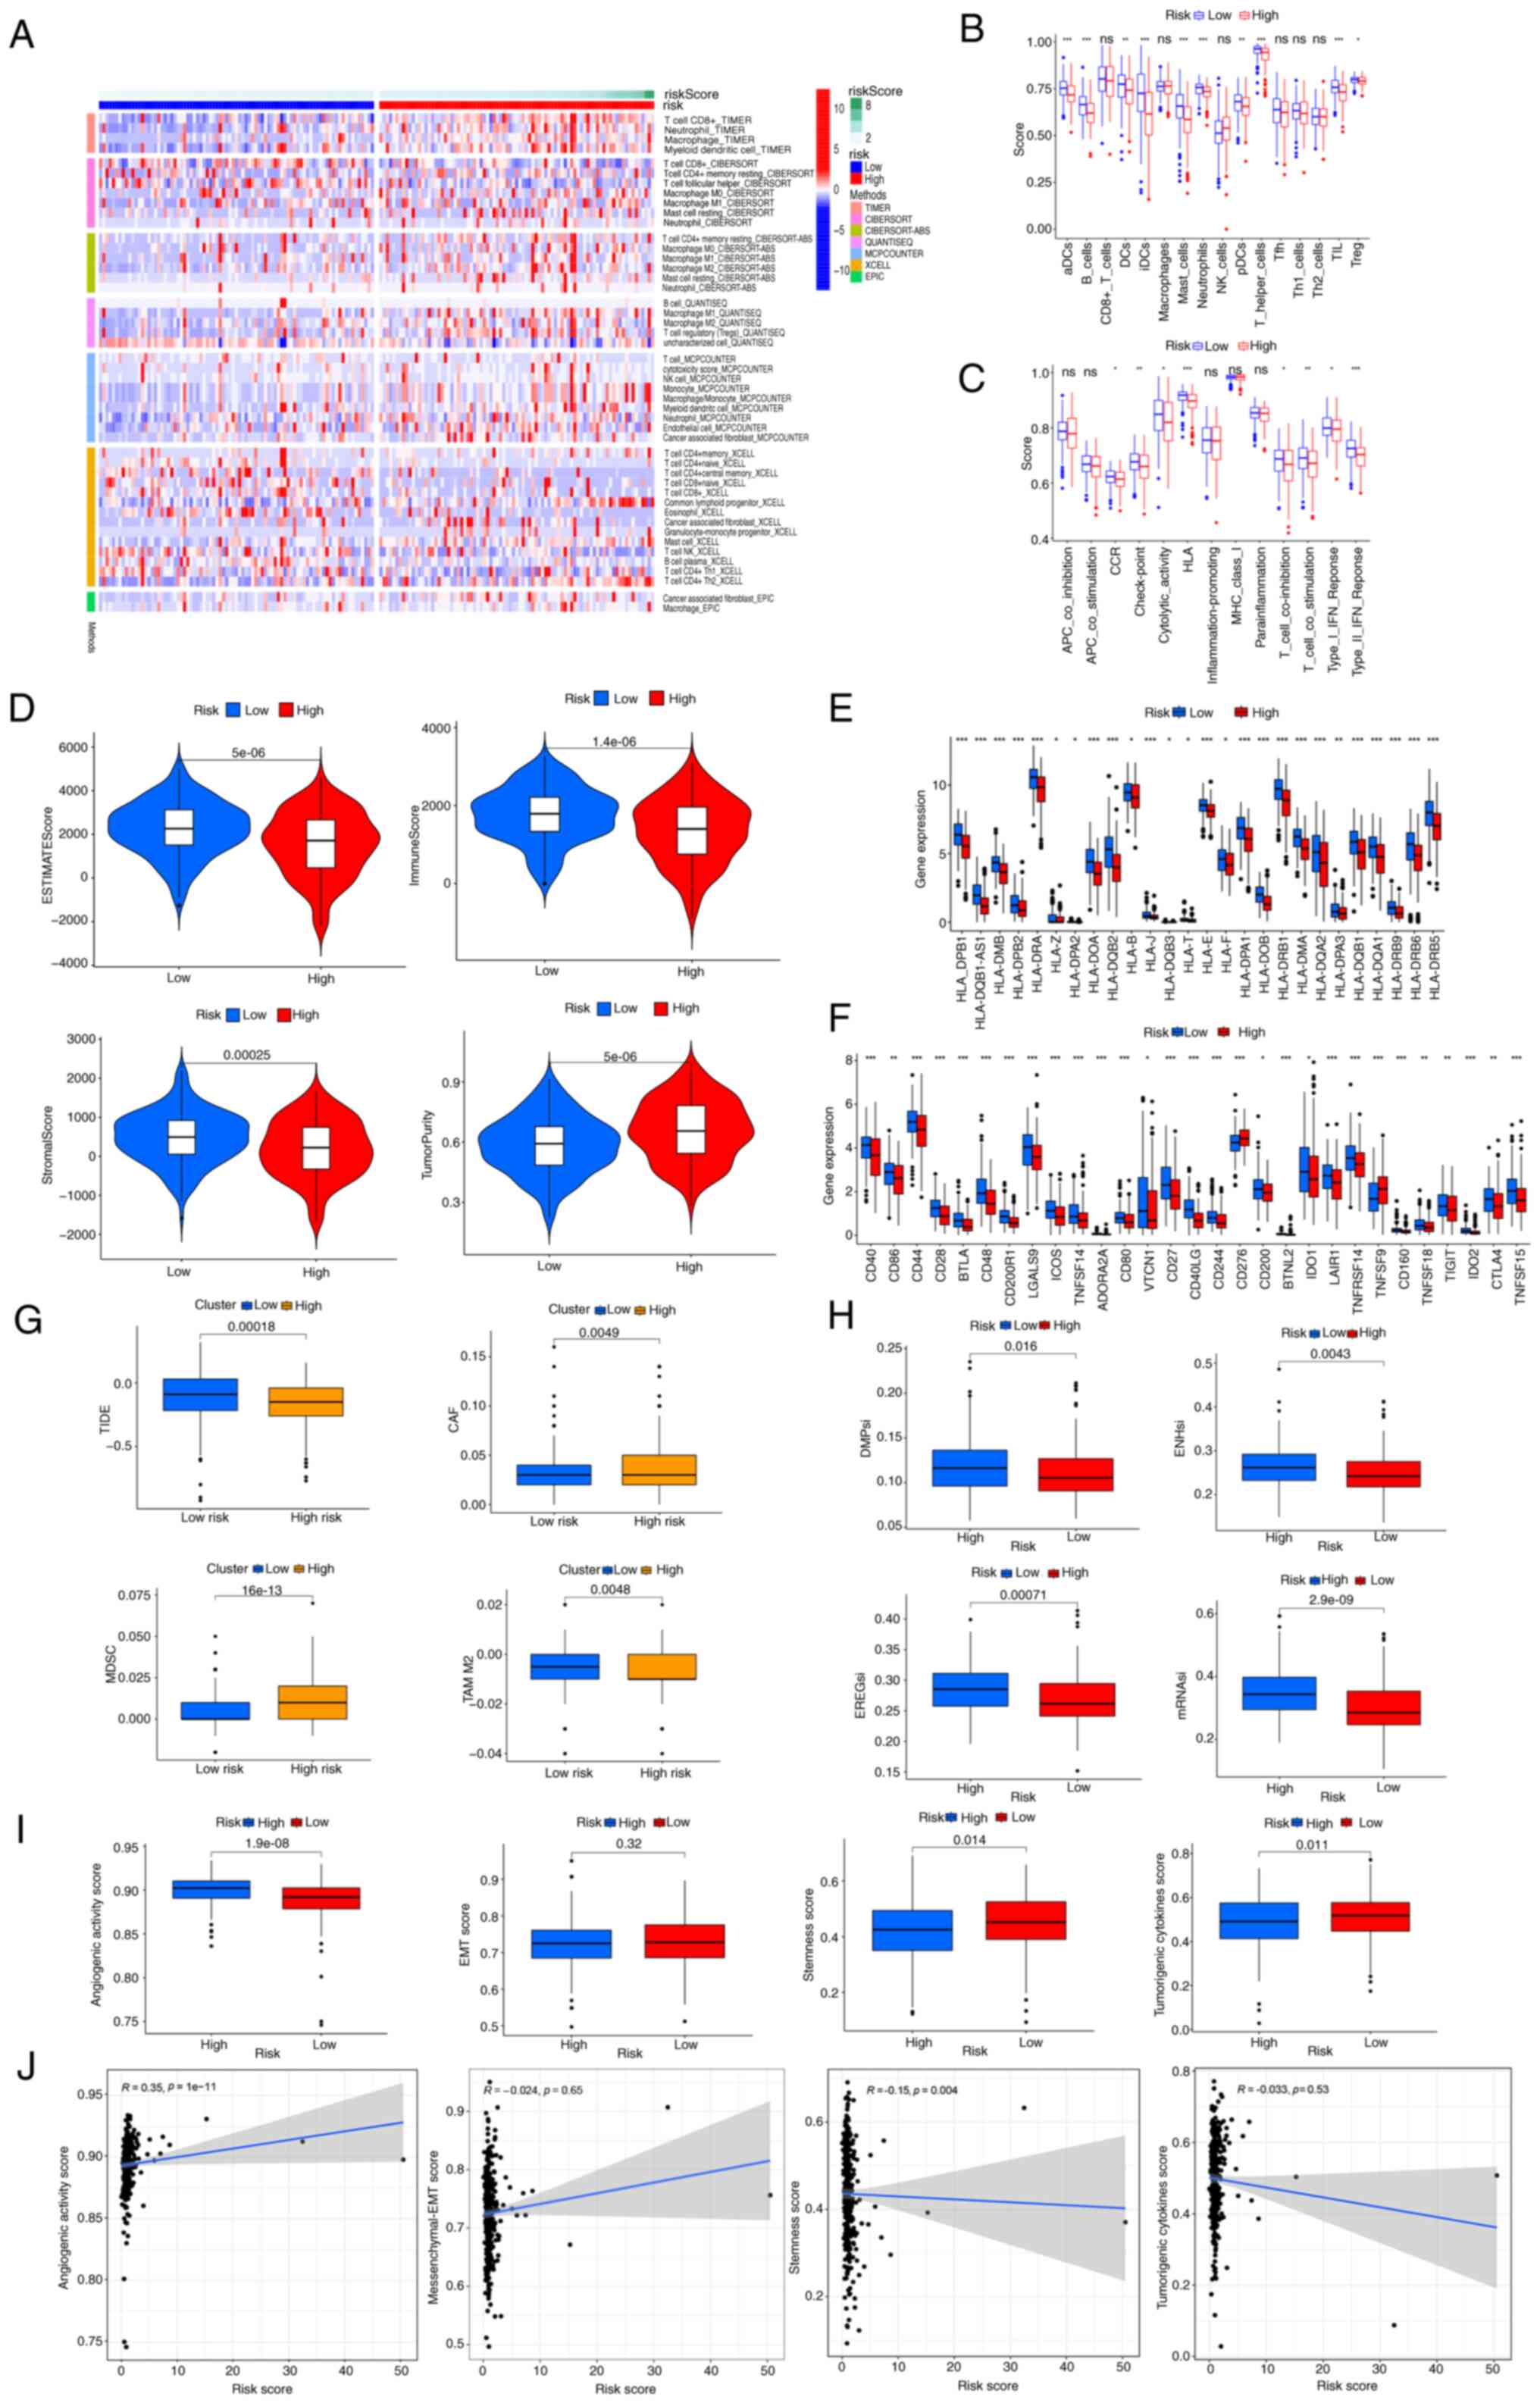 | Figure 6.Associations between
prognosis-related programmed cell death-related genes, immune
infiltration and malignant features. (A) Relationship between risk
score and changes in the immune landscape. Heatmap illustrates
patterns of anticancer immunity. (B) Immune cell subsets of
single-sample gene set enrichment analysis. (C) Immune cell
functions of single-sample gene set enrichment analysis. (D) Immune
and stromal scores in the low- and high-risk groups. (E) Expression
levels of major histocompatibility complex molecules. (F)
Expression levels of immune checkpoint markers in high- and
low-risk patients. (G) TIDE, CAF, MDSC and TAM M2 levels and scores
in the high- and low-risk groups. (H) Differences in tumor stemness
indices between the two groups. (I) Differences in angiogenic
activity, EMT, stemness and tumorigenic cytokine scores between two
risk groups. (J) Correlation of the risk score with angiogenic
activity, mesenchymal-EMT, stemness and tumorigenic cytokine
scores. *P<0.05, **P<0.01, ***P<0.001 for high vs low risk
group. ns, not significant; TIDE, tumor immune dysfunction and
exclusion; CAF, cancer-associated fibroblast; MDSC, myeloid-derived
suppressor cell; TAM, tumor-associated macrophage; EMT,
epithelial-mesenchymal transition. DMPsi, differentially methylated
probes-based stemness index; EREGsi, epiregulin-mDNA stemness
index; enhancer-based stemness index; mRNA stemness index. |
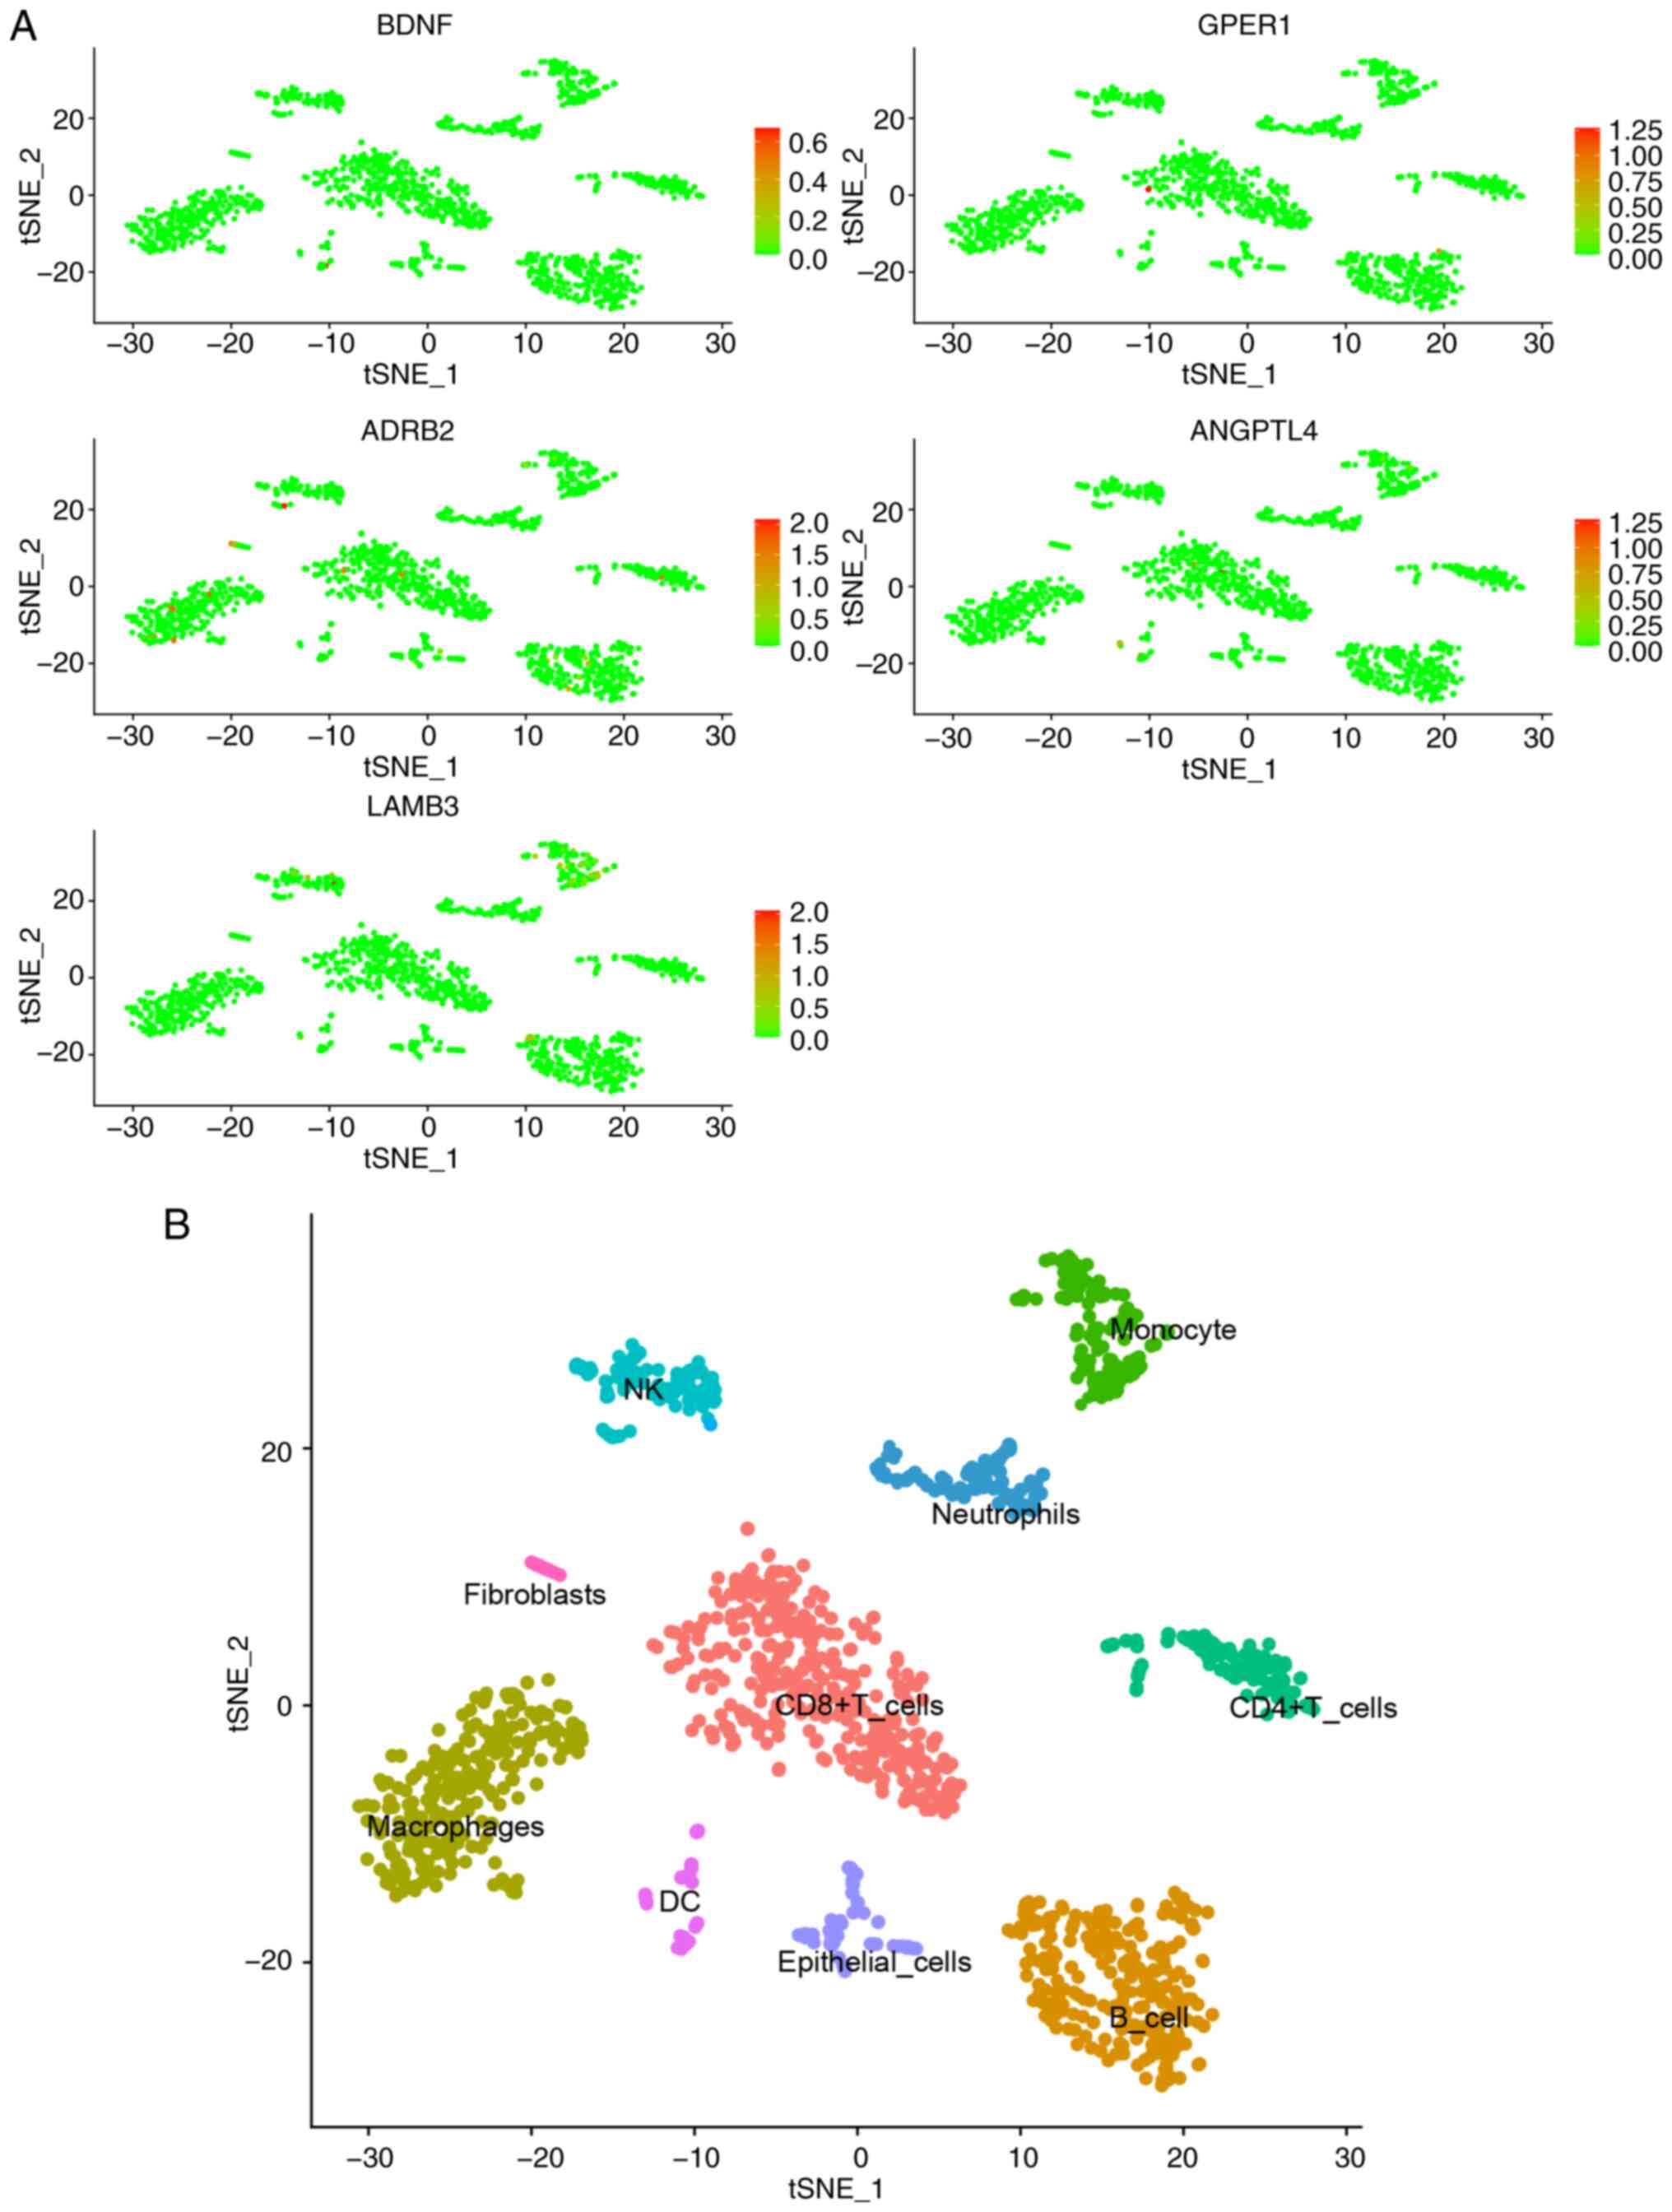
Single-cell analysis revealed limited expression of
the six DRGs in immune cells (Fig.
7). For example, GPER1 exhibited low expression in
CD8+ T cells, and ADRB2 was mainly expressed in
macrophages, T cells and B cells, while LAMB3 exhibited slightly
elevated expression in monocytes, NK cells and B cells. Combined
with the previous immune infiltration analysis, these findings
suggest that the six DRGs are primarily expressed in tumor cells
and may serve as predictors for patient risk stratification.
Further analysis of immune infiltration and single-gene
associations (Fig. S2) revealed
that BDNF expression was positively correlated with the mutual
promotion of T cells CD4 memory activated, T cells CD8, macrophages
and T cells CD4 memory activated. GPER1 expression was mainly
positively correlated with the mutual promotion of monocytes and T
cells CD4 memory resting, as well as mast cells resting and
monocytes. ADRB2 was positively correlated with interactions
between neutrophils and macrophages M2. MAP6 exhibited a positive
correlation with the mutual promotion of monocytes, macrophages M2,
DCs resting, DCs activated, mast cells resting and eosinophils.
ANGPTL4 was positively correlated with the mutual promotion of mast
cells activated, eosinophils and neutrophils. LAMB3 was positively
correlated with interactions between T cells CD8, T cells CD4
memory activated and macrophages M1. These findings indicate that
the expression of the six PRGs genes shows no significant variation
in TME-associated immune cells, but is closely associated with
immune cell function and interactions. Therefore, we hypothesize
that PCD primarily occurs in tumor cells within the TME, which
significantly promotes the activation and interactions of immune
cells. This also suggests that the predictive model constructed in
the present study not only estimates patient prognosis and risk
stratification but also effectively reflects the immune functional
status within the TME.
Four NSCLC immunotherapy cohorts were utilized to
validate the impact of BDNF on the response to immune checkpoint
inhibitors (Fig. S3). The results
from the GSE135222 cohort indicated that patients with low BDNF
expression treated with PD-1/PD-L1 inhibitors experienced improved
progression-free survival compared with those patients with high
BDNF expression (P<0.001; Fig.
S3A). The findings from the GSE126044 cohort revealed that
patients whose lung cancer was more sensitive to PD-1 inhibitors
exhibited lower BDNF expression levels than non-responders
(Fig. S3B). In the GSE111414
cohort, due to the limited sample size, the marked variability in
BDNF expression within each group resulted in no significant
difference being identified between the responder and non-responder
groups (Fig. S3C). In the
GSE207422 cohort, who received neoadjuvant therapy with PD-1
inhibitors combined with chemotherapy, patients with stage III lung
cancer who received this treatment and exhibited a pathological
partial response had lower BDNF expression than that of
non-responders (Fig. S3D). These
results indicate that the expression levels of BDNF can predict the
response of patients with NSCLC to immune checkpoint inhibitor
therapy.
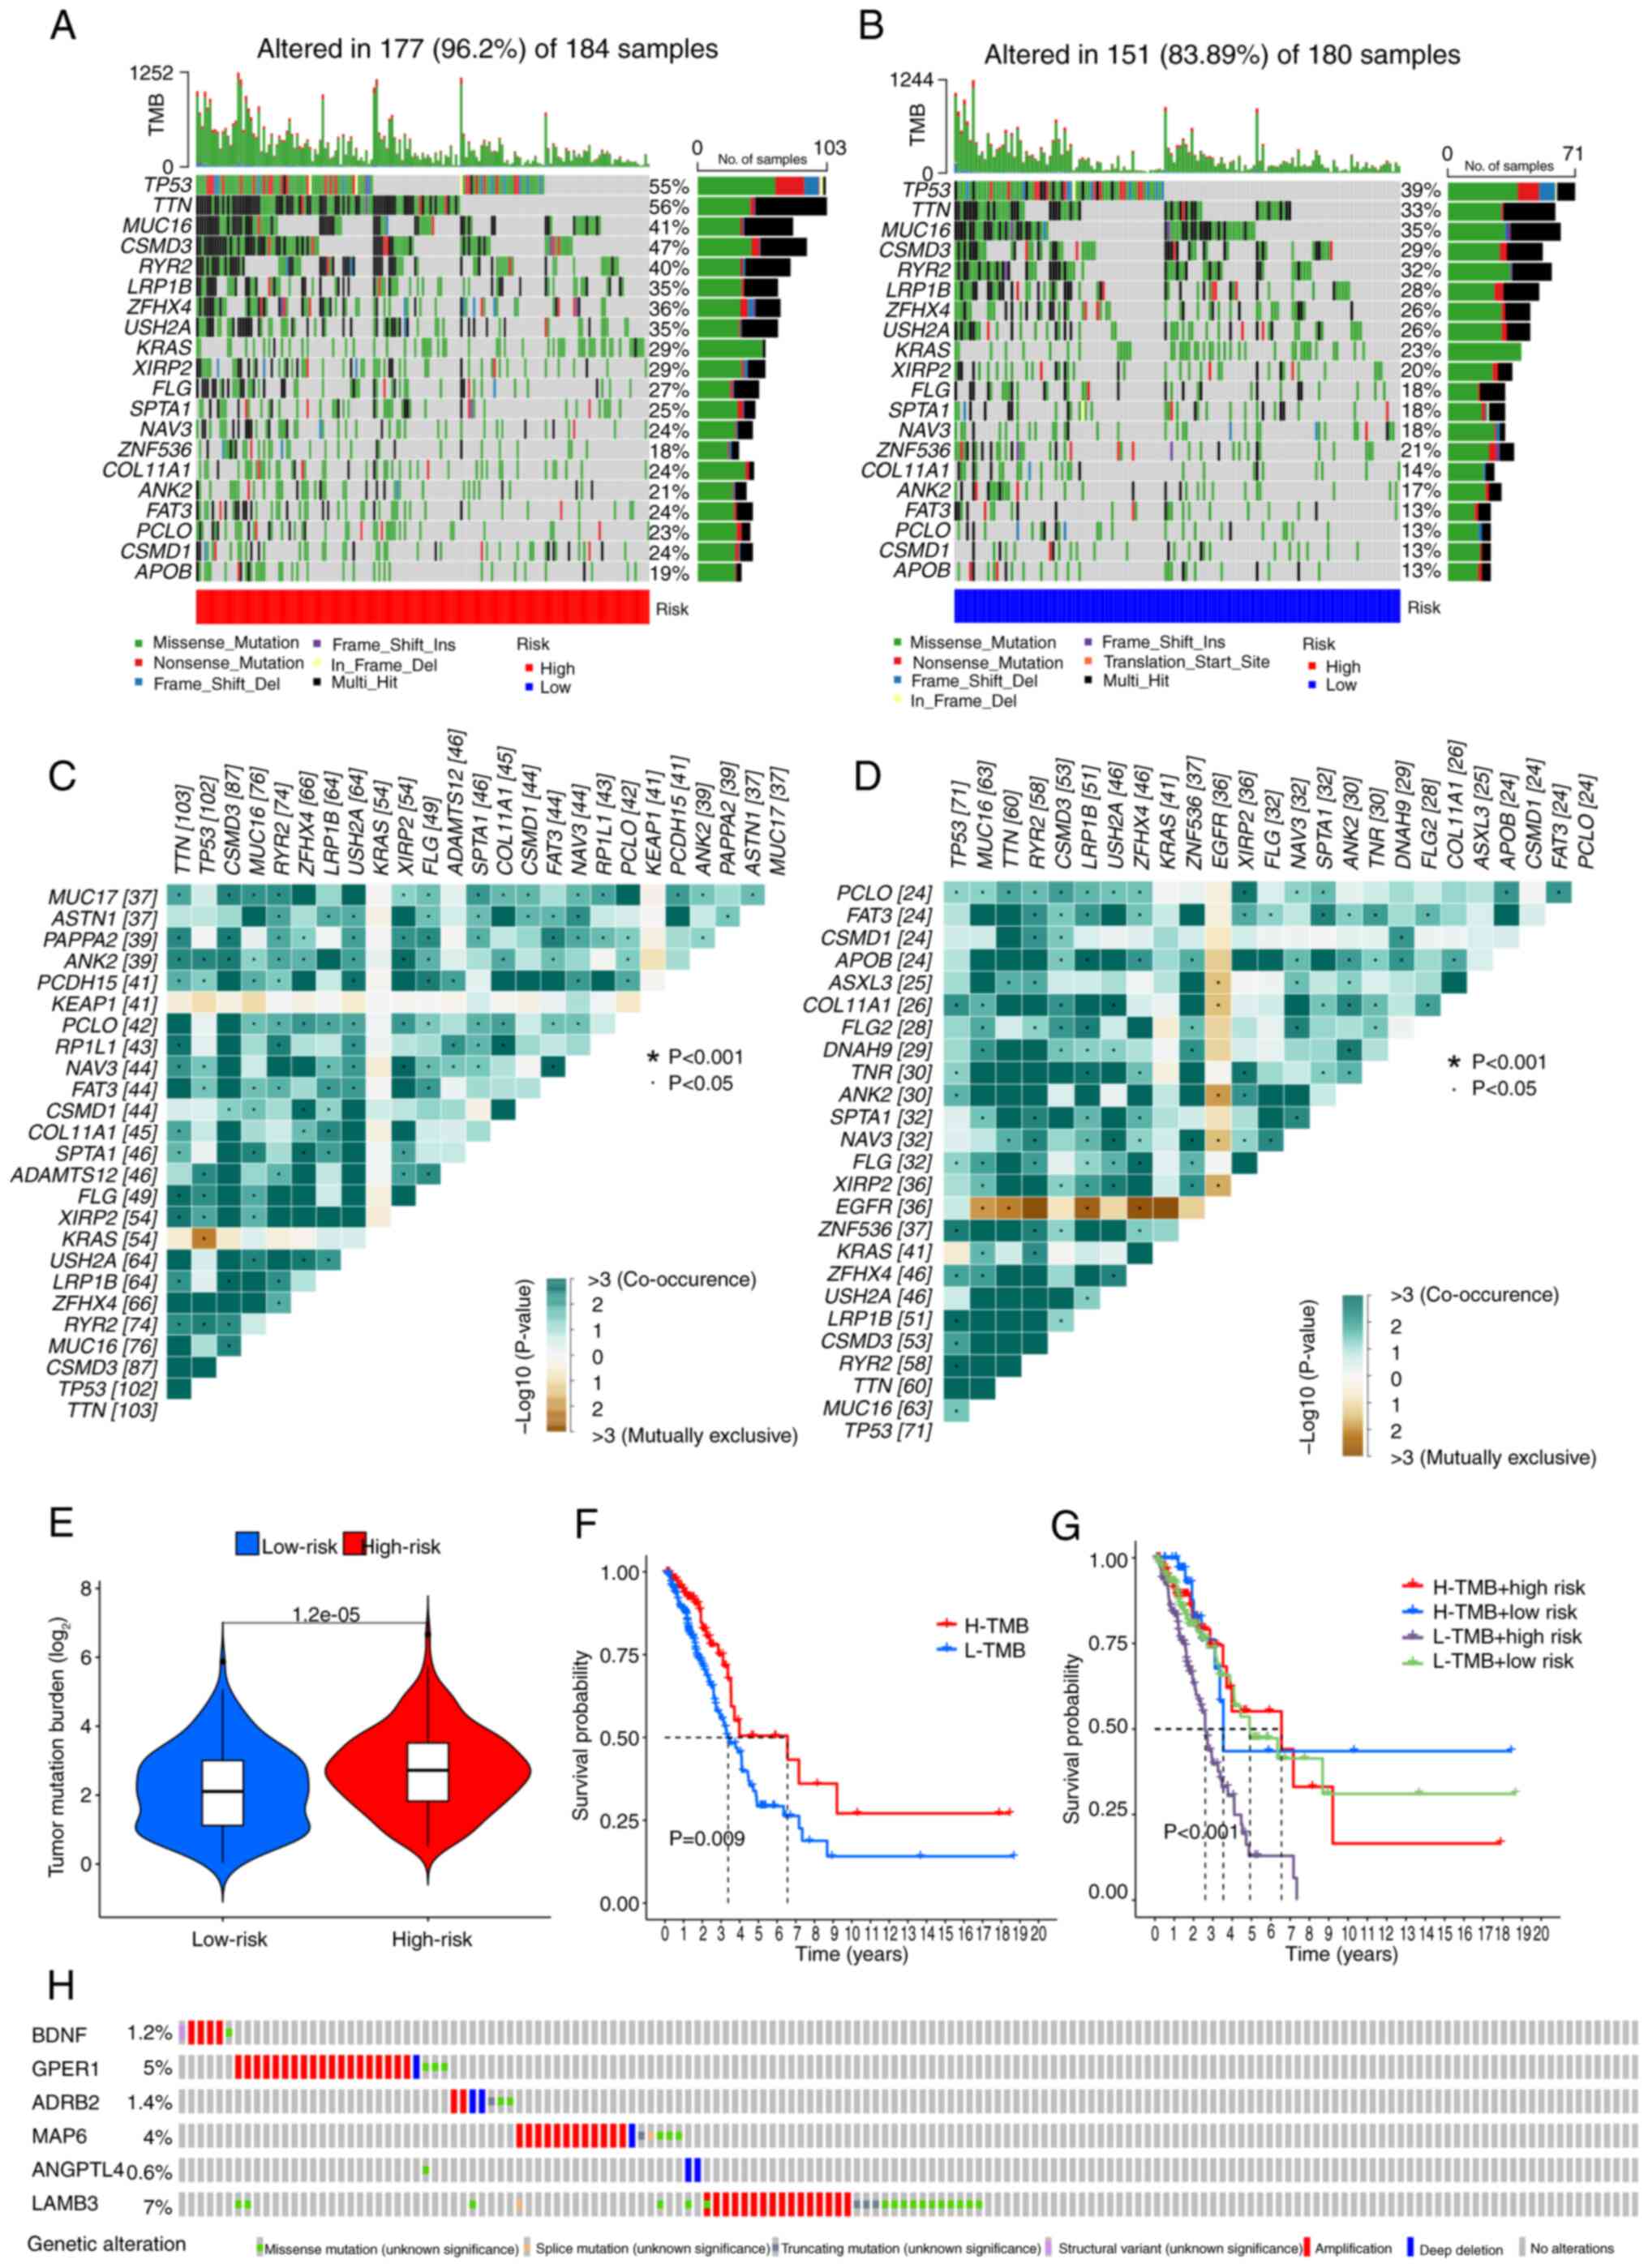
Comparison of somatic mutation
signatures and TMB
Basic nucleotide variation data were retrieved from
TCGA to investigate the differences in genomic mutations between
the two risk groups. TTN (56%), TP53 (55%),
CSMD3 (47%), MUC16 (41%) and RYR2 (40%) were
the top five genes showing the highest mutation frequencies in the
high-risk patients (Fig. 8A), and
TP53 (39%), TTN (33%), MUC16 (35%),
CSMD3 (29%) and RYR2 (32%) were the top five genes in
the low-risk group (Fig. 8B). A
higher mutation rate was detected in the high-risk group compared
with that in the low-risk group (P<0.05). Analysis of somatic
mutation interplay revealed widespread gene mutation co-occurrence
across the majority of genes. However, KRAS and KEAP1
mutations were mutually exclusive in the high-risk group
(P<0.05) (Fig. 8C), while
EGFR mutations were mutually exclusive (do not co-occur with
other genetic mutations within the same chromosomal region) in the
low-risk group (P<0.05) (Fig.
8D). Additionally, the high-risk group had a higher TMB
(P<0.001) (Fig. 8E). Among
patients with LUAD, those in the high-TMB group had a higher OS
time compared with those in the low-TMB group (P=0.009) (Fig. 8F). The 2- and 7-year survival rates
were significantly lower for patients who were high-risk and had a
low-TMB than for patients with other risk and TMB combinations
(P<0.001) (Fig. 8G). These
outcomes suggested that the current PRG-based model effectively
optimizes TMB-based survival predictions. Finally, the mutation
rates for the signature PRGs were observed to be as follows:
BDNF (1.2%), GPER1 (5%), ADRB2 (1.4%),
MAP6 (4%), ANGPTL4 (0.6%) and LAMB3 (7%)
(Fig. 8H).
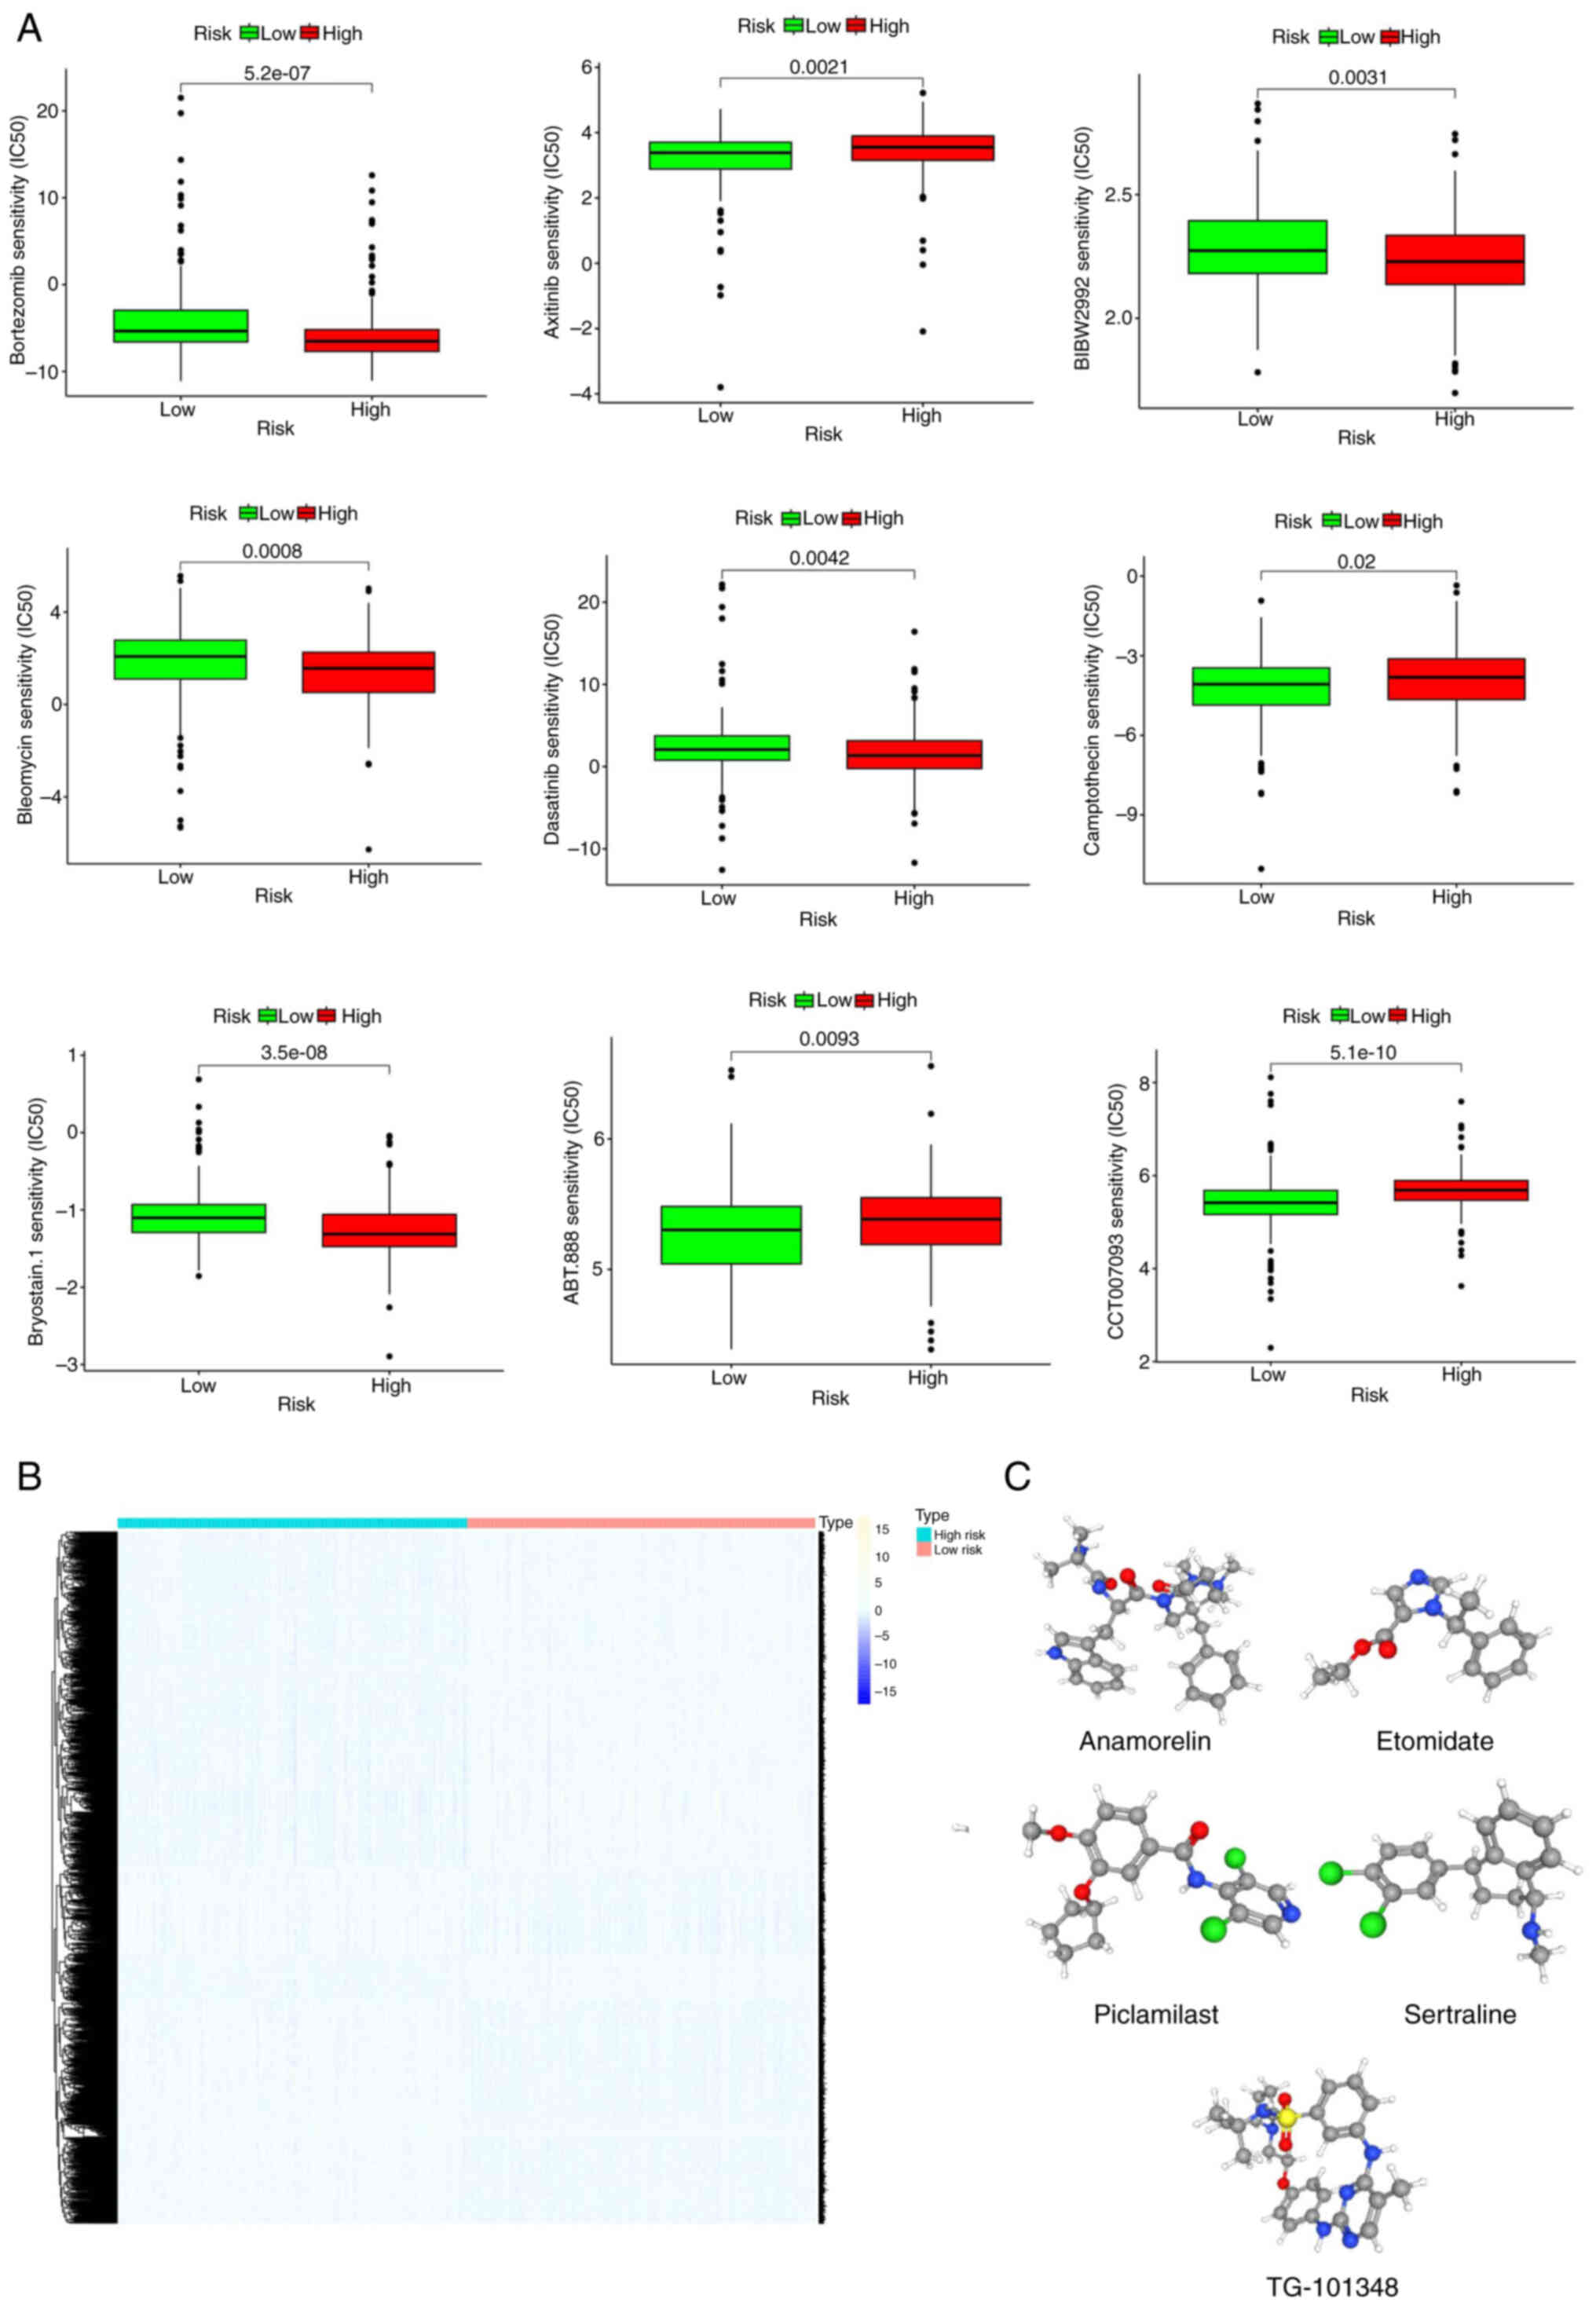
Exploring potential therapy for
patients with LUAD based on the six signature PRGs
Sensitivity analysis of commonly used therapeutic
drugs in clinical practice showed that bortezomib, BIBW2992,
bleomycin, dasatinib, and bryostatin 1 were more efficacious in the
low-risk groups, while camptothecin, CCT007093, ABT.888 and
axitinib were more effective in the high-risk group (Fig. 9A). Next, the differentially
expressed genes between the two risk groups were categorized into
upregulated and downregulated subsets (Fig. 9B). These genes were then queried in
the CMap database to identify compounds with potential for the
treatment of LUAD. Applying an FDR <0.05 and standardized score
for screening, 10 small-molecule compounds with potential
therapeutic effects on LUAD were identified, where a negative
enrichment score indicates an antitumor effect (Table I). The three-dimensional structures
of the top five small-molecule drugs are displayed in the Fig. 9C. One of the top 10 ranked
compounds, namely honokiol, was selected for cytotoxicity
validation. An SRB assay (Fig. S4)
revealed that at 24 and 48 h, honokiol inhibited the growth of A549
cells in a concentration-dependent manner within the concentration
range of 2.5–80 µM, with an IC50 of 50 µM. When used in
combination with Taxol, honokiol was observed to potentiate the
effects of Taxol, allowing for a marked reduction in the required
effective dose while maintaining the same therapeutic efficacy. The
results of a JC-1 assay indicate that honokiol (50 µM) disrupted
the mitochondrial membrane of A549 cells, promoting early
apoptosis. When combined with Taxol, this effect was significantly
enhanced (Fig. S5). In summary,
the PCD prognostic model was used to identify drugs with the
potential to effectively treat lung cancer and a preliminary
validation was conducted using cell experiments, which may serve as
a reference for the development of novel lung cancer therapies.
 | Table I.Small-molecule drugs in the
Connectivity Map dataset. |
Table I.
Small-molecule drugs in the
Connectivity Map dataset.
| Compound name | Mechanism of
action | FDR value | Standardized
enrichment score |
|---|
| TG-101348 | JAK inhibitor and
FLT3 inhibitor | 0.0286 | −0.6089 |
| Anamorelin | Growth hormone
secretagogue receptor agonist | 0.0256 | −0.6021 |
| Sertraline | Serotonin receptor
antagonist | 0.0239 | −0.6001 |
| Etomidate | Membrane integrity
inhibitor | 0.0238 | −0.6 |
| Piclamilast | Phosphodiesterase
inhibitor | 0.0185 | −0.588 |
| Honokiol | Hippo signaling
pathway inhibitor and autophagy agonist | 0.0128 | −0.572 |
| Spironolactone | Mineralocorticoid
receptor antagonist | 0.0128 | −0.572 |
| BMS-777607 | MET inhibitor | 0.0078 | −0.5542 |
| RS-56812 | Serotonin receptor
agonist | 0.0062 | −0.5468 |
| Artesunate | Apoptosis
agonist | 0.0060 | −0.5532 |
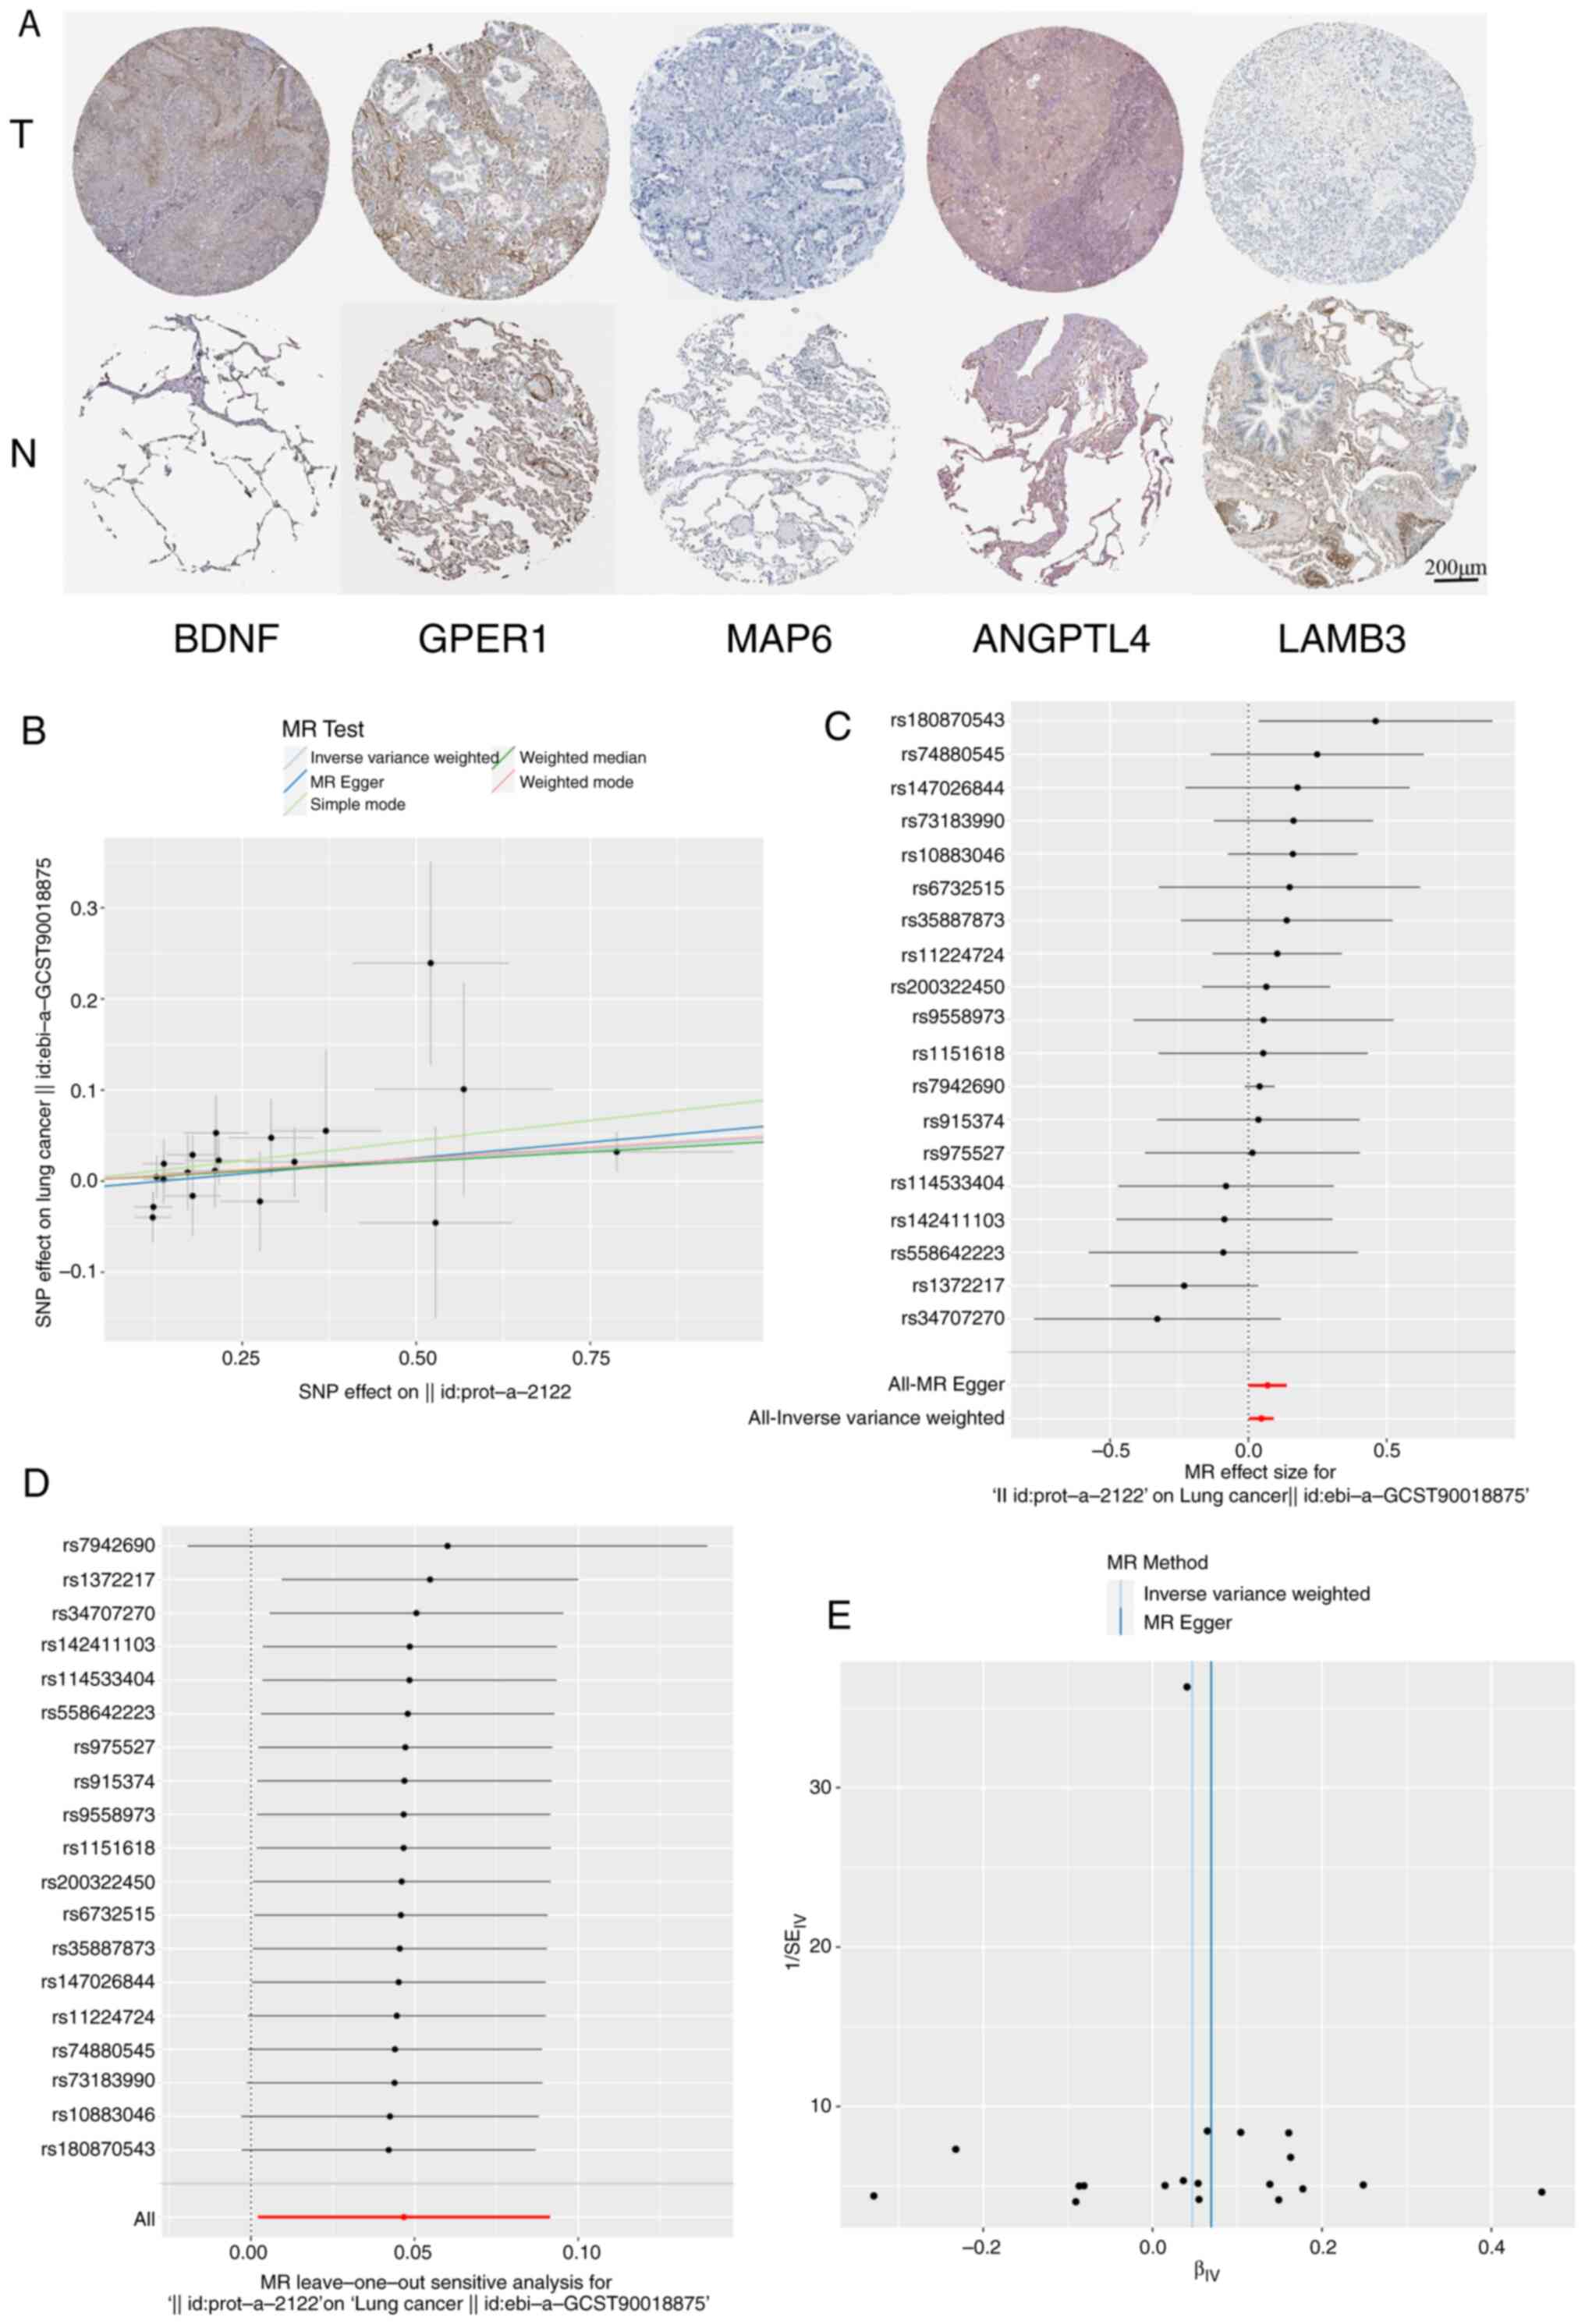
Immunochemistry validation based on
the HPA database
The expression of certain proteins corresponding to
the signature PRGs, namely LAMB3 and MAP6, was higher in normal
lung tissue than in LUAD tissue (Fig.
10A). However, ANGPLT4 and GPER1 did not show clear differences
between these tissue types. The expression of BDNF in LUAD tissue
was higher than that in normal lung tissue. This analysis combined
with the current predictive model indicates that the high
expression of BDNF is negatively associated with the prognosis of
patients with LUAD. Notably, it was not possible to evaluate ADRB2,
as no immunohistochemistry data for this protein is available in
the HPA database.
BDNF is causally associated with the
risk of LUAD
MR is a reliable method for inferring potential
causal relationships, which uses SNPs as IVs to assess causal links
between exposure factors and outcomes. MR leverages genetic
variations strongly associated with exposure factors as IVs to
infer causal effects. All SNPs used in the present study were
robust IVs. The causal effects of each genetic variation on LUAD
are illustrated in Fig. 10B and
C.
A specific analysis of the causal association
between BDNF levels and LUAD was performed. Using the IVW
method, it was demonstrated that higher BDNF levels were
associated with an increased risk of LUAD, with an odds ratio (OR)
of 1.048 (95% CI, 1.002–1.096; P=0.04). However, the MR-Egger
method, did not show statistical significance (OR, 1.0717; 95% CI,
1–1.1484; P=0.06). As depicted in Fig.
10D, a systematic MR analysis was conducted by iteratively
removing each SNP, and the results remained consistent. This
suggests that the causal inference was robust across all SNPs,
indicating that no single SNP dominated the association between
BDNF expression levels and LUAD, thereby validating the MR
results. The funnel plot (Fig.
10E) shows a roughly symmetrical distribution, and the MR-Egger
regression intercept did not reveal significant horizontal
pleiotropy (P=0.416), further supporting the suggestion that that
pleiotropy did not bias the causal effect.
Validation of expression of the six
signature mRNAs in lung cancer cell lines using RT-qPCR
The expression levels of BDNF in LLC
(P<0.0001), H1975 (P<0.0001) and A549 (P<0.0001) cells
were significantly higher than those in BEAS-2B cells (Fig. 11A). In addition, GPER1 was
also more highly expressed in LLC (P<0.001), H1975 (P<0.0001)
and A549 (P<0.0001) cells. However, ADRB2 as a protective
gene, was more highly expressed in BEAS-2B cells than in the three
lung cancer cell lines (P<0.0001, respectively). ANGPTL4
gene expression was higher in H1975 (P<0.0001) and A549
(P<0.01) cells than in BEAS-2B cells, and LAMB3
expression was elevated in H1975 (P<0.0001) cells compared with
BEAS-2B cells. The expression levels of MAP6 were lower in
H1975 cells compared with those in BEAS-2B (P<0.0001) and A549
(P<0.05) cells. These outcomes validate the differential
expression of the six PRGs between normal and LUAD samples,
highlighting their ability as predictive biomarkers.
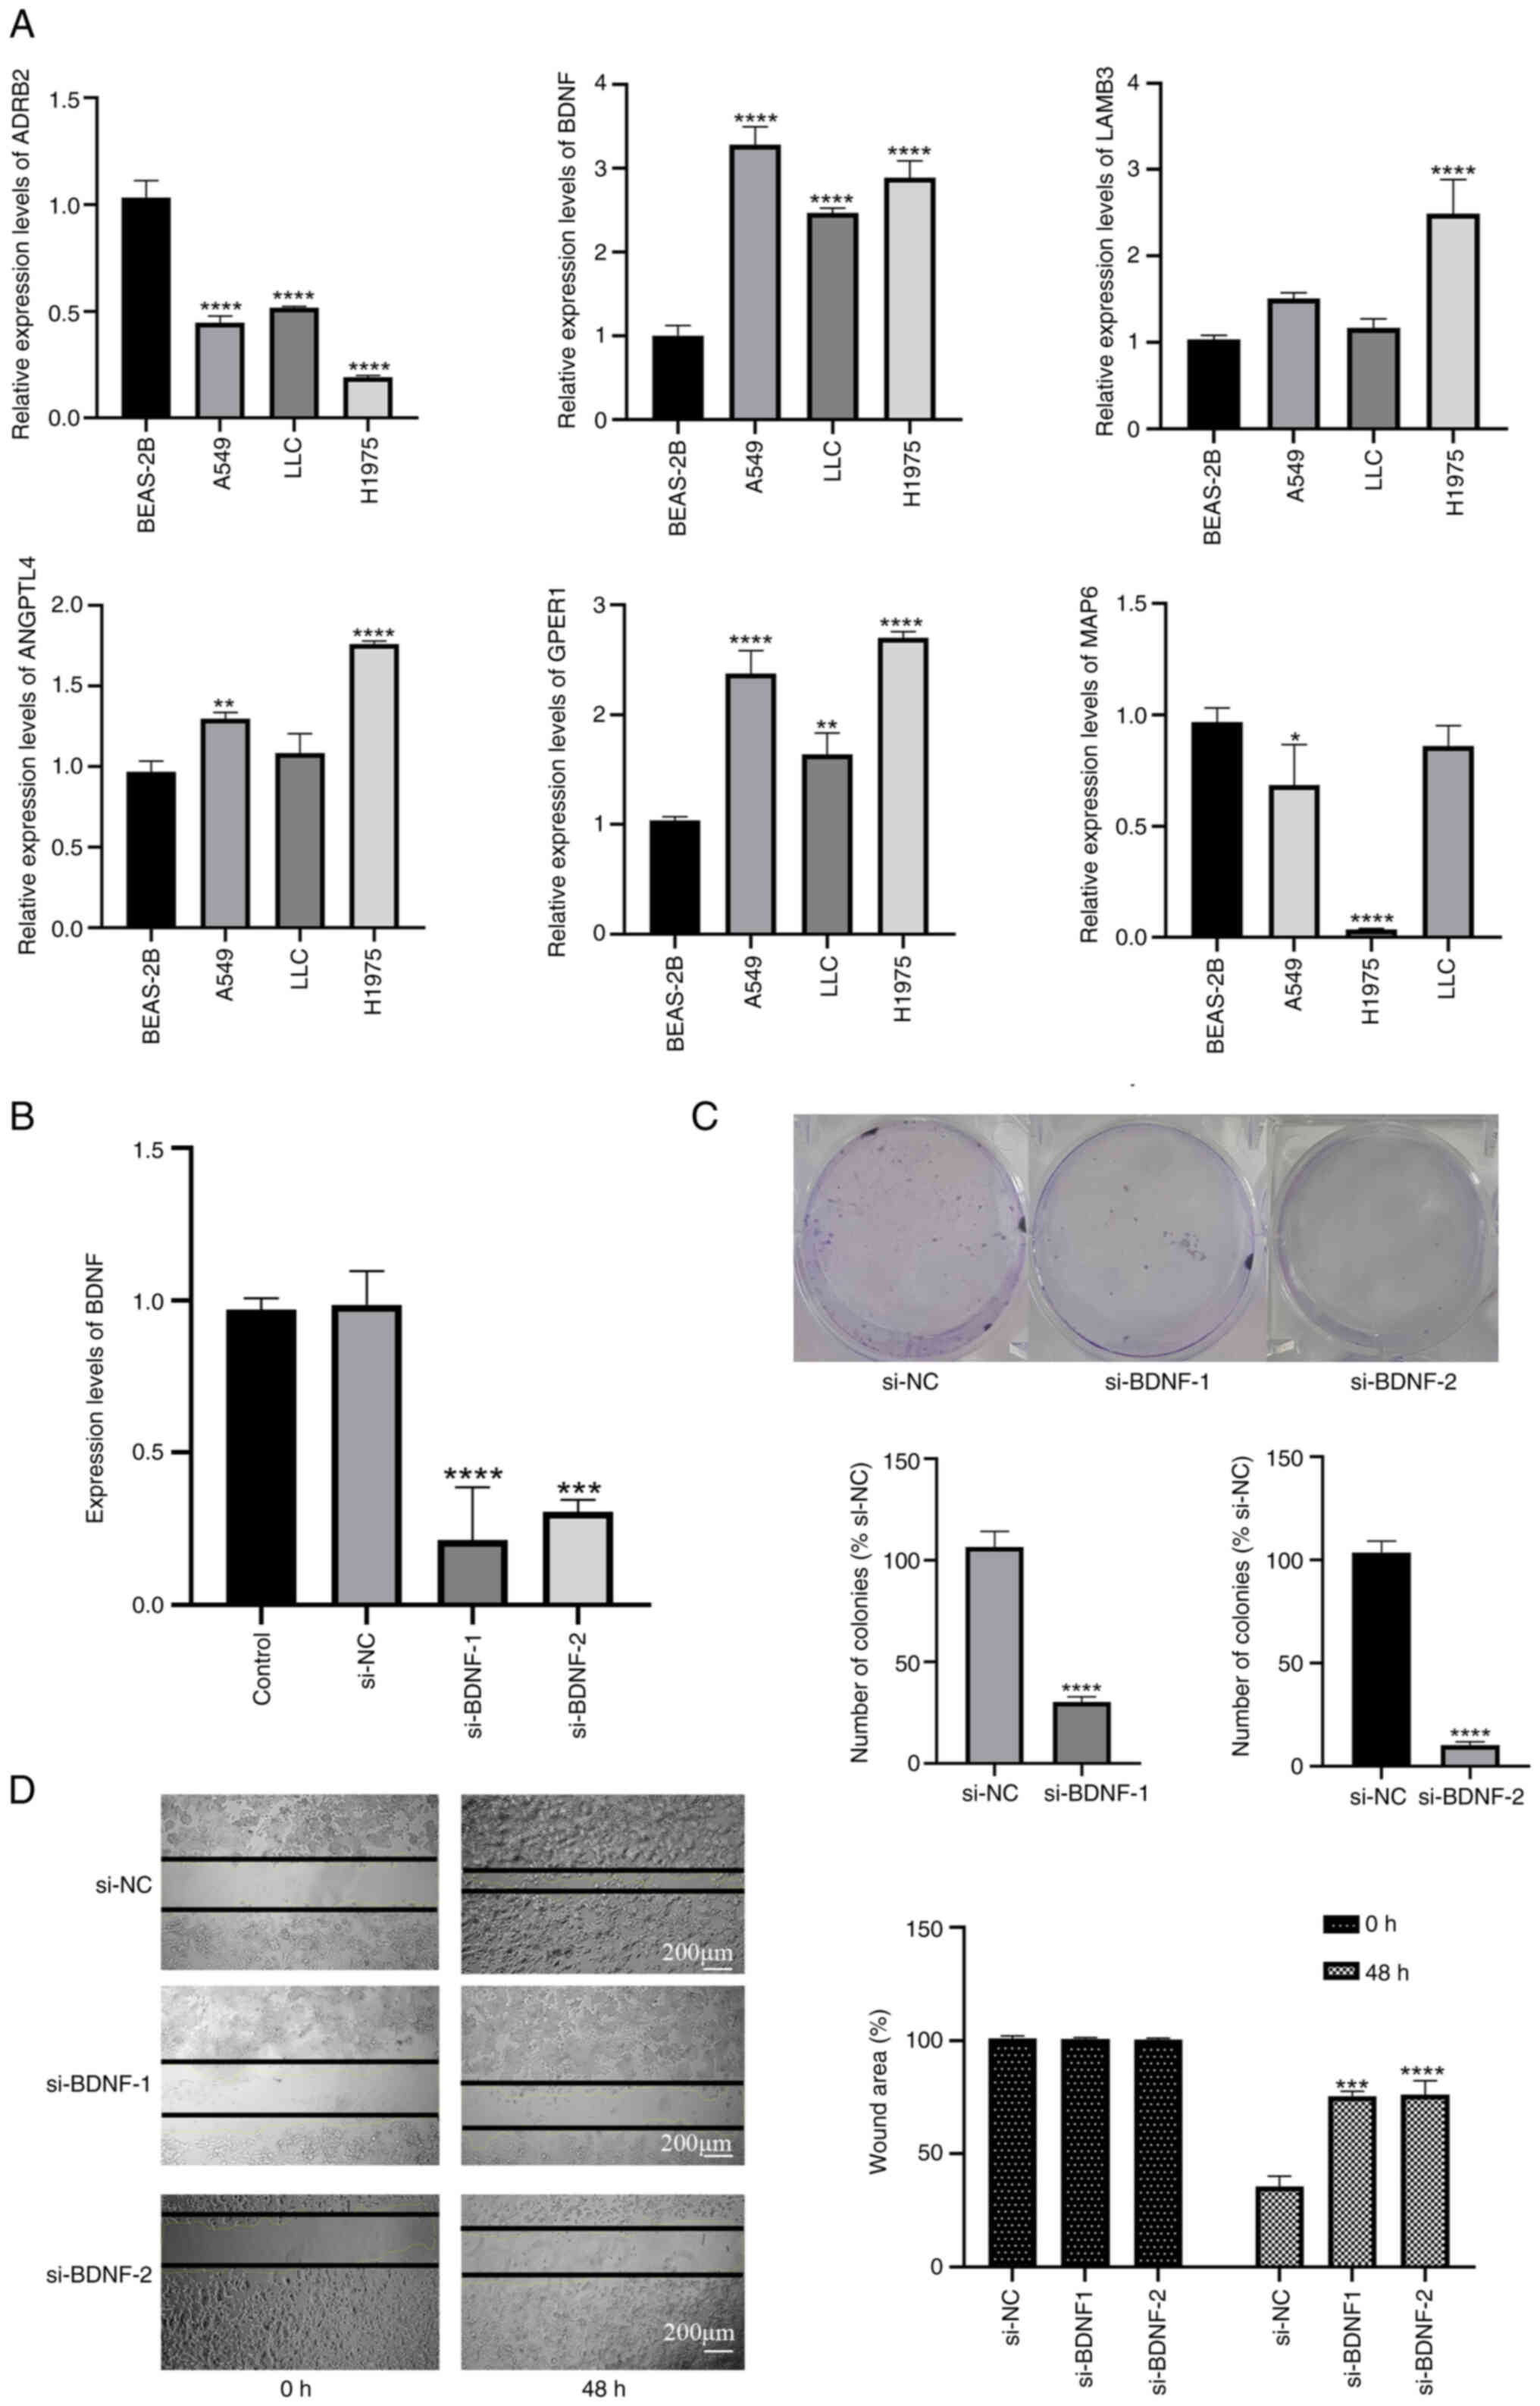 | Figure 11.Knockdown of BDNF effectively
inhibits the growth and migration of lung cancer cells. (A) mRNA
expression of six predictive PRGs in lung cancer and normal human
bronchial epithelial cell lines. (B) BDNF gene expression in A549
cells is effectively reduced by si-BDNF. (C) Cell growth evaluated
by colony formation assay (n=3). (D) Cell migration evaluated by
wound healing assay using three randomized microscopic fields
(n=3). Data are presented as the mean ± SD. *P<0.05,
**P<0.01, ***P<0.001 and ****P<0.0001 vs. BEAS-2B, control
or si-NC, as appropriate. LLC, Lewis lung carcinoma; BDNF,
brain-derived neurotrophic factor; ADRB2, adrenergic receptor b2;
ANGPTL4, angiopoietin-like protein 4; GPER1, G protein-coupled
estrogen receptor 1; LAMB3, laminin b3; MAP6, microtubule
associated protein 6; si, small interfering RNA; NC, negative
control. |
Decreased BDNF expression suppress the
growth and migration of lung cancer cells
Based on the results from PPI, LASSO regression and
MR, BDNF was identified as the core gene in the six-gene model, as
it exhibits a strong positive association with the occurrence and
development of LUAD. Therefore, targeted knockdown of BDNF in LLC
cells was performed to investigate its importance (Fig. 11B). A colony formation assay
(Fig. 11C) revealed that the
knockdown of BDNF suppressed the colony formation of LLC
cells. Also, the wound healing time of transfected LLC cells was
significantly slower compared with that of the si-NC group at 48 h
after BDNF knockdown, indicating that BDNF is crucial
for the migration of LLC cells (Fig.
11D).
Decreased BDNF expression promotes the
PCD of lung cancer cells
Western blot analysis indicated that BDNF knockdown
induces apoptosis in LLC cells, as evidenced by caspase-8 cleavage.
Whether BDNF knockdown also induces necroptosis was also
investigated by the measurement of phosphorylated
receptor-interacting protein kinase 1 (p-RIPK1), a phosphorylated
protein marker that regulates both apoptosis and necroptosis
(36). Notably, LLC cells with
BDNF-knockdown exhibited an increased p-RIPK1/RIPK1 ratio
(P<0.0001). Similarly, BDNF-knockdown promoted the production of
cleaved CASP1 (P<0.01) and cleaved CASP8 (P<0.0001), which
are hallmarks of pyroptosis (37)
and apoptosis (38) (Fig. S6). In summary, these data suggest
that BDNF knockdown sensitizes LLC cells to multiple forms of PCD,
including apoptosis, necroptosis and pyroptosis.
Discussion
PCD is an important mechanism for the maintenance
of normal cell renewal and tissue homeostasis via the removal of
potentially harmful, dysfunctional or damaged cells. Dysregulation
of the normal cell death process can lead to various human
diseases, including autoimmune diseases, cancer, infectious
diseases, neurodegenerative diseases and cardiovascular diseases
(39). Apoptosis is a
well-established example of PCD, which is involved in embryonic
development, the removal of infected cells and clearance of
abnormal cells (40). Apoptosis is
a key mechanism targeted by numerous cancer therapies. However,
cancer cells can develop chemoresistance by evading apoptosis. For
example, the upregulation of miRNA-34a and miR-141 during treatment
may contribute to the paclitaxel resistance of breast cancer cell
lines (41). Another mode of PCD is
pyroptosis, a novel non-apoptotic form of PCD closely associated
with inflammatory responses. Pyroptosis is mainly triggered by
inflammasomes and executed by the caspase and gasdermin protein
families. Pyroptosis kills tumor cells by releasing cytokines,
including IL-18 and IL-1β, and other molecules, such as high
mobility group box 1 protein and ATP, and activating antitumor
immunity (42). PCD has been
indicated to play a crucial role in cancer clinical therapy and the
development of diagnostic markers. Although molecular prognostic
models for LUAD have been developed, their effectiveness remains
limited. Also, numerous models focusing on cell death consider only
a single type of cell death, neglecting the interactions and
crosstalk between different cell death pathways (43–46).
In the present study, the key genes of 15 different
PCD modules were extensively screened and six PRGs associated with
the prognosis of LUAD were identified: BDNF, GPER1, ADRB2, MAP6,
ANGPTL4 and LAMB3. The differential expression of these
PRGs in LUAD cell lines was demonstrated using RT-qPCR. In
addition, KEGG and GO enrichment analyses were performed to
investigate the biological roles of PRGs in LUAD. A prognostic
model was developed using TCGA cohort as the training set, while
GEO cohorts served as validation sets to assess the reliability of
the model. The PRG model was used to calculate a risk score for
patients with LUAD, and this score was shown to independently
predict patient prognosis. In addition, a prognostic nomogram
encompassing clinical features and risk scores was constructed, and
the associations between risk scores and the TME were analyzed.
Finally, the causal relationship between the core gene BDNF
and LUAD was explored through MR, and preliminary validation was
performed via cell experiments.
The present study discovered that the expression
levels of ADRB2 and MAP6 are elevated in patients
with LUAD and associated with an improved prognosis, while the
elevated expression of BDNF, GPER1, ANGPTL4 and LAMB3
is associated with a poor prognosis. Based on the PPI network,
LASSO regression and coefficient scoring, BDNF was
identified as the core gene with the highest efficacy in the model.
The causal relationship between BDNF and LUAD was determined
via MR analysis, indicating that the elevated expression of
BDNF is an important factor in the occurrence and
development of LUAD. In vitro experiments demonstrated that
reducing the level of BDNF effectively restrained the
invasion and proliferation of lung cancer cells. BDNF is a member
of the NT family and plays a crucial role in neuronal development
and regeneration (19). Upon
binding with its main receptor TrkB, BDNF activates diverse
downstream signaling pathways, including the RAS, PI3K/AKT and
JAK/STAT pathways (47). BDNF is
mainly secreted by tumor cells and promotes tumor growth and
survival in patients with cancer, with research demonstrating that
BDNF and TrkB facilitate the onset and progression of various human
malignancies, including lung (48),
breast (49), prostate (50) and colorectal (51) cancer. BDNF/TrkB signaling has been
reported to be associated with proliferation and invasiveness,
suggesting that BDNF may be a crucial element in tumor progression
and a potential therapeutic target (52).
In addition to the ability of the six-gene risk
score to assess the prognosis of patients with LUAD, it is
noteworthy that the low-risk score group exhibited higher levels of
DC, CD8+ T cell, Th1 cell, NK cell and B cell
infiltration than the high-risk score group. DCs, Th1 cells and
CD8+ T cells are key participants in antitumor-specific
immunity, while B cells represent humoral antitumor immunity and
activate NK cells through antibody-dependent cellular cytotoxicity
(53). The results of the present
study suggest that patients in the low-risk group have a stronger
antitumor adaptive immune response, potentially forming an immune
memory that improves prognosis. However, the low-risk group also
had an increased TIDE score, indicating increased immune evasion,
which suggests a hidden risk of immune cell exhaustion. The
expression of immune checkpoint markers was higher in the low-risk
group compared with the high-risk group, indicating that the use of
immune checkpoint inhibitors might yield promising results for
low-risk patients. In the high-risk group, the TME accumulated high
levels of factors such as CAFs, which can result in CD8+
T cell exhaustion and subsequent tumor immune evasion (54). Additionally, based on the somatic
mutation waterfall plot, TP53 missense mutations were found
to be among the most frequent mutations in both groups, with the
mutation rates of TP53 and KRAS being higher in the
high-risk group compared with those in the low-risk group.
TP53 is a crucial tumor suppressor gene, and its high
frequency of missense mutations often indicates a poor prognosis
for patients (55). A strong mutual
exclusivity between KRAS and TP53 was observed in the
high-risk group, while in the low-risk group, EGFR showed
strong mutual exclusivity with MUC16, TTN, LRP1B and
ZFHX4. A cohort study of 283 lung cancer cytology samples
indicated that patients with the KRAS/TP53 subtype had worse
OS compared with patients with other subtypes (56). Based on the prognostic model and
somatic mutation results obtained in the present study, a TMB
analysis was conducted between the high- and low-risk groups to
guide immunotherapy and survival prediction. The results
demonstrated that the 2- and 7-year survival rates were
significantly lower in patients with high-risk and a low-TMB group
compared with that in patients with other risk and TMB
combinations, suggesting that the PRG model effectively optimizes
TMB-based survival predictions. To validate the predictive role of
BDNF in immunotherapy, four GEO immunotherapy cohorts were
evaluated. The results of this evaluation indicate that BDNF
expression levels may help to determine whether PD-1/PD-L1
inhibitors are likely to be beneficial in the systemic or
neoadjuvant treatment of patients with advanced-stage NSCLC.
A number of researchers have found a close
relationship between PCD activity and antitumor immune responses,
consistent with the results of the present study. PCD can be
classified into immunogenic and non-immunogenic types, depending on
its ability to initiate adaptive immune responses. Immunogenic PCD
alerts the immune system to potential threats by releasing
pro-inflammatory cytokines or damage-associated molecular patterns.
Pattern recognition receptors on immune cells detect these signals,
which then trigger the activation of immune responses (57). For instance, necroptotic cells
promote DC maturation and cross-priming efficiency, thereby
boosting CD8+ T cell-mediated antitumor immunity through
RIPK1 and NF-κB signaling pathways (58).
Notably, the risk score also performed well in
guiding chemotherapy strategies. The present study found that
patients in the high-risk group had higher IC50 values
for axitinib, veliparib (ABT-888) and camptothecin, which could
explain the poorer prognosis of patients due to their resistance to
these drugs. Conversely, the high-risk group exhibited lower
IC50 values for bortezomib, bleomycin and bryostatin 1,
suggesting that these drugs could be potential candidates for
treating patients with LUAD who have become resistant to standard
treatments. Furthermore, differentially expressed genes were
screened between high- and low-risk groups, and imported into the
CMap database, which identified 10 compounds with potential
therapeutic efficacy for patients with high-risk LUAD. These
compounds included fedratinib (TG-101348), a JAK2 inhibitor that
has demonstrated therapeutic efficacy in patients with primary or
secondary myelofibrosis (59).
Studies have shown that the combination of fedratinib and erlotinib
can inhibit the growth of erlotinib-resistant NSCLC cells by
suppressing the JAK2/STAT3 signaling pathway (60). Another compound identified was
anamorelin, a novel non-peptide ghrelin receptor agonist primarily
used to treat cachexia, which addresses factors such as appetite,
body composition, adipose tissue metabolism, energy expenditure and
inflammation. Two international, double-blind, phase III trials,
known as ROMANA 1 and ROMANA 2, have established the efficacy and
safety of anamorelin in patients with advanced NSCLC and cachexia
(61). Further identified compounds
included sertraline, an antidepressant with anticancer properties
that enhances TRAIL-mediated apoptosis in lung cancer cells mainly
via the downregulation of AMP-activated protein kinase
phosphorylation (62), and
etomidate, a non-barbiturate intravenous anesthetic that modulates
g-aminobutyric acid type A receptors to induce anesthesia, and has
been shown to sustain CD4+ and CD8+ T cell
levels in patients with LUAD (63).
Furthermore, cellular experiments have shown that etomidate
inhibits the migration and invasion of A549 cells by suppressing
the expression of MMP1, MMP2, MMP7 and MMP9 (64). The present study suggests that these
drugs also have the potential to regulate PCD in LUAD, which
warrants further mechanistic investigations.
Although the present study offers worthful insights
into the clinical significance of PCD characteristics and BDNF,
several limitations must be acknowledged. First, certain analyses
are based on retrospective data from public databases, which
emphasizes the requirement for prospective studies to confirm the
clinical importance of the findings. Considering the complexity and
diverse histological phenotypes of LUAD, more detailed mechanistic
and clinical research is essential to investigate the roles of PRGs
across different LUAD subtypes. Also, although the differential
expression of PRGs between LUAD and precancerous specimens has been
analyzed, protein-level validation of these genes remains pending.
In addition, comprehensive in vivo and in vitro
experiments are warranted to further elucidate the mechanistic
roles of BDNF in tumor progression and its interaction with the
TME. Lastly, the impact of the PCD model in the present study has
yet to be confirmed through phase III randomized controlled trials.
Therefore, it is proposed that future research should involve
superior, adequately followed up, large-sample, multicenter
randomized controlled trials to substantiate the findings of the
present study.
In summary, the present study discerned molecular
subtypes of LUAD via the detection of PRGs and established a
prognostic signature. Additionally, immune infiltration landscapes,
gene mutation status and drug predictions for different risk groups
were analyzed. The prognostic signature may be used to enhance the
clinical evaluation of patient prognosis and guide drug therapy
decisions.
Supplementary Material
Supporting Data
Supporting Data
Supporting Data
Acknowledgements
Not applicable.
Funding
Funding: No funding was received.
Availability of data and materials
The data generated in the present study may be
requested from the corresponding author.
Authors' contributions
JX, CZ and BS conceived and designed the study. JX,
WZ, LD, SY, ST, LY, CF, XZ and ZH collected and analyzed the data.
JX, WZ, LD, SY and ST wrote the manuscript. CZ and BS contributed
materials. JX, CZ and BS confirm the authenticity of all the raw
data. All authors read and approved the final version of the
manuscript.
Ethics approval and consent to
participate
Not applicable.
Patient consent for publication
Not applicable.
Competing interests
The authors declare that they have no competing
interests.
Glossary
Abbreviations
Abbreviations:
|
LUAD
|
lung adenocarcinoma
|
|
PCD
|
programmed cell death
|
|
BDNF
|
brain-derived neurotrophic factor
|
|
ADRB2
|
adrenergic receptor b2
|
|
ANGPTL4
|
angiopoietin-like protein 4
|
|
CTLA4
|
cytotoxic T lymphocyte-associated
protein 4
|
|
GPER1
|
G protein-coupled estrogen receptor
1
|
|
LAMB3
|
laminin b3
|
|
MAP6
|
microtubule associated protein 6
|
|
PD-1
|
programmed cell death protein 1
|
|
PD-L1
|
programmed cell death ligand 1
|
|
ROC
|
receiver operating characteristic
|
References
|
1
|
Sung H, Ferlay J, Siegel RL, Laversanne M,
Soerjomataram I, Jemal A and Bray F: Global cancer statistics 2020:
GLOBOCAN Estimates of incidence and mortality worldwide for 36
cancers in 185 countries. CA Cancer J Clin. 71:209–249. 2021.
View Article : Google Scholar : PubMed/NCBI
|
|
2
|
Testa U, Castelli G and Pelosi E: Lung
cancers: Molecular characterization, clonal heterogeneity and
evolution, and cancer stem cells. Cancers (Basel). 10:2482018.
View Article : Google Scholar : PubMed/NCBI
|
|
3
|
Song J, Sun Y, Cao H, Xi L, Dong C, Yang R
and Shi Y: A novel pyroptosis-related lncRNA signature for
prognostic prediction in patients with lung adenocarcinoma.
Bioengineered. 12:5932–5949. 2021. View Article : Google Scholar : PubMed/NCBI
|
|
4
|
Al-Dherasi A, Huang QT, Liao Y, Al-Mosaib
S, Hua R, Wang Y, Yu Y, Zhang Y, Zhang X, Huang C, et al: A
seven-gene prognostic signature predicts overall survival of
patients with lung adenocarcinoma (LUAD). Cancer Cell Int.
21:2942021. View Article : Google Scholar : PubMed/NCBI
|
|
5
|
Miller KD, Siegel RL, Lin CC, Mariotto AB,
Kramer JL, Rowland JH, Stein KD, Alteri R and Jemal A: Cancer
treatment and survivorship statistics, 2016. CA Cancer J Clin.
66:271–289. 2016. View Article : Google Scholar : PubMed/NCBI
|
|
6
|
Liu J, Hong M, Li Y, Chen D, Wu Y and Hu
Y: Programmed cell death tunes tumor immunity. Front Immunol.
13:8473452022. View Article : Google Scholar : PubMed/NCBI
|
|
7
|
Wang S, Wang R, Hu D, Zhang C, Cao P and
Huang J: Machine learning reveals diverse cell death patterns in
lung adenocarcinoma prognosis and therapy. NPJ Precis Oncol.
8:492024. View Article : Google Scholar : PubMed/NCBI
|
|
8
|
Liu T, Zhu C, Chen X, Guan G, Zou C, Shen
S, Wu J, Wang Y, Lin Z, Chen L, et al: Ferroptosis, as the most
enriched programmed cell death process in glioma, induces
immunosuppression and immunotherapy resistance. Neuro Oncol.
24:1113–1125. 2022. View Article : Google Scholar : PubMed/NCBI
|
|
9
|
Singh P and Lim B: Targeting apoptosis in
cancer. Curr Oncol Rep. 24:273–284. 2022. View Article : Google Scholar : PubMed/NCBI
|
|
10
|
Qin Y, Ashrafizadeh M, Mongiardini V,
Grimaldi B, Crea F, Rietdorf K, Győrffy B, Klionsky DJ, Ren J,
Zhang W and Zhang X: Autophagy and cancer drug resistance in
dialogue: Pre-clinical and clinical evidence. Cancer Lett.
570:2163072023. View Article : Google Scholar : PubMed/NCBI
|
|
11
|
Tong X, Tang R, Xiao M, Xu J, Wang W,
Zhang B, Liu J, Yu X and Shi S: Targeting cell death pathways for
cancer therapy: Recent developments in necroptosis, pyroptosis,
ferroptosis, and cuproptosis research. J Hematol Oncol. 15:1742022.
View Article : Google Scholar : PubMed/NCBI
|
|
12
|
Ma X, Xiao L, Liu L, Ye L, Su P, Bi E,
Wang Q, Yang M, Qian J and Yi Q: CD36-mediated ferroptosis dampens
intratumoral CD8(+) T cell effector function and impairs their
antitumor ability. Cell Metab. 33:1001–1012.e1005. 2021. View Article : Google Scholar : PubMed/NCBI
|
|
13
|
Zhang C, Xia J, Liu X, Li Z, Gao T, Zhou T
and Hu K: Identifying prognostic genes related PANoptosis in lung
adenocarcinoma and developing prediction model based on
bioinformatics analysis. Sci Rep. 13:179562023. View Article : Google Scholar : PubMed/NCBI
|
|
14
|
Xu K, Zhang Y, Yan Z, Wang Y, Li Y, Qiu Q,
Du Y, Chen Z and Liu X: Identification of disulfidptosis related
subtypes, characterization of tumor microenvironment infiltration,
and development of DRG prognostic prediction model in RCC, in which
MSH3 is a key gene during disulfidptosis. Front Immunol.
14:12052502023. View Article : Google Scholar : PubMed/NCBI
|
|
15
|
Tian Q, Zhou Y, Zhu L, Gao H and Yang J:
Development and validation of a ferroptosis-related gene signature
for overall survival prediction in lung adenocarcinoma. Front Cell
Dev Biol. 9:6842592021. View Article : Google Scholar : PubMed/NCBI
|
|
16
|
Liang JY, Wang DS, Lin HC, Chen XX, Yang
H, Zheng Y and Li YH: A novel ferroptosis-related gene signature
for overall survival prediction in patients with hepatocellular
carcinoma. Int J Biol Sci. 16:2430–2441. 2020. View Article : Google Scholar : PubMed/NCBI
|
|
17
|
Wei J, Zeng Y, Gao X and Liu T: A novel
ferroptosis-related lncRNA signature for prognosis prediction in
gastric cancer. BMC Cancer. 21:12212021. View Article : Google Scholar : PubMed/NCBI
|
|
18
|
Ricci A, Salvucci C, Castelli S, Carraturo
A, de Vitis C and D'Ascanio M: Adenocarcinomas of the lung and
neurotrophin system: A review. Biomedicines. 10:25312022.
View Article : Google Scholar : PubMed/NCBI
|
|
19
|
Zhang SY, Hui LP, Li CY, Gao J, Cui ZS and
Qiu XS: More expression of BDNF associates with lung squamous cell
carcinoma and is critical to the proliferation and invasion of lung
cancer cells. BMC Cancer. 16:1712016. View Article : Google Scholar : PubMed/NCBI
|
|
20
|
Zhang ZX, Yong Y, Tan WC, Shen L, Ng HS
and Fong KY: Prognostic factors for mortality due to pneumonia
among adults from different age groups in Singapore and mortality
predictions based on PSI and CURB-65. Singapore Med J. 59:190–198.
2018. View Article : Google Scholar : PubMed/NCBI
|
|
21
|
Sinkevicius KW, Kriegel C, Bellaria KJ,
Lee J, Lau AN, Leeman KT, Zhou P, Beede AM, Fillmore CM, Caswell D,
et al: Neurotrophin receptor TrkB promotes lung adenocarcinoma
metastasis. Proc Natl Acad Sci USA. 111:10299–10304. 2014.
View Article : Google Scholar : PubMed/NCBI
|
|
22
|
Yu Q, Wang Y, Yi G, Yang W, Chen K, Tan X,
Zhang X, Xu Z, Yang Z and Peng Y: BDNF is a prognostic biomarker
involved in immune infiltration of lung adenocarcinoma and is
associated with brain metastasis. Immunology. 168:320–330. 2023.
View Article : Google Scholar : PubMed/NCBI
|
|
23
|
Bergman PJ: Cancer immunotherapy. Vet Clin
North Am Small Anim Pract. 54:441–468. 2024. View Article : Google Scholar : PubMed/NCBI
|
|
24
|
Lee ES, Son DS, Kim SH, Lee J, Jo J, Han
J, Kim H, Lee HJ, Choi HY, Jung Y, et al: Prediction of
recurrence-free survival in postoperative non-small cell lung
cancer patients by using an integrated model of clinical
information and gene expression. Clin Cancer Res. 14:7397–7404.
2008. View Article : Google Scholar : PubMed/NCBI
|
|
25
|
Zhou X, Xiao B, Jiang M and Rui J:
Pan-cancer analysis identifies EMC6 as a potential target for lung
adenocarcinoma. iScience. 27:1086482023. View Article : Google Scholar : PubMed/NCBI
|
|
26
|
Rousseaux S, Debernardi A, Jacquiau B,
Vitte AL, Vesin A, Nagy-Mignotte H, Moro-Sibilot D, Brichon PY,
Lantuejoul S, Hainaut P, et al: Ectopic activation of germline and
placental genes identifies aggressive metastasis-prone lung
cancers. Sci Transl Med. 5:186ra66. 2013. View Article : Google Scholar : PubMed/NCBI
|
|
27
|
Hight SK, Mootz A, Kollipara RK, McMillan
E, Yenerall P, Otaki Y, Li LS, Avila K, Peyton M, Rodriguez-Canales
J, et al: An in vivo functional genomics screen of nuclear
receptors and their co-regulators identifies FOXA1 as an essential
gene in lung tumorigenesis. Neoplasia. 22:294–310. 2020. View Article : Google Scholar : PubMed/NCBI
|
|
28
|
Langfelder P and Horvath S: WGCNA: An R
package for weighted correlation network analysis. BMC
Bioinformatics. 9:5592008. View Article : Google Scholar : PubMed/NCBI
|
|
29
|
Hu J, Zhang L, Xia H, Yan Y, Zhu X, Sun F,
Sun L, Li S, Li D, Wang J, et al: Tumor microenvironment remodeling
after neoadjuvant immunotherapy in non-small cell lung cancer
revealed by single-cell RNA sequencing. Genome Med. 15:142023.
View Article : Google Scholar : PubMed/NCBI
|
|
30
|
Trefny MP, Rothschild SI, Uhlenbrock F,
Rieder D, Kasenda B, Stanczak MA, Berner F, Kashyap AS, Kaiser M,
Herzig P, et al: A variant of a killer cell immunoglobulin-like
receptor is associated with resistance to PD-1 blockade in lung
cancer. Clin Cancer Res. 25:3026–3034. 2019. View Article : Google Scholar : PubMed/NCBI
|
|
31
|
Cho JW, Hong MH, Ha SJ, Kim YJ, Cho BC,
Lee I and Kim HR: Genome-wide identification of differentially
methylated promoters and enhancers associated with response to
anti-PD-1 therapy in non-small cell lung cancer. Exp Mol Med.
52:1550–1563. 2020. View Article : Google Scholar : PubMed/NCBI
|
|
32
|
Kim JY, Choi JK and Jung H: Genome-wide
methylation patterns predict clinical benefit of immunotherapy in
lung cancer. Clin Epigenetics. 12:1192020. View Article : Google Scholar : PubMed/NCBI
|
|
33
|
Malta TM, Sokolov A, Gentles AJ,
Burzykowski T, Poisson L, Weinstein JN, Kamińska B, Huelsken J,
Omberg L, Gevaert O, et al: Machine learning identifies stemness
features associated with oncogenic dedifferentiation. Cell.
173:338–354.e15. 2018. View Article : Google Scholar : PubMed/NCBI
|
|
34
|
Gao Y, Kim S, Lee YI and Lee J: Cellular
stress-modulating drugs can potentially be identified by in silico
screening with connectivity map (CMap). Int J Mol Sci. 20:56012019.
View Article : Google Scholar : PubMed/NCBI
|
|
35
|
Livak KJ and Schmittgen TD: Analysis of
relative gene expression data using real-time quantitative PCR and
the 2(−Delta Delta C(T)) method. Methods. 25:402–408. 2001.
View Article : Google Scholar : PubMed/NCBI
|
|
36
|
Mifflin L, Ofengeim D and Yuan J:
Receptor-interacting protein kinase 1 (RIPK1) as a therapeutic
target. Nat Rev Drug Discov. 19:553–571. 2020. View Article : Google Scholar : PubMed/NCBI
|
|
37
|
Wang X, Chen Z, Nie D, Zeng X, Zhong M,
Liu X, Zhong S, Wang L, Liao Z, Chen C, et al: CASP1 is a target
for combination therapy in pancreatic cancer. Eur J Pharmacol.
961:1761752023. View Article : Google Scholar : PubMed/NCBI
|
|
38
|
Hattori T, Fundora KA, Hamamoto K, Opozda
DM, Liang X, Liu X, Zhang J, Uzun Y, Takahashi Y and Wang HG: ER
stress elicits non-canonical CASP8 (caspase 8) activation on
autophagosomal membranes to induce apoptosis. Autophagy.
20:349–364. 2024. View Article : Google Scholar : PubMed/NCBI
|
|
39
|
Hu J, Pan D, Li G, Chen K and Hu X:
Regulation of programmed cell death by Brd4. Cell Death Dis.
13:10592022. View Article : Google Scholar : PubMed/NCBI
|
|
40
|
Hsu SK, Li CY, Lin IL, Syue WJ, Chen YF,
Cheng KC, Teng YN, Lin YH, Yen CH and Chiu CC: Inflammation-related
pyroptosis, a novel programmed cell death pathway, and its
crosstalk with immune therapy in cancer treatment. Theranostics.
11:8813–8835. 2021. View Article : Google Scholar : PubMed/NCBI
|
|
41
|
Hsu SK, Chang WT, Lin IL, Chen YF,
Padalwar NB, Cheng KC, Teng YN, Wang CH and Chiu CC: The role of
necroptosis in ROS-mediated cancer therapies and its promising
applications. Cancers (Basel). 12:21852020. View Article : Google Scholar : PubMed/NCBI
|
|
42
|
Khan M, Ai M, Du K, Song J, Wang B, Lin J,
Ren A, Chen C, Huang Z, Qiu W, et al: Pyroptosis relates to tumor
microenvironment remodeling and prognosis: A pan-cancer
perspective. Front Immunol. 13:10622252022. View Article : Google Scholar : PubMed/NCBI
|
|
43
|
Pan S, Meng H, Fan T, Hao B, Song C, Li D,
Li N and Geng Q: Comprehensive analysis of programmed cell death
signature in the prognosis, tumor microenvironment and drug
sensitivity in lung adenocarcinoma. Front Genet. 13:9001592022.
View Article : Google Scholar : PubMed/NCBI
|
|
44
|
Yang S, Ji J, Wang M, Nie J and Wang S:
Construction of ovarian cancer prognostic model based on the
investigation of ferroptosis-related lncRNA. Biomolecules.
13:3062023. View Article : Google Scholar : PubMed/NCBI
|
|
45
|
Chen H, Luo H, Wang J, Li J and Jiang Y:
Identification of a pyroptosis-related prognostic signature in
breast cancer. BMC Cancer. 22:4292022. View Article : Google Scholar : PubMed/NCBI
|
|
46
|
Chen Y, Huang W, Ouyang J, Wang J and Xie
Z: Identification of anoikis-related subgroups and prognosis model
in liver hepatocellular carcinoma. Int J Mol Sci. 24:28622023.
View Article : Google Scholar : PubMed/NCBI
|
|
47
|
Malekan M, Nezamabadi SS, Samami E,
Mohebalizadeh M, Saghazadeh A and Rezaei N: BDNF and its signaling
in cancer. J Cancer Res Clin Oncol. 149:2621–2636. 2023. View Article : Google Scholar : PubMed/NCBI
|
|
48
|
Yeo IJ, Yu JE, Kim SH, Kim DH, Jo M, Son
DJ, Yun J, Han SB and Hong JT: TNF receptor 2 knockout mouse had
reduced lung cancer growth and schizophrenia-like behavior through
a decrease in TrkB-dependent BDNF level. Arch Pharm Res.
47:341–359. 2024. View Article : Google Scholar : PubMed/NCBI
|
|
49
|
Goto T, Saligan LN, Li X, Xiang L, Kwiat
C, Nguyen C, Crouch A and Von Ah D: Associations of brain-derived
neurotrophic factor rs6265 polymorphism and cognitive function in
breast cancer survivors from a cross-sectional study. Cancer Med.
13:e69752024. View Article : Google Scholar : PubMed/NCBI
|
|
50
|
Liu YN, Chen WY, Liu MK, Yeh HL, Chen WH,
Jiang KC, Li HR, Chen ZQ, Wang WH, Abou-Kheir W and Wen YC:
Immunosuppressive role of BDNF in therapy-induced neuroendocrine
prostate cancer. Mol Oncol. 18:1665–1686. 2024. View Article : Google Scholar : PubMed/NCBI
|
|
51
|
Večurkovská I, Mašlanková J, Tomečková V,
Kaťuchová J, Kisková T, Fröhlichová L, Mareková M and Stupák M:
Stage-dependent levels of brain-derived neurotrophic factor and
matrix metalloproteinase 9 in the prognosis of colorectal cancer.
Biomedicines. 11:18392023. View Article : Google Scholar : PubMed/NCBI
|
|
52
|
Tian J, Cheng H, Wang N and Wang C: SLERT,
as a novel biomarker, orchestrates endometrial cancer metastasis
via regulation of BDNF/TRKB signaling. World J Surg Oncol.
21:272023. View Article : Google Scholar : PubMed/NCBI
|
|
53
|
Park JE, Kim SE, Keam B, Park HR, Kim S,
Kim M and Heo DS, Doh J, Kim DW and Heo DS: Anti-tumor effects of
NK cells and anti-PD-L1 antibody with antibody-dependent cellular
cytotoxicity in PD-L1-positive cancer cell lines. J Immunother
Cancer. 8:2020. View Article : Google Scholar
|
|
54
|
Li X, Sun Z, Peng G, Xiao Y, Guo J, Wu B,
Li X, Zhou W, Li J, Li J, Ba C, et al: Single-cell RNA sequencing
reveals a pro-invasive cancer-associated fibroblast subgroup
associated with poor clinical outcomes in patients with gastric
cancer. Theranostics. 12:620–638. 2022. View Article : Google Scholar : PubMed/NCBI
|
|
55
|
Zhang W, Edwards A, Flemington EK and
Zhang K: Significant Prognostic Features and Patterns of Somatic
TP53 Mutations in Human Cancers. Cancer Inform.
16:11769351176912672017. View Article : Google Scholar : PubMed/NCBI
|
|
56
|
Ruiz-Cordero R, Ma J, Khanna A, Lyons G,
Rinsurongkawong W, Bassett W, Guo M, Routbort MJ, Zhang J,
Skoulidis F, et al: Simplified molecular classification of lung
adenocarcinomas based on EGFR, KRAS, and TP53 mutations. BMC
Cancer. 20:832020. View Article : Google Scholar : PubMed/NCBI
|
|
57
|
Green DR, Ferguson T, Zitvogel L and
Kroemer G: Immunogenic and tolerogenic cell death. Nat Rev Immunol.
9:353–363. 2009. View Article : Google Scholar : PubMed/NCBI
|
|
58
|
Yatim N, Jusforgues-Saklani H, Orozco S,
Schulz O, Barreira da Silva R, Reis e Sousa C, Green DR, Oberst DR
and Albert V: RIPK1 and NF-κB signaling in dying cells determines
cross-priming of CD8+ T cells. Science. 350:328–334. 2015.
View Article : Google Scholar : PubMed/NCBI
|
|
59
|
Pardanani A, Harrison C, Cortes JE,
Cervantes F, Mesa RA, Milligan D, Masszi T, Mishchenko E, Jourdan
E, Vannucchi AM, et al: Safety and efficacy of fedratinib in
patients with primary or secondary myelofibrosis: A randomized
clinical trial. JAMA Oncol. 1:643–651. 2015. View Article : Google Scholar : PubMed/NCBI
|
|
60
|
Chen D, Zhang F, Wang J, He H, Duan S, Zhu
R, Chen C, Yin L and Chen Y: Biodegradable nanoparticles mediated
co-delivery of erlotinib (ELTN) and fedratinib (FDTN) toward the
treatment of ELTN-resistant non-small cell lung cancer (NSCLC) via
suppression of the JAK2/STAT3 signaling pathway. Front Pharmacol.
9:12142018. View Article : Google Scholar : PubMed/NCBI
|
|
61
|
Currow D, Temel JS, Abernethy A,
Milanowski J, Friend J and Fearon KC: ROMANA 3: A phase 3 safety
extension study of anamorelin in advanced non-small-cell lung
cancer (NSCLC) patients with cachexia. Ann Oncol. 28:1949–1956.
2017. View Article : Google Scholar : PubMed/NCBI
|
|
62
|
Zinnah KMA, Seol JW and Park SY:
Inhibition of autophagy flux by sertraline attenuates TRAIL
resistance in lung cancer via death receptor 5 upregulation. Int J
Mol Med. 46:795–805. 2020. View Article : Google Scholar : PubMed/NCBI
|
|
63
|
Liu J, Dong W, Wang T, Liu L, Zhan L, Shi
Y and Han J: Effects of etomidate and propofol on immune function
in patients with lung adenocarcinoma. Am J Transl Res. 8:5748–5755.
2016.PubMed/NCBI
|
|
64
|
Chu CN, Wu KC, Chung WS, Zheng LC, Juan
TK, Hsiao YT, Peng SF, Yang JL, Ma YS, Wu RS and Chung JG:
Etomidate suppresses invasion and migration of human A549 lung
adenocarcinoma cells. Anticancer Res. 39:215–223. 2019. View Article : Google Scholar : PubMed/NCBI
|