Introduction
The most prevalent cancer among women is breast
cancer (1–3), which can be classified into different
subtypes based on the expression of specific marker genes,
including Luminal A, Luminal B, basal-like [triple-negative breast
cancer (TNBC)], human epidermal growth factor receptor 2 (HER2)
positive and normal-like breast cancer (4–6).
Certain patients with breast cancer, particularly those with the
TNBC subtype, often experience a poor prognosis due to metastasis
progression despite receiving advanced treatment strategies such as
surgery, endocrine therapy, radiotherapy and chemotherapy (7,8).
Therefore, it is imperative to identify novel biomarkers for use in
the field of breast cancer prognosis, facilitating early detection
and treatment.
The secreted protein acidic and cysteine-rich like 1
(SPARCL1) is an extracellular matrix glycoprotein that has been
implicated in the pathological mechanisms of several diseases,
including cancer (9–12). However, the significance of SPARCL1
in relation to breast cancer has been insufficiently researched.
The mRNA level of SPARCL1 in human breast cancer tissue has been
reported in sporadic research to be differentially expressed
(13,14). In this research, nearly all normal
breast tissue immunohistochemistry (IHC) samples exhibited a
positive signal for SPARCL1, whereas only ~50% of the breast cancer
samples demonstrated a positive signal. The observed phenotype
alteration suggests a potential association between the
downregulation of SPARCL1 and the initiation and progression of
breast cancer (15,16). However, further comprehensive
investigations are warranted to ascertain whether SPARCL1 holds
promise as a novel biomarker for breast cancer. Therefore, the aim
of the present study was to systematically evaluate the prognostic
significance of SPARCL1 in relation to breast cancer.
Materials and methods
The cancer genome atlas (TCGA)
TCGA (http://cancergenome.nih.gov/) database was used as a
primary resource for retrieving breast cancer mRNA expression data
and clinical information. The present study examined multi-omics
patient data, which have been systematically and categorically
organized in multiple databases based on the original TCGA
datasets. Subsequent databases [University of ALabama at Birmingham
CANcer data analysis Portal (UALCAN), Gene Expression Profiling
Interactive Analysis (GEPIA), Breast Cancer Gene-Expression Miner
(bc-GenExMiner) and OncoLnc] provided comprehensive and detailed
information pertaining to each aspects. This encompassed the
expression profiles of SPARCL1 at both gene and protein levels in
breast cancer, distinct expression patterns across various subtypes
of breast cancer, and the association between SPARCL1 and patient
survival outcomes, respectively. The number of patients recorded in
each database has been specifically utilized for various
analyses.
Gene expression data processing
Firstly, the UALCAN (https://ualcan.path.uab.edu/) (17,18)
database was used to analyze SPARCL1 mRNA expression levels in
pan-cancer and subsequently assess its mRNA expression in breast
cancer (primary tumor, n=1,097; normal, n=114). Subsequently,
comparative protein expression of SPARCL1 in normal and tumor
samples were assessed using the Clinical Proteomic Tumor Analysis
Consortium sub-database of UALCAN (https://ualcan.path.uab.edu/analysis-prot.html)
(18,19) (primary tumor, n=125; normal, n=18).
Additionally, GEPIA 2 (http://gepia2.cancer-pku.cn/#general) (20) was used to evaluate SPARCL1
expression in TCGA tumors by matching TCGA normal and
Genotype-Tissue Expression (GTEx) project data for breast cancer
(tumor, n=1,085; normal, n=291).
Breast cancer clinical pathological
parameters
bc-GenExMiner v5.0 (https://bcgenex.ico.unicancer.fr/BC-GEM/GEM-Accueil.php?js=1)
(21,22) was used for statistical analysis of
SPARCL1 gene expression and its association with
clinicopathological features in patients with breast cancer.
RNA-sequencing data was specifically focused on and the expression
profile characteristics of SPARCL1 in different subpopulations of
breast cancer were assessed based on pathological parameters such
as receptor status, TNBC subtypes and TNBC/basal-like
classification (23).
Survival prognosis analysis
The OncoLnc tool (http://www.oncolnc.org/) was used for the analysis of
the association between SPARCL1 expression and prognosis in
patients with breast cancer. Additionally, the Kaplan-Meier Plotter
database (https://kmplot.com/analysis/index.php?p=service)
(24) was used to assess the
results obtained from the OncoLnc tool through survival data
analysis. Furthermore, GEPIA 2 was used to perform SPARCL1 survival
analysis specifically in TNBC.
Immune infiltration of SPARCL1 in
breast cancer
The Tumor Immune Estimation Resource (TIMER)
(http://timer.cistrome.org/) (25) is an integrated tool designed for the
systematic evaluation of immune infiltration in several cancer
types by analyzing gene and protein expression. In the present
study, the differential expression of SPARCL1 between breast
invasive carcinoma and adjacent normal tissues was assessed.
IHC
The present study analyzed paraffin-embedded breast
cancer samples obtained from patients at the Affiliated Hospital of
Jiangsu University (Zhenjiang China). The samples were collected
from patients aged between 20 and 45 years, who were randomly
selected in September 2021 and were diagnosed with malignant breast
cancer. A total of three breast cancer tissue sections and adjacent
normal breast tissue sections from three patients were randomly
selected for SPARCL1 immunohistochemical staining. The construction
of the tissue chip was performed using a tissue arrayer
[identification number F1001101); Zhongke Guanghua (Xi'an)
Intelligent Biological Technology Co., Ltd.] on paraffin-embedded
tissue blocks, according to the manufacturer's protocol. Goat
anti-human MAST9 (SPARCL1) polyclonal antibodies (cat. no. AF2728;
R&D Systems, Inc.) was used at a dilution of 1:100. PBS was
used as a negative control to facilitate comparative analysis in
subsequent studies. The intensity of protein expression was
indicated by brown staining.
The DAB Detection Kit (Polymer) [cat. no. GK600705;
Gene Technology (Shanghai) Co., Ltd.] was used for IHC. The
sections (10 µm) underwent IHC as follows: Tissue sections were
removed from the −80°C freezer and baked in a 37°C oven for 1 h.
Subsequently, the sections were immersed in pre-prepared PBS buffer
(pH 7.2-7.4; composition: NaCl 37 mmol/l, KCl 2.7 mmol/l,
Na2HPO4 4.3 mmol/l,
KH2PO4 1.4 mmol/l) for 15 min. Excess liquid
was carefully drained from the sections without allowing them to
dry, and the tissue areas were circumscribed using a histochemical
pen, followed by antigen retrieval using Proteinase K (cat. no.
ab64220; Abcam) at room temperature for 30 min. A drop of
H2O2 blocker was applied to the tissues,
which were then incubated at room temperature for 30 min. The
excess liquid was removed and the sections were washed three times
with PBS (5 min each). Prior to adding the primary antibody (1:200)
diluted with antibody diluent solution [cat. no. GT100910; Gene
Technology (Shanghai) Co., Ltd.], the sections were dried and
placed in a humidified chamber at 4°C overnight. The next day, the
sections were warmed up and rinsed with PBS three times (5 min
each) before applying secondary antibody (1:500) diluted with
antibody diluent solution at room temperature for 30 min. The
sections were rinsed again three times with PBS (5 min each) before
adding DAB (1:25) to observe the color development of tissues,
followed by rinsing under running water. Finally, the tissue
sections were briefly immersed in ethanol hydrochloric acid
solution and rinsed under running water; the tissue sections were
then sequentially soaked in increasing concentrations of ethanol
(70, 80 and 95%) and anhydrous ethanol, air-dried, and
consecutively immersed in xylene I and II for 8 min each prior to
sealing the sections, complete air drying and examining the
experimental results under a fluorescence microscope in
bright-field observation (Leica Microsystems, Inc.).
Cell culture conditions
The MCF7, BT-549 and MDA-MB-468 cell lines were
obtained from the National Collection of Authenticated Cell
Cultures of the Chinese Academy of Sciences. The cells were
cultured under the following conditions: MCF7 cells were cultured
in MEM (cat. no. 11095080; Gibco; Thermo Fisher Scientific, Inc.)
supplemented with 89% high-quality fetal bovine serum (Gibco;
Thermo Fisher Scientific, Inc.), 10% non-essential amino acid
solution (cat. no. 11140050; Gibco; Thermo Fisher Scientific, Inc.)
and human recombinant insulin (cat. no. 91077C-1G; Sigma-Aldrich
KGaA) at a final concentration of 0.01 mg/ml. BT-549 cells were
cultured in RPMI 1640 medium (cat. no. 11875093; Gibco; Thermo
Fisher Scientific, Inc.) supplemented with 0.01 mg/ml insulin and
90% high-quality fetal bovine serum. MDA-MB-468 cells were cultured
in L-15 medium (cat. no. 114-15064; Gibco; Thermo Fisher
Scientific, Inc.) supplemented with 10% high-quality fetal bovine
serum.
RNA extraction and reverse
transcription-quantitative (q)PCR
TRIzol™ reagent (Invitrogen™;
Thermo Fisher Scientific, Inc.) was used to isolate total RNA from
cultured cells following the manufacturer's protocol. The RNA was
reverse transcribed into cDNA using a PrimeScript™ RT
Reagent Kit (cat. no. RR0114A; Takara Biotechnology Co., Ltd.) in
accordance with the manufacturer's instructions. Briefly, the
samples were incubated at 30°C for 10 min, followed by 42°C for 30
min. Subsequently, the samples were exposed to a temperature of
95°C for 5 min and finally cooled at 4°C for another 10 min. qPCR
was performed using the LightCycler® 96 system (Roche
Diagnostics, Ltd.), following the manufacturer's instructions and
using the TB Green® Premix Ex Taq™ II kit
(cat. no. RR820A; Takara Biotechnology Co., Ltd.). Briefly, qPCR
was performed under the following conditions: Initial denaturation
at 95°C for 30 sec; followed by 45 cycles of denaturation at 95°C
for 10 sec and annealing/extension at 60°C for 30 sec; and final
melt curve at 95°C for 15 sec, annealing at 60°C for 1 min and a
final extension step at 95°C for another 15 sec. The primers used
for the detection of SPARCL1 mRNA were as follows: (sense)
5′-ACGGTAGCACCTGACAACAC-3′ and (antisense)
5′-ATGGTGGGAATCGTCTTCTGT-3′. For GAPDH, the primer sequences used
were as follows: (sense) 5′-ACAACTTTGGTATCGTGGAAGG-3′ and
(antisense) 5′-GCCATCACGCCACAGTTTC-3′. The expression levels of
SPARCL1 mRNA were normalized to the expression levels of GAPDH,
which served as an internal control. Gene transcript levels were
determined using the 2−ΔΔCq method (26). The SPARCL1 CDS (NM_001128310) for
overexpression experiments was synthesized by Sangon Biotech Co.,
Ltd. and subsequently cloned into the pcDNA3.1 plasmid (27). The plasmid (1 µg) was transfected
into BT-549 cells using Lipofectamine® 3000 Transfection
Reagent (cat. no. L3000001; Invitrogen; Thermo Fisher Scientific,
Inc.) in a 6-well plate containing 2×10⁶ cells/well. The
transfection procedure strictly adhered to the guidelines provided
in the product manual. As for the control group, an empty pcDNA3.1
plasmid (Sangon Biotech Co., Ltd.) was employed. After 6 h of
transfection, the cells were placed in complete culture medium and
further cultured for 24 and 48 h. Subsequently, RNA was extracted
at 0, 24 and 48 h after transfection, and reverse transcribed into
cDNA. Finally, the expression of corresponding genes was detected
by qPCR.
Analysis of co-expressed genes and
their molecular functions
The mutation module of cBioPortal (https://www.cbioportal.org/) was used to visualize
SPARCL1 mutations and changes in expression levels in breast
cancer. To identify co-expressed genes with SPARCL1, Pearson's
correlation coefficient analysis was performed using multiomics
data from 32 distinct cancer types using the LinkedOmics database
(https://www.linkedomics.org/login.php) (28). Enrichment analyses based on the top
50 genes related to SPARCL1 were performed using the Database for
Annotation, Visualization, and Integrated Discovery (DAVID;
http://david.ncifcrf.gov/) with its
sub-databases Gene Ontology (GO) and Kyoto Encyclopedia of Genes
and Genomes (KEGG). The resulting enrichment outcomes were then
visualized for bioinformatics analyses using WPS Office 2023
version: 12.1.0.18608 (https://www.wps.cn/).
Receiver operating characteristic
(ROC) curve and Cox regression analysis
The application value of SPARCL1 in breast cancer
diagnosis was assessed using the ROC curve analysis. The dataset
utilized in this study was obtained from the Breast Invasive
Carcinoma (TCGA, PanCancer Atlas) dataset available on the
cBioportal database. The ROC Curve module in GraphPad 8.0.1
software (Dotmatics) was employed for analysis and calculation of
the area under the curve (AUC). After integrating clinical data and
SPARCL1 gene expression from the Breast Invasive Carcinoma (TCGA,
PanCancer Atlas) dataset, multivariate and univariate analyses were
performed using R version 4.4.2. (https://cran.r-project.org/bin/windows/base/) Specific
software packages, including survival package (https://cran.r-project.org/web/packages/survival/index.html)
and survminer package (https://github.com/kassambara/survminer), were
utilized in the analysis.
Statistical analysis
Statistical analyses were performed using GraphPad
Prism 9.0 software. Kaplan-Meier analysis was used to compare the
survival times of the SPARCL1 high and low expression groups,
whilst the P-value was determined using the log-rank test.
Additionally, survival curves were generated by using the GEPIA
database and OncoLnc web tool. The clinicopathological features of
breast cancer and the association between SPARCL1 and overall
survival (OS) were assessed using univariate Cox regression
analysis. The differences between two groups were compared using
unpaired Student's t-test. Differences between more than two groups
were compared using one-way ANOVA and Tukey's post hoc test.
P<0.05 was considered to indicate a statistically significant
difference.
Results
Expression of SPARCL1 in breast cancer
and its experimental validation in breast cancer tissue
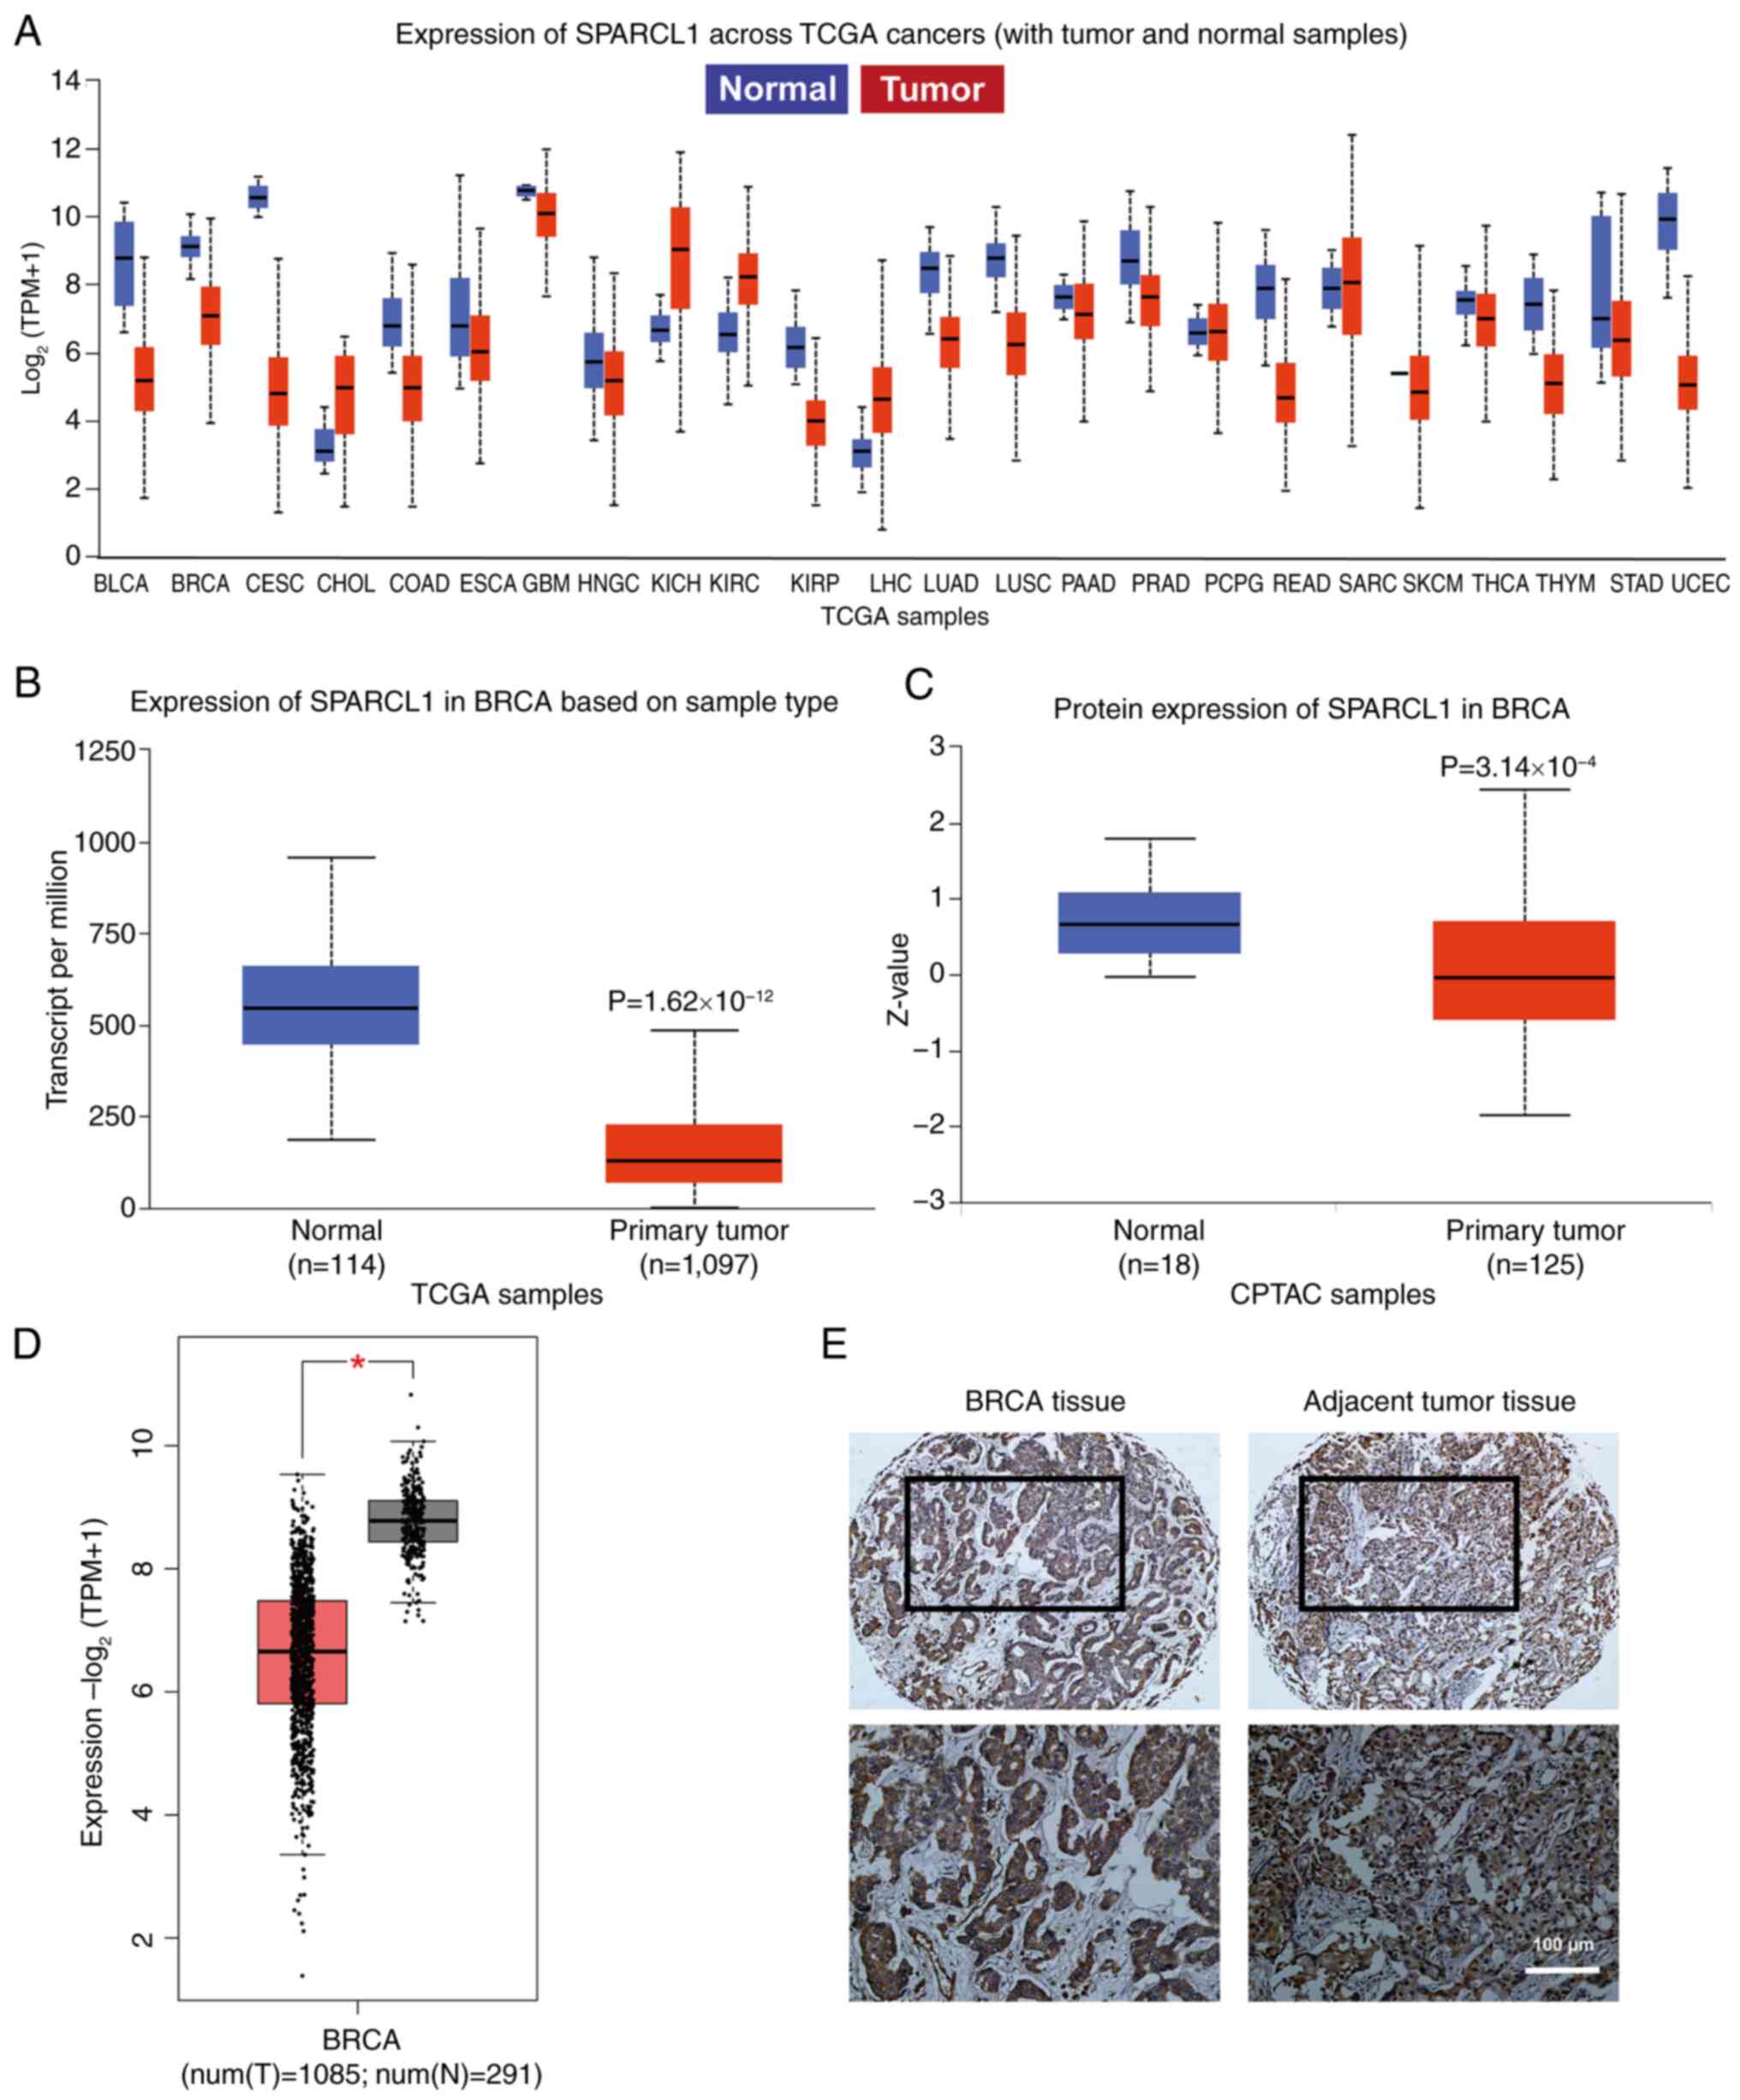
The UALCAN database was used to analyze the mRNA
expression level of SPARCL1 in all cancer tissues within the TCGA
database to identify any differential expression changes between
tumor and normal samples. The results demonstrated that the
expression level of SPARCL1 was markedly downregulated in a broad
range of tumor tissues, including breast cancer, with 20/24 tumors
showing overexpression (Fig. 1A).
The expression levels of both RNA and protein for SPARCL1 were also
revealed to be significantly lower in breast cancer samples
compared with normal samples (Fig. 1B
and C). Subsequently, a comparative analysis of the TCGA normal
and GTEx data was performed to elucidate the expression profile of
SPARCL1 in both tumor and normal tissues. The findings further
demonstrated that SPARCL1 exhibited significant downregulation
specifically in the tumor tissue, in comparison with that in normal
tissues (Fig. 1D). Additionally,
IHC was performed to confirm that SPARCL1 exhibited a notably lower
expression level in tumor tissue compared with that in the adjacent
normal tissue (Fig. 1E).
Downregulation of SPARCL1 is
associated with TNBC, as analyzed based on the clinical
pathological parameters
bc-GenExMiner v5.0 was used to assess the
association between SPARCL1 expression and clinical pathological
characteristics. The expression of SPARCL1 was positively
associated with ER and PR. The ER and PR positive group
demonstrated significantly higher levels of SPARCL1 compared with
the ER and PR negative group (P<0.0001; Fig. 2A and B). Conversely, the HER2
negative group demonstrated significantly higher levels of SPARCL1
compared with the HER2 positive group (P<0.0001; Fig. 2C). The expression of SPARCL1 was
also significantly downregulated in patients with breast cancer
with ER and PR double negative breast cancer compared with the
ER+/PR+, ER+/PR- and ER-/PR+ groups (P<0.0001; Fig. 2D). Furthermore, SPARCL1 expression
levels were revealed to be significantly downregulated in the
basal-like subtype compared with the non-basal-like subtype
(P<0.0001; Fig. 2E), as well as
in individuals with TNBC compared with those without TNBC
(P<0.0001; Fig. 2F).
Additionally, the TNBC and basal-like breast cancer group exhibited
significantly lower SPARCL1 expression levels than the non-TNBC and
non-basal-like group (Fig. 2G). The
expression of SPARCL1 was also demonstrated in breast cell lines,
namely MCF-7 (non-TNBC), BT-549 (TNBC) and MDA-MB 468 (TNBC), with
the RT-qPCR results validating the previous analyses performed
using big data (Fig. 2H).
Meanwhile, an overexpression assay was performed for the detection
of the growth phenotype change after SPARCL1 overexpression in
BT-549 cells (Figs. 2I and S1). The findings revealed that an
elevated expression of SPARCL1 exerted a suppressive effect on the
proliferation of BT-549 cells.
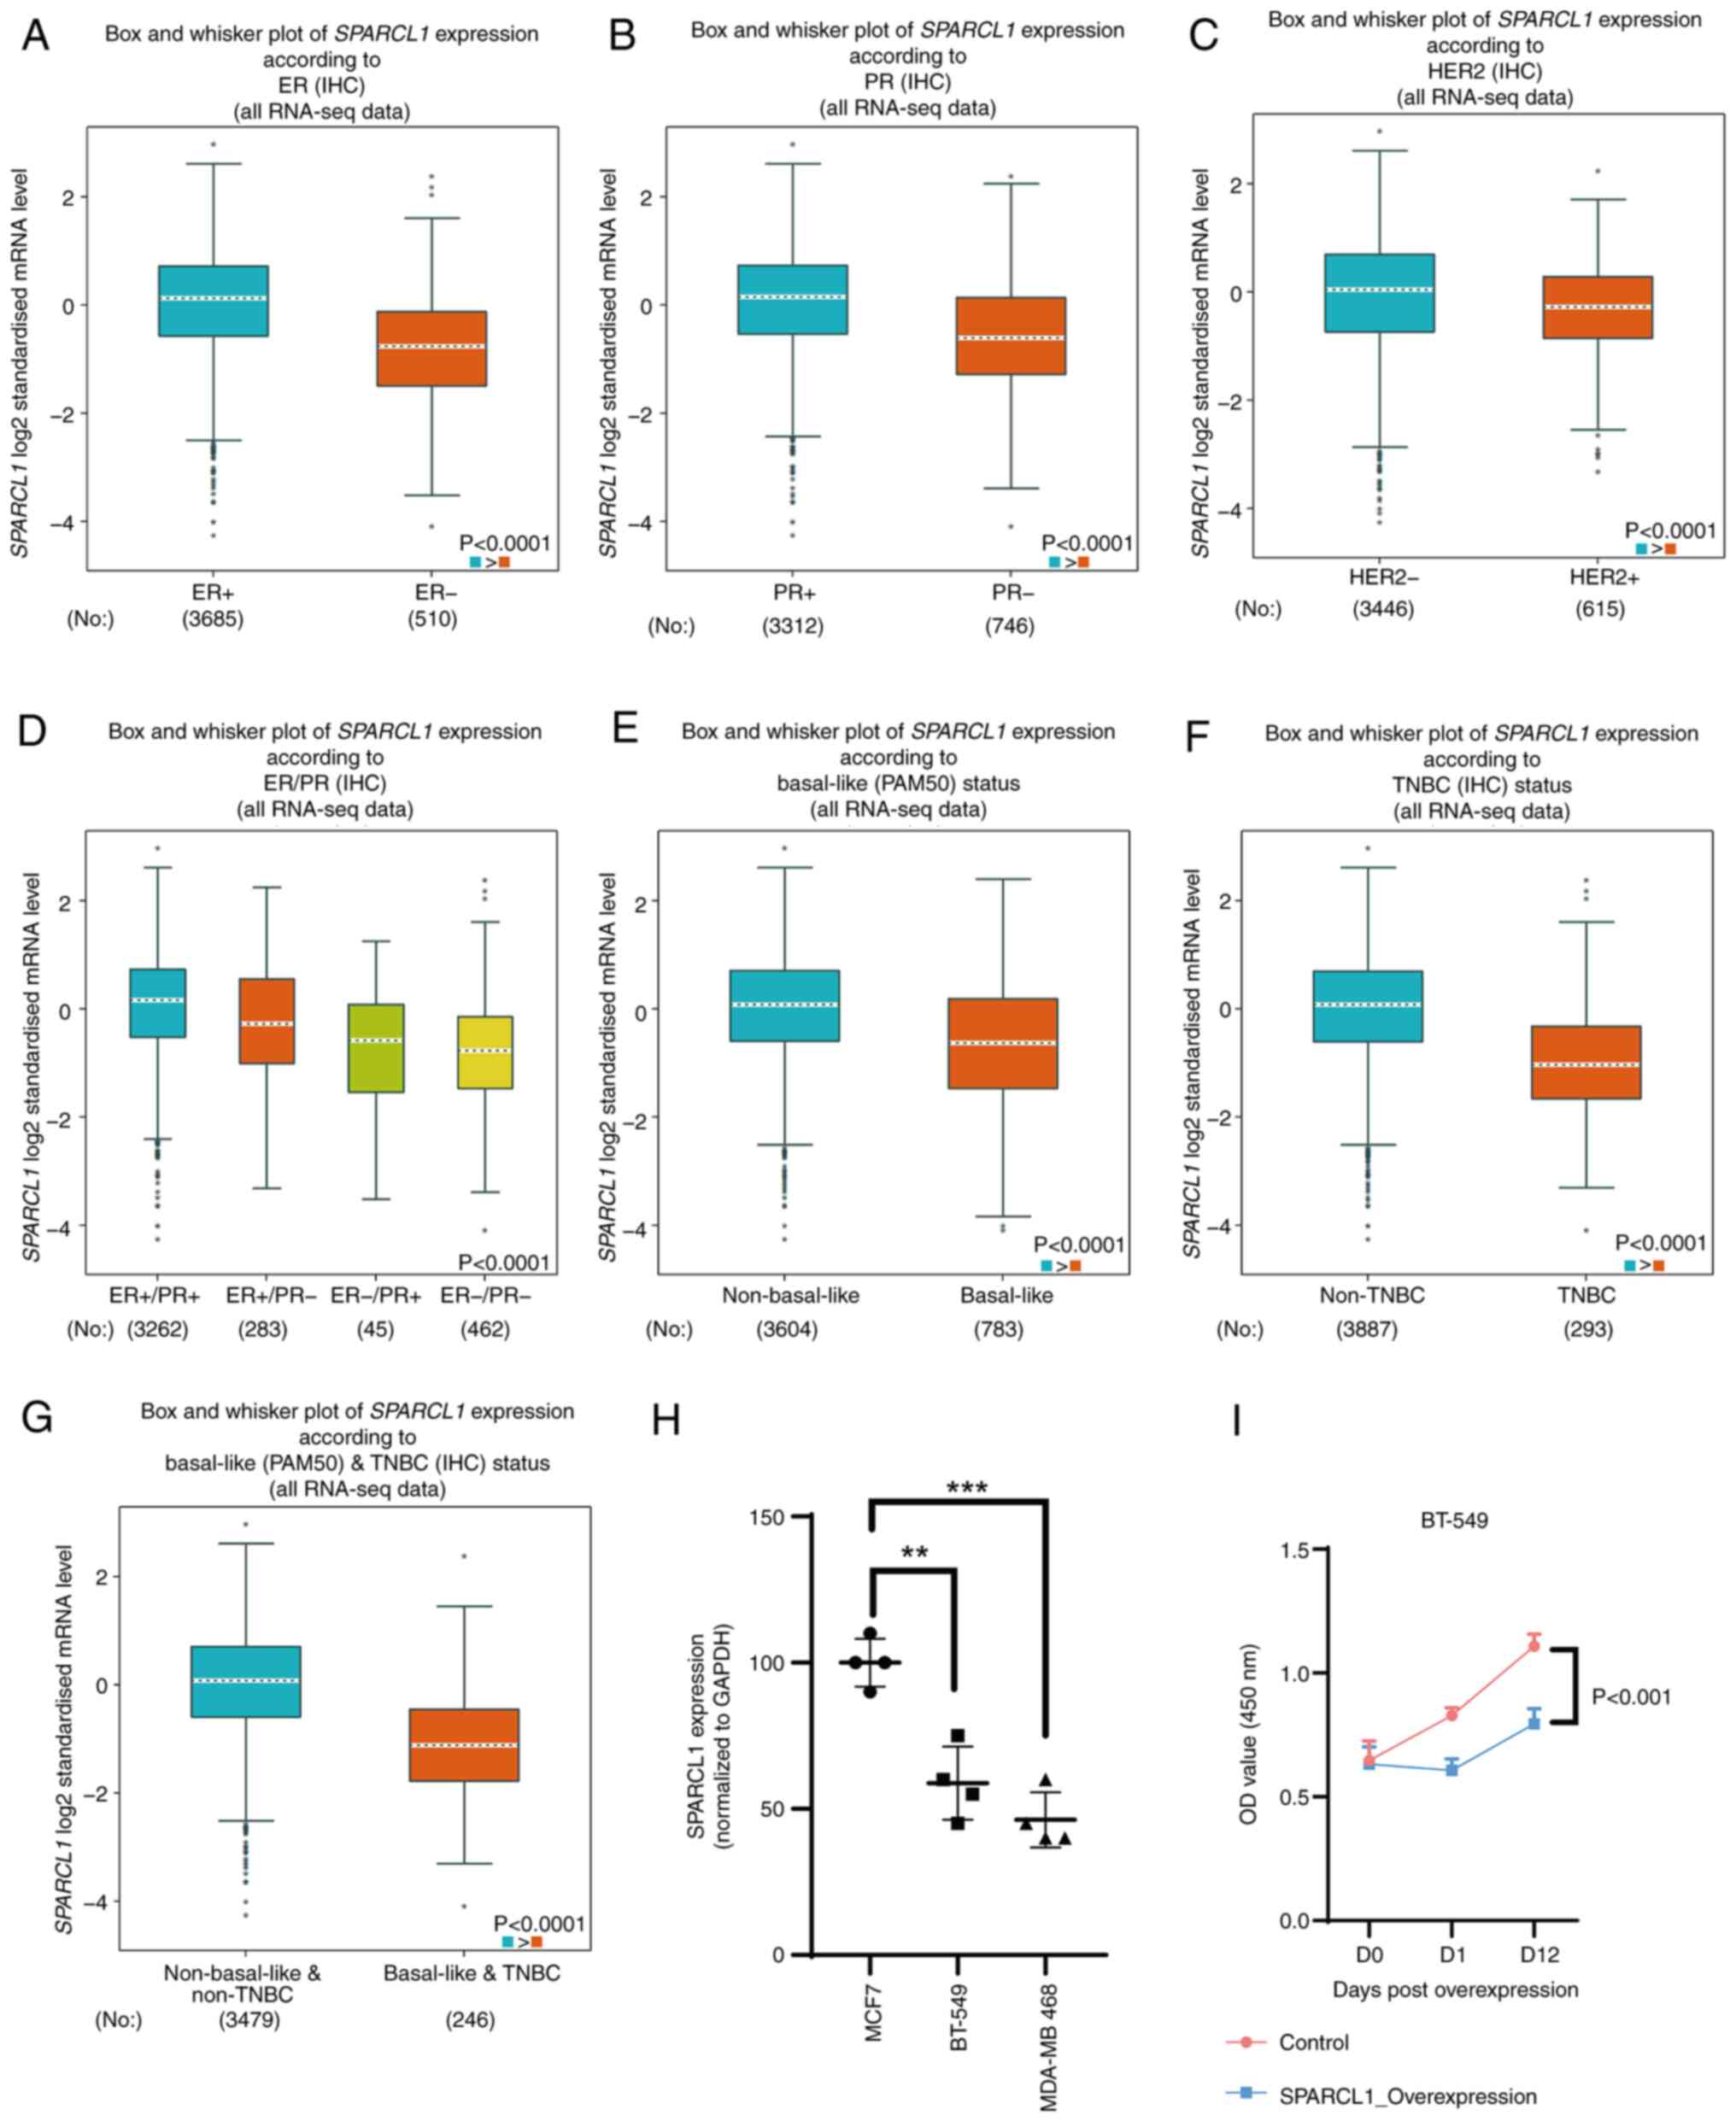 | Figure 2.Association between SPARCL1
expression and clinical pathological parameters. Using
bc-GenExMiner v5.0 software, box plots were generated to
demonstrate the associations between SPARCL1 expression and several
clinical and pathological markers: (A) ER, (B) PR, (C) HER2, (D)
ER/PR, (E) basal-like status, (F) TNBC status and (G)
basal-like/TNBC status. (H) Reverse transcription-quantitative PCR
was used to detect SPARCL1 expression in several breast cancer cell
lines. (I) Overexpression assay for detection of the growth
phenotype change after SPACLE1 overexpression in BT-549 cells.
*P<0.05; **P<0.01; ***P<0.001. SPARCL1, secreted protein
acidic and cysteine-rich like 1; ER, estrogen receptor; PR,
progesterone receptor; HER2, human epidermal growth factor receptor
2; TNBC, triple-negative breast cancer; IHC, immunohistochemistry;
RNA-seq, RNA-sequencing; OD, optical density. |
The aforementioned findings indicate a significant
association between diminished SPARCL1 expression and TNBC.
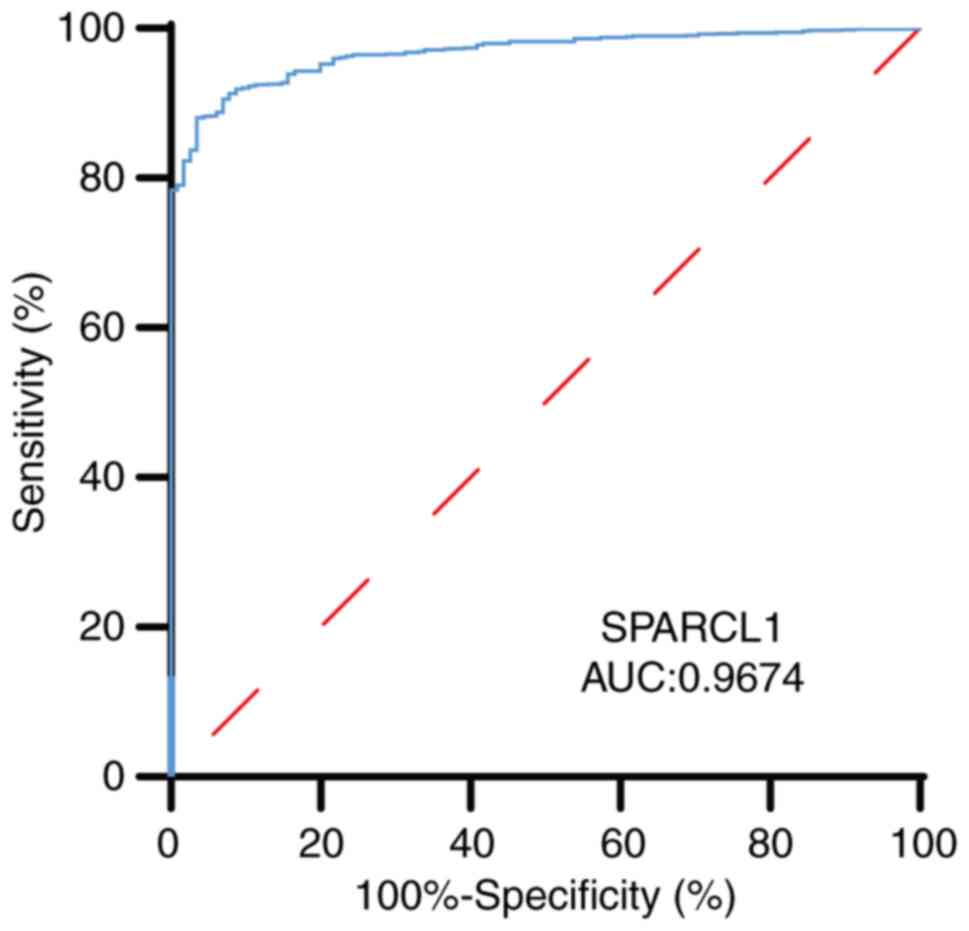
ROC curve and Cox regression analysis
indicate the crucial role of SPARCL1 in clinical prognosis
The viability of discriminating SPARCL1 expression
levels between normal and malignant breast tissues was evaluated
using a ROC curve. The test quality was quantified by the AUC,
which yielded a value of 0.9674 (Fig.
3).
Furthermore, univariate Cox regression analysis
revealed that a low level of SPARCL1 [hazard ratio (HR)=1.381;
P=0.0492], as well as tumor stage (American Joint Committee on
Cancer Tumor Stage Code; P=0.0492) (29,30),
node (N) stage (Neoplasm Disease Lymph Node Stage American Joint
Committee on Cancer Code; P=2.37×10⁻⁶) (29,30)
and metastasis (M) stage (American Joint Committee on Cancer
Metastasis Stage Code; P=0.00104) (29,30)
were significantly associated with the OS of patients with breast
cancer. The univariate analysis also indicated a significant
association between HER-2 positive status (P=0.0108) or Luminal A
positive status (P=0.00617) and decreased OS (Table I). Furthermore, the multiple Cox
regression analysis demonstrated that the expression level of
SPARCL1 was an independent prognostic factor (low vs. high;
HR=1.3997; P=0.0421) for patients with breast cancer after
adjusting for M and N stage statuses (Table II).
 | Table I.Univariate Cox analysis for overall
survival of patients with breast cancer. |
Table I.
Univariate Cox analysis for overall
survival of patients with breast cancer.
| Variable | HR (95% CI) | P-value |
|---|
| HER2 positive | 1.57
(1.11-2.23) | 0.0108a |
| Luminal B
positive | 1.39
(0.93-2.07) | 0.105 |
| Luminal A
positive | 0.63
(0.45-0.88) |
0.00617b |
| TNBC positive | 0.79
(0.50-1.24) | 0.297 |
| N stage (N0 vs.
N1-N2) | 0.43
(0.30-0.61) |
2.37×10⁻⁶c |
| T stage (T1-T2 vs.
T3-T4) | 0.61
(0.43-0.88) |
0.00822c |
| M stage (M0 vs.
M1) | 0.51
(0.35-0.76) |
0.00104c |
| SPARCL1 low
expression | 1.38
(1.00-1.91) | 0.0492a |
| Table II.Multivariate Cox analysis for overall
survival of patients with breast cancer. |
Table II.
Multivariate Cox analysis for overall
survival of patients with breast cancer.
| Variable | HR (95% CI) | P-value |
|---|
| N stage (N0 vs.
N1-N2) | 0.4736
(0.3296-0.6806) |
5.36×10⁻⁵a |
| T stage (T1-T2 vs.
T3-T4) | 0.7588
(0.5222-1.1024) |
1.48×10⁻¹ |
| M stage (M0 vs.
M1) | 0.6622
(0.4397-0.9971) | 0.0484b |
| SPARCL1 low
expression | 1.3997
(1.0121-1.9357) | 0.0421b |
These findings further indicate the significant
association between SPARCL1 expression and OS in patients with
breast cancer. Therefore, the expression value of SPARCL1 may serve
as a reliable predictor for prognosis in patients with breast
cancer.
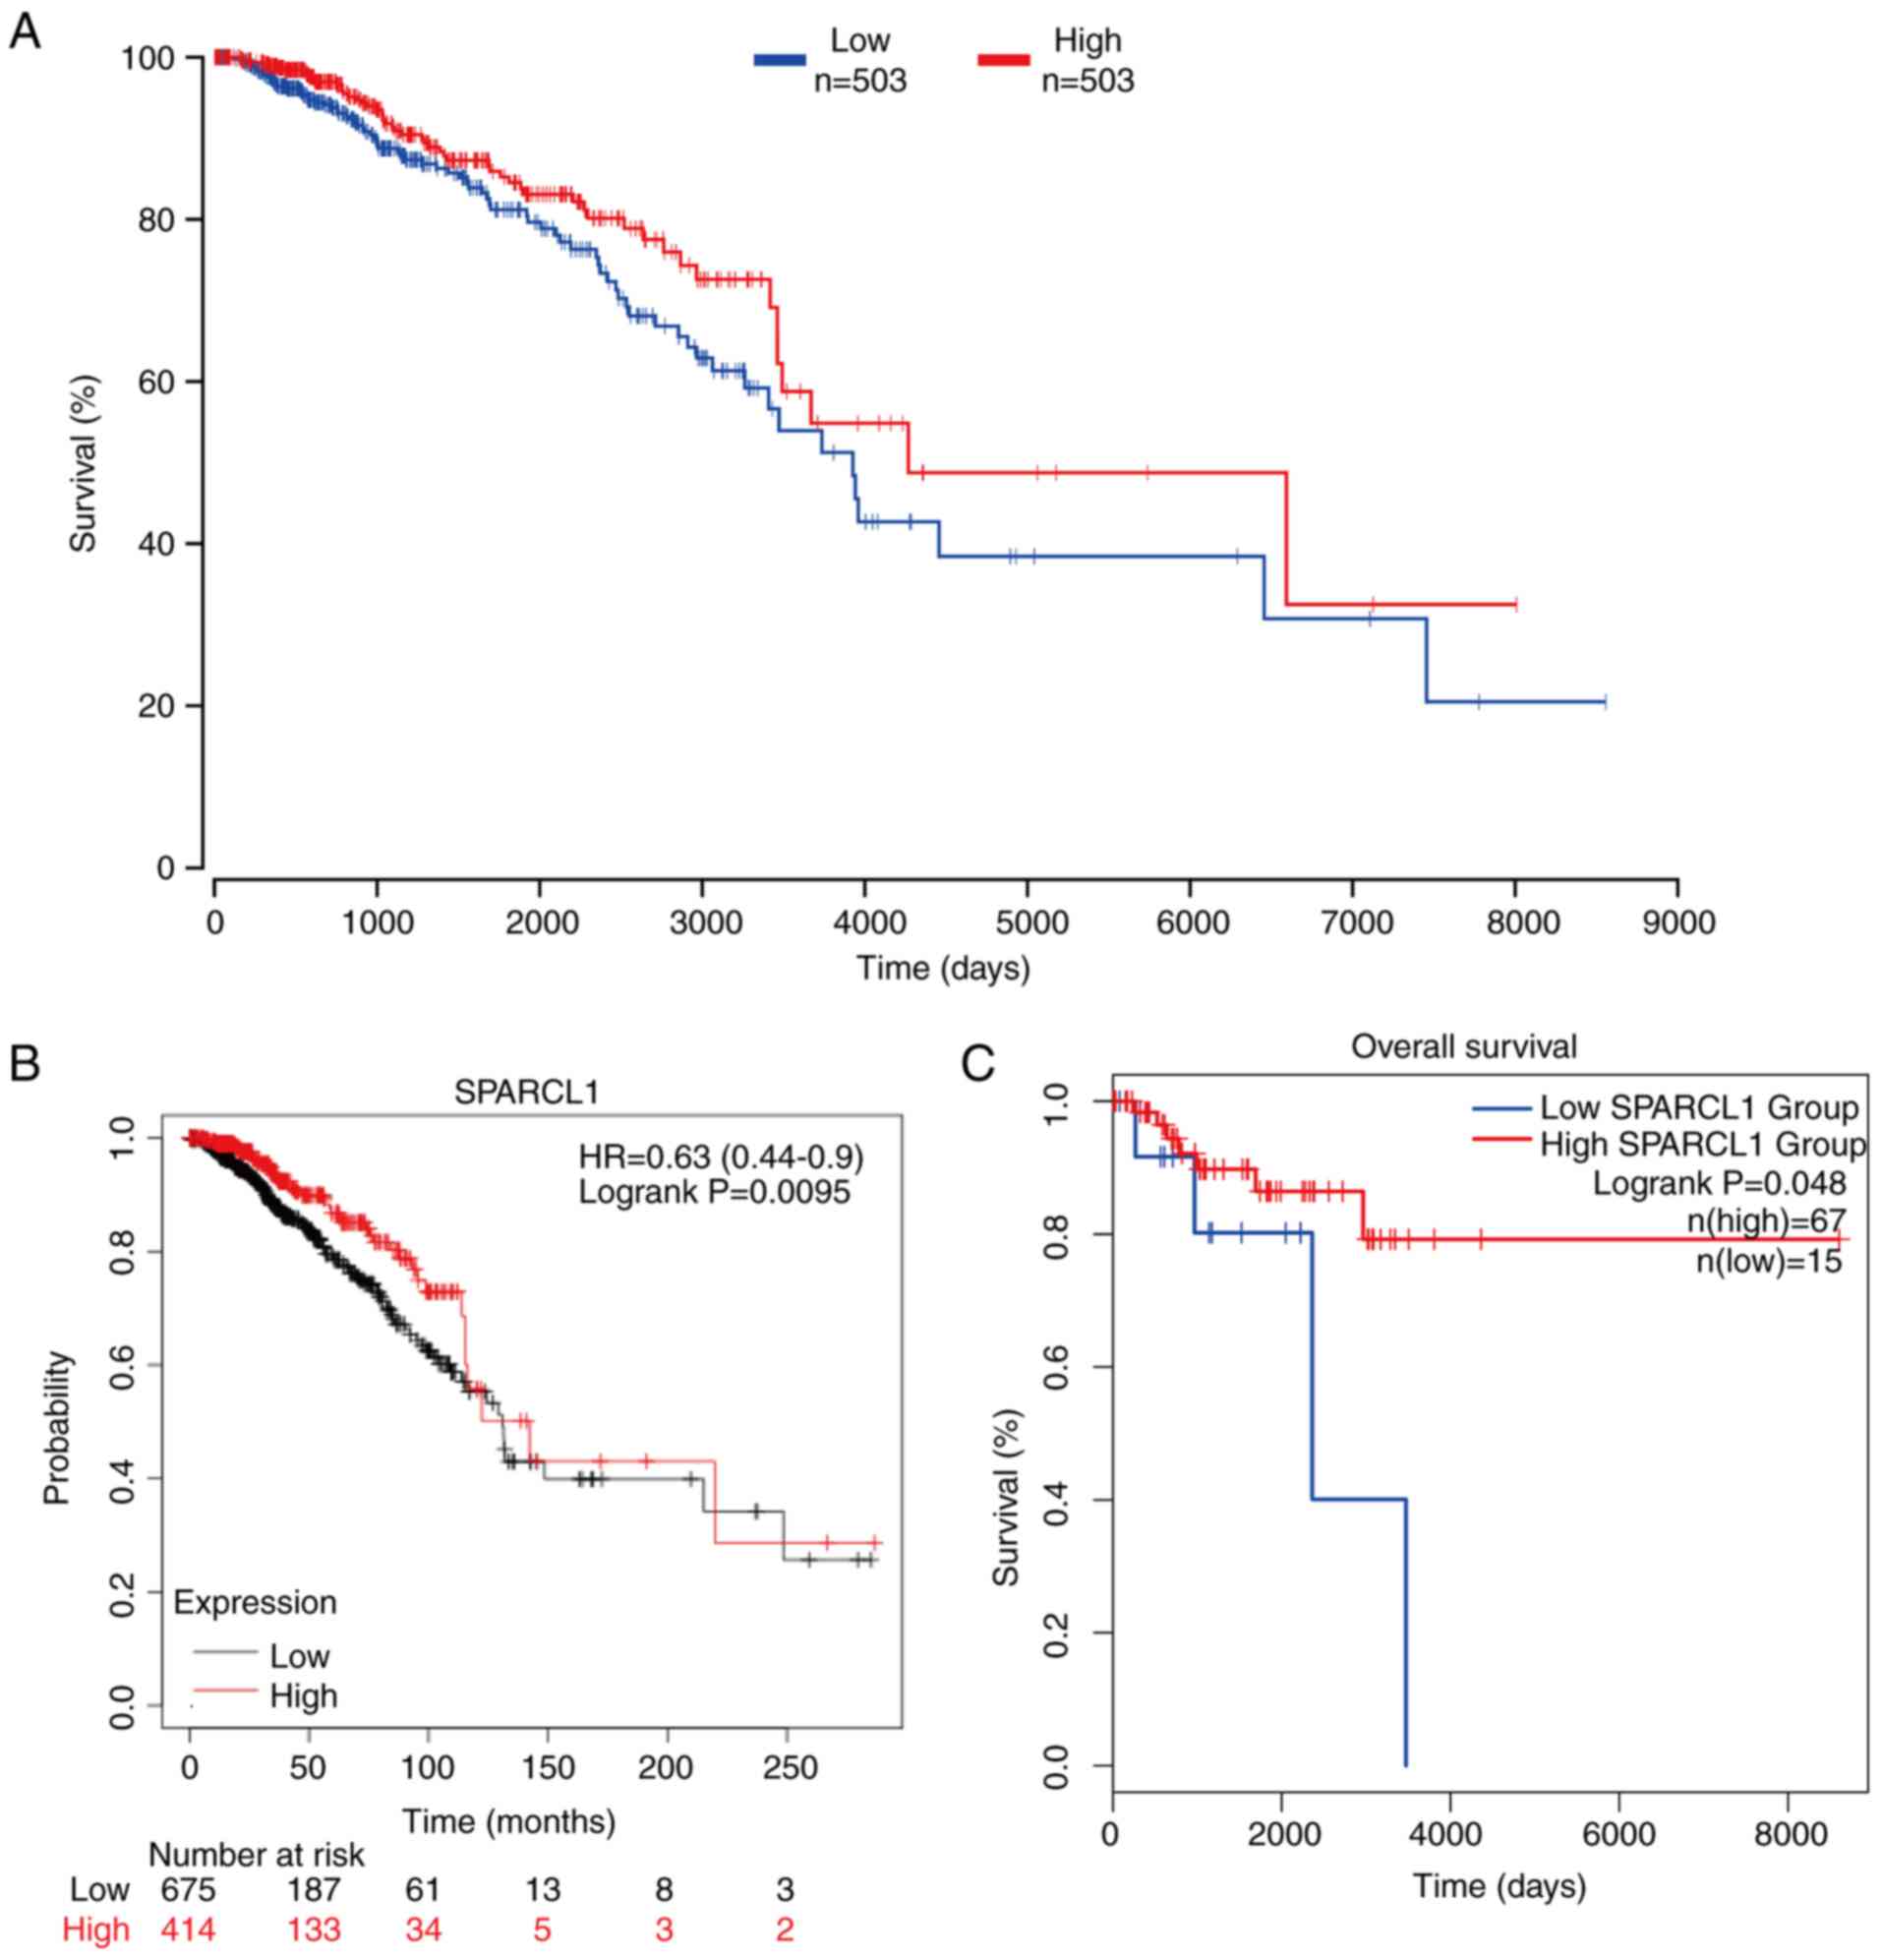
Relationship between SPARCL1
expression and survival outcomes
To assess the potential association between SPARCL1
expression and survival in patients with breast cancer, the
patients were stratified into two groups based on upper percentile
(50%) and lower percentile (50%) expression of SPARCL1 levels.
Subsequently, the OncoLnc online was used to compare the OS rates
of these two groups. Notably, a significant association was
demonstrated between poor prognosis in patients with breast cancer
and low SPARCL1 expression (P=0.04; Fig. 4A). The association between SPARCL1
expression levels and breast cancer prognosis was also analyzed
using the Kaplan-Meier Plotter database with the same pattern
detected as that depicted in Fig.
4A (n=1,090; P=0.0095; Fig.
4B). Subsequently, the GEPIA database was used to analyze
whether the expression of SPARCL1 was related to the prognosis of
the different subtypes of breast cancer. The results revealed that
low SPARCL1 expression predicted worse OS outcomes in patients with
TNBC compared with in the high SPARCL1 expression group (P=0.041;
Fig. 4C). These findings indicate
that high SPARCL1 expression could potentially be used as a
prognostic biomarker in TNBC sub type of breast cancer.
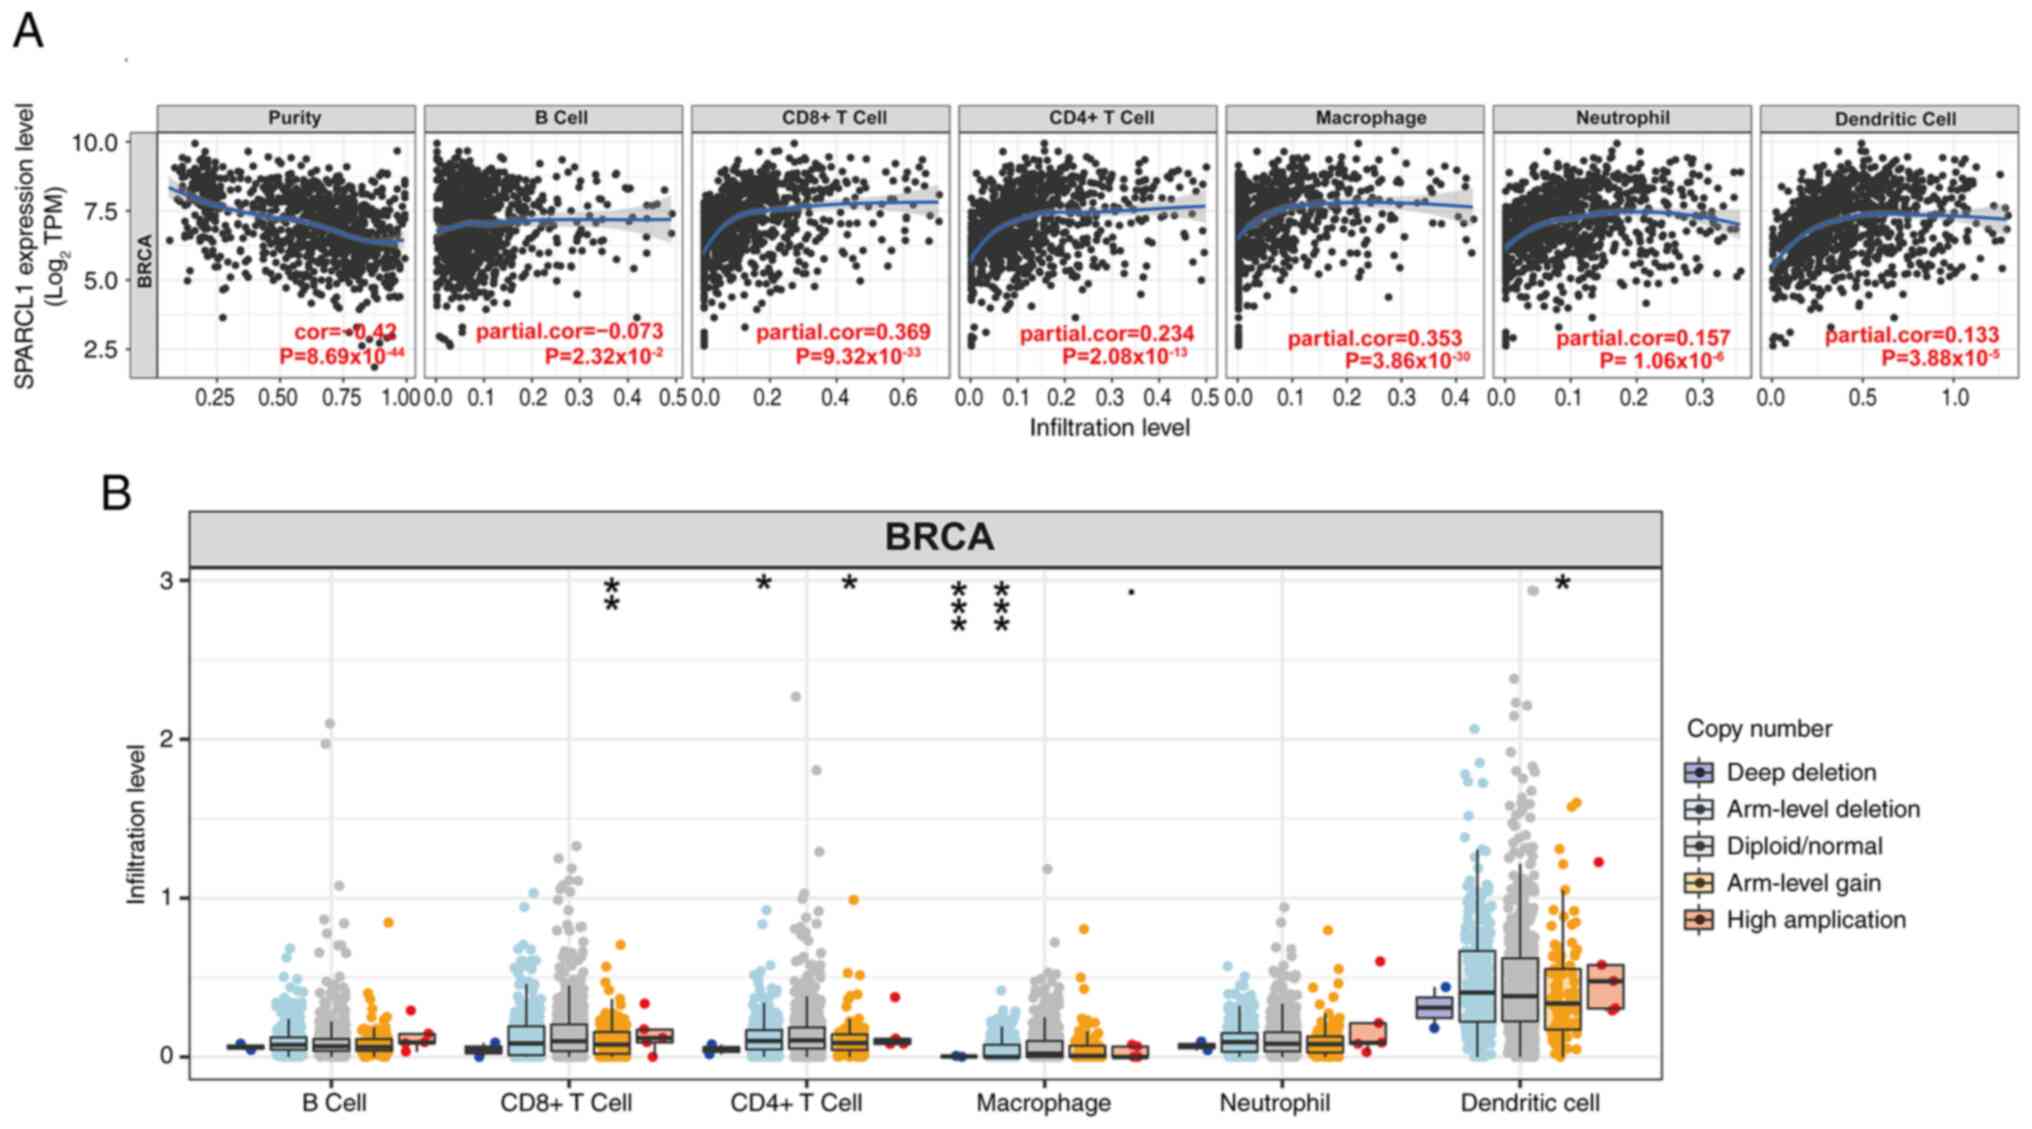
Relationship between
tumor-infiltrating immune cells and SPARCL1 expression
Previous research reported that the quantity and
activity of lymphocytes infiltrating tumors have a marked impact on
the survival outcomes of certain patients (31). Therefore, the present study assessed
the correlation between SPARCL1 and breast cancer in infiltrating
tumors using the TIMER2.0 database. The tumor purity had a strong
correlation with its impact on the detection of clinical tumor
immune infiltration. Analysis of the TIMER database revealed a
significant negative correlation between SPARCL1 expression and
tumor purity in breast cancer (cor=−0.42; P=8.69×10−44)
and the expression of SPARCL1 was also revealed to be inversely
correlated with the presence of B cells (cor=−0.073;
P=2.32×10⁻²). Meanwhile, the expression levels of
SPARCL1 exhibited significantly positive correlations with the
infiltrating levels of CD8+ T cells (partial.cor=0.369;
P=9.32×10⁻³³), CD4+ T cells (partial.cor=0.234;
P=2.08×10⁻¹³), macrophages (partial.cor = 0.353;
P=3.86×10⁻³⁰), neutrophils (partial.cor=0.157;
P=1.06×10⁻⁶) and dendritic cells (partial.cor = 0.133;
P=3.88×10⁻⁵) in breast cancer (Fig. 5A).
Furthermore, copy number alterations are closely
associated with tumor development and progression. They have
garnered attention due to their crucial role in personalized
treatment and prognosis assessment of tumors (32). Therefore, based on the analysis of
the TIMER database, a significant association was demonstrated
between arm-level gain of SPARCL1 and three infiltrating immune
cell types (CD8+ T cells, CD4+ T cells and dendritic cells).
Additionally, two infiltrating immune cell types (CD4+ T cells and
macrophages) were revealed to be significantly associated with
arm-level deletion of SPARCL1. Furthermore, it was demonstrated
that macrophage immune cells were associated with deep-deletion of
SPARCL1. However, the presence of immunological infiltrates in B
cells was not significantly associated with somatic copy number
alterations (Fig. 5B). These
results indicate that SPARCL1 expression is closely associated with
immune infiltration in breast tumors.
Analysis of the alterations in the
SPARCL1 gene and its co-expression with other genes in breast
cancer
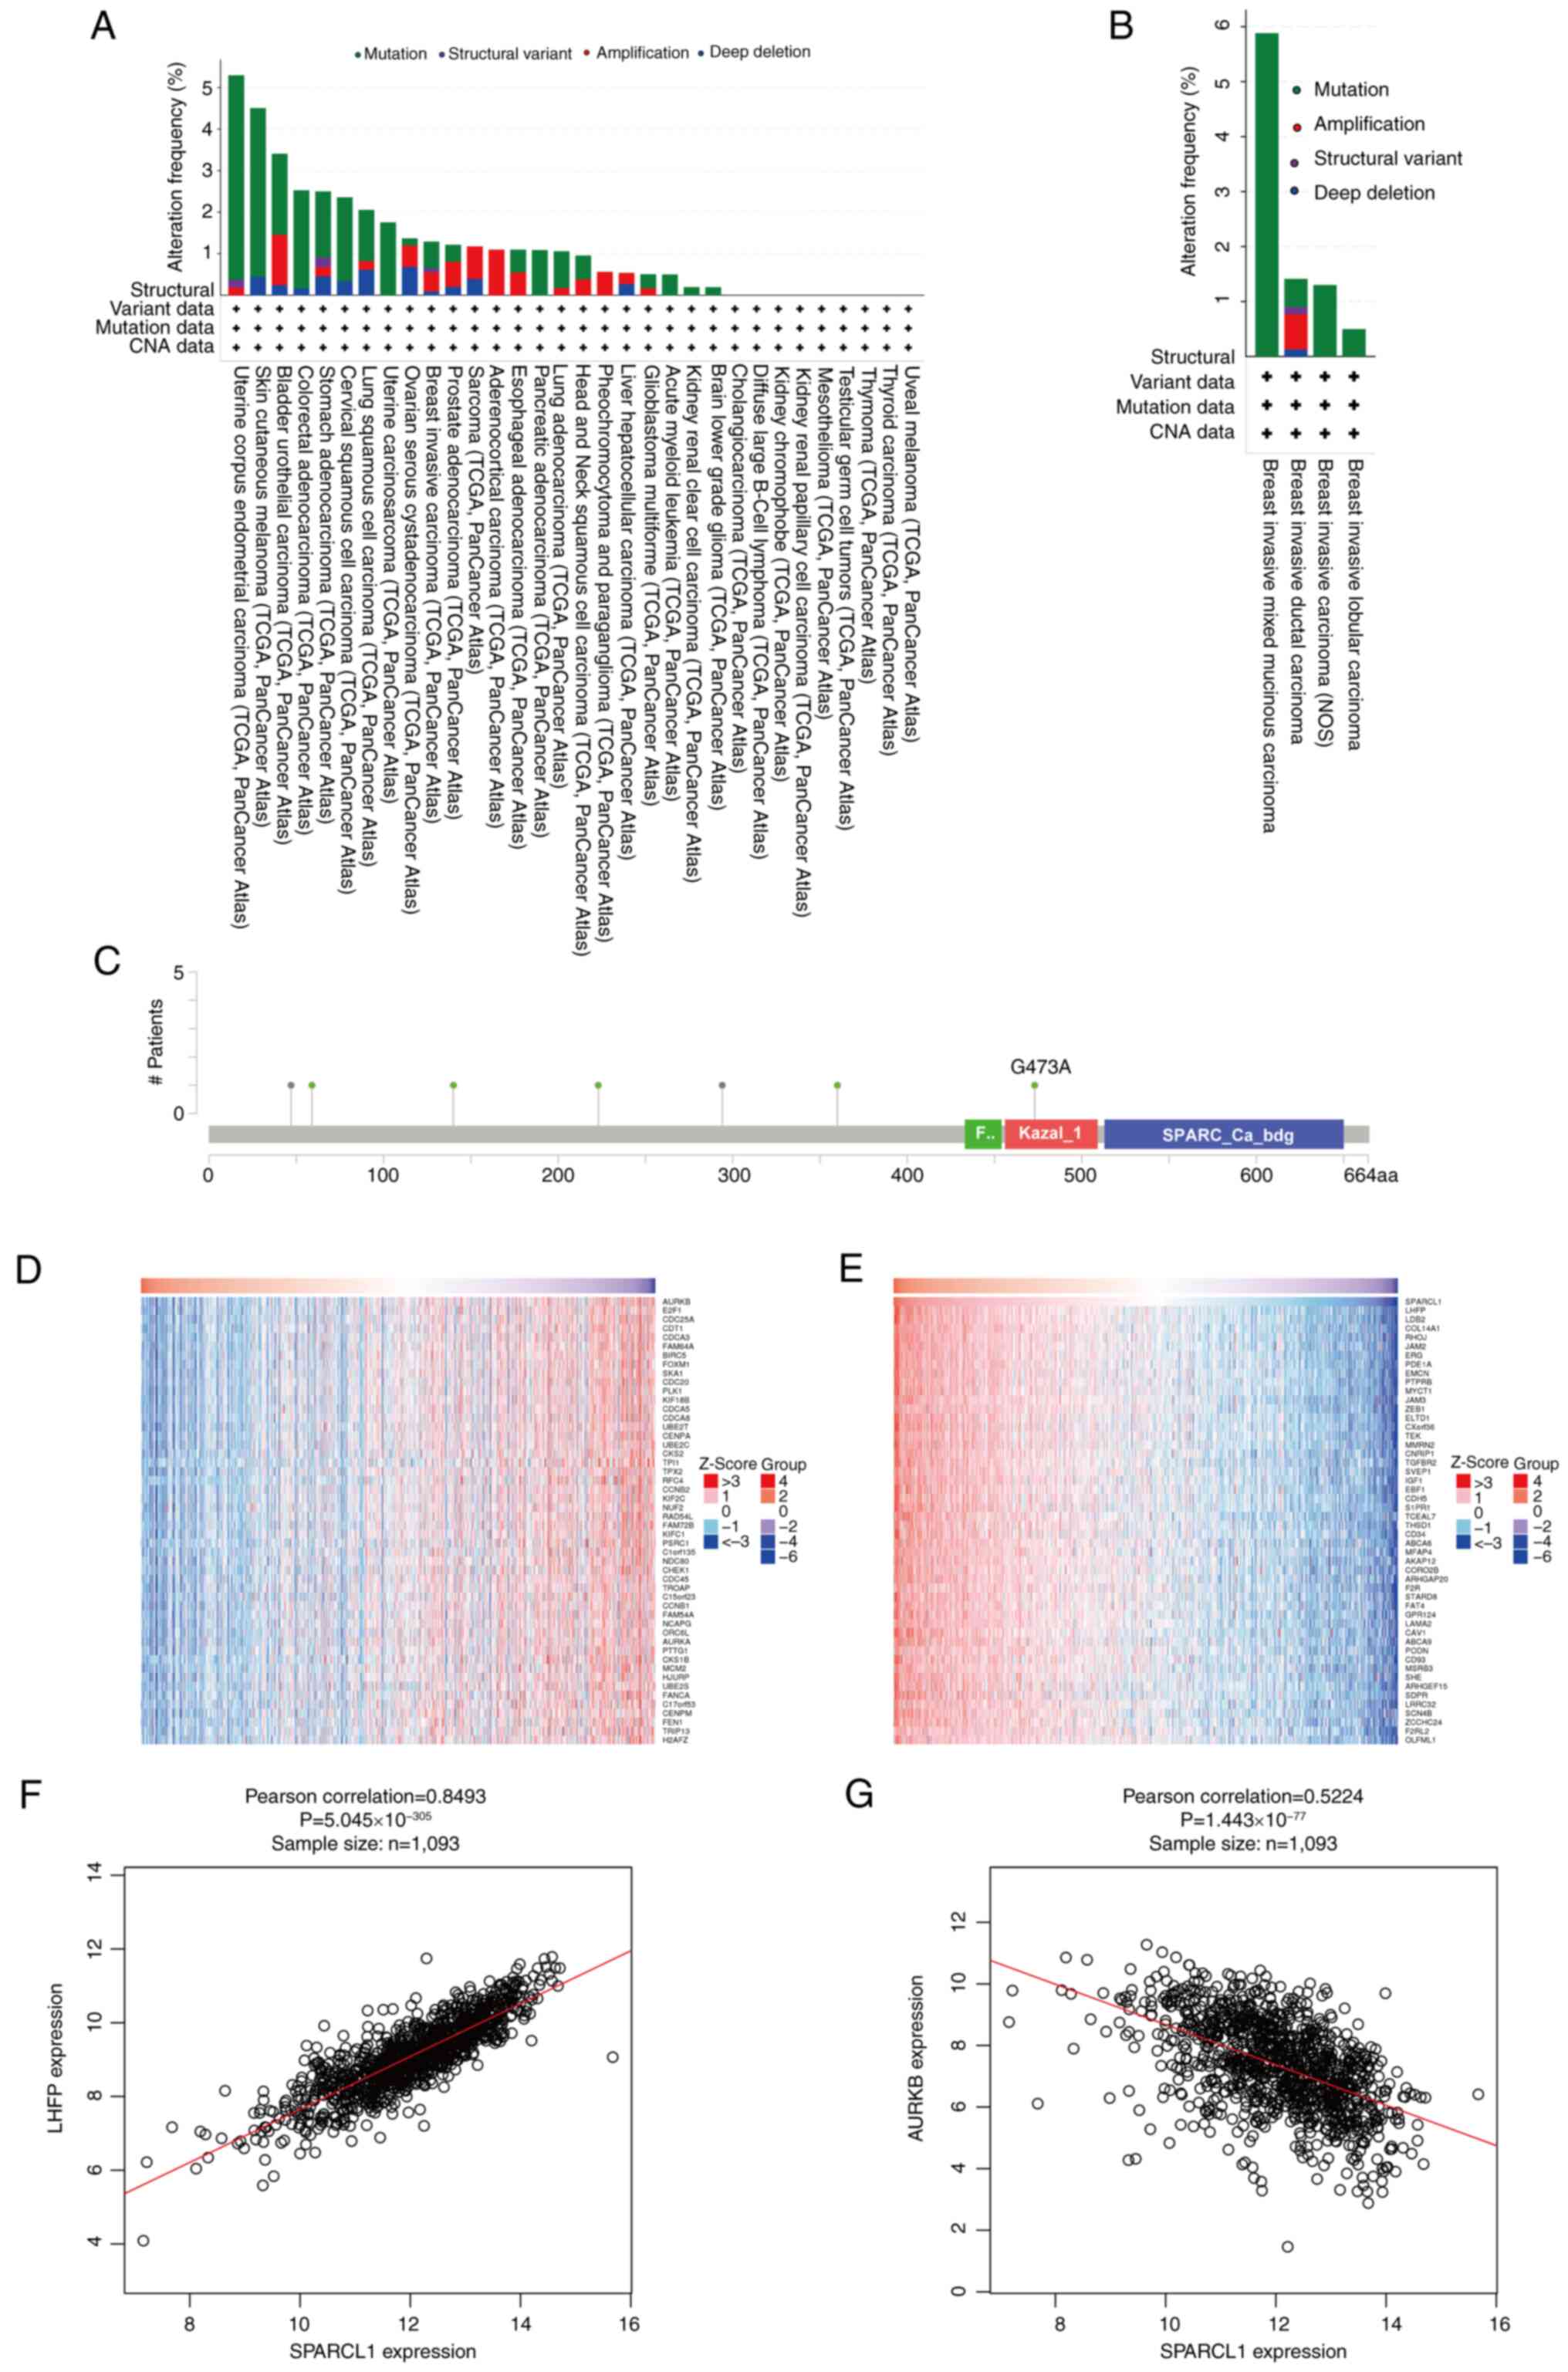
The genetic variation of SPARCL1 across several
malignancies was analyzed using the TCGA PanCancer Atlas Studies
platform from the cBioPortal database. A total of ~1.5% of the
10,967 (10,953 patients in 32 studies) samples exhibited changes in
the SPARCL1 gene (Fig. 6A). The
genetic alterations of SPARCL1 in breast cancer samples encompassed
structural variants, mutations and copy number alterations. Among
the several subtypes of breast cancer, breast invasive mixed
mucinous carcinoma exhibited the highest frequency of changes
(5.9%), followed by invasive ductal carcinoma and invasive
carcinoma of the breast (Fig. 6B).
The somatic SPARCL1 mutations were detected in 0.6% of breast
cancer samples. These five mutations were identified as missense
mutations, resulting in protein alterations at F140S, G473A, E223Q,
S59F and D360N (Fig. 6C).
Furthermore, the co-expression of SPARCL1 was assessed using the
LinkedOmics database and the top 50 important genes that positively
co-express with SPARCL1 were identified (Fig. 6D), as well as the top 50 important
genes that negatively co-express with SPARCL1 (Fig. 6E). Notably, Lipoma HMGIC fusion
partner (Pearson's correlation=0.8493; P=5.045×10−305)
was identified as the most significant positive gene associated
with SPARCL1 (Fig. 6F), whilst
Aurora kinase B (Pearson's correlation=−0.5224;
P=1.443×10−77) was revealed to be the most significant
negative gene associated with SPARCL1 (Fig. 6G).
Enrichment analyses of genes
co-expressed with SPARCL1
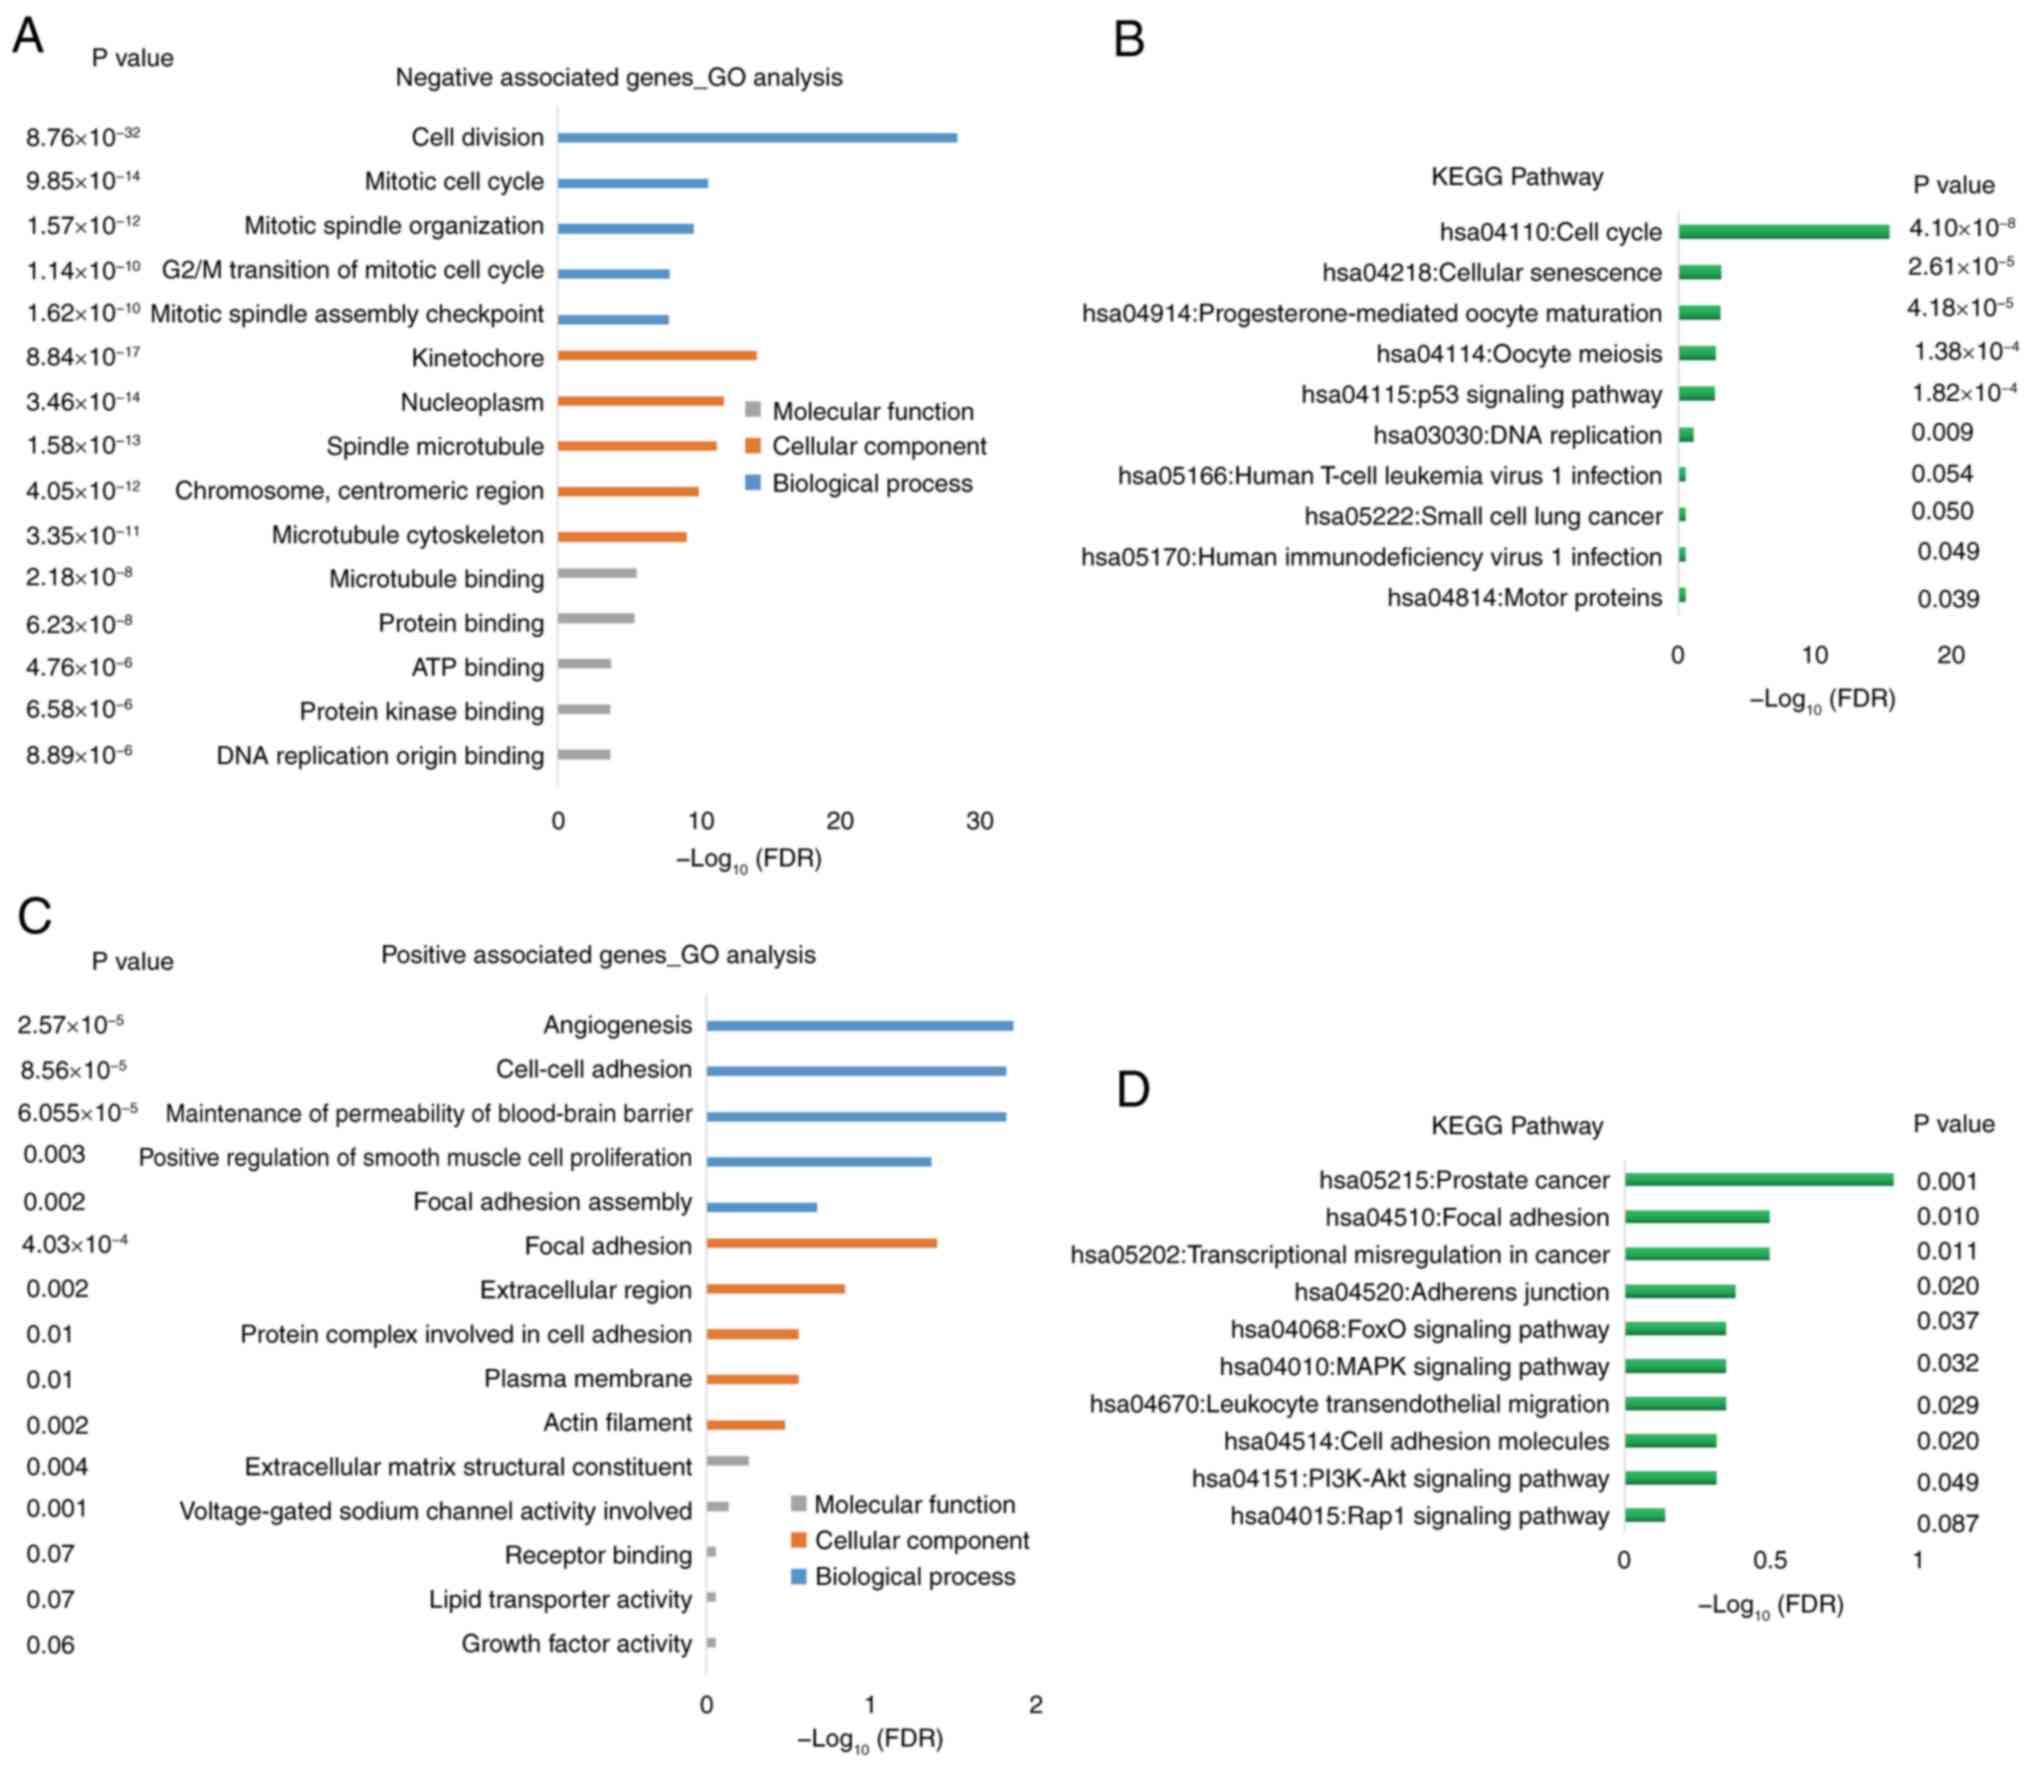
DAVID was used to performed GO and KEGG enrichment
analyses. The genes that exhibited a negative association with
SPARCL1 were primarily enriched in cell cycle [biological process
(BP)], nucleus [cellular component (CC)] and protein/ATP binding
[molecular function (MF)], according to the GO analysis (Fig. 7A). A notable association between
these positive correlation genes and the cell cycle, cellular
senescence, oocyte meiosis and DNA replication pathways was
demonstrated using KEGG pathway enrichment analysis (Fig. 7B).
By contrast, the genes that exhibited a positive
association with SPARCL1 were primarily enriched in angiogenesis,
maintenance of permeability of blood-brain barrier and adhesion
(BP), focal adhesion, extracellular region and plasma membrane (CC)
and extracellular matrix structural constituent (MF), according to
the GO analysis (Fig. 7C). A marked
association between these negative association genes and the focal
adhesion, transcriptional misregulation in cancer, Rap1 signaling
and PI3K-Akt pathways was demonstrated by KEGG pathway enrichment
analysis (Fig. 7D).
Discussion
Women have a higher likelihood of dying from breast
cancer compared with any other form of cancer worldwide (33,34).
Previous studies have reported that the absence of clinical
pathological features, such as genotyping and age staging, pose
challenges in accurately predicting the prognosis of patients with
cancer (35–38). Consequently, further research is
needed for a comprehensive understanding of the molecular pathways
involved in tumor development and prognosis.
SPARCL1 serves as a molecular marker for
tumor-associated endothelial cells, exhibiting anti-adhesive
properties and the ability to impede cell adhesion and
proliferation. In the context of tumor cell growth and
proliferation, downregulation of SPARCL1 expression often occurs as
a negative regulator (39,40), potentially contributing to
heightened cellular proliferative activity and progression through
the cell cycle. Recent research findings have also reported
diminished or absent expression patterns of SPARCL1 in diverse
human tumor tissues (41,42); however, further investigation is
required to elucidate its potential relevance to specific types of
human tumors such as breast cancer.
The present study assessed the association between
low expression of SPARCL1 and the occurrence and development of
malignant breast cancer. Pan-cancer analysis demonstrated
downregulation of SPARCL1 in several malignancies, including breast
cancer. To further assess these findings, the present study used
the GEPIA and UALCAN databases, and the bc-GenExMiner network tool
revealed an association between SPARCL1 expression and both
triple-negative and basal-like subtype states. Additionally, ROC
regression analysis was used to evaluate the relationship between
SPARCL1 expression levels and clinicopathological features of
breast cancer. The results suggest that SPARCL1 expression may
serve as a prognostic indicator for breast cancer, particularly
TNBC. Furthermore, OncoLnc, GEPIA and the Kaplan-Meier Plotter
databases were used to assess the association between SPARCL1
expression and breast cancer prognosis to determine its predictive
value. The findings indicated that downregulation of SPARCL1 is
associated with poor prognosis and can be considered as a potential
biomarker for predicting outcomes in patients with breast
cancer.
Furthermore, univariate and multivariate Cox
regression analyses were performed to evaluate the impact of risk
variables on breast cancer. The results demonstrated that
downregulation of SPARCL1 expression significantly predicts breast
cancer.
In previous studies, immune cell infiltration has
been reported to be a prognostic indicator for cancer progression
(43,44). Using the TIMER 2.0 database, a
correlation between SPARCL1 expression and immune infiltration was
demonstrated (45,46). Notably, arm-level gain of SPARCL1
was significantly associated with three infiltrating immune cell
types (CD8+ T cells, CD4+ T cells and dendritic cells). Arm-level
deletion of SPARCL1 also exhibited associations with two
infiltrating immune cell types (CD4+ T cells and macrophages)
(47,48). Additionally, deep-deletion of
SPARCL1 was reported to be associated with macrophage immune
cells.
Among the GO analysis, the top GO terms associated
with positively co-expressed genes of SPARCL1 were linked to
blood-brain barrier function. Furthermore, the occurrence of breast
cancer metastasis in the central nervous system has been documented
in scientific literature. Previous research has reported that
disruption of the blood-brain barrier or tumor barrier can
facilitate an augmentation in immune infiltration within cancer
cells (49,50). Therefore, the finding in the present
study suggests that SPARCL1, which is closely associated with
immune infiltration, may exert a regulatory role in the blood-brain
barrier during breast cancer metastasis. However, further
investigation is warranted.
The PI3K-AKT signaling pathway is an intracellular
signal transduction pathway that regulates several cellular
functions in response to extracellular signals, including
metabolism, proliferation, cell survival, growth and angiogenesis
(51,52). In breast cancer, PTEN expression
deletion is commonly observed as it serves as the upstream
regulator of PIK3/AKT/MTOR involved in several metabolic and
proliferation pathways (53,54).
In the present study, the KEGG enrichment analysis revealed that
the co-expressed genes of SPRACL1 exhibited significant
associations with the regulation of cell cycle, progression through
oocyte meiosis, cellular adhesion and activation of the PI3K-Akt
signaling pathway, and the data also demonstrated that
overexpression of SPARCL1 could exert an inhibitory effect on the
cell growth of BT-549. Additionally, previous research has reported
that the PI3K-AKT pathway is implicated in the regulation of the
blood-brain barrier (55).
Therefore, further comprehensive experimental validation is
required to assess related gene co-expression pathways associated
with SPARCL1.
The association between SPARCL1 and immune
infiltration in the present study suggests its potential
involvement in the process of immune infiltration in breast cancer,
although the interacting genes may not have a direct relationship.
Gene interactions are intricate and can be more significant in
different biological processes. These interactions are regulated by
several factors, including transcription factors and epigenetic
modifications, which can influence the connection between genes and
immune infiltration under specific conditions. The temporal and
spatial specificity of gene expression is also crucial and can
impact the role of genes in immune infiltration. Moreover,
statistical chance cannot be disregarded, necessitating further
experimental validation (56,57).
Therefore, whilst genes are associated with immune infiltration, it
is essential to perform additional research to uncover the true
nature of their relationship.
Moreover, the present study assessed the ability to
distinguish SPARCL1 expression levels between normal and malignant
breast tissues using ROC curve analysis. The effectiveness of the
test was demonstrated by an AUC value of 0.9674. However, achieving
an AUC of 0.96 for a single gene is somewhat unrealistic. Factors
that contribute to overfitting of the ROC curve include noisy data,
inadequate training data and overly complex models (58,59).
Due to insufficient clinical data, the present study had to rely on
publicly available datasets from TCGA for basic analysis purposes.
The inadequacy of the sample size in the current methodology poses
a risk of overfitting the ROC curve, as it may become excessively
tailored to the specific dataset and result in inaccurate
predictions on new data. Therefore, future research should
prioritize enhancing robustness and reliability by expanding the
dataset with comprehensive clinical data. This will ensure models
are trained on diverse and representative cases, thereby reducing
the likelihood of overfitting and improving analysis precision and
reliability.
In conclusion, SPARCL1 may serve as an independent
prognostic biomarker in patients with breast cancer. The results of
the present study are based on data from a comprehensive online
database, which have been further validated through clinical
samples and in vitro experiments. However, additional
clinical case data is required for further validation. Furthermore,
there is a need for extensive research to elucidate the clinical
function and immune escape mechanism of SPARCL1 in breast cancer.
The results of the present study could provide valuable references
for future investigations into the functional role of SPARCL1 in
breast cancer.
Supplementary Material
Supporting Data
Acknowledgements
Not applicable.
Funding
The present work was supported by the National Natural Science
Foundation of China (grant no. 82101630) and the Xuhui District
Highland Discipline Construction Project for General Practice
Medicine (grant nos. SHXH202201 and SHXHZDXK2023).
Availability of data and materials
The data generated in the present study may be
requested from the corresponding author.
Authors' contributions
YZ, YL and JC designed the research. YL performed
the bioinformatics analysis. XX performed the experimental
analyses, collected data from databases and drafted the work or
revised it critically for important intellectual content. YH and YS
contributed substantially to the conception and design of the work.
ZZ, SC and YZ contributed substantially to the acquisition,
analysis and interpretation of the data. All authors wrote the
draft of the manuscript. JC and YZ confirm the authenticity of all
the raw data. All authors have read and approved the final version
of the manuscript.
Ethics approval and consent to
participate
The present study was approved by the Scientific
Research Ethics Committee of Jiangsu University Affiliated Hospital
(approval no. KY2023H1207-08). Informed written consent for
participation was obtained from the three patients with malignant
tumors.
Patient consent for publication
Not applicable.
Competing interests
The authors declare that they have no competing
interests.
References
|
1
|
Akram M, Iqbal M, Daniyal M and Khan AU:
Awareness and current knowledge of breast cancer. Biol Res.
50:332017. View Article : Google Scholar : PubMed/NCBI
|
|
2
|
Kolak A, Kamińska M, Sygit K, Budny A,
Surdyka D, Kukiełka-Budny B and Burdan F: Primary and secondary
prevention of breast cancer. Ann Agric Environ Med. 24:549–553.
2017. View Article : Google Scholar : PubMed/NCBI
|
|
3
|
Barzaman K, Karami J, Zarei Z,
Hosseinzadeh A, Kazemi MH, Moradi-Kalbolandi S, Safari E and
Farahmand L: Breast cancer: Biology, biomarkers, and treatments.
Int Immunopharmacol. 84:1065352020. View Article : Google Scholar : PubMed/NCBI
|
|
4
|
Derakhshan F and Reis-Filho JS:
Pathogenesis of triple-negative breast cancer. Annu Rev Pathol.
17:181–204. 2022. View Article : Google Scholar : PubMed/NCBI
|
|
5
|
Yin L, Duan JJ, Bian XW and Yu SC:
Triple-negative breast cancer molecular subtyping and treatment
progress. Breast Cancer Res. 22:612020. View Article : Google Scholar : PubMed/NCBI
|
|
6
|
Howard FM and Olopade OI: Epidemiology of
triple-negative breast cancer: A review. Cancer J. 27:8–16. 2021.
View Article : Google Scholar : PubMed/NCBI
|
|
7
|
Russo A, Incorvaia L, Capoluongo E,
Tagliaferri P, Gori S, Cortesi L, Genuardi M, Turchetti D, De
Giorgi U, Di Maio M, et al: Implementation of preventive and
predictive BRCA testing in patients with breast, ovarian,
pancreatic, and prostate cancer: A position paper of Italian
scientific societies. ESMO Open. 7:1004592022. View Article : Google Scholar : PubMed/NCBI
|
|
8
|
Copson ER, Maishman TC, Tapper WJ, Cutress
RI, Greville-Heygate S, Altman DG, Eccles B, Gerty S, Durcan LT,
Jones L, et al: Germline BRCA mutation and outcome in young-onset
breast cancer (POSH): A prospective cohort study. Lancet Oncol.
19:169–180. 2018. View Article : Google Scholar : PubMed/NCBI
|
|
9
|
Gagliardi F, Narayanan A and Mortini P:
SPARCL1 a novel player in cancer biology. Crit Rev Oncol Hematol.
109:63–68. 2017. View Article : Google Scholar : PubMed/NCBI
|
|
10
|
He K, Li C, Yuan H, Jiang K and Deng G:
Immunological role and prognostic value of SPARCL1 in pan-cancer
analysis. Pathol Oncol Res. 28:16106872022. View Article : Google Scholar : PubMed/NCBI
|
|
11
|
Zhou Y and Zhang Q: Association of tumor
suppressor sparcl1 with clinical staging and prognosis of NSCLC.
Ann Clin Lab Sci. 51:756–765. 2021.PubMed/NCBI
|
|
12
|
Hu H, Cai W, Zheng S and Ge W: SPARCL1, a
novel prognostic predictive factor for GI malignancies: a
meta-analysis. Cell Physiol Biochem. 44:1485–1496. 2017. View Article : Google Scholar : PubMed/NCBI
|
|
13
|
Cao F, Wang K, Zhu R, Hu YW, Fang WZ and
Ding HZ: Clinicopathological significance of reduced SPARCL1
expression in human breast cancer. Asian Pac J Cancer Prev.
14:195–200. 2013. View Article : Google Scholar : PubMed/NCBI
|
|
14
|
Chen M, Zheng W and Fang L: Identifying
liver metastasis-related hub genes in breast cancer and
characterizing SPARCL1 as a potential prognostic biomarker. PeerJ.
11:e153112023. View Article : Google Scholar : PubMed/NCBI
|
|
15
|
Su Z, Wang G and Li L: CHRDL1, NEFH, TAGLN
and SYNM as novel diagnostic biomarkers of benign prostatic
hyperplasia and prostate cancer. Cancer Biomark. 38:143–159. 2023.
View Article : Google Scholar : PubMed/NCBI
|
|
16
|
Oliveras-Ferraros C, Vazquez-Martin A,
Cuyàs E, Corominas-Faja B, Rodríguez-Gallego E, Fernández-Arroyo S,
Martin-Castillo B, Joven J and Menendez JA: Acquired resistance to
metformin in breast cancer cells triggers transcriptome
reprogramming toward a degradome-related metastatic stem-like
profile. Cell Cycle. 13:1132–1144. 2014. View Article : Google Scholar : PubMed/NCBI
|
|
17
|
Chandrashekar DS, Karthikeyan SK, Korla
PK, Patel H, Shovon AR, Athar M, Netto GJ, Qin ZS, Kumar S, Manne
U, et al: UALCAN: An update to the integrated cancer data analysis
platform. Neoplasia. 25:18–27. 2022. View Article : Google Scholar : PubMed/NCBI
|
|
18
|
Chandrashekar DS, Bashel B, Balasubramanya
SAH, Creighton CJ, Ponce-Rodriguez I, Chakravarthi BVSK and
Varambally S: UALCAN: A portal for facilitating tumor subgroup gene
expression and survival analyses. Neoplasia. 19:649–658. 2017.
View Article : Google Scholar : PubMed/NCBI
|
|
19
|
Chen F, Zhang Y, Chandrashekar DS,
Varambally S and Creighton CJ: Global impact of somatic structural
variation on the cancer proteome. Nat Commun. 14:56372023.
View Article : Google Scholar : PubMed/NCBI
|
|
20
|
Tang Z, Kang B, Li C, Chen T and Zhang Z:
GEPIA2: An enhanced web server for large-scale expression profiling
and interactive analysis. Nucleic Acids Res 47 (W1). W556–W560.
2019. View Article : Google Scholar : PubMed/NCBI
|
|
21
|
Jézéquel P, Campone M, Gouraud W,
Guérin-Charbonnel C, Leux C, Ricolleau G and Campion L:
bc-GenExMiner: An easy-to-use online platform for gene prognostic
analyses in breast cancer. Breast Cancer Res Treat. 131:765–775.
2012. View Article : Google Scholar : PubMed/NCBI
|
|
22
|
Jézéquel P, Gouraud W, Ben Azzouz F,
Guérin-Charbonnel C, Juin PP, Lasla H and Campone M: bc-GenExMiner
4.5: New mining module computes breast cancer differential gene
expression analyses. Database (Oxford). 2021:baab0072021.
View Article : Google Scholar : PubMed/NCBI
|
|
23
|
Prat A, Pineda E, Adamo B, Galván P,
Fernández A, Gaba L, Díez M, Viladot M, Arance A and Muñoz M:
Clinical implications of the intrinsic molecular subtypes of breast
cancer. Breast. 24 (Suppl 2):S26–S35. 2015. View Article : Google Scholar : PubMed/NCBI
|
|
24
|
Győrffy B: Survival analysis across the
entire transcriptome identifies biomarkers with the highest
prognostic power in breast cancer. Comput Struct Biotechnol J.
19:4101–4109. 2021. View Article : Google Scholar : PubMed/NCBI
|
|
25
|
Li T, Fu J, Zeng Z, Cohen D, Li J, Chen Q,
Li B and Liu XS: TIMER2.0 for analysis of tumor-infiltrating immune
cells. Nucleic Acids Res 48 (W1). W509–W514. 2020. View Article : Google Scholar : PubMed/NCBI
|
|
26
|
Livak KJ and Schmittgen TD: Analysis of
relative gene expression data using real-time quantitative PCR and
the 2(−Delta Delta C(T)) method. Methods. 25:402–408. 2001.
View Article : Google Scholar : PubMed/NCBI
|
|
27
|
Kim YM, Kang M, Choi JH, Lee BH, Kim GH,
Ohn JH, Kim SY, Park MS and Yoo HW: A review of the literature on
common CYP17A1 mutations in adults with 17-hydroxylase/17,20-lyase
deficiency, a case series of such mutations among Koreans and
functional characteristics of a novel mutation. Metabolism.
63:42–49. 2014. View Article : Google Scholar : PubMed/NCBI
|
|
28
|
Vasaikar SV, Straub P, Wang J and Zhang B:
LinkedOmics: Analyzing multi-omics data within and across 32 cancer
types. Nucleic Acids Res. 46(D1): D956–D963. 2018. View Article : Google Scholar : PubMed/NCBI
|
|
29
|
Edge SB and Compton CC: The American joint
committee on cancer: The 7th edition of the AJCC cancer staging
manual and the future of TNM. Ann Surg Oncol. 17:1471–1474. 2010.
View Article : Google Scholar : PubMed/NCBI
|
|
30
|
Olawaiye AB, Baker TP, Washington MK and
Mutch DG: The new (version 9) American joint committee on cancer
tumor, node, metastasis staging for cervical cancer. CA Cancer J
Clin. 71:287–298. 2021. View Article : Google Scholar : PubMed/NCBI
|
|
31
|
Stanton SE and Disis ML: Clinical
significance of tumor-infiltrating lymphocytes in breast cancer. J
Immunother Cancer. 4:592016. View Article : Google Scholar : PubMed/NCBI
|
|
32
|
Lu H, Lou H, Wengert G, Paudel R, Patel N,
Desai S, Crum B, Linton-Reid K, Chen M, Li D, et al: Tumor and
local lymphoid tissue interaction determines prognosis in
high-grade serous ovarian cancer. Cell Rep Med. 4:1010922023.
View Article : Google Scholar : PubMed/NCBI
|
|
33
|
Thorat MA and Balasubramanian R: Breast
cancer prevention in high-risk women. Best Pract Res Clin Obstet
Gynaecol. 65:18–31. 2020. View Article : Google Scholar : PubMed/NCBI
|
|
34
|
Winters S, Martin C, Murphy D and Shokar
NK: Breast cancer epidemiology, prevention, and screening. Prog Mol
Biol Transl Sci. 151:1–32. 2017. View Article : Google Scholar : PubMed/NCBI
|
|
35
|
Maughan KL, Lutterbie MA and Ham PS:
Treatment of breast cancer. Am Fam Physician. 81:1339–1346.
2010.PubMed/NCBI
|
|
36
|
Peart O: Breast intervention and breast
cancer treatment options. Radiol Technol. 86:535M–562M.
2015.PubMed/NCBI
|
|
37
|
Ben-Dror J, Shalamov M and Sonnenblick A:
The history of early breast cancer treatment. Genes (Basel).
13:9602022. View Article : Google Scholar : PubMed/NCBI
|
|
38
|
Tesch ME and Partridge AH: Treatment of
breast cancer in young adults. Am Soc Clin Oncol Educ Book.
42:1–12. 2022.PubMed/NCBI
|
|
39
|
Zhang HP, Wu J, Liu ZF, Gao JW and Li SY:
SPARCL1 is a novel prognostic biomarker and correlates with tumor
microenvironment in colorectal cancer. Biomed Res Int.
2022:13982682022. View Article : Google Scholar : PubMed/NCBI
|
|
40
|
Yu Y, Chen Y, Ma J, Yu X, Yu G and Li Z:
SPARCL1 is a novel predictor of tumor recurrence and survival in
hilar cholangiocarcinoma. Tumour Biol. 37:4159–4167. 2016.
View Article : Google Scholar : PubMed/NCBI
|
|
41
|
Gao S, Gang J, Yu M, Xin G and Tan H:
Computational analysis for identification of early diagnostic
biomarkers and prognostic biomarkers of liver cancer based on GEO
and TCGA databases and studies on pathways and biological functions
affecting the survival time of liver cancer. BMC Cancer.
21:7912021. View Article : Google Scholar : PubMed/NCBI
|
|
42
|
Li H, Lei Y, Li G and Huang Y:
Identification of tumor-suppressor genes in lung squamous cell
carcinoma through integrated bioinformatics analyses. Oncol Res.
32:187–197. 2023. View Article : Google Scholar : PubMed/NCBI
|
|
43
|
Yang H, Zou X, Yang S, Zhang A, Li N and
Ma Z: Identification of lactylation related model to predict
prognostic, tumor infiltrating immunocytes and response of
immunotherapy in gastric cancer. Front Immunol. 14:11499892023.
View Article : Google Scholar : PubMed/NCBI
|
|
44
|
Zhao H, Luo K, Liu M, Cai Y, Liu S, Li S,
Zhao Y and Zhang H: Immune regulation and prognostic prediction
model establishment and validation of PSMB6 in lung adenocarcinoma.
Front Genet. 15:14580472024. View Article : Google Scholar : PubMed/NCBI
|
|
45
|
Xiao X, Peng J, Chen Y, Lu X, Sun W, Xiao
W, Yuan M and Huang X: Comprehensive analysis of differential gene
expression and correlated immune infiltration in bladder cancer.
Iran J Public Health. 52:1225–1237. 2023.PubMed/NCBI
|
|
46
|
Chen Z, Sun X, Kang Y, Zhang J, Jia F, Liu
X and Zhu H: A novel risk model based on the correlation between
the expression of basement membrane genes and immune infiltration
to predict the invasiveness of pituitary adenomas. Front Endocrinol
(Lausanne). 13:10797772023. View Article : Google Scholar : PubMed/NCBI
|
|
47
|
Zhao G, Gentile ME, Xue L, Cosgriff CV,
Weiner AI, Adams-Tzivelekidis S, Wong J, Li X, Kass-Gergi S,
Holcomb NP, et al: Vascular endothelial-derived SPARCL1 exacerbates
viral pneumonia through pro-inflammatory macrophage activation.
bioRxiv [Preprint]. 2023.05.25.541966. 2023.
|
|
48
|
Strunz M, Jarrell JT, Cohen DS, Rosin ER,
Vanderburg CR and Huang X: Modulation of SPARC/hevin proteins in
Alzheimer's disease brain injury. J Alzheimers Dis. 68:695–710.
2019. View Article : Google Scholar : PubMed/NCBI
|
|
49
|
Sheybani ND, Witter AR, Garrison WJ,
Miller GW, Price RJ and Bullock TNJ: Profiling of the immune
landscape in murine glioblastoma following blood brain/tumor
barrier disruption with MR image-guided focused ultrasound. J
Neurooncol. 156:109–122. 2022. View Article : Google Scholar : PubMed/NCBI
|
|
50
|
Sadique FL, Subramaiam H, Krishnappa P,
Chellappan DK and Ma JH: Recent advances in breast cancer
metastasis with special emphasis on metastasis to the brain. Pathol
Res Pract. 260:1553782024. View Article : Google Scholar : PubMed/NCBI
|
|
51
|
Ersahin T, Tuncbag N and Cetin-Atalay R:
The PI3K/AKT/mTOR interactive pathway. Mol Biosyst. 11:1946–1954.
2015. View Article : Google Scholar : PubMed/NCBI
|
|
52
|
Xu F, Na L, Li Y and Chen L: Roles of the
PI3K/AKT/mTOR signalling pathways in neurodegenerative diseases and
tumours. Cell Biosci. 10:542020. View Article : Google Scholar : PubMed/NCBI
|
|
53
|
Carnero A, Blanco-Aparicio C, Renner O,
Link W and Leal JF: The PTEN/PI3K/AKT signalling pathway in cancer,
therapeutic implications. Curr Cancer Drug Targets. 8:187–198.
2008. View Article : Google Scholar : PubMed/NCBI
|
|
54
|
Li G, Zhang C, Liang W, Zhang Y, Shen Y
and Tian X: Berberine regulates the Notch1/PTEN/PI3K/AKT/mTOR
pathway and acts synergistically with 17-AAG and SAHA in SW480
colon cancer cells. Pharm Biol. 59:21–30. 2021. View Article : Google Scholar : PubMed/NCBI
|
|
55
|
Zhu L, Yang F, Wang G and Li Q: CXC motif
chemokine receptor type 4 disrupts blood-brain barrier and promotes
brain metastasis through activation of the PI3K/AKT pathway in lung
cancer. World Neurosurg. 166:e369–e381. 2022. View Article : Google Scholar : PubMed/NCBI
|
|
56
|
Tusup M, Kündig TM and Pascolo S:
Epitranscriptomics modifier pentostatin indirectly triggers
Toll-like receptor 3 and can enhance immune infiltration in tumors.
Mol Ther. 30:1163–1170. 2022. View Article : Google Scholar : PubMed/NCBI
|
|
57
|
Pan M, Wei X, Xiang X, Liu Y, Zhou Q and
Yang W: Targeting CXCL9/10/11-CXCR3 axis: An important component of
tumor-promoting and antitumor immunity. Clin Transl Oncol.
25:2306–2320. 2023. View Article : Google Scholar : PubMed/NCBI
|
|
58
|
Wu J, Yang S, Gou F, Zhou Z, Xie P, Xu N
and Dai Z: Intelligent segmentation medical assistance system for
MRI images of osteosarcoma in developing countries. Comput Math
Methods Med. 2022:77035832022.PubMed/NCBI
|
|
59
|
Gygi JP, Kleinstein SH and Guan L:
Predictive overfitting in immunological applications: Pitfalls and
solutions. Hum Vaccin Immunother. 19:22518302023. View Article : Google Scholar : PubMed/NCBI
|