Introduction
Lung cancer is one of the most common cancers
worldwide. The main types of lung cancer are lung adenocarcinoma
(LUAD), lung squamous cell carcinoma and small cell lung cancer
(1). Among them, LUAD is the most
common histological subtype, accounting for ~40% of the global
incidence of lung cancer (2).
Despite advancements in therapeutic techniques and the
identification of tumor therapeutic targets, such as immune
checkpoint inhibitors (ICIs) [for example, programmed death 1
(PD-1) and programmed death ligand 1 (PD-L1)] (3), which have improved patient prognosis,
lung cancer remains the primary cause of cancer-related mortality
worldwide, accounting for ~1.76 million deaths annually, which
represents 18.4% of all cancer-related deaths. This high mortality
rate is largely attributed to drug resistance and distant
metastasis (4). The tumor (T)-node
(N)-metastasis (M) system is currently widely utilized to evaluate
the degree of tumor development (5). However, the TNM system does not
accurately predict the prognosis of patients with lung cancer
(6). Therefore, it is particularly
important to identify a new biomarker to construct a risk
assessment model for predicting the prognosis and therapeutic
response of patients with LUAD.
B cells undergo differentiation into plasma cells
upon activation, with plasma cells producing and releasing
significant quantities of antigen-specific immunoglobulins
(7). This process is crucial for
the adaptive immune response and serves a significant role in
humoral immunity. In recent years, plasma cells have been reported
to be related to tumor progression; for example, multiple myeloma
results from the malignant transformation of plasma cells or their
precursors (8). In addition, plasma
cell leukemia (PCL) is a rare cancer caused by the uncontrolled
proliferation of plasma cells in the peripheral blood and bone
marrow (9). Chaudhary et al
(9) reported that tumor protein 53
(TP53), mitogen-activated protein kinase 1, suppressor of cytokine
signaling 1, methyl-CpG binding domain protein 3 and YES
proto-oncogene 1, Src family tyrosine kinase are signature central
genes that may lead to poor prognosis in PCL. Considerable progress
has been made in cancer immunotherapy research regarding the
response of the immune system to cancer (10). Hao et al (11) used the plasma cell signature as a
potential biomarker to predict the overall survival benefit and
efficacy of a PD-1/PD-L1 blockade in patients with LUAD. However,
no studies have used plasma cell signatures to predict the
prognosis of patients with LUAD, to the best of our knowledge.
In recent years, the utilization of RNA sequencing
has greatly expanded in cancer research due to its broad
applicability (12). Traditional
RNA sequencing can only detect the average expression level of all
cells in a sample and cannot discern changes in individual cells.
However, the advent of single-cell sequencing technology has
addressed this limitation, enabling the detection of transcriptomes
in different cell types (13).
Utilizing this technology, Wang et al (14) employed single-cell RNA sequencing
(scRNA-seq), along with lipidomic techniques, to investigate
dysregulated lipid metabolism in lung cancer, offering a potential
avenue for early detection. Similarly, Zhu et al (15) used scRNA-seq and spatial
transcriptomics to elucidate specific cellular information and
spatial architecture of cancer cells and tumor microenvironment
(TME) subpopulations, thus advancing precision medicine in
understanding the invasive process of LUAD from adenocarcinoma in
situ to invasive adenocarcinoma cancer. Therefore, the present
study aimed to develop a risk assessment model for patients with
LUAD based on plasma cell immune-related genes (PCIGs) by
integrating scRNA-seq and bulk RNA sequencing.
The present study developed a risk assessment model
to evaluate the prognosis of patients with LUAD and its clinical
significance. Several analyses, including survival analysis,
enrichment analysis, tumor mutational burden (TMB) analysis, TME
differential analysis, drug sensitivity prediction and clinical
correlation analysis, were performed.
Materials and methods
Data sources and access
A total of 1,288 samples were collected, including
600 LUAD samples obtained from The Cancer Genome Atlas (TCGA)
database (TCGA-LUAD; www.portal.gdc.cancer.gov/). Tumor transcriptome data,
clinical information and tumor somatic cell mutation data were
extracted from the TCGA database. Additionally, data from the
GSE72094 cohort (n=442) and GSE31210 cohort (n=246) from the Gene
Expression Omnibus (GEO) database (www.ncbi.nlm.nih.gov/geo/) were used (Table I). The GSE31210 cohort served as an
independent external dataset to validate the reproducibility of the
risk model. Furthermore, immune-related genes were retrieved from
ImmPort (www.immport.org/home) and InnateDB
(www.innatedb.ca/), and the two sets of genetic
information were merged.
 | Table I.Clinical information of the patients
in The Cancer Genome Atlas, Gene Expression Omnibus and external
groups. |
Table I.
Clinical information of the patients
in The Cancer Genome Atlas, Gene Expression Omnibus and external
groups.
| A, TCGA cohort
(n=522) |
|---|
|
|---|
| Characteristic | n (%) |
|---|
| Age |
|
| <65
years | 223 (42.72) |
| >65
years | 280 (53.64) |
|
Unknown | 19 (3.64) |
| Status |
|
|
Alive | 334 (63.98) |
|
Dead | 188 (36.02) |
| Sex |
|
|
Female | 280 (53.64) |
|
Male | 242 (46.36) |
| Stage |
|
| I | 279 (53.45) |
| II | 124 (23.75) |
|
III | 85 (16.28) |
| IV | 26 (4.98) |
|
Unknown | 8 (1.53) |
| T stage |
|
| T1 | 172 (32.95) |
| T2 | 281 (53.83) |
| T3 | 47 (9.00) |
| T4 | 19 (3.64) |
|
Unknown | 3 (0.57) |
| M stage |
|
| M0 | 353 (67.62) |
| M1 | 25 (4.79) |
|
Unknown | 144 (27.59) |
| N stage |
|
| N0 | 335 (64.18) |
| N1 | 98 (18.77) |
| N2 | 75 (14.37) |
| N3 | 2 (0.38) |
|
Unknown | 12 (2.30) |
|
| B, GEO cohort
(n=442) |
|
|
Characteristic | n (%) |
|
| Age |
|
| <65
years | 127 (28.73) |
| >65
years | 294 (66.52) |
|
Unknown | 21 (4.750) |
| Status |
|
|
Alive | 298 (67.42) |
|
Dead | 122 (27.60) |
|
Unknown | 22 (4.98) |
| Sex |
|
|
Female | 240 (54.30) |
|
Male | 202 (45.70) |
| Stage |
|
| I | 265 (59.95) |
| II | 69 (15.61) |
|
III | 63 (14.25) |
| IV | 17 (3.84) |
|
Unknown | 28 (6.33) |
|
| C, External
cohort (n=246) |
|
|
Characteristic | n (%) |
|
| Age |
|
| <65
years | 178 (72.36) |
| >65
years | 68 (27.64) |
| Status |
|
|
Alive | 174 (70.73) |
|
Dead | 52 (21.14) |
|
Unknown | 20 (8.13) |
| Sex |
|
|
Female | 130 (52.85) |
|
Male | 116 (47.15) |
| Stage |
|
| I | 168 (68.29) |
| II | 58 (23.58) |
|
III | 0 (0.00) |
| IV | 0 (0.00) |
|
Unknown | 20 (8.13) |
Analysis of single-cell data
The LUAD cell cluster, cell annotation and
differentially expressed gene (DEG) data for each cluster were
obtained from the Tumor Immune Single-cell Hub 2 (TISCH2) database
(www.tisch.comp-genomics.org/), which
was derived from the GSE131907 cohort (16) and a total of 203,298 cells from 44
patients. The Seurat package was used for clustering analysis using
the FindClusters function, and cell distribution was visualized in
a two-dimensional space using the RunTSNE function. R software
(version 4.3.2; http://www.r-project.org/) was used to screen for
marker genes in plasma cells.
Identification of PCIGs
PCIGs were identified as genes commonly expressed
among immune-related genes and plasma cell marker genes. The R
package ‘VennDiagram’ was utilized to determine the intersection,
and a Venn diagram was generated to visualize the PCIGs.
Enrichment analysis and
protein-protein interaction (PPI) networks
Considering the aforementioned PCIGs, an exploration
of potential molecular mechanisms was initiated using Gene Ontology
(GO) enrichment and Kyoto Encyclopedia of Genes and Genomes (KEGG)
pathway analyses. These analyses were performed utilizing the R
packages ‘clusterProfiler’ and ‘org.Hs.eg.db’. GO and KEGG terms
exhibiting a significance level of P<0.05 were visually
represented using the ‘circlize’ R package. To further assess the
protein-level mechanisms and associations, the STRING database
(www.cn.string-db.org/) was used to
elucidate the PPI relationships among the PCIGs. Subsequently,
these interactions were depicted through a network diagram.
Furthermore, R software was utilized to construct a histogram
illustrating the core genes identified in the analysis.
Identification of prognostic
genes
The R packages ‘limma’ and ‘sva’ were used to
determine the intersection of TCGA cohort and the GEO cohort to
obtain the expression information of the intersecting genes in the
two cohorts. Subsequently, the genes commonly expressed between the
PCIGs and the intersection genes were identified. Univariate Cox
hazard analysis was performed to identify prognosis-related genes
using the R packages ‘survival’ and ‘survminer’ (P<0.05). After
identifying prognosis-related genes, the genes were visualized by
generating forest plots.
Construction and validation of the
model
Initially, the TCGA cohort was designated as the
training cohort and the GEO cohort as the testing cohort. Least
absolute shrinkage and selection operator (LASSO) regression and
multivariate Cox regression analysis were performed to construct a
risk assessment model. LASSO regression analysis is a method used
to analyze high-dimensional data and is often applied to construct
regression models (17). The R
package ‘glmnet’ was utilized to effectively reduce the number of
genes in the final risk model. The risk scores for both the
training and test cohorts were derived based on the model format.
The risk score calculation followed the following formula: Risk
score=coefficient (gene 1) × expression (gene 1) + coefficient
(gene 2) × expression (gene 2) + coefficient (gene 3) × expression
(gene 3) + … + coefficient (gene n) × expression (gene n). Risk
scores exceeding the median were classified as high risk, whilst
those below the median were classified as low risk. Following this
classification, univariate and multivariate independent prognostic
analyses were performed to assess the independence of the model
compared with other clinical features.
Subsequently, the R packages ‘survminer’ and
‘survival’ were used to construct Kaplan-Meier survival curves for
the training and test cohorts, which depended on survival duration
and survival status. In addition, the R package ‘timeROC’ was
utilized to generate a receiver operating characteristic (ROC)
curve to evaluate the efficacy of risk scores in predicting 1-, 3-
and 5-year survival in patients with LUAD. Based on this, a
nomogram was developed to further facilitate survival prediction.,
considering factors such as age, risk, sex and disease stage.
Furthermore, a ROC curve based on the nomogram, decision curve
analysis (DCA) and calibration curve were generated to further
confirm the predictive accuracy of the nomogram (18). Additionally, the GSE31210 cohort was
used as an independent external cohort to validate the prognostic
model.
Finally, Kaplan-Meier curves were constructed for 9
PCIGs to evaluate the prognosis of the high- and low-risk groups
under different gene subgroups.
Gene Set Enrichment Analysis (GSEA). GSEA was
used to evaluate the enriched pathways, and the R packages ‘limma’,
‘org.Hs.eg.db’, ‘clusterProfiler’ and ‘enrichplot’ were used to
generate GSEA enrichment maps. The five most significant pathways
were then delineated in the high- and low-risk groups (19).
TME analysis
The R package ‘ESTIMATE’ was used to analyze the
stromal score, immune score and ESTIMATE score. Following this, a
comparison was made between the high- and low-risk groups to
identify any differences in these scores. Subsequently, the R
packages ‘GSVA’ and ‘GSEABase’ were utilized to perform
single-sample GSEA. This analysis enabled the elucidation of the
differences in the infiltration of major immune cells between the
high- and low-risk groups. The same analysis was then used to
evaluate the variances in immune-related functions.
TMB
To assess the gene mutations in tumor cells in each
sample, TMB data for LUAD was obtained from TCGA database
(www.portal.gdc.cancer.gov/). The data
was manipulated using the ‘TCGAbiolinks’ package and waterfall
plots were constructed using the R programming language ‘maftools’,
after which the TMB was calculated (20,21).
Treatment response prediction
The association between the risk score and
ICI-related gene expression levels were evaluated, and the R
package ‘ggplot2’ was used for visualization. According to the
tumor expression profiles downloaded from the database (http://tide.dfci.harvard.edu/), the Tumor Immune
Dysfunction and Exclusion (TIDE) score could be used as a
transcriptomic biomarker to predict the response to immune
checkpoint blockade and to explore the potential clinical efficacy
of immunotherapy. Moreover, to assess the sensitivity of several
risk groups to chemotherapy drugs, the R package ‘OncoPredict’ was
utilized to forecast the disparity in the treatment outcomes of
chemotherapy drugs among high- and low-risk patients (22).
Clinical correlation analysis
The clinicopathological features of patients were
then obtained from TCGA cohort to assess the linkages between
clinical features and the risk score, and a heatmap was generated
utilizing the R package ‘ComplexHeatmap’. Moreover, the R packages
‘reshape2’, ‘tidyverse’, ‘ggplot2’, ‘RColorBrewer’ and ‘grid’ were
used to construct a cyclic graph of clinical correlations. This
enabled the evaluation of disparities in clinical characteristics
between the high- and low-risk groups. Subsequently, the
associations between each clinical characteristic and the risk
score were assessed individually.
Validation by reverse
transcription-quantitative PCR (RT-qPCR)
TRIzol™ reagent (Thermo Fisher Scientific, Inc.) was
used to extract total RNA from normal human lung epithelial BEAS-2B
cells and human LUAD H1373 and H1563 cell lines. Reverse
transcription was performed using the PrimeScript™ RT Reagent Kit
(Takara Bio, Inc.) at 42°C for 30 min, followed by inactivation at
85°C for 5 min. SYBR Green Master Mix (GeneCopoeia, Inc.) was used
for qPCR. PCR amplification was initiated with an initial
denaturation step at 95°C for 5 min, followed by 40 cycles
consisting of 95°C for 15 sec (denaturation), 60°C for 30 sec
(annealing) and 72°C for 30 sec (extension). A final extension step
was performed at 72°C for 5 min. mRNA expression levels were
normalized to GAPDH mRNA levels and the 2−ΔΔCq method
(23) was used for calculating the
relative expression of mRNAs. All primers were purchased from
Takara Biomedical Technology (Beijing) Co., Ltd.; Takara Bio Inc.,
and Table SI presents the forward
and reverse primers used for RT-qPCR, including PCIGs and primers
for normalization control (National Center for Biotechnology
Information reference sequence, NM_002046.7).
Immunohistochemical analysis
Finally, immunohistochemical images of selected
PCIGs were obtained from the Human Protein Atlas (HPA) database
(www.proteinatlas.org/) (24), which is a comprehensive resource
that provides high-resolution images and detailed data on protein
expression in normal tissues, cancer tissues and cell lines. Based
on the obtained images, the differences in the protein expression
levels of selected PCIGs between lung cancer tissues and normal
lung tissues were evaluated by assessing staining intensity and
positive cell proportion provided in the HPA database.
Statistical analysis
Statistical analyses were performed using R, version
4.3.2. The Kruskal-Wallis test was used for comparing multiple
groups, followed by Dunn's test for post hoc comparisons, with
Bonferroni correction when applicable. For comparisons between two
groups, the Wilcoxon rank-sum test was employed. Pearson
correlation was used for evaluating the correlation between
continuous variables. The Log-rank test was used to evaluate
survival differences using Kaplan-Meier curves, with statistical
significance defined as P<0.05. LASSO regression and Cox
regression analyses were utilized to develop the prediction model.
All data are presented as mean ± standard deviation. For each
experiment, three replicates were performed per sample to ensure
reproducibility. P<0.05 was considered to indicate a
statistically significant difference.
Results
Identification of PCIGs
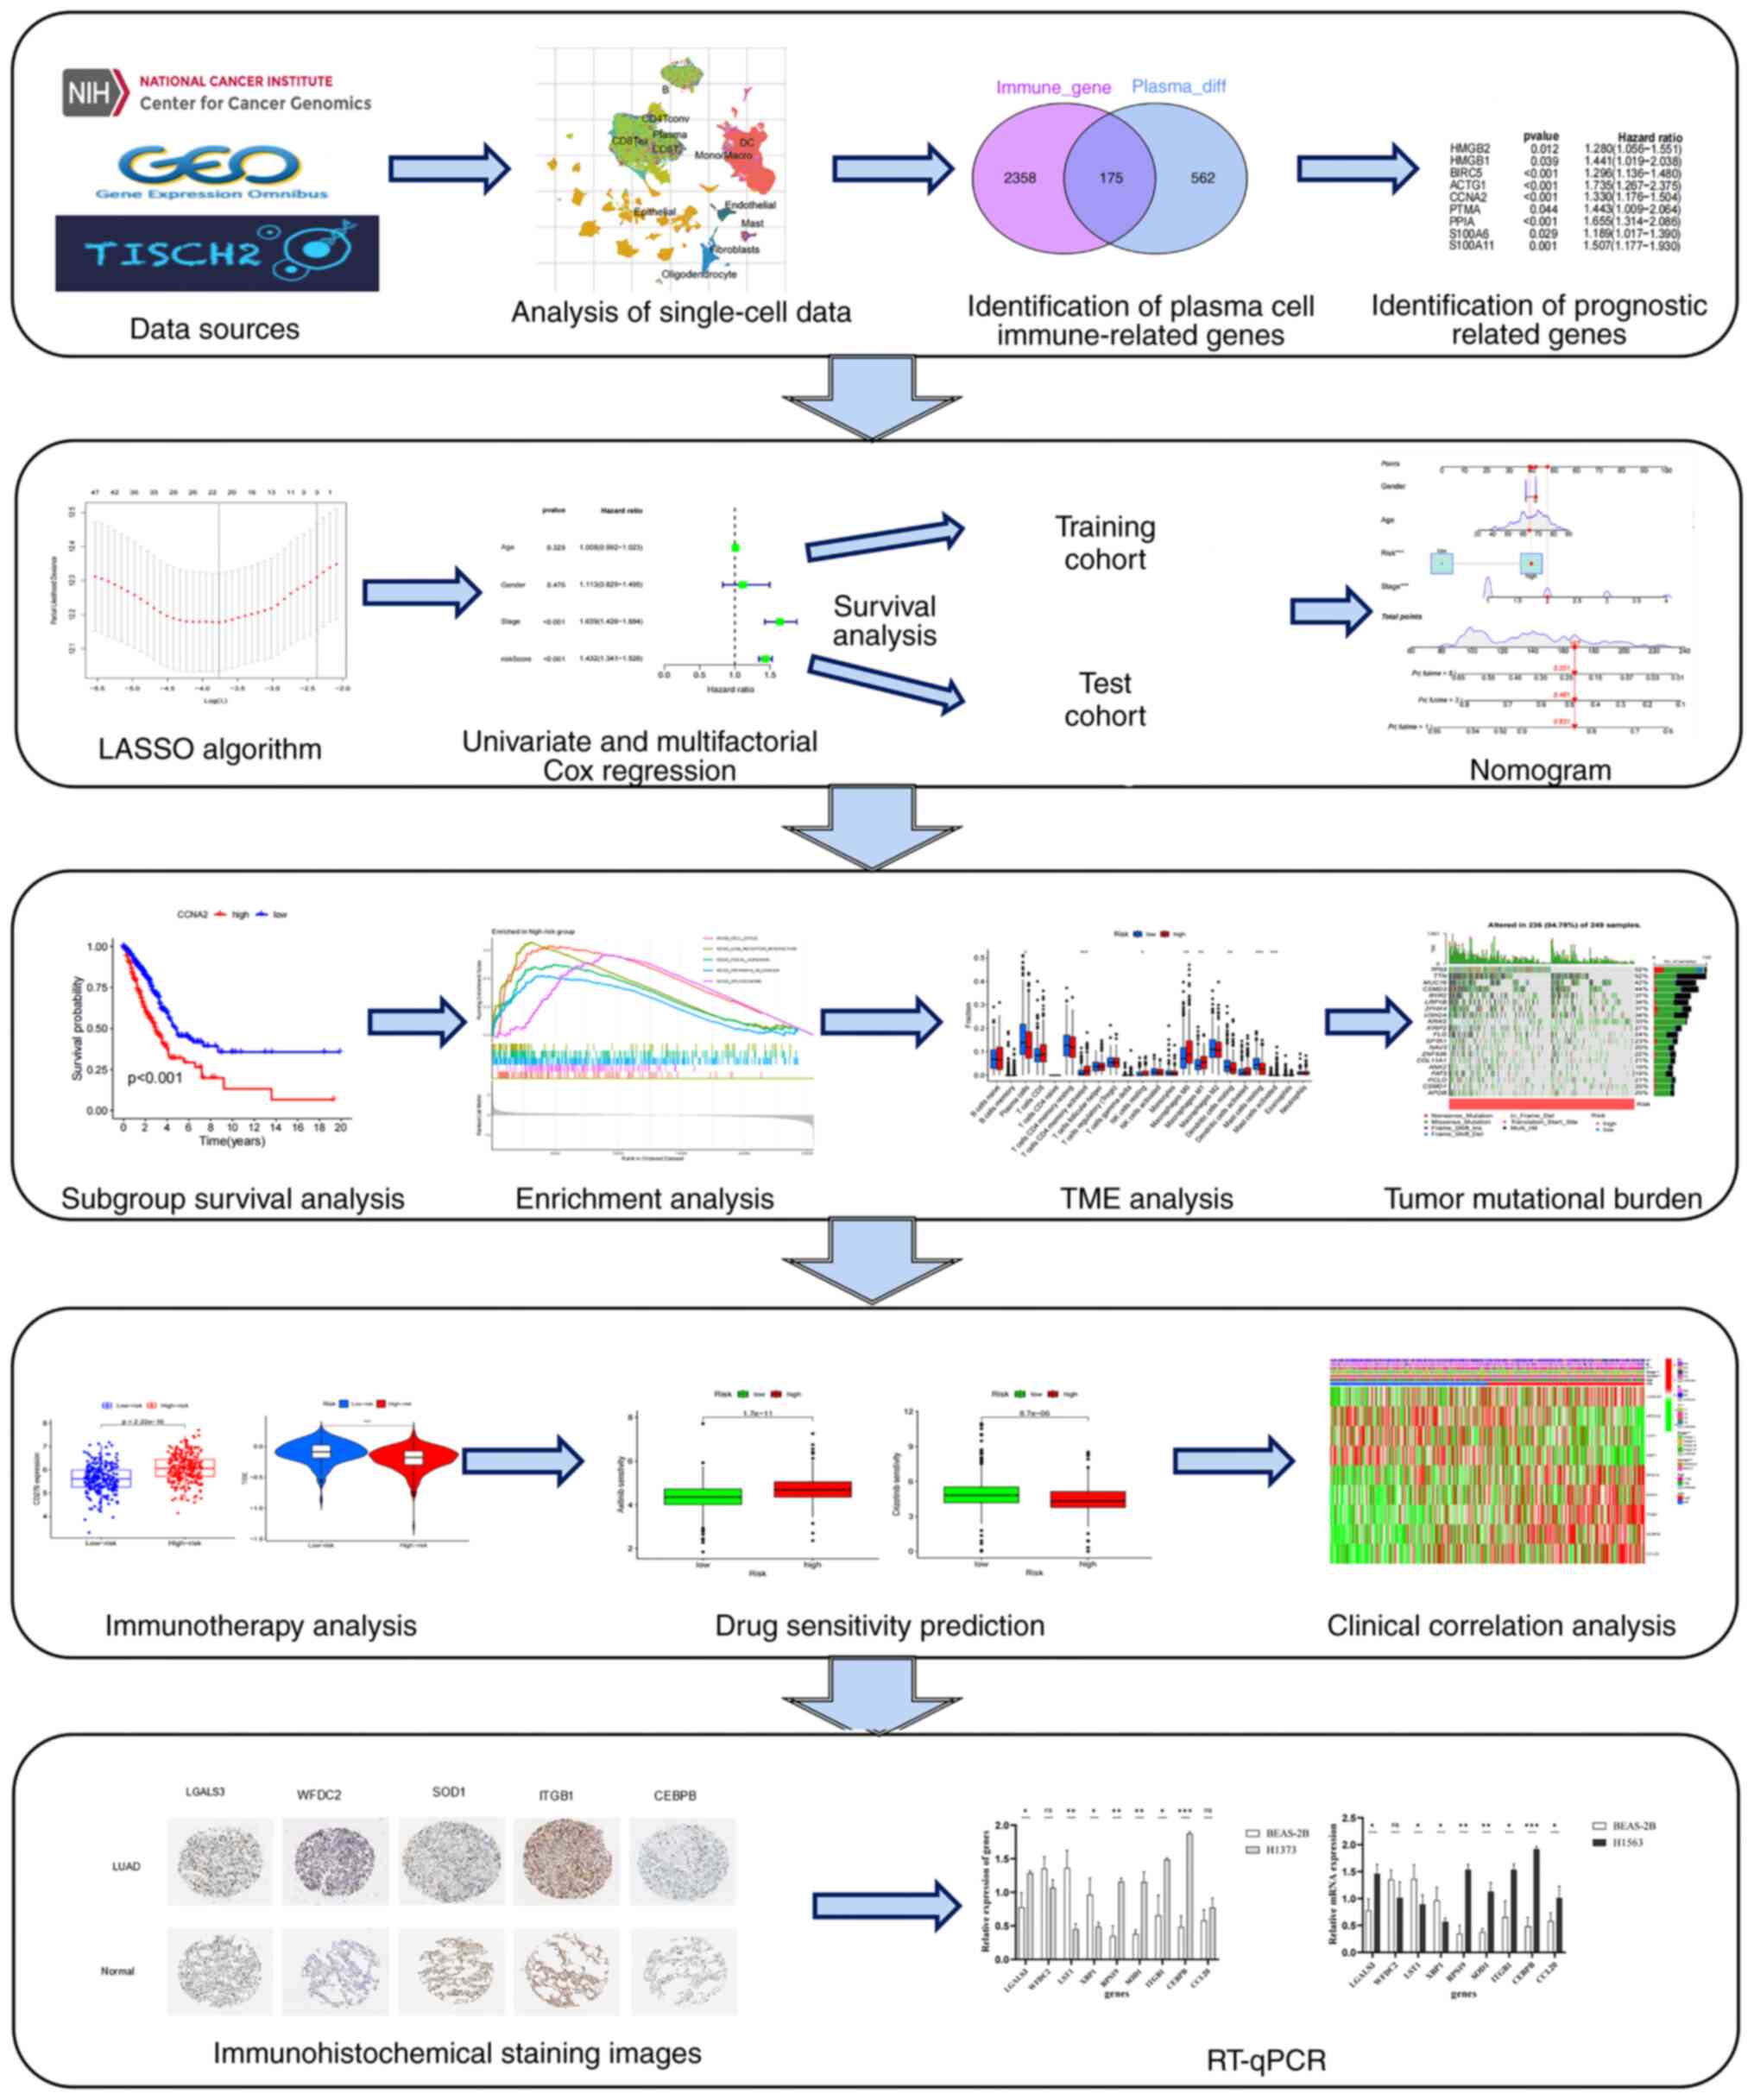
Fig. 1 presents the
flow chart of the present study. Human immune-related genes were
obtained from the ‘ImmPort’ and ‘InnateDB’ databases, and the data
sets were merged, identifying 2,533 genes. The gene expression
profiles of 203,298 cells from 44 LUAD samples were subsequently
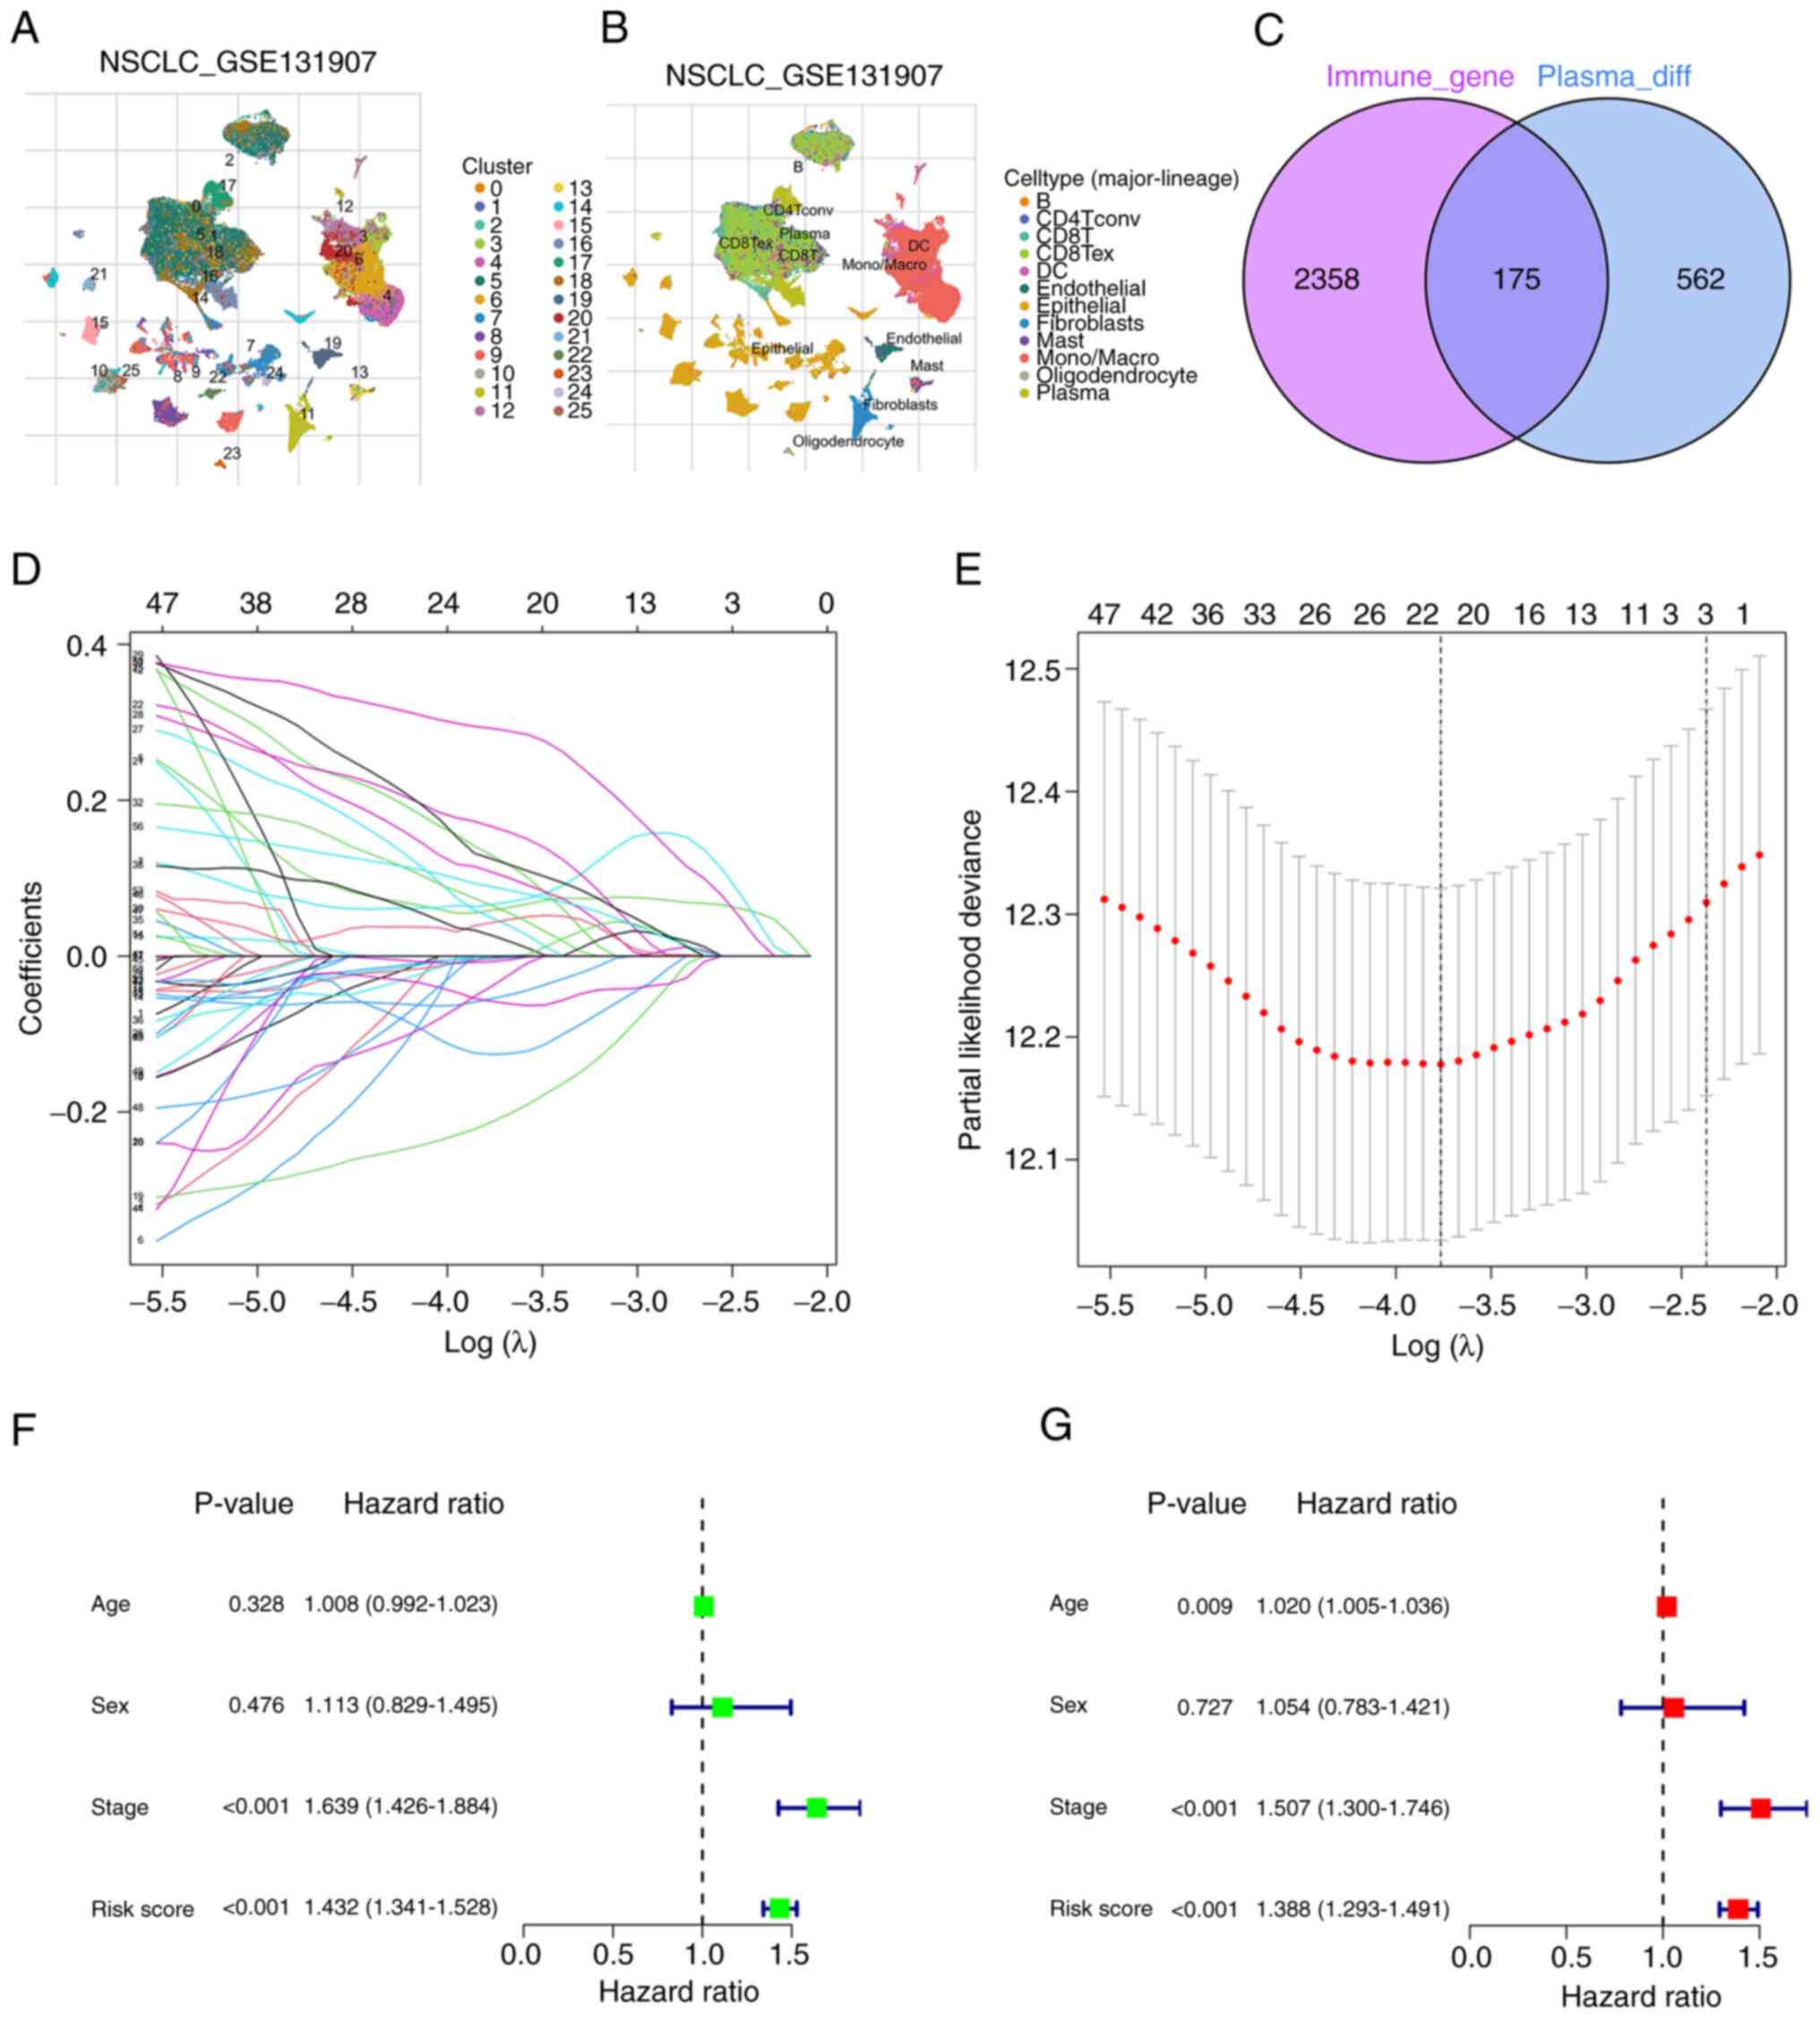
obtained from the TISCH database (GSE131907). The cell clustering
and annotation results revealed that cells with similar
differential gene expression patterns were grouped into distinct
clusters (Fig. 2A and B). scRNA-seq
data was then utilized to perform cell clustering based on
differential gene expression profiles. A total of 25 clusters were
identified, and each cluster was named according to the expression
of specific marker genes. For example, clusters 16 and 17 were
identified as plasma cells, whilst clusters 3 and 4 were identified
as macrophages. Notably, clusters 16 and 17, characterized as
plasma cells, exhibited distinct profiles of DEGs (Table SII). To further elucidate the
cellular origins of the DEGs identified in the GSE131907 dataset,
in the detailed annotations of the relevant plasma cells were
summarized to clarify their contributions to the gene expression
profiles analyzed in the present study (Table SIII). Additionally, cluster 0 was
identified as B cells, and 737 marker genes were obtained for the
plasma cells. The study involved the analysis of the overlap
between plasma cell marker genes and human immune-related genes,
and 175 common DEGs were identified (Table SIV). A Venn diagram was generated
to visualize the distribution of these genes (Fig. 2C), and these genes are referred to
as PCIGs.
Enrichment analysis and PPI
network
GO enrichment analysis of the DEGs revealed that
biological processes were involved mainly in microtubule-based
movement, humoral immune response and defense response to bacteria.
The most representative cellular component terms were the
collagen-containing extracellular matrix (ECM), immunoglobulin
complex and external side of the plasma membrane. Among the
molecular functions, signaling receptor activator activity,
receptor ligand activity and glycosaminoglycan binding were the
main categories (Fig. S1A and B).
According to the KEGG analysis, the model may be associated with
complement and coagulation cascades, arachidonic acid metabolism,
hematopoietic cell lineage and linoleic acid metabolism (Fig. S1C and D). Based on the data and
images acquired from the STRING database, the PPIs of the PCIGs
were analyzed (Fig. S2A), and the
core gene histogram demonstrated that the IL-1B gene had the
highest number of adjacent nodes compared to the other top 30 core
genes (Fig. S2B).
Identification of plasma cell
prognosis-related genes
The intersection of the TCGA and GEO cohorts
(GSE72094) were utilized to acquire expression data for the common
genes present in both cohorts. Subsequently, genes that were
commonly expressed between the PCIGs and the intersection genes
were identified. Among all PCIGs sources, including primary tumors,
lymph nodes, brain metastases, pleural effusions, and normal lung
tissues and lymph nodes, co-expressed genes were extracted from the
TCGA and GEO cohorts. In the GEO cohort, all tested genes were
derived from tumor tissues of LUAD, whilst in the TCGA cohort,
normal tissue samples were omitted. Therefore, the final screened
PCIGs consisted only of genes differentially expressed in tumor
tissues. A univariate Cox hazard analysis was then performed based
on the survival data of the aforementioned co-expressed genes to
identify the genes associated with prognosis (Table SV and Fig. S2C).
Construction and validation of the
prognostic model
After LASSO regression analysis (Fig. 2D and E) and multivariate Cox
regression analysis, 9 PCIGs were identified, namely, galectin-3
(LGALS3), WAP four-disulfide core domain 2 (WFDC2), leukocyte
specific transcript 1 (LST1), X-box binding protein 1 (XBP1),
ribosomal protein S19 (RPS19), superoxide dismutase 1 (SOD1),
integrin β1 (ITGB1), CCAAT enhancer binding protein β (CEBPB) and
C-C motif chemokine ligand 20 (CCL20) (Table SVI). The high-risk group was
defined as individuals with risk scores above the median, whilst
the low-risk group was defined as individuals with risk scores
below the median (Table II). The
risk assessment model was subsequently subjected to univariate and
multivariate independent prognostic analysis (Table SVII). The results demonstrated that
the risk score could predict patient prognosis independent of other
clinical characteristics (Fig. 2F and
G).
| Table II.Clinical information of the patients
with lung adenocarcinoma in the low- and high-risk groups. |
Table II.
Clinical information of the patients
with lung adenocarcinoma in the low- and high-risk groups.
| A, Low risk group
(n=254) |
|---|
|
|---|
| Characteristic | n (%) |
|---|
| Age |
|
| ≤65
years | 120 (47.24) |
| >65
years | 128 (50.39) |
|
Unknown | 6 (2.36) |
| Sex |
|
|
Female | 155 (61.02) |
|
Male | 99 (38.98) |
| Status |
|
|
Alive | 187 (73.62) |
|
Dead | 67 (26.38) |
| Stage |
|
| I | 163 (64.17) |
| II | 52 (20.47) |
|
III | 27 (10.63) |
| IV | 9 (3.54) |
|
Unknown | 3 (1.18) |
| T stage |
|
| T1 | 102 (40.16) |
| T2 | 131 (51.57) |
| T3 | 16 (6.30) |
| T4 | 3 (1.18) |
|
Unknown | 2 (0.79) |
| N stage |
|
| N0 | 178 (70.08) |
| N1 | 41 (16.14) |
| N2 | 25 (9.84) |
| N3 | 0 (0) |
|
Unknown | 10 (3.94) |
| M stage |
|
| M0 | 168 (66.14) |
| M1 | 8 (3.15) |
|
Unknown | 78 (30.71) |
|
| B, High risk
group (n=253) |
|
|
Characteristic | n (%) |
|
| Age |
|
| ≤65
years | 119 (47.04) |
| >65
years | 130 (51.38) |
|
Unknown | 4 (1.58) |
| Sex |
|
|
Female | 117 (46.25) |
|
Male | 136 (53.75) |
| Status |
|
|
Alive | 137 (54.15) |
|
Dead | 116 (45.85) |
| Stage |
|
| I | 109 (43.08) |
| II | 68 (26.88) |
|
III | 54 (21.34) |
| IV | 17 (6.72) |
|
Unknown | 5 (1.98) |
| T stage |
|
| T1 | 67 (26.48) |
| T2 | 140 (55.34) |
| T3 | 39 (15.42) |
| T4 | 16 (6.32) |
|
Unknown | 1 (0.40) |
| N stage |
|
| N0 | 149 (58.89) |
| N1 | 54 (21.34) |
| N2 | 46 (18.18) |
| N3 | 2 (0.79) |
|
Unknown | 2 (0.79) |
| M stage |
|
| M0 | 170 (67.19) |
| M1 | 17 (6.72) |
|
Unknown | 66 (26.09) |
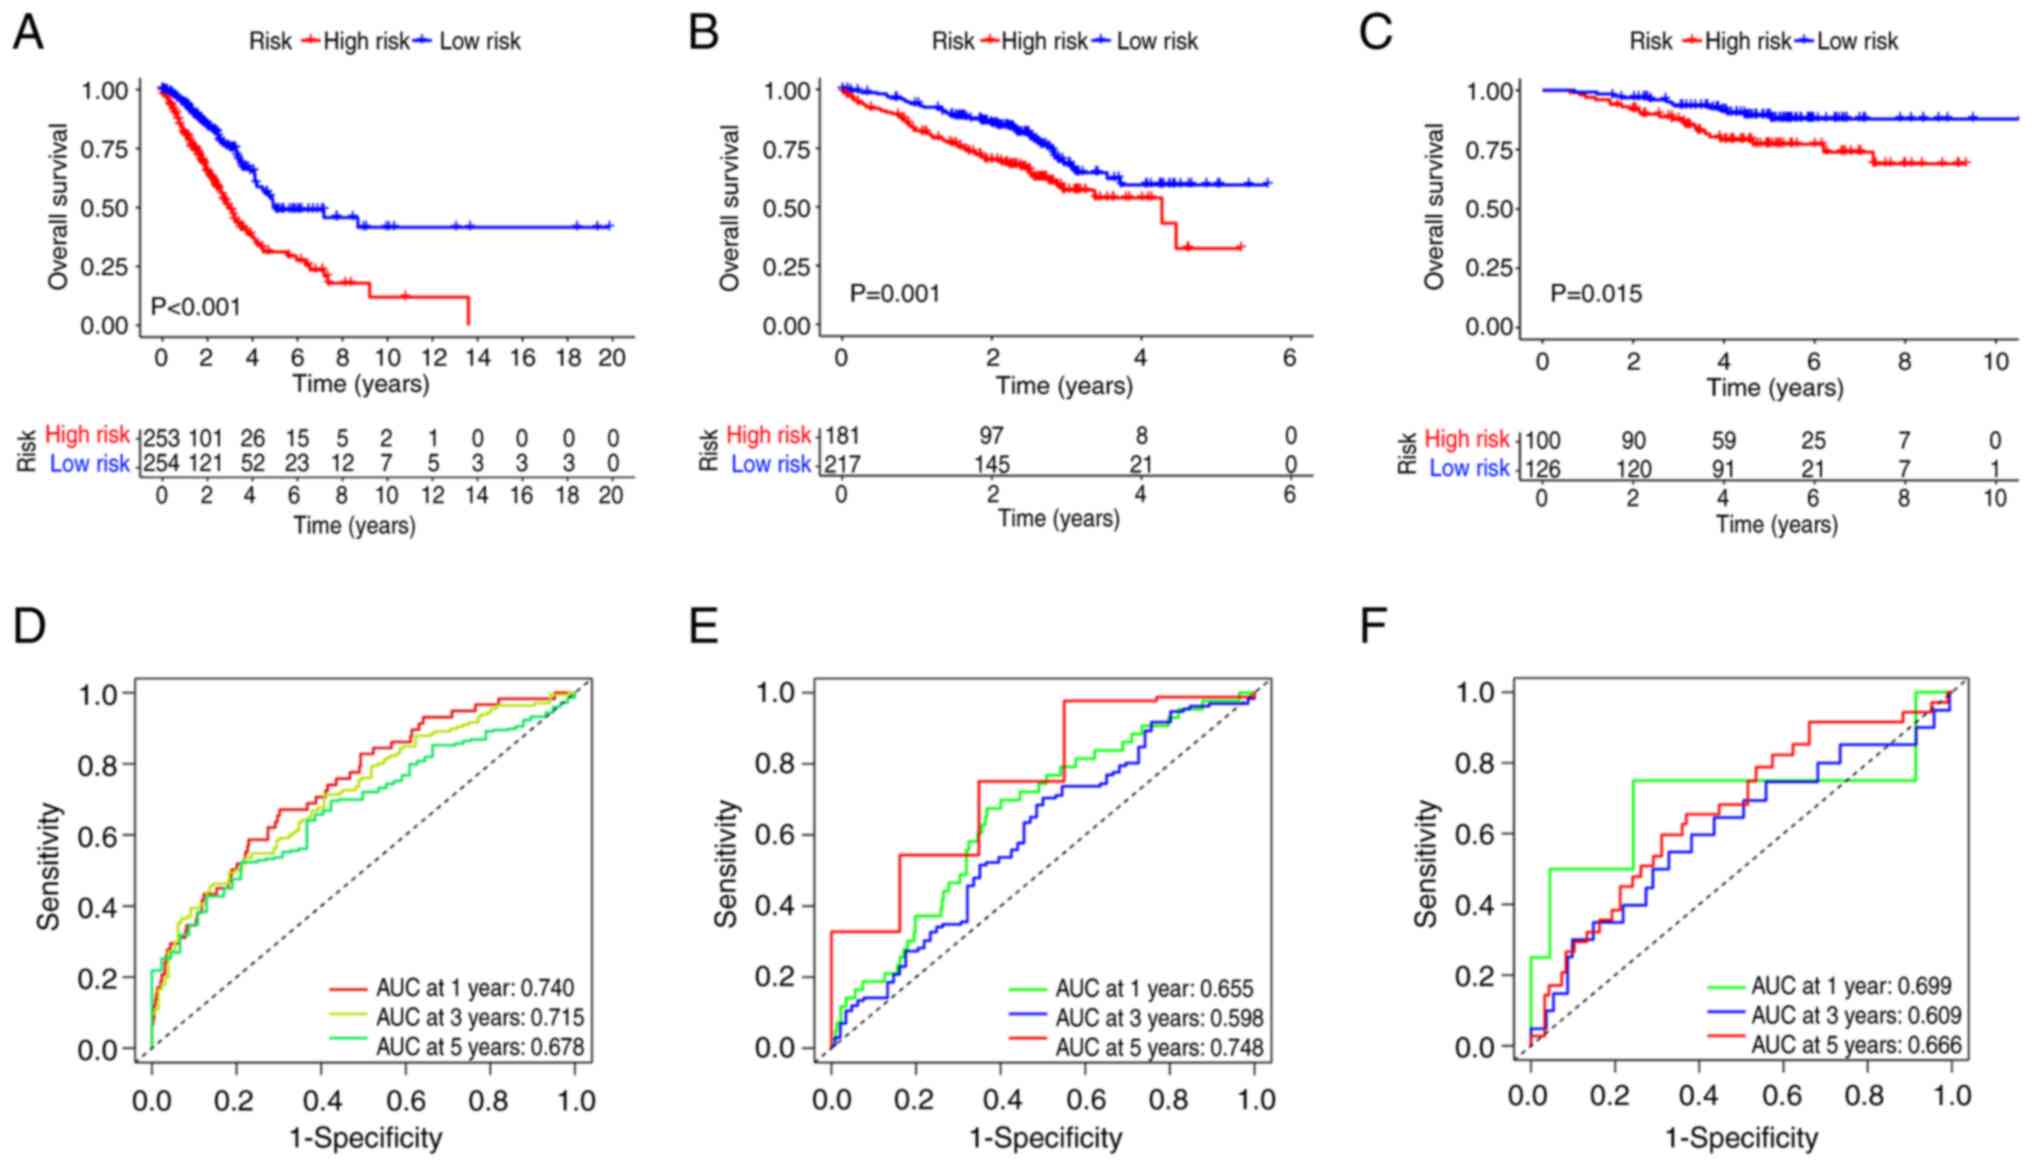
Considering the TCGA cohort as the training cohort
and the GEO cohort as the test cohort, the high-risk group in the
training cohort exhibited significantly worse survival than that of
the low-risk group. This trend was also observed in the test cohort
(Fig. 3A and B). The predictive
capability of the model for patient survival in LUAD was also
assessed. The risk score demonstrated a strong performance in
predicting the 1-, 3- and 5-year survival rates of patients with
LUAD. Specifically, in the training cohort, the area under the
curve (AUC) values were 0.740, 0.715 and 0.678 at 1, 3 and 5 years,
respectively. In the test cohort, the AUC values were 0.655, 0.598
and 0.748 at 1, 3 and 5 years, respectively (Fig. 3D and E). Similar results were
observed for the GSE31210 cohort (Fig.
3C and F). Risk plots were used to illustrate the survival
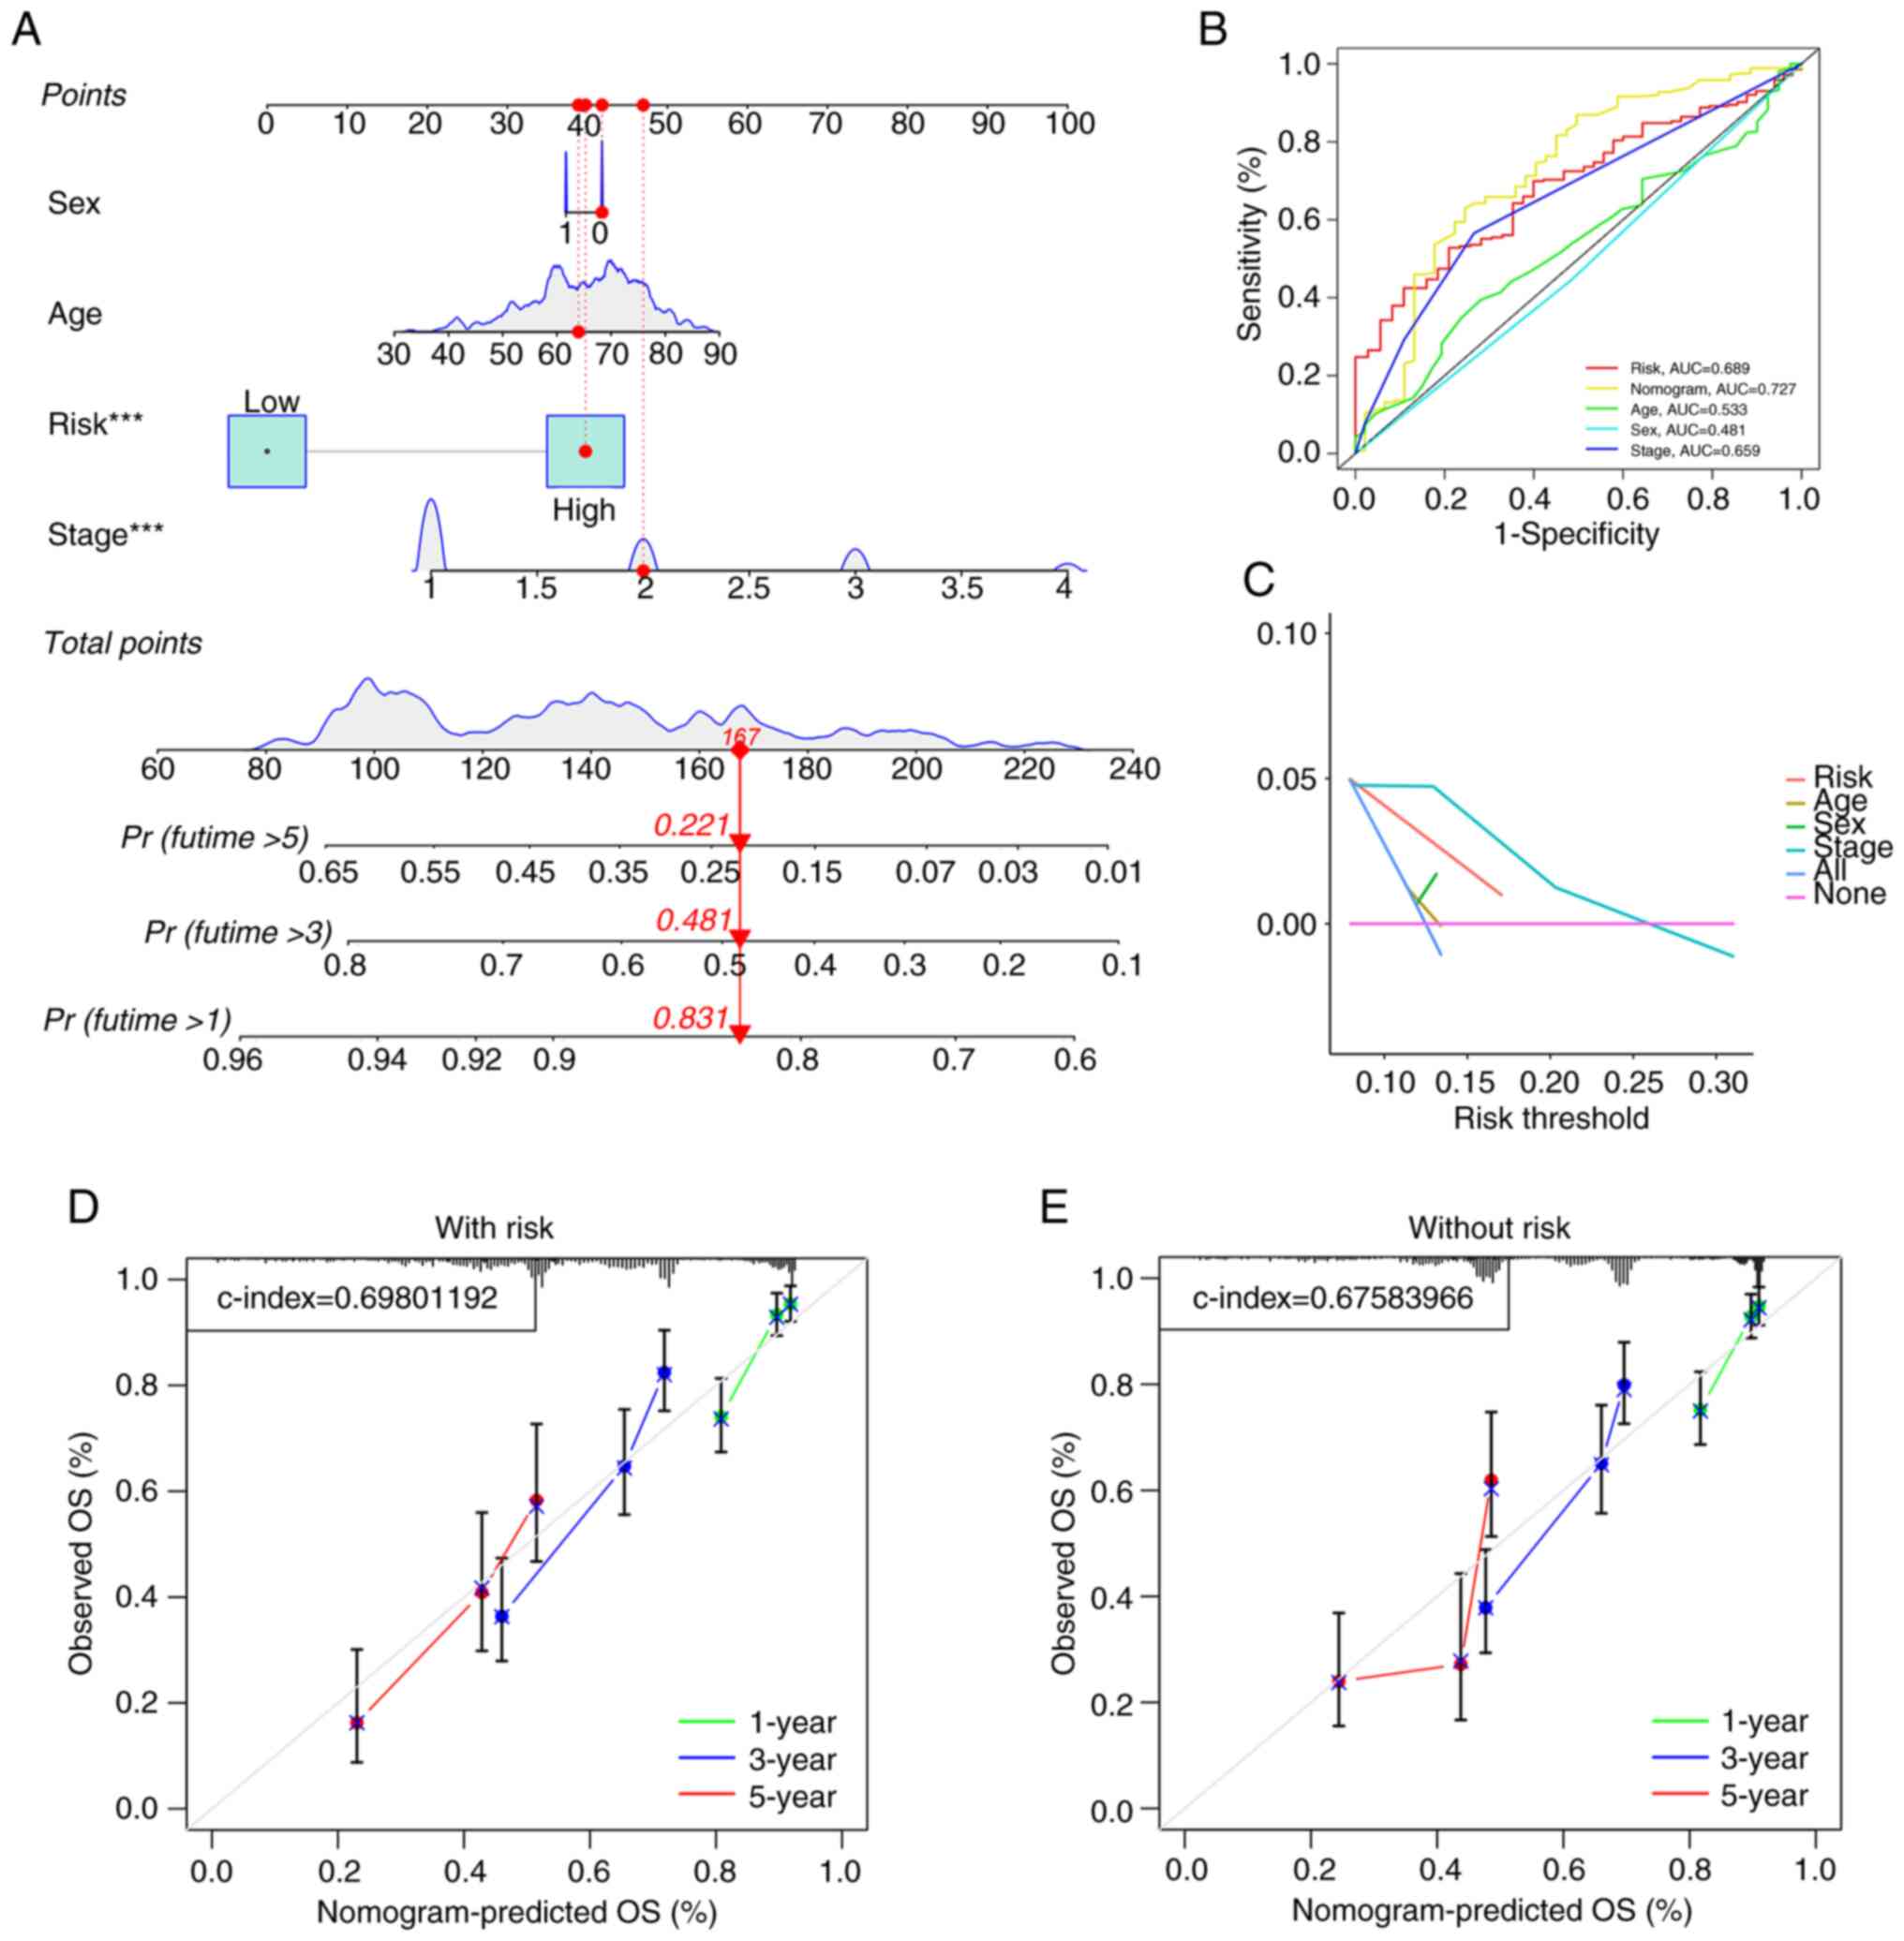
status of patients in the training and test cohorts (Fig. S3). To evaluate the predictive value
of the model, a nomogram based on age, sex, stage and risk score
was constructed (Fig. 4A), which
showed predictive value for predicting the survival of patients
with LUAD (AUC=0.727; Fig. 4B).
Additionally, to confirm the precision of the predictive impact of
the model, DCA and calibration curve assessments were performed.
The DCA results indicated that the risk score served as a reliable
predictive tool (Fig. 4C),
independent of other clinical characteristics, thereby supporting
its effectiveness. A calibration curve analysis combined with the
risk score demonstrated a greater C-index of 0.698 (Fig. 4D) compared with the C-index of
0.6758 without the risk score (Fig.
4E). These findings indicated that the model improves the
prognosis of patients with LUAD.
Additionally, survival curves were generated for
each prognostic-related gene (Table
SVIII). According to the survival curve analysis, the high-risk
group exhibited significantly worse survival outcomes for the genes
CCL20, CEBPB, ITGB1, LGALS3, RPS19 and SOD1 compared with that of
the low-risk group. Conversely, the low-risk group demonstrated
significantly worse survival outcomes for the genes LST1, WFDC2 and
XBP1 (Fig. S4). Moreover, it was
demonstrated that the survival curves for CCL20, CEBPB and LST1
intersected in the later stages. Consequently, a two-stage test was
performed, and the results revealed that the P-values for all three
genes were <0.05 (Table SIX),
leading to the rejection of the null hypothesis (namely, there is
no significant effect or relationship between gene expression and
survival time). These findings indicate that, according to
statistical tests, gene expression significantly impacts survival
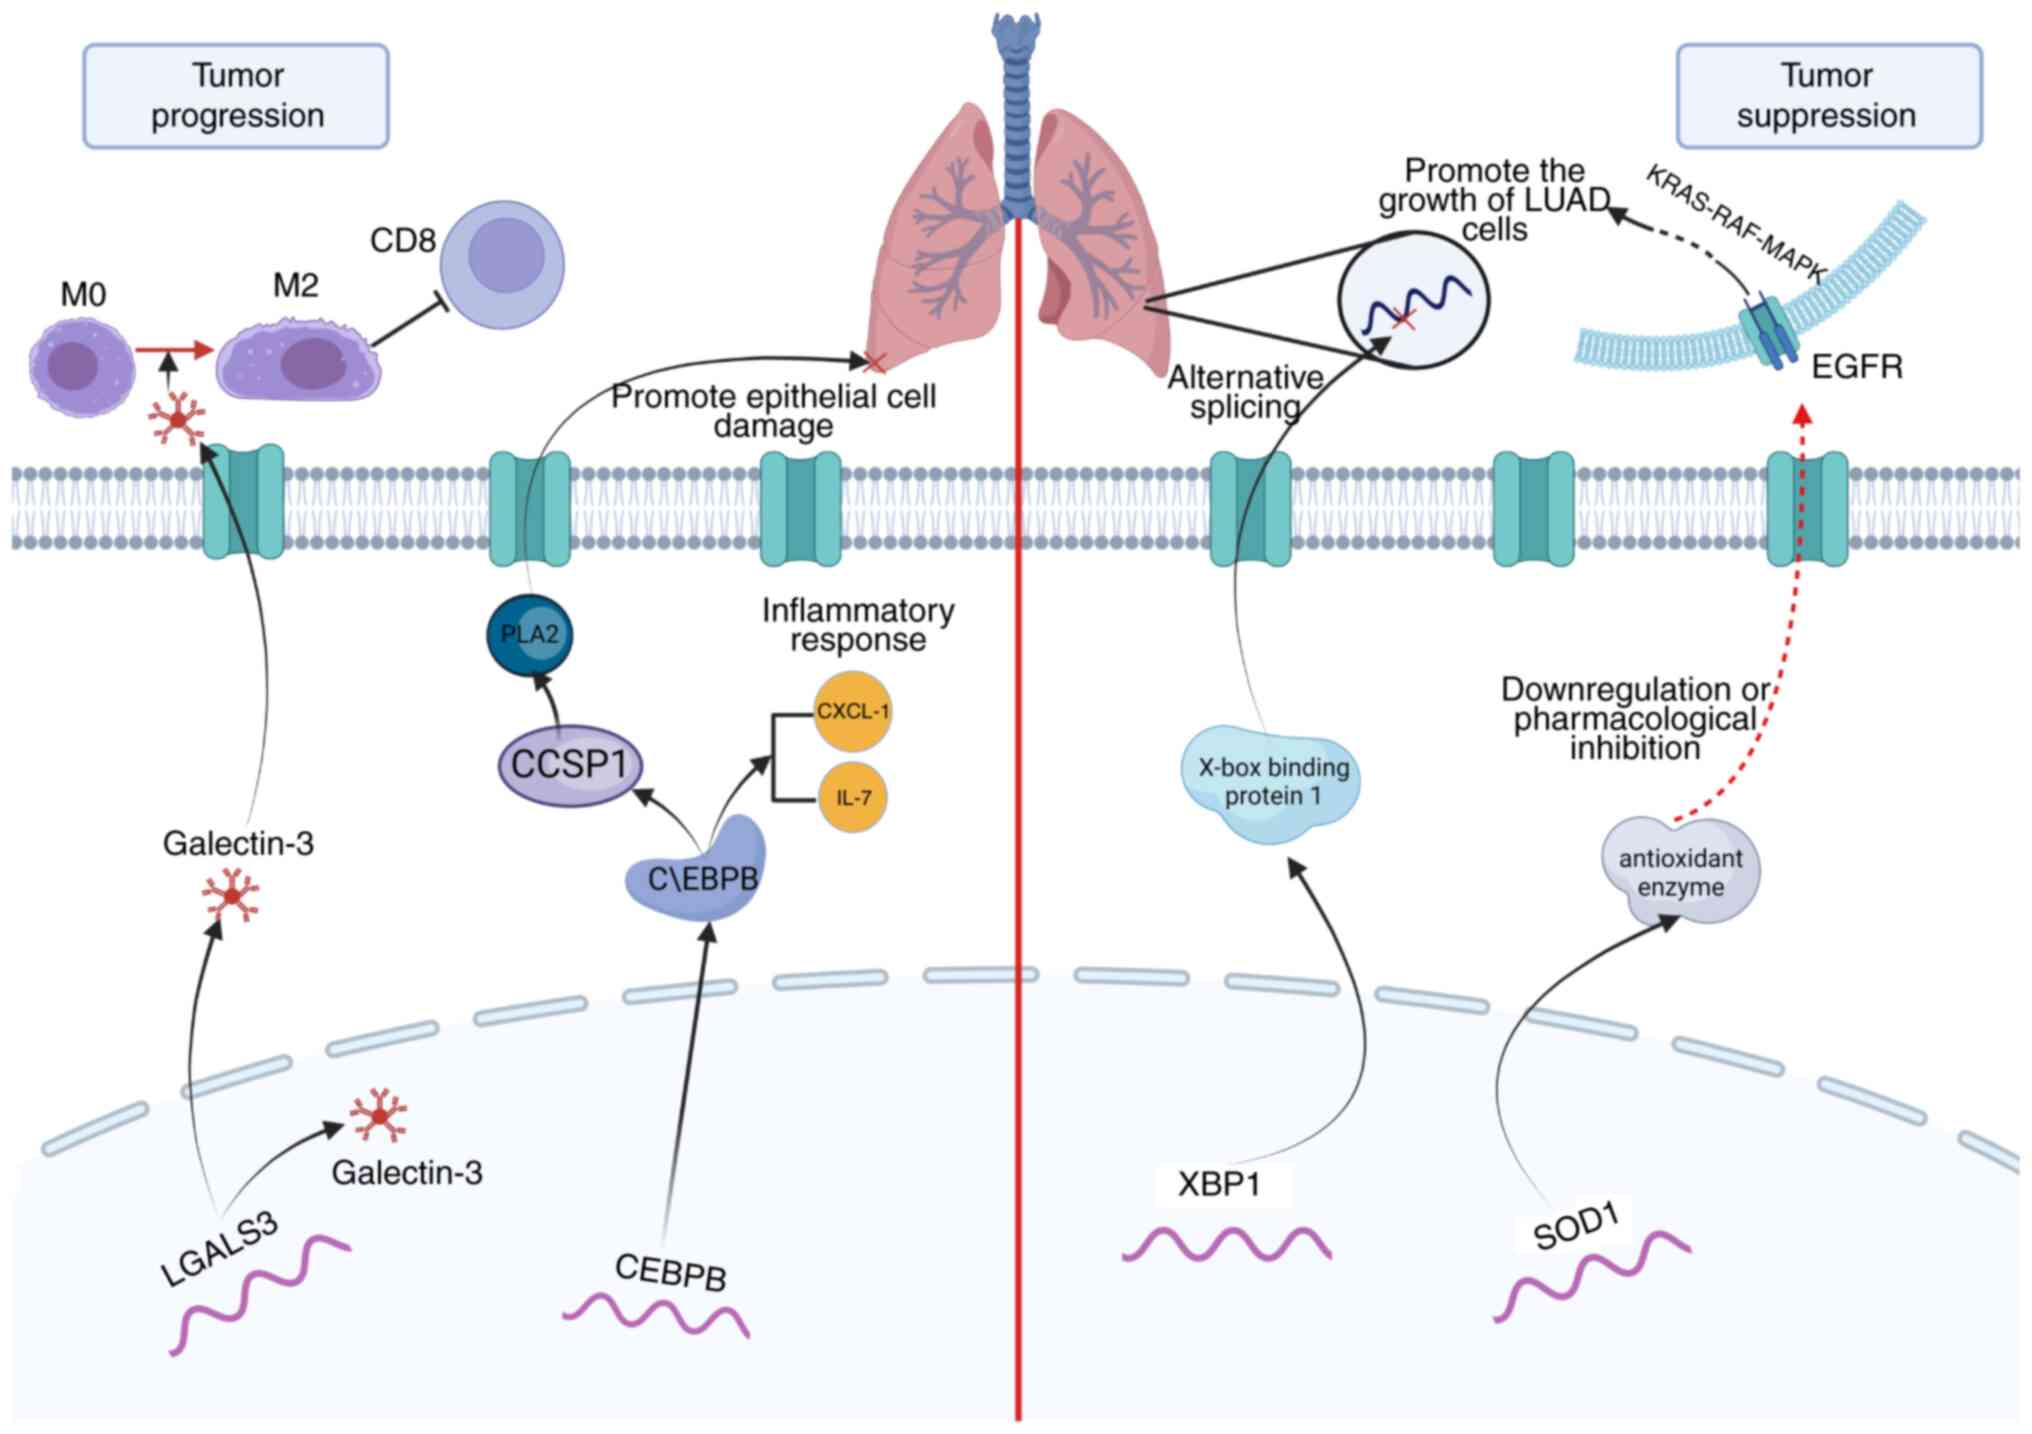
time. Furthermore, based on the PCIGs used to construct the model,
a mechanistic map of the role of several PCIGs in the progression
and obstruction of LUAD was drawn (Fig.
5).
GSEA
GSEA revealed that the cell cycle, ECM-receptor
interaction, focal adhesion, pathways in cancer and spliceosome
pathways were notably enriched in the high-risk group (Fig. 6A), whilst the B-cell receptor
signaling pathway, complement activation, immunoglobulin complex,
immunoglobulin complex circulating, immunoglobulin receptor binding
were notably enriched in the low-risk group (Fig. 6B).
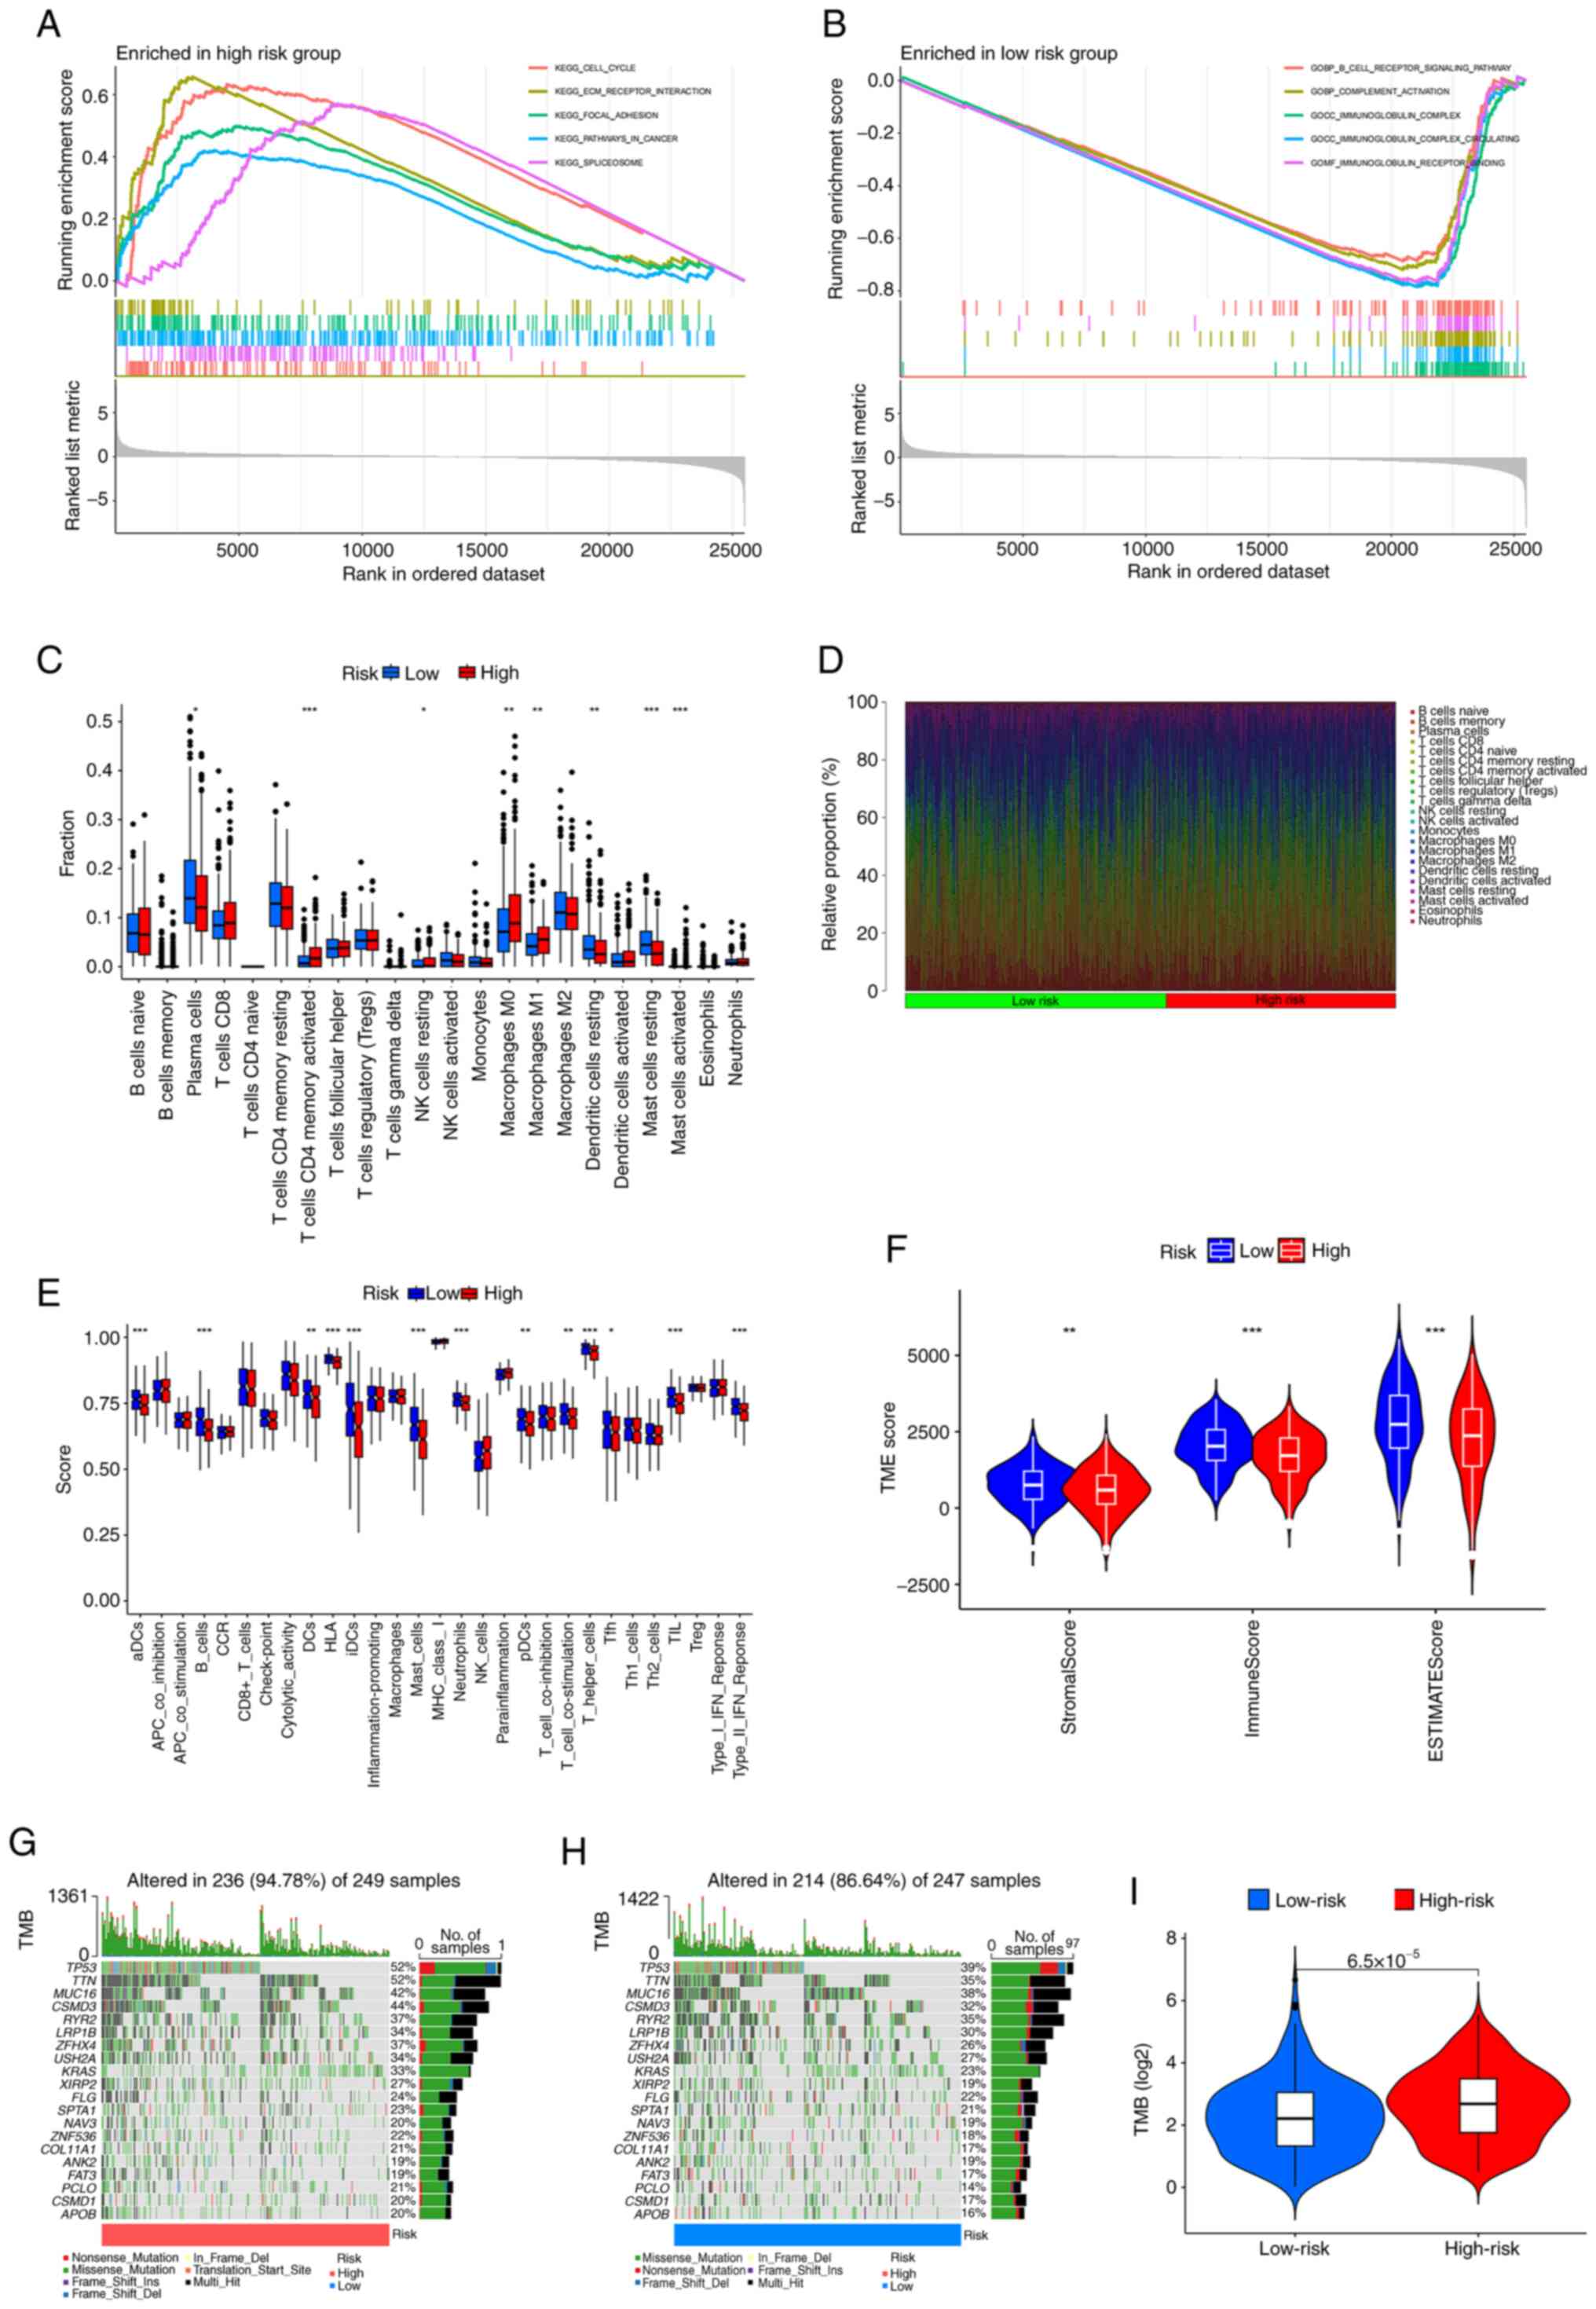 | Figure 6.GSEA, TME and TMB analyses in
different risk groups. GSEA was used to assess the biological
processes and pathways enriched in the (A) high- and (B) low- risk
groups. (C) Box plots showing the fraction of different immune
cells in the high- and low-risk groups. (D) Heatmap illustrating
the relative proportion (%) of immune cells between the high- and
low-risk groups. (E) Immune cells infiltration score and
immune-related function in the low-and high-risk groups estimated
by single sample GSEA. (F) Violin plots of differences in immune,
stromal and ESTIMATE scores. Waterfall plots summarizing the gene
mutation landscape in the (G) high- and (H) low-risk groups. (I)
TMB differences between the high-and low-risk patients. *P<0.05,
**P<0.01 and ***P<0.001 vs. low-risk. GSEA, gene set
enrichment analysis; TME, tumor microenvironment; TMB, tumor
mutation burden; KEGG, Kyoto Encyclopedia of Genes and Genomes; GO,
Gene Ontology; aDCs, activated dendritic cells; CCR, C-C motif
chemokine receptor; HLA, human leukocyte antigen; Tfh, follicular
helper T cells; TIL, tumor-infiltrating lymphocyte; TP53, tumor
protein p53; TTN, titin; MUC16, mucin 16; CSMD3, CUB and Sushi
multiple domains 3; RYR2, ryanodine receptor 2; LRP1B, LDL receptor
related protein 1B; ZFHX4, zinc finger homeobox 4; USH2A, usherin
2A; KRAS, Kirsten rat sarcoma viral oncogene homolog; XIRP2, Xin
actin binding repeat containing 2; FLG, filaggrin; SPTA1, spectrin
α erythrocytic 1; NAV3, neuron navigator 3; ZNF536, zinc finger
protein 536; COL11A1, collagen type XI α1 chain; ANK2, ankyrin 2;
FAT3, FAT atypical cadherin 3; PCLO, piccolo presynaptic cytomatrix
protein; APOB, apolipoprotein B; iDCs, immature dendritic
cells. |
TME analysis
Analysis of immune cell infiltration revealed that
the high-risk group exhibited greater invasion of T cells activated
by CD4 memory cells, resting natural killer cells, M0 macrophages,
M1 macrophages and activated mast cells than the low-risk group,
whilst resting dendritic cells and resting mast cells showed
greater invasion in the low-risk group than in the high-risk group
(Fig. 6C and D). Subsequently,
variations in immune-related functions were assessed across
different risk groups. Significant differences were observed in
activated dendritic cells, B cells, human leukocyte antigen,
immature dendritic cells, mast cells, neutrophils, T helper cells,
tumor-infiltrating lymphocytes and the type II interferon response,
all of which were enriched in the low-risk group (Fig. 6E). In addition, TME analysis
suggested that the stromal score, immune score and ESTIMATE score
were significantly greater in the low-risk group than in the
high-risk group (Fig. 6F),
suggesting that there may be a higher presence of tumor cells in
the high-risk group.
TMB
Based on the somatic mutation data for LUAD tumors
from the TCGA database, a waterfall plot of the top 20 mutated
genes in the different groups was generated. In the high-risk
group, the five most common mutated genes were TP53 (52%), titin
(TTN; 52%), mucin-16 (MUC16; 42%), CUB and sushi multiple domains 3
(CSMD3; 44%) and ryanodine receptor 2 (RYR2; 37%). TP53 (39%), TTN
(35%), MUC16 (38%), CSMD3 (32%) and RYR2 (35%) were prone to
mutation in low-risk patients (Fig.
6G-H). Calculation of the TMB demonstrated that there was a
significant positive correlation between the TMB and the risk score
(Fig. 6I).
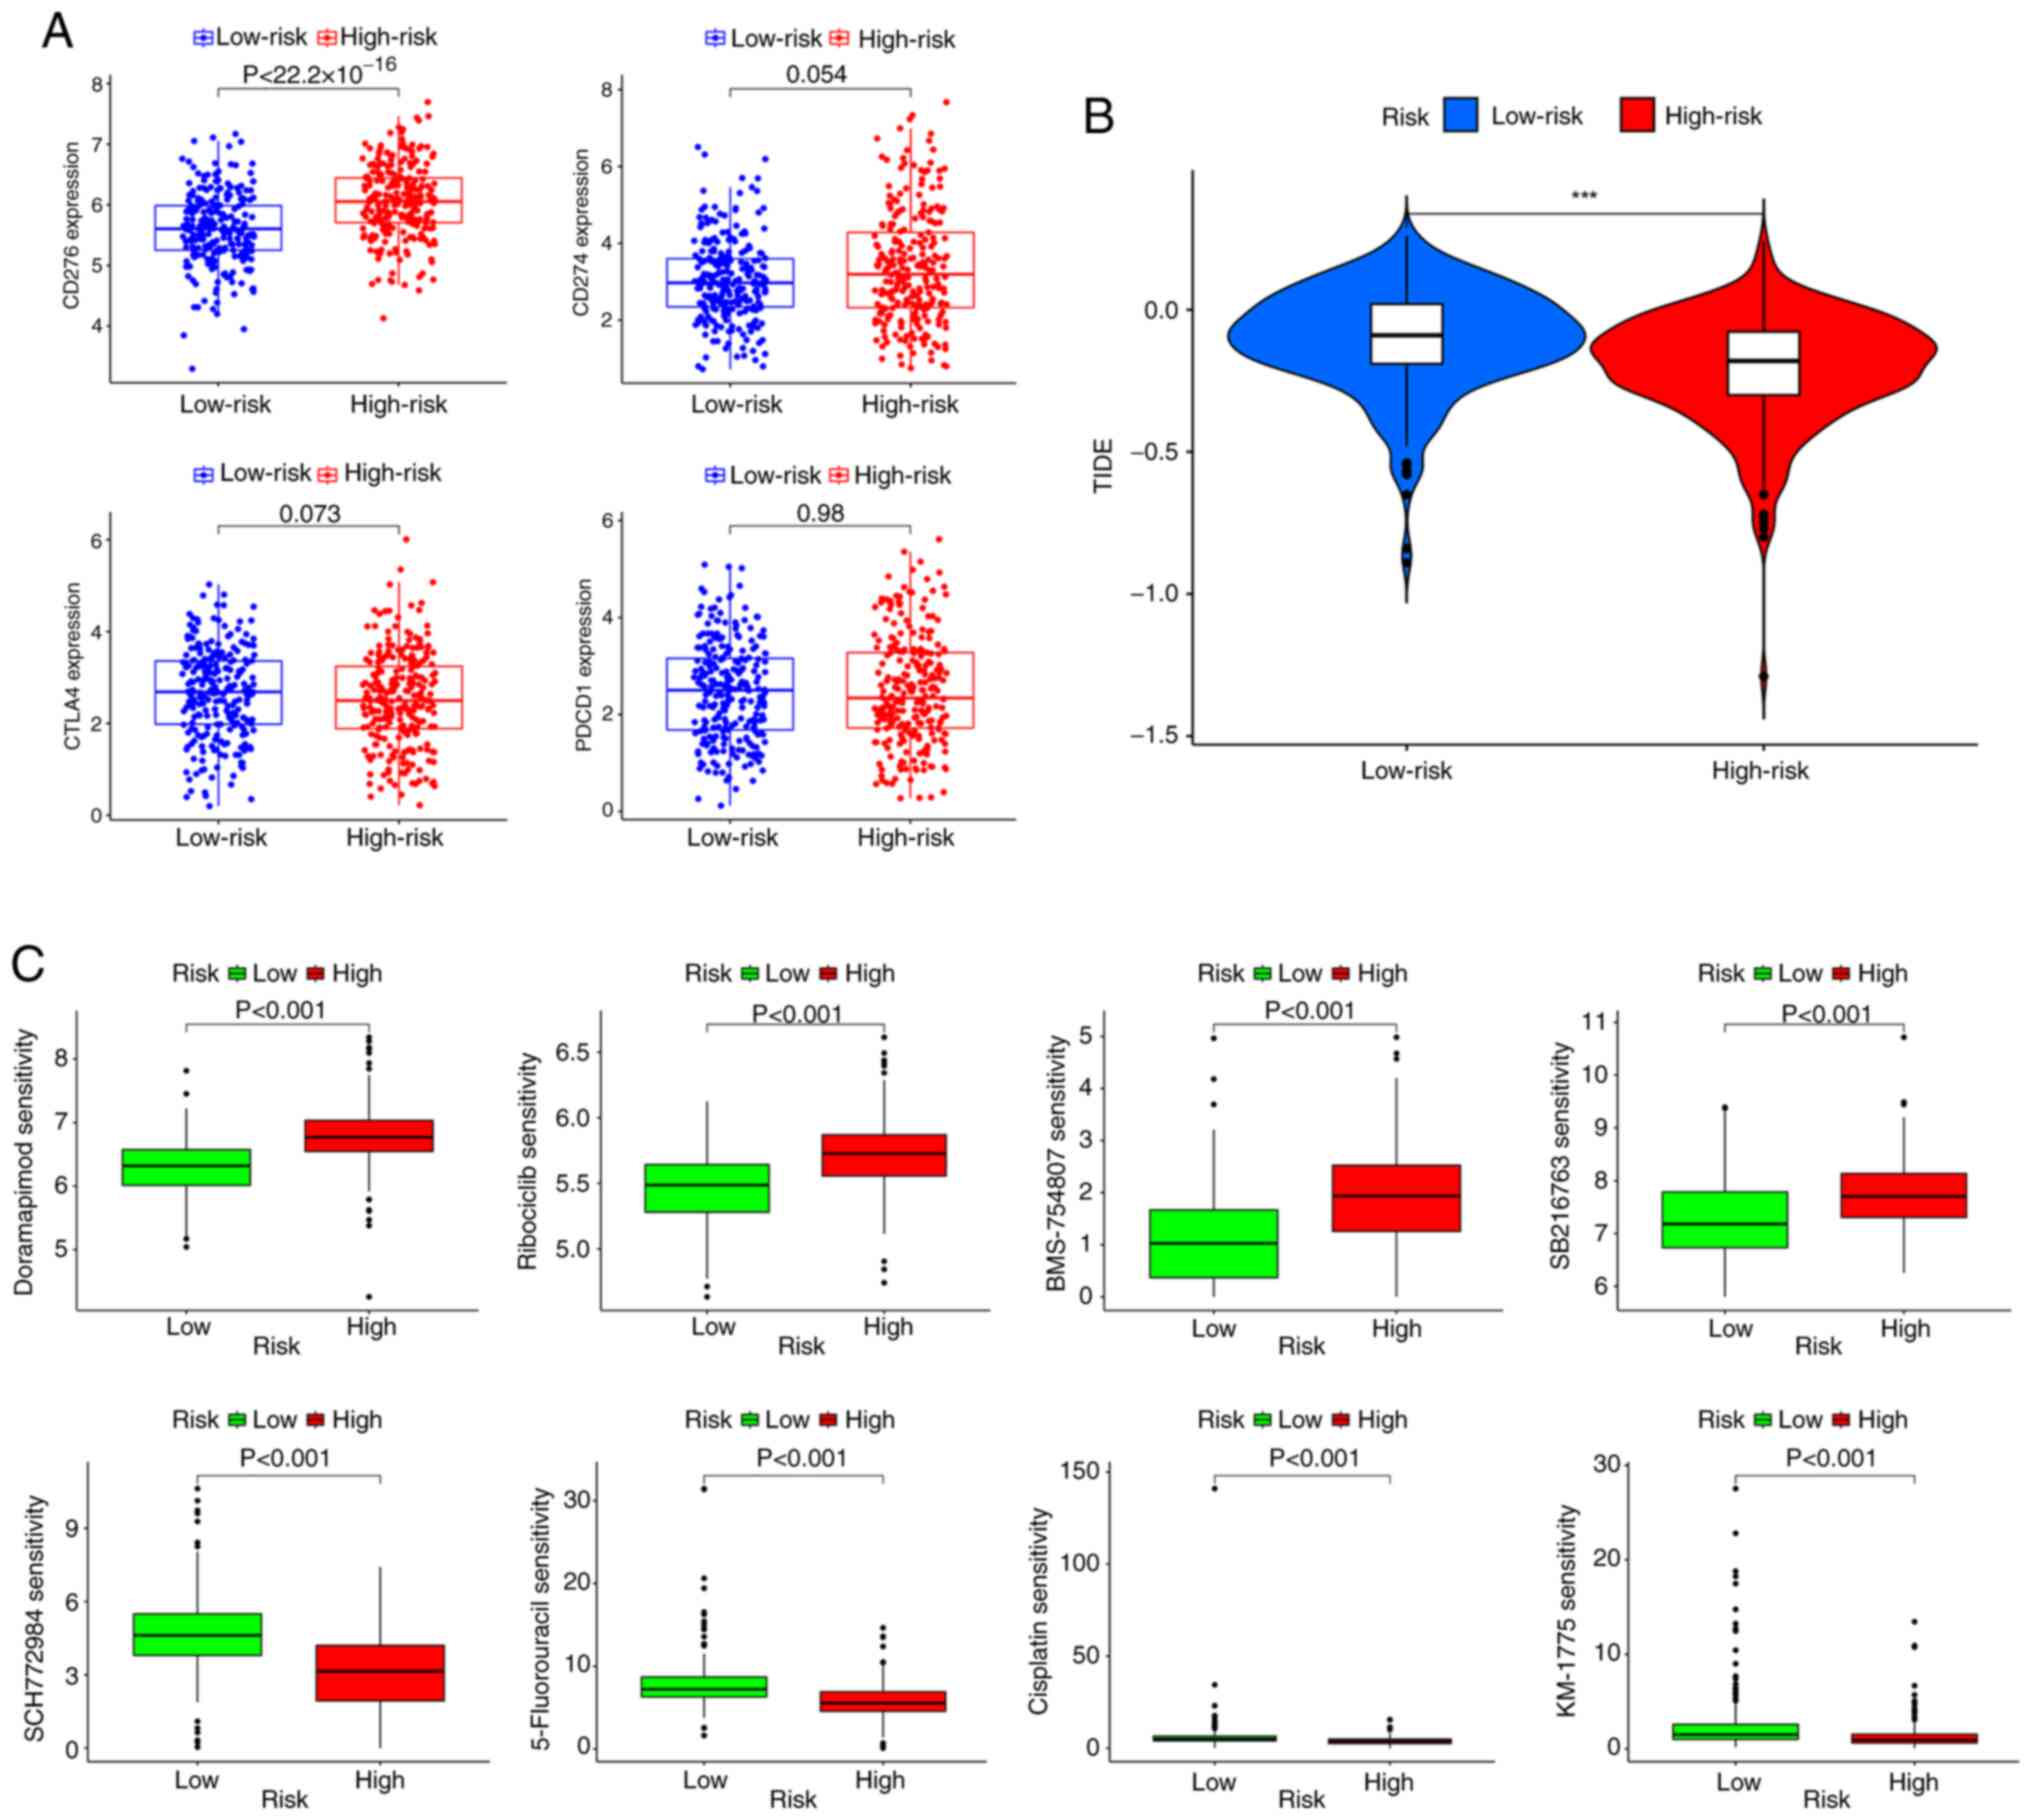
Treatment response prediction
The association between the risk score and
ICI-related gene expression was evaluated. The findings indicated a
significant association: A high risk score was significantly
associated with the upregulation of CD276 compared with a low risk
score; however, there was no significant difference in the risk
score according to the PD-1, programmed cell death protein 1 or
cytotoxic T-lymphocyte associated protein 4 expression level
(Fig. 7A). Subsequently, according
to the results of the TIDE analysis, patients in the low-risk
subgroup had significantly higher TIDE scores than those in the
high-risk subgroup (Fig. 7B). The
‘oncoPredict’ R package was then used to evaluate the sensitivity
of patients with LUAD in different risk groups to chemotherapy
drugs. The results revealed that the high-risk group was
significantly more sensitive to doramapimod (p38 MAPK inhibitor),
ribociclib (CDK4/6 inhibitor), BMS-754807 (IGF-1R inhibitor) and
SB216763 (GSK3β inhibitor) than the low-risk group, whilst the
low-risk group was significantly more sensitive to SCH772984 (ERK
inhibitor), 5-Fluorouracil (antimetabolite drug), cisplatin
(platinum based chemotherapy agent) and MK-1775 (Potent Wee1
inhibitor) than the high-risk group (Fig. 7C and Table SX).
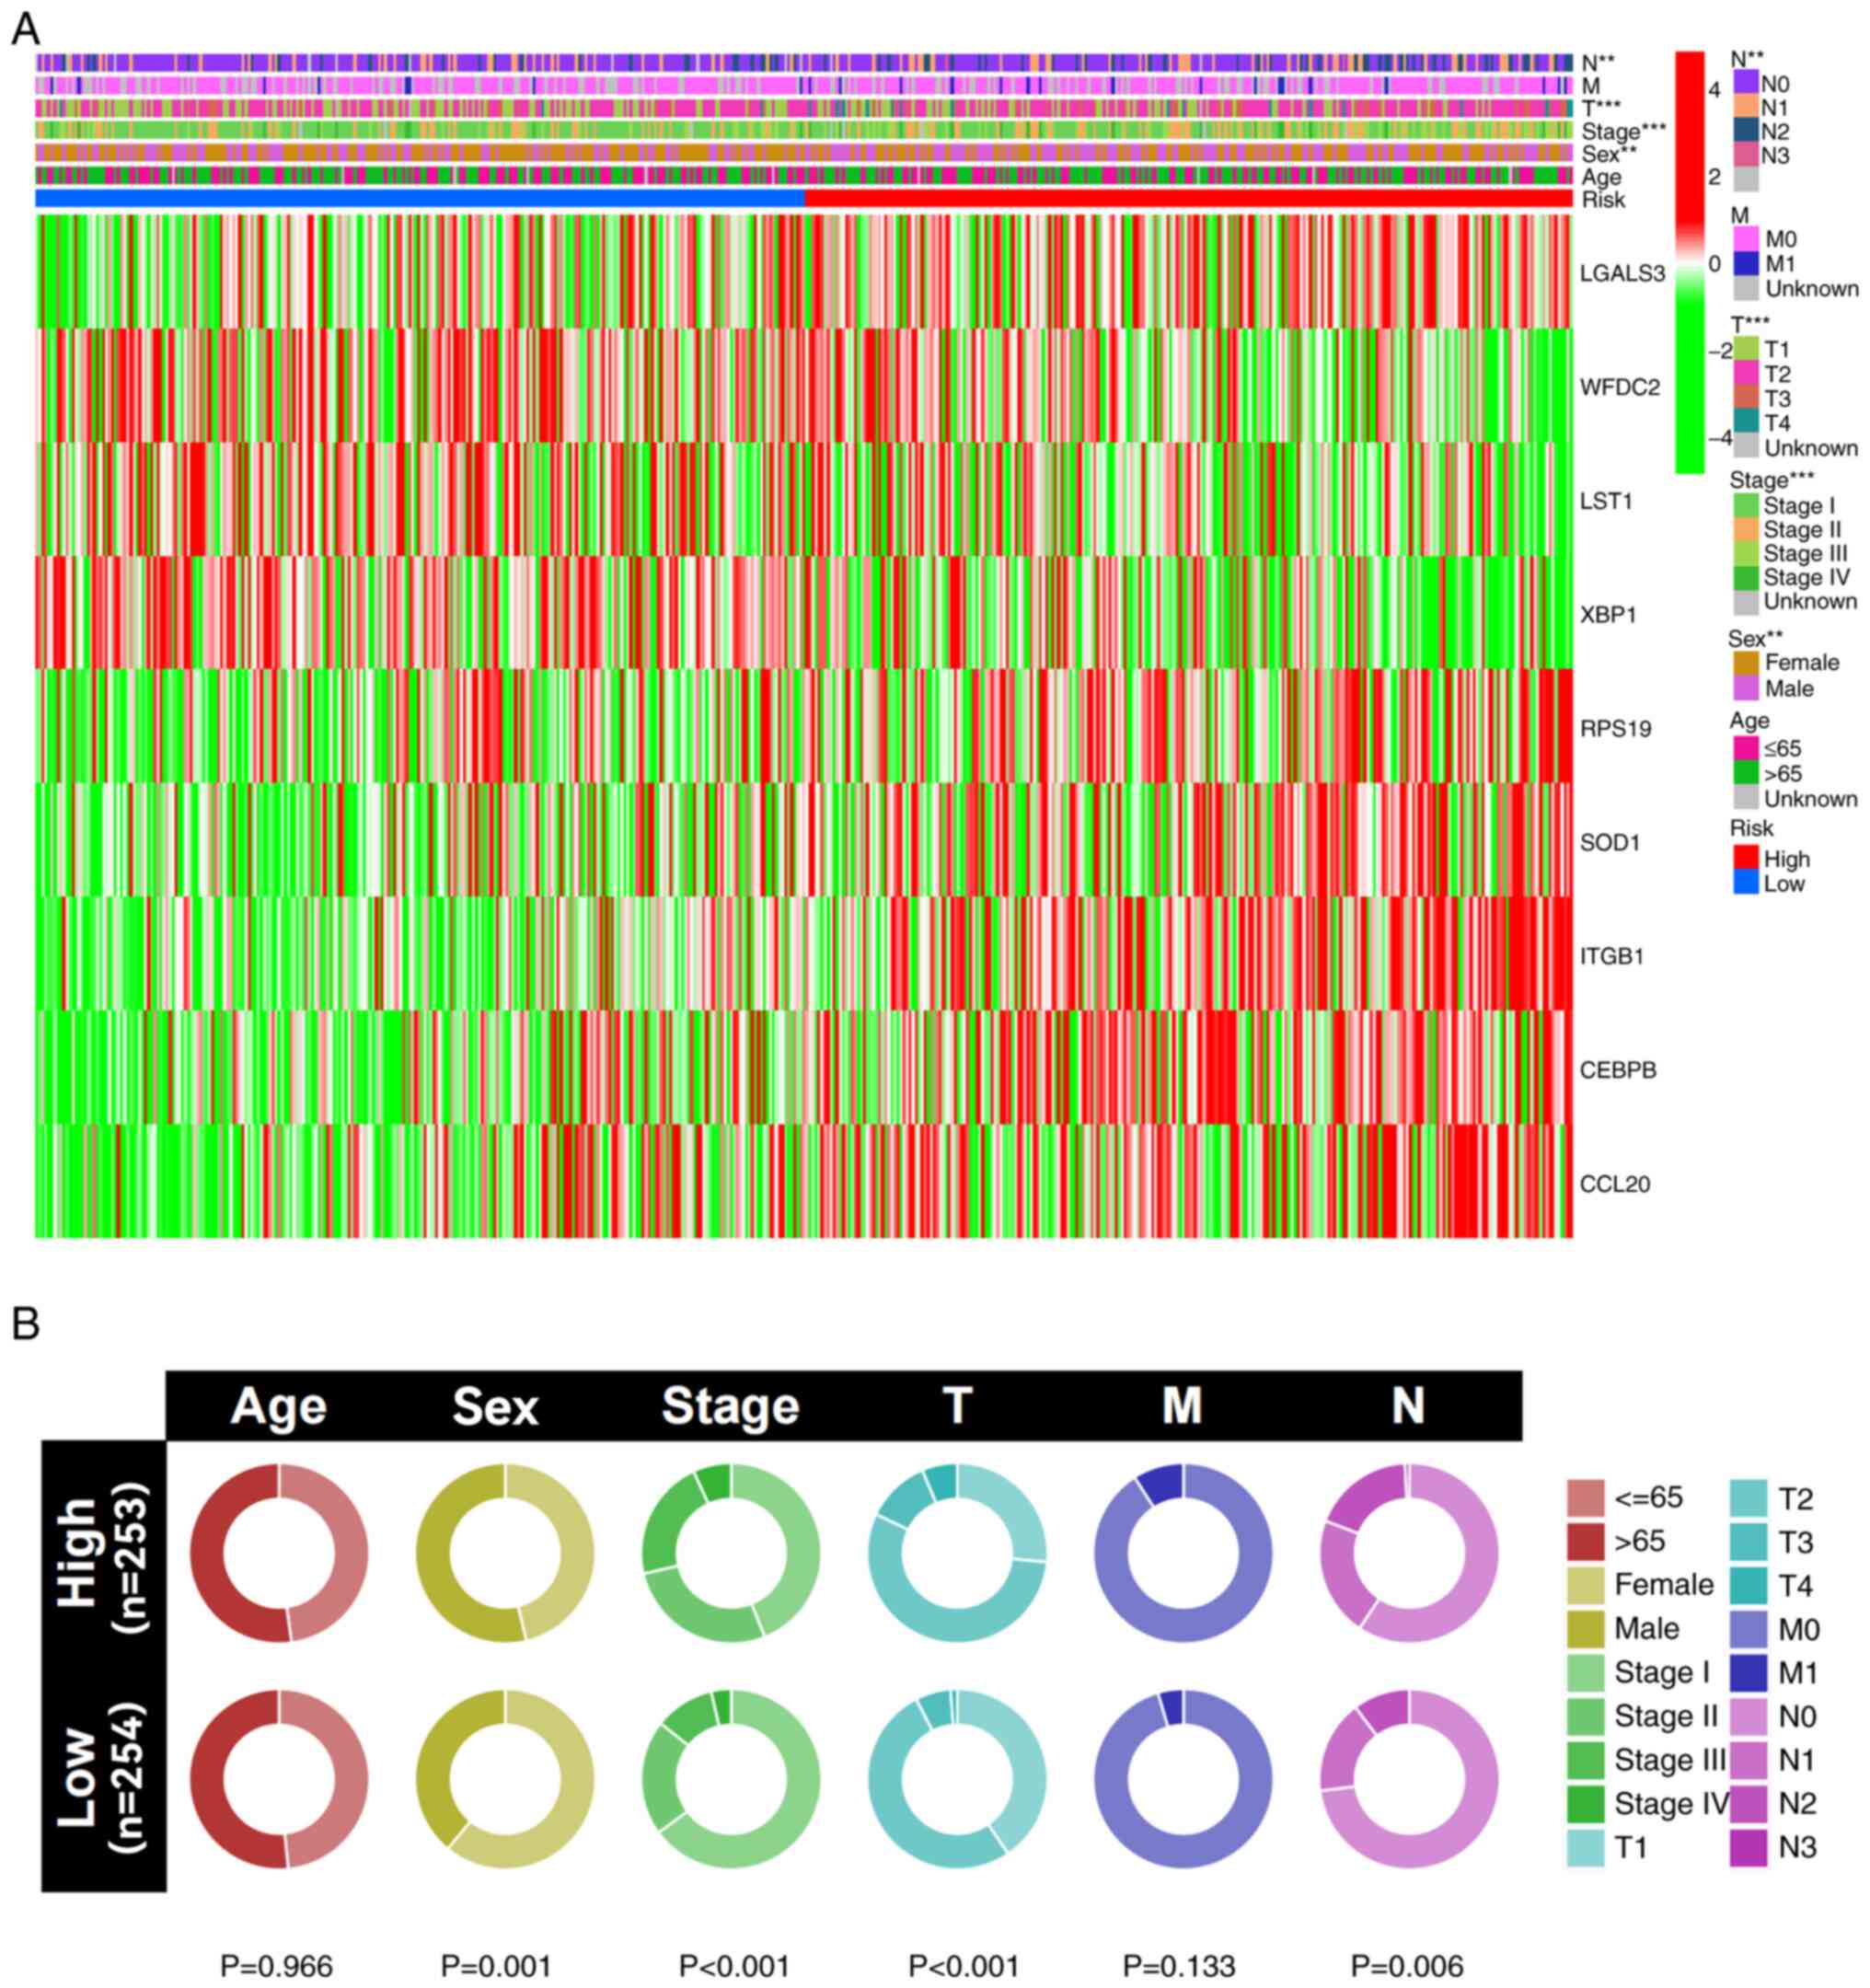
Clinical correlation analysis
The results of the clinical correlation analysis
indicated that male patients, as well as those with worse T and N
stages, had significantly higher risk scores compared with female
patients and those with lower T and N stages (Fig. 8A). Additionally, a cyclic graph was
constructed to evaluate clinical correlation. The findings also
indicated that patients with higher risk scores had significantly
more advanced grade, T stages and N stages compared with those with
lower risk scores (Fig. 8B).
Boxplots revealed similar results, with increasing risk score
associated with a significant increase in the lung cancer stage
(Fig. S5).
In vitro experimental validation of
the risk models
The protein expression levels of LGALS3 (https://www.proteinatlas.org/ENSG00000131981-LGALS3),
WFDC2 (https://www.proteinatlas.org/ENSG00000101443-WFDC2),
SOD1 (https://www.proteinatlas.org/ENSG00000142168-SOD1),
ITGB1 (https://www.proteinatlas.org/ENSG00000150093-ITGB1)
and CEBPB (https://www.proteinatlas.org/ENSG00000172216-CEBPB)
were compared between LUAD and normal tissues based on
immunohistochemical staining images obtained from the HPA database
(Fig. S6A). Furthermore, RT-qPCR
revealed that LST1 and XBP1 were highly expressed in normal human
lung cell lines (P<0.05); LGALS3, RPS19, SOD1, ITGB1 and CEBPB
were highly expressed in both the H1373 and H1563 cell lines, with
CEBPB showing the highest significance (P<0.001), and CCL20 was
highly expressed in only the H1563 cell line (P<0.05) (Fig. S6B and C).
Discussion
Drug resistance and distant metastasis are major
contributors to the status of LUAD as a leading cause of
cancer-related deaths worldwide. The TNM system remains the most
widely used classification method for lung cancer staging. While it
provides valuable prognostic information, its accuracy in
predicting patient outcomes for LUAD is limited, highlighting the
need for continuous refinement and complementary approaches
(25). Recently, researchers have
explored the potential of single-cell sequencing as an emerging
tool to enhance prognosis prediction and therapeutic response
assessment (26). Therefore, the
aim of the present study was to develop a risk assessment model for
patients with LUAD using PCIGs through the integration of scRNA-seq
and bulk RNA sequencing. Additionally, the present study aimed to
assess the potential molecular mechanisms and clinical applications
of the model. According to the model, Kaplan-Meier survival curves
revealed a worse prognosis in the high-risk group compared with the
low-risk group, a finding validated in the external cohort. The
nomogram demonstrated the effectiveness of the model in predicting
the prognosis of patients with LUAD. Furthermore, GSEA results
indicated enrichment of the focal adhesion and ECM receptor
interaction pathways in the high-risk group. TMB analysis also
revealed a higher TMB in the high-risk group.
The immune system serves an important role in the
progression of tumors, and immune cell signatures are increasingly
favored by researchers. As important immune cells in the human
body, plasma cells also serve an important role in tumor
progression (27). The present
study acquired data from the TCGA, GEO and TISCH databases, and
univariate Cox hazard analysis was performed to identify
prognosis-related genes. LASSO regression and multivariate Cox
regression analysis were subsequently performed to develop a risk
assessment model. Individuals classified as high risk had a notably
lower survival rate than those in the low-risk group. The nomogram
showed good predictive value for predicting patient prognosis,
indicating that the model can predict the prognosis of patients
with LUAD independently and effectively. Similar models based on
different immune cells have also been proposed in other studies and
have demonstrated predictive value for the prognosis of LUAD. For
example, Song et al (28)
constructed a model based on natural killer cell marker genes to
predict the prognosis of patients with LUAD using integrated
analysis of scRNA-seq and bulk RNA sequencing. LGALS3, WFDC2, LST1,
XBP1, RPS19, SOD1, ITGB1, CEBPB and CCL20 were identified as
signature genes to construct the prognostic assessment model in the
present study, which effectively predicted the prognosis of
patients with LUAD. LGALS3 is an important regulator of LUAD
progression. Vuong et al (29) reported that an orally active LGALS3
antagonist effectively blocked the growth and spread of LUAD in a
novel study. Furthermore, XBP1 is closely related to tumorigenesis
and tumor progression (30) and
serves an antitumorigenic role in LUAD through alternative
splicing. The adaptation of plasma cells may serve a role in this
process (31). As a major
antioxidant enzyme, SOD1 is essential for the growth of non-small
cell lung cancer (NSCLC), as knockdown or pharmacological
inhibition of SOD1 potently inhibits the growth of NSCLC cell lines
driven by the oncogenes KRAS and EGFR (32,33).
The accumulation of the basic leucine zipper family member CEBPB
potentially controls the expression of the nuclear factor erythroid
2-related factor 2 gene, which may serve a role in the progression
of NSCLC (34). Furthermore, CEBPB
can promote the production of IL-6 in the immune response center in
pneumonia, thus aggravating the inflammatory response of pulmonary
epithelial cells (35). CCL20 serve
a role in several oncogenic processes, and Fan et al
(36) reported that downregulated
expression of CCL20 can repress EMT signaling pathways in LUAD
cells and restrain tumor growth. The remaining PCIGs have also been
confirmed to be related to tumor progression (37–39).
Furthermore, GSEA and TMB analysis were implemented
to elucidate the potential underlying mechanisms involved. The
high-risk group displayed notable upregulation in pathways related
to ECM-receptor interactions and focal adhesion. This finding
suggests that the poor prognosis of patients in the high-risk group
may be related to ECM-receptor interactions, which significantly
contribute to several tumor progression processes. The involvement
of ECM-receptor interactions in other types of cancers has been
demonstrated (40). Furthermore,
Anagnostou et al (41)
reported that a higher concentration of neoepitopes resulting from
somatic mutations could amplify the clinical advantages derived
from immune checkpoint blockade. This finding suggested that
immunotherapy may be more effective in individuals in the high-risk
group. The present study also demonstrated a greater occurrence of
TP53 mutation in the high-risk group. Previous research suggests
that there is a notable link between TP53 mutation and the
treatment and prognosis of lung cancer (42).
Subsequently, the present study evaluated the
capacity of the model to predict treatment response, and it was
demonstrated that the expression of CD276 was positively associated
with the risk score. B7-H3 (CD276) has been reported to be
upregulated in several types of human cancer cells (43). In patients with NSCLC, B7-H3 has
been identified as potentially functioning in conjunction with
other factors to aid in the immune evasion of tumor cells (44). Furthermore, B7-H3 may also serve a
role in conferring resistance to anticancer drugs through different
mechanisms. Enoblituzumab (MGA271), a humanized monoclonal antibody
that targets B7-H3, was reported to have satisfactory safety and
demonstrated antitumor efficacy in patients with NSCLC (45). Subsequently, sensitivity to chemical
drugs between the high- and low-risk groups was evaluated. The
high-risk group was more sensitive to doramapimod, which is a p38
MAPK inhibitor that has shown specific sensitivity to cancer cell
lines and organoids of cervical squamous cell carcinoma (46). The aforementioned results suggest
that the model in the present study may be used guide immunotherapy
and chemotherapy for patients with LUAD.
The present study marks the inaugural attempt to
develop a prognostic signature for patients with LUAD, utilizing
PCIGs and integrating both scRNA-seq and bulk RNA sequencing data.
This approach addresses a crucial gap, as bulk RNA sequencing
cannot capture the nuances observed at the single-cell level
(13). The present study still has
some limitations. First, it relies on publicly available datasets,
which may introduce biases related to data processing, sample
heterogeneity and batch effects. Additionally, while external
validation and RT-qPCR were performed, further experimental
validation is required. Specifically, western blotting or
immunohistochemistry analyses in LUAD tissue samples and cell lines
should be conducted to confirm protein expression and functional
roles. Moreover, advanced spatial transcriptomics techniques could
provide deeper insights into the spatial distribution of plasma
cell immune-related genes within the tumor microenvironment.
From a clinical perspective, despite the promising
predictive potential of the PCIG-based risk assessment model, its
real-world applicability remains to be fully established.
Well-designed prospective clinical studies are needed to assess its
predictive accuracy for patient prognosis and therapeutic response
in independent cohorts. Furthermore, the model's generalizability
to other malignancies has not been explored, necessitating further
validation across different tumor types to evaluate its broader
applicability. Addressing these limitations through additional
experimental and clinical research will be essential to strengthen
the robustness and translational value of the present study
findings. In conclusion, the model based on nine PCIGs and the
nomogram demonstrated high efficacy for predicting patient
prognosis. These findings may be associated with the enrichment of
ECM-receptor interactions and focal adhesion pathways. The
evaluation of ICIs and sensitivity to chemotherapeutic drugs may
lead to potential protocols for drug selection in treatments for
patients with LUAD. Nevertheless, well-designed prospective
clinical trials and basic experiments are still needed to confirm
the results of the present study.
Supplementary Material
Supporting Data
Supporting Data
Acknowledgements
Not applicable.
Funding
The present study was supported by National Natural Science
Foundation of China (grant no. 81560345).
Availability of data and materials
The TCGA datasets analyzed in this study are
publicly available at https://www.cancer.gov/about-nci/organization/ccg/research/structural-genomics/tcga,
while the GEO datasets can be accessed at https://www.ncbi.nlm.nih.gov/geo/ under accession
numbers GSE72094, GSE31210, and GSE131907. The remaining data
generated in the present study may be requested from the
corresponding author.
Authors' contributions
HS had full access to all the data in the manuscript
and takes responsibility for its integrity and accuracy. WZho, ZH,
JW, QL, ZJ, HS and WZha contributed to the concept and design of
the study. WZho, ZH, JW and HS performed the experiments, while
WZho, ZH, JW, QL, ZJ, HS and WZha were involved in data
acquisition, analysis and interpretation. Statistical analysis was
conducted by WZho, ZH, JW and HS. The manuscript was drafted by
WZho, HS and WZha, with critical revisions provided by WZho, HS and
WZha. Supervision was carried out by WZho, HS and WZha. WZho and ZJ
confirm the authenticity of all the raw data. All authors have read
and approved the final manuscript.
Ethics approval and consent to
participate
Not applicable.
Patient consent for publication
Not applicable.
Competing interests
The authors declare that they have no competing
interests.
Glossary
Abbreviations
Abbreviations:
|
DEG
|
differentially expressed gene
|
|
GEO
|
Gene Expression Omnibus
|
|
GSEA
|
gene set enrichment analysis
|
|
GO
|
Gene Ontology
|
|
ICI
|
immune checkpoint inhibitor
|
|
KEGG
|
Kyoto Encyclopedia of Genes and
Genomes
|
|
LUAD
|
lung adenocarcinoma
|
|
LASSO
|
least absolute shrinkage and selection
operator
|
|
NSCLC
|
non-small cell lung cancer
|
|
PD-1
|
programmed death 1
|
|
PD-L1
|
programmed death ligand 1
|
|
PCIG
|
plasma cell immune-related gene
|
|
scRNA-seq
|
single-cell RNA-sequencing
|
|
TME
|
tumor microenvironment
|
|
TNM
|
tumor-node-metastasis
|
|
TCGA
|
The Cancer Genome Atlas
|
|
TIDE
|
Tumor Immune Dysfunction and
Exclusion
|
|
TISCH
|
Tumor Immune Single-cell Hub
|
|
TMB
|
tumor mutation burden
|
References
|
1
|
Bade BC and Dela Cruz CS: Lung cancer
2020: Epidemiology, etiology, and prevention. Clin Chest Med.
41:1–24. 2020. View Article : Google Scholar : PubMed/NCBI
|
|
2
|
Duma N, Santana-Davila R and Molina JR:
Non-small cell lung cancer: Epidemiology, screening, diagnosis, and
treatment. Mayo Clin Proc. 94:1623–1640. 2019. View Article : Google Scholar : PubMed/NCBI
|
|
3
|
Yi M, Li A, Zhou L, Chu Q, Luo S and Wu K:
Immune signature-based risk stratification and prediction of immune
checkpoint inhibitor's efficacy for lung adenocarcinoma. Cancer
Immunol Immunother. 70:1705–1719. 2021. View Article : Google Scholar : PubMed/NCBI
|
|
4
|
Germain C, Gnjatic S, Tamzalit F,
Knockaert S, Remark R, Goc J, Lepelley A, Becht E, Katsahian S,
Bizouard G, et al: Presence of B cells in tertiary lymphoid
structures is associated with a protective immunity in patients
with lung cancer. Am J Respir Crit Care Med. 189:832–844. 2014.
View Article : Google Scholar : PubMed/NCBI
|
|
5
|
Ettinger DS, Wood DE, Aisner DL, Akerley
W, Bauman JR, Bharat A, Bruno DS, Chang JY, Chirieac LR, D'Amico
TA, et al: Non-small cell lung cancer, version 3.2022, NCCN
clinical practice guidelines in oncology. J Natl Compr Canc Netw.
20:497–530. 2022. View Article : Google Scholar : PubMed/NCBI
|
|
6
|
Nesbitt JC, Putnam JB Jr, Walsh GL, Roth
JA and Mountain CF: Survival in early-stage non-small cell lung
cancer. Ann Thorac Surg. 60:466–472. 1995. View Article : Google Scholar : PubMed/NCBI
|
|
7
|
Chen-Kiang S: Cell-cycle control of plasma
cell differentiation and tumorigenesis. Immunol Rev. 194:39–47.
2003. View Article : Google Scholar : PubMed/NCBI
|
|
8
|
O'Connor BP, Gleeson MW, Noelle RJ and
Erickson LD: The rise and fall of long-lived humoral immunity:
Terminal differentiation of plasma cells in health and disease.
Immunol Rev. 194:61–76. 2003. View Article : Google Scholar : PubMed/NCBI
|
|
9
|
Chaudhary RK, Patil P, Ananthesh L,
Srinivasa MG, Mateti UV, Shetty V and Khanal P: Identification of
signature genes and drug candidates for primary plasma cell
leukemia: An integrated system biology approach. Comput Biol Med.
162:1070902023. View Article : Google Scholar : PubMed/NCBI
|
|
10
|
Lahiri A, Maji A, Potdar PD, Singh N,
Parikh P, Bisht B, Mukherjee A and Paul MK: Lung cancer
immunotherapy: Progress, pitfalls, and promises. Mol Cancer.
22:402023. View Article : Google Scholar : PubMed/NCBI
|
|
11
|
Hao D, Han G, Sinjab A, Gomez-Bolanos LI,
Lazcano R, Serrano A, Hernandez SD, Dai E, Cao X, Hu J, et al: The
single-cell immunogenomic landscape of B and plasma cells in
early-stage lung adenocarcinoma. Cancer Discov. 12:2626–2645. 2022.
View Article : Google Scholar : PubMed/NCBI
|
|
12
|
Hong M, Tao S, Zhang L, Diao LT, Huang X,
Huang S, Huang S, Xie SJ, Xiao ZD and Zhang H: RNA sequencing: New
technologies and applications in cancer research. J Hematol Oncol.
13:1662020. View Article : Google Scholar : PubMed/NCBI
|
|
13
|
Suvà ML and Tirosh I: Single-Cell RNA
sequencing in cancer: Lessons learned and emerging challenges. Mol
Cell. 75:7–12. 2019. View Article : Google Scholar : PubMed/NCBI
|
|
14
|
Wang G, Qiu M, Xing X, Zhou J, Yao H, Li
M, Yin R, Hou Y, Li Y, Pan S, et al: Lung cancer scRNA-seq and
lipidomics reveal aberrant lipid metabolism for early-stage
diagnosis. Sci Transl Med. 14:eabk27562022. View Article : Google Scholar : PubMed/NCBI
|
|
15
|
Zhu J, Fan Y, Xiong Y, Wang W, Chen J, Xia
Y, Lei J, Gong L, Sun S and Jiang T: Delineating the dynamic
evolution from preneoplasia to invasive lung adenocarcinoma by
integrating single-cell RNA sequencing and spatial transcriptomics.
Exp Mol Med. 54:2060–2076. 2022. View Article : Google Scholar : PubMed/NCBI
|
|
16
|
Kim N, Kim HK, Lee K, Hong Y, Cho JH, Choi
JW, Lee JI, Suh YL, Ku BM, Eum HH, et al: Single-cell RNA
sequencing demonstrates the molecular and cellular reprogramming of
metastatic lung adenocarcinoma. Nat Commun. 11:22852020. View Article : Google Scholar : PubMed/NCBI
|
|
17
|
Zhang J, Liu X, Huang Z, Wu C, Zhang F,
Han A, Stalin A, Lu S, Guo S, Huang J, et al: T cell-related
prognostic risk model and tumor immune environment modulation in
lung adenocarcinoma based on single-cell and bulk RNA sequencing.
Comput Biol Med. 152:1064602023. View Article : Google Scholar : PubMed/NCBI
|
|
18
|
Chen Q, Wang S and Lang JH: Development
and validation of nomogram with tumor microenvironment-related
genes and clinical factors for predicting overall survival of
endometrial cancer. J Cancer. 12:3530–3538. 2021. View Article : Google Scholar : PubMed/NCBI
|
|
19
|
Yoshihara K, Shahmoradgoli M, Martínez E,
Vegesna R, Kim H, Torres-Garcia W, Treviño V, Shen H, Laird PW,
Levine DA, et al: Inferring tumour purity and stromal and immune
cell admixture from expression data. Nat Commun. 4:26122013.
View Article : Google Scholar : PubMed/NCBI
|
|
20
|
Mayakonda A, Lin DC, Assenov Y, Plass C
and Koeffler HP: Maftools: Efficient and comprehensive analysis of
somatic variants in cancer. Genome Res. 28:1747–1756. 2018.
View Article : Google Scholar : PubMed/NCBI
|
|
21
|
Colaprico A, Silva TC, Olsen C, Garofano
L, Cava C, Garolini D, Sabedot TS, Malta TM, Pagnotta SM,
Castiglioni I, et al: TCGAbiolinks: An R/Bioconductor package for
integrative analysis of TCGA data. Nucleic Acids Res. 44:e712016.
View Article : Google Scholar : PubMed/NCBI
|
|
22
|
Maeser D, Gruener RF and Huang RS:
OncoPredict: An R package for predicting in vivo or cancer patient
drug response and biomarkers from cell line screening data. Brief
Bioinform. 22:bbab2602021. View Article : Google Scholar : PubMed/NCBI
|
|
23
|
Livak KJ and Schmittgen TD: Analysis of
relative gene expression data using real-time quantitative PCR and
the 2(−Delta Delta C(T)) method. Methods. 25:402–408. 2001.
View Article : Google Scholar : PubMed/NCBI
|
|
24
|
Uhlén M, Fagerberg L, Hallström BM,
Lindskog C, Oksvold P, Mardinoglu A, Sivertsson Å, Kampf C,
Sjöstedt E, Asplund A, et al: Proteomics. Tissue-based map of the
human proteome. Science. 347:12604192015. View Article : Google Scholar : PubMed/NCBI
|
|
25
|
Asamura H, Nishimura KK, Giroux DJ,
Chansky K, Hoering A, Rusch V and Rami-Porta R; Members of the
IASLC Staging and Prognostic Factors Committee and of the Advisory
Boards, and Participating Institutions, : IASLC lung cancer staging
project: The new database to inform revisions in the ninth edition
of the TNM classification of lung cancer. J Thorac Oncol.
18:564–575. 2023. View Article : Google Scholar : PubMed/NCBI
|
|
26
|
Lei Y, Tang R, Xu J, Wang W, Zhang B, Liu
J, Yu X and Shi S: Applications of single-cell sequencing in cancer
research: Progress and perspectives. J Hematol Oncol. 14:912021.
View Article : Google Scholar : PubMed/NCBI
|
|
27
|
Wouters MCA and Nelson BH: Prognostic
significance of tumor-infiltrating B cells and plasma cells in
human cancer. Clin Cancer Res. 24:6125–6135. 2018. View Article : Google Scholar : PubMed/NCBI
|
|
28
|
Song P, Li W, Guo L, Ying J, Gao S and He
J: Identification and validation of a novel signature based on NK
cell marker genes to predict prognosis and immunotherapy response
in lung adenocarcinoma by integrated analysis of single-cell and
bulk RNA-sequencing. Front Immunol. 13:8507452022. View Article : Google Scholar : PubMed/NCBI
|
|
29
|
Vuong L, Kouverianou E, Rooney CM, McHugh
BJ, Howie SEM, Gregory CD, Forbes SJ, Henderson NC, Zetterberg FR,
Nilsson UJ, et al: An orally active galectin-3 antagonist inhibits
lung adenocarcinoma growth and augments response to PD-L1 blockade.
Cancer Res. 79:1480–1492. 2019. View Article : Google Scholar : PubMed/NCBI
|
|
30
|
Chen S, Chen J, Hua X, Sun Y, Cui R, Sha J
and Zhu X: The emerging role of XBP1 in cancer. Biomed
Pharmacother. 127:1100692020. View Article : Google Scholar : PubMed/NCBI
|
|
31
|
Zhong Z, Wang J, Han Q, Lin H, Luo H, Guo
D, Jiang Y and Liu A: XBP1 impacts lung adenocarcinoma progression
by promoting plasma cell adaptation to the tumor microenvironment.
Front Genet. 13:9695362022. View Article : Google Scholar : PubMed/NCBI
|
|
32
|
Glasauer A, Sena LA, Diebold LP, Mazar AP
and Chandel NS: Targeting SOD1 reduces experimental non-small-cell
lung cancer. J Clin Invest. 124:117–128. 2014. View Article : Google Scholar : PubMed/NCBI
|
|
33
|
Somwar R, Erdjument-Bromage H, Larsson E,
Shum D, Lockwood WW, Yang G, Sander C, Ouerfelli O, Tempst PJ,
Djaballah H and Varmus HE: Superoxide dismutase 1 (SOD1) is a
target for a small molecule identified in a screen for inhibitors
of the growth of lung adenocarcinoma cell lines. Proc Natl Acad Sci
USA. 108:16375–16380. 2011. View Article : Google Scholar : PubMed/NCBI
|
|
34
|
Okazaki K, Anzawa H, Liu Z, Ota N,
Kitamura H, Onodera Y, Alam MM, Matsumaru D, Suzuki T, Katsuoka F,
et al: Enhancer remodeling promotes tumor-initiating activity in
NRF2-activated non-small cell lung cancers. Nat Commun.
11:59112020. View Article : Google Scholar : PubMed/NCBI
|
|
35
|
Lorenz J, Zahlten J, Pollok I, Lippmann J,
Scharf S, N'Guessan PD, Opitz B, Flieger A, Suttorp N, Hippenstiel
S and Schmeck B: Legionella pneumophila-induced IκBζ-dependent
expression of interleukin-6 in lung epithelium. Eur Respir J.
37:648–657. 2011. View Article : Google Scholar : PubMed/NCBI
|
|
36
|
Fan T, Li S, Xiao C, Tian H, Zheng Y, Liu
Y, Li C and He J: CCL20 promotes lung adenocarcinoma progression by
driving epithelial-mesenchymal transition. Int J Biol Sci.
18:4275–4288. 2022. View Article : Google Scholar : PubMed/NCBI
|
|
37
|
Li J, Li J, Hao H, Lu F, Wang J, Ma M, Jia
B, Zhuo M, Wang J, Chi Y, et al: Secreted proteins MDK, WFDC2, and
CXCL14 as candidate biomarkers for early diagnosis of lung
adenocarcinoma. BMC Cancer. 23:1102023. View Article : Google Scholar : PubMed/NCBI
|
|
38
|
Li J, Xiao X, Ou Y, Cao L, Guo M, Qi C,
Wang Z, Liu Y, Shuai Q, Wang H, et al: USP51/PD-L1/ITGB1-deployed
juxtacrine interaction plays a cell-intrinsic role in promoting
chemoresistant phenotypes in non-small cell lung cancer. Cancer
Commun (Lond). 43:765–787. 2023. View Article : Google Scholar : PubMed/NCBI
|
|
39
|
Chen KC, Hsu WH, Ho JY, Lin CW, Chu CY,
Kandaswami CC, Lee MT and Cheng CH: Flavonoids luteolin and
quercetin inhibit RPS19 and contributes to metastasis of cancer
cells through c-Myc reduction. J Food Drug Anal. 26:1180–1191.
2018. View Article : Google Scholar : PubMed/NCBI
|
|
40
|
Andersen MK, Rise K, Giskeødegård GF,
Richardsen E, Bertilsson H, Størkersen Ø, Bathen TF, Rye M and
Tessem MB: Integrative metabolic and transcriptomic profiling of
prostate cancer tissue containing reactive stroma. Sci Rep.
8:142692018. View Article : Google Scholar : PubMed/NCBI
|
|
41
|
Anagnostou V, Smith KN, Forde PM, Niknafs
N, Bhattacharya R, White J, Zhang T, Adleff V, Phallen J, Wali N,
et al: Evolution of neoantigen landscape during immune checkpoint
blockade in non-small cell lung cancer. Cancer Discov. 7:264–276.
2017. View Article : Google Scholar : PubMed/NCBI
|
|
42
|
Steels E, Paesmans M, Berghmans T, Branle
F, Lemaitre F, Mascaux C, Meert AP, Vallot F, Lafitte JJ and
Sculier JP: Role of p53 as a prognostic factor for survival in lung
cancer: A systematic review of the literature with a meta-analysis.
Eur Respir J. 18:705–719. 2001. View Article : Google Scholar : PubMed/NCBI
|
|
43
|
Seliger B and Quandt D: The expression,
function, and clinical relevance of B7 family members in cancer.
Cancer Immunol Immunother. 61:1327–1341. 2012. View Article : Google Scholar : PubMed/NCBI
|
|
44
|
Jin Y, Zhang P, Li J, Zhao J, Liu C, Yang
F, Yang D, Gao A, Lin W, Ma X and Sun Y: B7-H3 in combination with
regulatory T cell is associated with tumor progression in primary
human non-small cell lung cancer. Int J Clin Exp Pathol.
8:13987–13995. 2015.PubMed/NCBI
|
|
45
|
Aggarwal C, Prawira A, Antonia S, Rahma O,
Tolcher A, Cohen RB, Lou Y, Hauke R, Vogelzang N, Zandberg D, et
al: Dual checkpoint targeting of B7-H3 and PD-1 with enoblituzumab
and pembrolizumab in advanced solid tumors: Interim results from a
multicenter phase I/II trial. J Immunother Cancer. 10:e0044242022.
View Article : Google Scholar : PubMed/NCBI
|
|
46
|
He D, Zhao XQ, Chen XG, Fang Y, Singh S,
Talele TT, Qiu HJ, Liang YJ, Wang XK, Zhang GQ, et al: BIRB796, the
inhibitor of p38 mitogen-activated protein kinase, enhances the
efficacy of chemotherapeutic agents in ABCB1 overexpression cells.
PLoS One. 8:e541812013. View Article : Google Scholar : PubMed/NCBI
|