Introduction
Thyroid cancer (TC) is the most commonly occurring
malignant tumor of the endocrine system, and its incidence rate has
exhibited an increasing trend in recent years (1–3). TC
includes a variety of histological subtypes, of which papillary TC
accounts for >90% of all thyroid tumors (4). Whereas the majority of TCs do not
exhibit a highly aggressive behavior, a proportion of the TCs
exhibit aggressive characteristics (5,6).
However, the molecular mechanisms promoting the development and
aggressive transition of the disease remain poorly understood.
Periostin is an extracellular matrix protein that
plays a crucial role in the progression of various malignancies
(7,8). A previous study by the authors
revealed that periostin was associated with the proliferation,
invasion and metastasis of TC cells (9). However, the regulation of periostin in
TC is not yet well understood.
Hypoxia is considered one of the hallmarks of the
tumor microenvironment of malignant tumors, particularly during
progression. Tumor cells transition from aerobic respiration to
glycolysis as a mechanism to ensure the availability of energy for
their survival, a phenomenon referred to as the Warburg effect
(10,11). This unusual glucose metabolism
pathway promotes glucose uptake and lactate production, which play
a pivotal role in the occurrence and development of tumors.
Hypoxia-inducible factor-1 (HIF-1) is known as the main regulator
promoting the adaptation of tumors to hypoxia. HIF-1 is a
transcriptional nuclear protein with a wide range of target genes
that are associated with hypoxia adaptation, inflammatory
development and tumor growth. HIF-1 contains two subunits, HIF1
subunit α (HIF-1α) of 120 kD and HIF-1 subunit β (HIF-1β) of 91–94
kD. HIF-1α is the active subunit and is regulated by hypoxia
(12–14).
Using bioinformatics analysis methods, it was
predicted that HIF-1α may be able to bind to the promoter of
periostin and up-regulate periostin expression. Therefore, the
present study aimed to explore whether hypoxia can promote the
expression of periostin in TC, resulting in progression of the
disease. In addition, the authors aimed to investigate the
interaction between periostin and HIF-1α.
Materials and methods
Bioinformatics analysis
The promoter sequence of the target gene (periostin)
was predicted using the NCBI database (https://www.ncbi.nlm.nih.gov/pubmed/). JASPAR is an
open-access database of curated, non-redundant transcription factor
(TF) binding profiles stored as position frequency matrices and TF
flexible models for TFs across multiple species in six taxonomic
groups (http://jaspar.genereg.net/). The
possible binding of HIF-1α to the promoter of periostin was
analyzed using JASPAR.
Patients and ethical statement
TC specimens were collected from 95 patients who
underwent total thyroidectomy or lobectomy between January, 2020
and December, 2021 at the Shanghai General Hospital, Shanghai
Jiaotong University School of Medicine (Shanghai, China) with a
median age of 48 years (range, 21–78 years). The
clinicopathological data of the patients are shown in Table SI) The present study was approved
by the Ethics Committee for Clinical Research of Shanghai General
Hospital, Shanghai Jiaotong University School of Medicine (approval
no. 2019KY016). Written informed consent was obtained from all
patients included in the study.
Cells and cell culture
Human TC cell lines (BCPAP and TPC-1) were obtained
from the Shanghai Institute of Life Sciences, Chinese Academy of
Sciences. The cells were maintained in Dulbecco's modified Eagle's
medium (DMEM) containing 10% fetal bovine serum (FBS;
MilliporeSigma) and placed in a humidified incubator at 37°C and 5%
CO2. The TC cells in the hypoxic group were incubated in
a modulator incubator with 94% N2, 5% CO2,
and 1% O2 to establish hypoxic conditions for 24 h.
Cells in the normoxic group were cultured under normoxic conditions
(atmosphere of 20% O2). In the present study, BCPAP and
TPC-1 cells expressed increased levels of paired box 8 and
transcription termination factor 1 mRNA, as determined using
RT-qPCR (data not shown), which are considered as the biomarker of
differentiated TC cells (15).
Immunohistochemistry (IHC)
Tissues were fixed overnight in 10% neutral formalin
fixing solution at room temperature, and finally wax blocks were
embedded with paraffin. The paraffin embedded tissue was cut into
4-µm-thick slices and then baked in an oven at 63°C for 1 h. For
periostin IHC staining, following deparaffinization, antigen
retrieval was performed in citrate buffer (pH 6.0) for 10 min.
Subsequently, the sections were washed thrice with PBS and the
blocking reagent (3% H2O2) was mixed at room
temperature for 10 min, then incubated overnight with primary
antibody (periostin rabbit polyclonal antibody; cat. no. Ap11962b;
Abgent Biotech Co., Ltd.; 1:50) at 4°C. Subsequently, the slides
were washed with PBS and incubated with a secondary antibody
(goat-anti-rabbit antibodies conjugated to horseradish peroxidase;
cat. no. ab6721; Abcam; 1:200) for 30 min at room temperature.
For HIF-1α IHC staining, the slides were
deparaffinized and subjected to graded rehydration. Antigen
retrieval was performed in citrate buffer (pH 6.0) for 10 min.
After washing three times with PBS, the slides were mixed with 3%
H2O2 at room temperature for 10 min and then
incubated overnight with primary antibody (HIF-1α rabbit polyclonal
antibody; cat. no. bs-0737R; BIOSS; 1:50) at 4°C. After washing
with PBS, slides were incubated with the secondary antibody
(goat-anti-rabbit antibodies conjugated to horseradish peroxidase;
cat. no. ab6721; Abcam; 1:200) at room temperature for 30 min. For
IHC staining, chromogen detection reagent (DAB horseradish
peroxidase color development kit; P0202; Beyotime Institute of
Biotechnology) was used.
The staining results were independently assessed by
two pathologists under a confocal microscope (Leica TCS SPE, Leica
Microsystems GmbH). The pathologists were blinded to the clinical
information. The semi-quantitative assessment of the staining
intensity was performed using a scale of 0 to 3 as follows: i) 0,
no staining; ii) 1, mild staining; iii) 2, moderate staining; and
iv) 3, strong staining. The staining area was recorded according to
the percentage of positive staining cells as per the following
scoring criteria: i) 0, 0%; ii) 1, 1–25%; iii) 2, 26–50%; iv) 3,
51–75%; and v) 4, 76–100%. The final staining score was the sum of
the intensity and area scores. Based on the final staining score,
the results were categorized into three groups: i) 0–1, negative
expression; ii) 2–4, weak expression; and iii) 5–6, strong
expression.
Plasmids and transfections
The BCPAP and TPC-1 cells were transfected with
lentiviruses containing small hairpin RNA (shRNA) to achieve
periostin or HIF-1α silencing. Plasmids of periostin shRNA (cat.
no. sc-61324-SH; Santa Cruz Biotechnology, Inc.), HIF-1α shRNA
(cat. no. sc-35562-SH; Santa Cruz Biotechnology, Inc.) and control
shRNA (cat. no. sc-108060; Santa Cruz Biotechnology, Inc.) were
used to knockdown gene expression. All shRNA sequences are listed
in Table SII Lentiviruses were
produced using a second-generation packaging system. Briefly, 293T
cells (cat. no. SNL-015, Wuhan Sunncell Biotech Co., Ltd.) planted
in 10-cm dishes were transfected with the respective
plenti-shRNA-GFP-Puro vector constructs (10 µg) for shRNA
(periostin shRNA, HIF-1α shRNA and control shRNA) together with the
packaging vectors, psPAX2 (cat. no. 12260; Addgene; 7.5 µg) and
pMD2.G (cat. no. 12259; Addgene; 2.5 µg) using FuGENE 6
transfection reagent (Roche Applied Science). The virus-containing
medium was collected twice at 48 and 72 h post-transfection and
filtered through a 0.45-µm filter. The lentivirus harvests were
concentrated by ultracentrifugation at 110,000 × g for 2 h at 4°C.
Following centrifugation, the supernatant was removed and the
precipitate was resuspended in 200 µl Opti-MEM. The BCPAP or TPC-1
cells were then transduced with lentiviral infection at a
multiplicity of infection (MOI) of 10 for 24 h (37°C, 5%
CO2). The GFP fluorescence intensity was monitored under
a fluorescent microscope (Olympus CKX41, Olympus Corp.). Transduced
cells were screened with puromycin (1 µg/ml) starting at 48 h
following transduction. The interference efficiency was confirmed
through the detection of mRNA expression. After 5–7 days, resistant
polyclonal colonies were further expanded for further analyses
(Fig. S1).
To generate the HIF-1α overexpression plasmid, the
cDNA encoding HIF-1α was amplified using the following primers:
Forward primer, 5′-CAATAGCAGAGCTCTATGGAGGGCGCCGGCGGCGC-3′; and
reverse primer, 5′-CCGGTTAGCGCTAGCTCAGTTAACTTGATCCAAAG-3′. The
amplified fragment was subcloned into the PLV-304 vector obtained
from Asia-vector Biotech, positioned between the SacI (cat.
no. R3156L; New England BioLabs, Inc.) and NheI (cat. no.
R3131L; New England BioLabs, Inc.) restriction sites. Following
transformation, positive clone colonies were selected for plasmid
extraction, and confirmed by sequencing analysis. Subsequently,
transfection was performed using Lipofectamine 3000®
(cat. no. L3000015; Invitrogen; Thermo Fisher Scientific, Inc.).
Briefly, a total of 4×10⁶ 293T cells were plated in
60-mm dishes for 70% fusion on the day of transfection the day
before transfection. Transfection reagents containing 2,500 ng
HIF-1α overexpression plasmid were prepared and transfected
according to the instruction of manufacturer, and an empty PLV-304
vector was used as a negative control. Cells were harvested after
48 h, RNA was prepared and analyzed using RT-PCR. All cells were
cultured in Dulbecco's modified Eagle's High Glucose Medium (DMEM;
cat. no. 11965092; Gibco; Thermo Fisher Scientific, Inc.)
supplemented with 10% fetal bovine serum (cat. no. A5669701; Gibco;
Thermo Fisher Scientific, Inc.), penicillin and streptomycin (cat.
no. 15070063; Gibco; Thermo Fisher Scientific, Inc.) at 37°C with
5% CO2. The interference efficiency was confirmed
through the detection of mRNA expression (Fig. S2).
Cell Counting Kit-8 (CCK-8) assay
The cells (BCPAP and TPC-1) were plated in 96-well
plates at 200 µl per well and incubated with DMEM containing 10%
FBS at 37°C. CCK-8 (BBI Life Sciences Corporation) was used to
determine the proliferation of cells at various time points (0, 24,
48 and 72 h). The cells were incubated with 10 µl CCK-8 solution
for 1 h at 37°C, and the absorbance at 450 nm was then measured
(Biotek EPOCH2, BioTek Instruments, Inc.). Each experiment
consisted of five samples. Every independent experiment was
performed in triplicate.
MTT assay
The cells (BCPAP and TPC-1) were cultured in 96-well
plates at a density of 6×10³ cells per well and then
cultured for either 3 or 5 days. Cell viability was assessed using
MTT assay. Specifically, the cells were incubated with MTT solution
(cat. no. M2128; MilliporeSigma) at a concentration of 0.5 mg/ml
for 4 h at 37°C. Formaldehyde crystals were dissolved by the
addition of dimethyl sulfoxide to each well, and the absorbance at
570 nm was then recorded (Biotek EPOCH2, BioTek Instruments, Inc.).
Each experiment consisted of five samples. Every independent
experiment was repeated three times.
Transwell migration and invasion
assay
Transwell assay was performed to assess the mobility
of the cells. The membranes of chamber were coated with (invasion)
or without (migration) Matrigel (diluted at 1:8; BD Biosciences)
for 2 h at 37°C and cells (BCPAP and TPC-1) were seeded into the
top chambers at a density of 2×10⁴ cells/well. The
bottom chambers were injected with DMEM containing 10% FBS.
Following incubation for 24 h at 37°C, cells invading through
membranes were fixed with 4% paraformaldehyde (A500684, BBI Life
Sciences Corporation) for 20 min and stained with 0.1% crystal
violet (E607309, BBI Life Sciences Corporation) for 30 min at room
temperature while non-invading cells on the top chambers were
removed. Subsequently, the number of invading cells was counted in
six randomly selected visual fields using a fluorescent microscope
(Olympus CKX41, Olympus Corporation). Each experiment consisted of
three samples. Every independent experiment was repeated three
times.
Wound healing assay
The cells (BCPAP and TPC-1) were cultured in a
six-well plate at a density of 5×10⁵ cells/well. A
scratch wound was drawn by a sterile 200 µl pipette tip after the
cells reached 90% confluency. The wells then were then washed with
PBS to remove any cellular debris and incubated with 5%
CO2 at 37°C without serum. The distance of cell
migration was measured by determining the scratch distance at 0 and
24 h under an inverted microscope (IX71/IX51, Olympus Corporation)
using ImageJ software v1.6.0 (National Institutes of Health) on mac
OS (16). The quantification of
cell migration was determined according the following method: %
Migration area=[(area of original wound-area of wound after
healing)/area of original wound] ×100. Each experiment consisted of
three samples. Every independent experiment was repeated three
times.
Reverse transcription-quantitative
polymerase chain reaction (RT-qPCR)
RT-qPCR was performed and total RNA was extracted
from the BCPAP cells using TRIzol® reagent (Thermo
Fisher Scientific, Inc.). Complementary DNA was synthesized using
the Reverse Transcription System kit (Promega Corporation)
according to the manufacturer's instructions. qPCR was performed
using SG Fast qPCR Master Mix [B639273, Sangon Biotech (Shanghai)
Co., Ltd.] and Ex TaqTM kit (DRR100A, Takara
Biotechnology Co., Ltd.). cDNA was amplified with the primer
sequences for: HIF-1α forward, 5′-ATCCATGTGACCATGAGGAAATG-3′ and
reverse, 5′-TCGGCTAGTTAGGGTACACTTC-3′; 125 bp; periostin forward,
5′-CTCATAGTCGTATCAGGGGTCG-3′ and reverse,
5′-ACACAGTCGTTTTCTGTCCAC-3′; 138 bp; GAPDH forward,
5′-GGAGCGAGATCCCTCCAAAAT-3′ and reverse,
5′-GGCTGTTGTCATACTTCTCATGG-3′; 197 bp. The cycling conditions were
95°C for 3 min for denaturation; followed by 45 cycles of 95°C for
7 sec, 57°C for 10 sec, and 72°C for 15 sec. Relative mRNA
expression data were calculated following normalization to GAPDH
mRNA and were evaluated using the 2−ΔΔCq method
(17) with β-actin as an internal
control. Each group consisted of three samples. Every independent
experiment was repeated three times.
Western blot analysis
The BCPAP cells were lysed using RIPA lysis buffer
[cat. no. KWB002; KIGENE (http://www.kejiebio.com/teamview_3566001.html)] and
protein concentration was measured using a BCA kit [cat. no.
KWB011; KIGENE (http://www.kejiebio.com/teamview_6783022.html)]. A
total of 20 µg protein was loaded on a 10% SDS gel, resolved using
SDS-PAGE, and transferred to a PVDF membrane (cat. no. IPVH00010;
Millipore). After blocking the non-specific site with blocking
reagent [cat. no. KWB023-100; KIGENE (http://www.kejiebio.com/teamview_6479337.html)] for 2
h at room temperature, the membranes were incubated overnight with
primary antibodies at 4°C followed by incubation with corresponding
secondary antibodies at room temperature for 1 h. The membranes
were visualized with the Odyssey Infrared Imaging System (LI-COR
Biosciences). The primary antibodies used were as follows:
Anti-HIF1α rabbit monoclonal antibody (cat. no. ab51608; Abcam;
1:500); anti-E-cadherin rabbit monoclonal antibody (cat. no.
ab76319; Abcam; 1:1,000), anti-N-cadherin mouse monoclonal antibody
(cat. no. ab98952; Abcam; 1:1,000); anti-periostin rabbit
polyclonal antibody (cat. no. ab79946; Abcam; 1:500); anti-solute
carrier family 5 member 5 (NIS) rabbit polyclonal antibody (cat.
no. ab240588; Abcam; 1:1,500); anti-GAPDH mouse monoclonal antibody
(cat. no. ab8245; Abcam; 1:1,000). The secondary antibodies were
anti-mouse (cat. no. ab6728, Abcam; 1:4,000) or anti-rabbit (cat.
no. ab6721, Abcam; 1:4,000) antibodies and were conjugated to
horseradish peroxidase. Protein bands were observed using ECL
reagent (cat. no. KWB032, Shanghai kejie Biotechnology Co., Ltd.).
Each group consisted of eight samples. Every independent experiment
was repeated three times.
Chromatin immunoprecipitation
(ChIP)
ChIP assay was performed by using a kit
(MilliporeSigma; cat. no. 17-295), according to the manufacturer's
instructions. The BCPAP cells were inoculated in a dish with a
diameter of 10 cm at the density of 1×10⁷ cells. A
concentration of 37% formaldehyde was added to the BCPAP cells. The
protein was lysed using 400 µl of 1% SDS lysate and centrifugated
at 19,480 × g at 4°C for 10 min. Normal mouse IgG (cat. no. c2110;
Applygen; 1:2,000) as a negative control, or HIF-1α (cat. no.
ab243860; Abcam; 1:1,000) antibodies were applied to
immunoprecipitated chromatin samples. Subsequently, RT-qPCR was
performed by using four primer sets for putative HIF-1α binding
sites in the periostin promoter. The sequences of primers 1 to 4
for the periostin promoter were as follows: Primer 1 forward,
5′-TGTGGTTTCACTGTGTGCTT-3′ and reverse, 5′-TGGGAAGGCTTTAGGGGAAC-3′;
primer 2 forward, 5′-ACCATTTCAGCTCATTGTTTCCC-3′ and reverse,
5′-CCTAGCCAAAGGAATGTGCGT-3′; primer 3, forward
5′-TTTTGGCAATGTCCATGTTTCCTA-3′ and reverse,
5′-TGCAGCACATCTACTGATAACCA-3′; primer 4 forward,
5′-TCTACTCTGGAAAGGATTGCAGAA-3′ and reverse,
5′-GGAACACATTGAGCTACTTTTCCT-3′. Each experiment consisted of three
samples. Every independent experiment was performed in
triplicate.
Dual luciferase reporter assay
The 293T cells (cat. no. SNL-015, Wuhan Sunncell
Biotech Co., Ltd.) were co-transfected with periostin-promoter-WT
(wild-type) or periostin-promoter-mut (mutant-type) and HIF-1α
overexpression plasmid using Lipofectamine 2000® (Thermo
Fisher Scientific, Inc.). The plasmids were purchased from
Asia-Vector Biotechnology, Co. Ltd. (http://www.asiavectorbio.cn/gongsijianjie/). Lysates
of the cells were incubated at 37°C for 72 h following
transfection. Subsequently, Firefly and Renilla luciferase
activities were measured using the dual luciferase reporter gene
detection kit (Promega Corporation; cat. no. E1910) according to
the manufacturer's instructions. Each experiment consisted of three
samples. Each independent experiment was performed in
triplicate.
Determination of adenosine
triphosphate (ATP) and lactate dehydrogenase (LDH) content
The ATP and LDH contents were evaluated using the
corresponding content detection kit (Nanjing Jiancheng
Bioengineering Institute) according to the manufacturer's
instructions. The BCPAP cells were added to 96-well plates and
incubated at 37°C for 48 h. Subsequently, luminescence reagent was
added, and the cells were incubated for 30 min at 37°C. Then
luminescence was observed using GloMax Discover (Promega
Corporation) while standard curves were established with ATP or LDH
standards. The ATP or LDH content was calculated by reading
luminescence intensity according to the standard curves. Each
independent experiment was performed in triplicate.
Oxygen consumption rate (OCR) and
extracellular acidification rate (ECAR) assays
The Seahorse extracellular flux analyzer (cat. no.
XF96; Agilent Technologies, Inc.) was employed to assess OCR and
ECAR. In brief, the BCPAP cells were seeded in XF96 Seahorse plates
at a density of 2×10⁴ cells per well and pre-treated
with 100 µM ferric ammonium citrate or deferoxamine at 37°C for 12
h before analysis. Subsequently, 10 mM glucose, 1 µM oligomycin,
and 100 mM 2-deoxyglucose were added at specific time points for
ECAR measurement by Seahorse analyzer. For OCR measurement,
sequential additions of 1 µM oligomycin, 0.5 µM carbonyl cyanide
4-(trifluoromethoxy) phenylhydrazone and 1 µM rotenone/antimycin A
were added. Following the Seahorse assays, the results were
normalized to cell number, and each independent experiment was
repeated three times.
Statistical analysis
All of the statistical analyses were performed using
SPSS V.20.0 for Mac (IBM Corp.). Quantitative data are presented as
the mean ± standard error of mean (mean ± SEM) and differences
between groups were assessed using the Student's t-test (unpaired,
two-tailed). Multi-group comparisons were conducted using one-way
analysis of variance followed by Tukey's honestly significant
difference post-hoc test. The Chi-squared test (two-tailed) and
Fisher's exact test were used for the comparison of categorical
variables in the IHC data. P<0.05 was considered to indicate a
statistically significant difference. Prism 8.0 software (GraphPad
Software, Inc.) was used to prepare the graphs.
Results
Periostin and HIF-1α expression in
TC
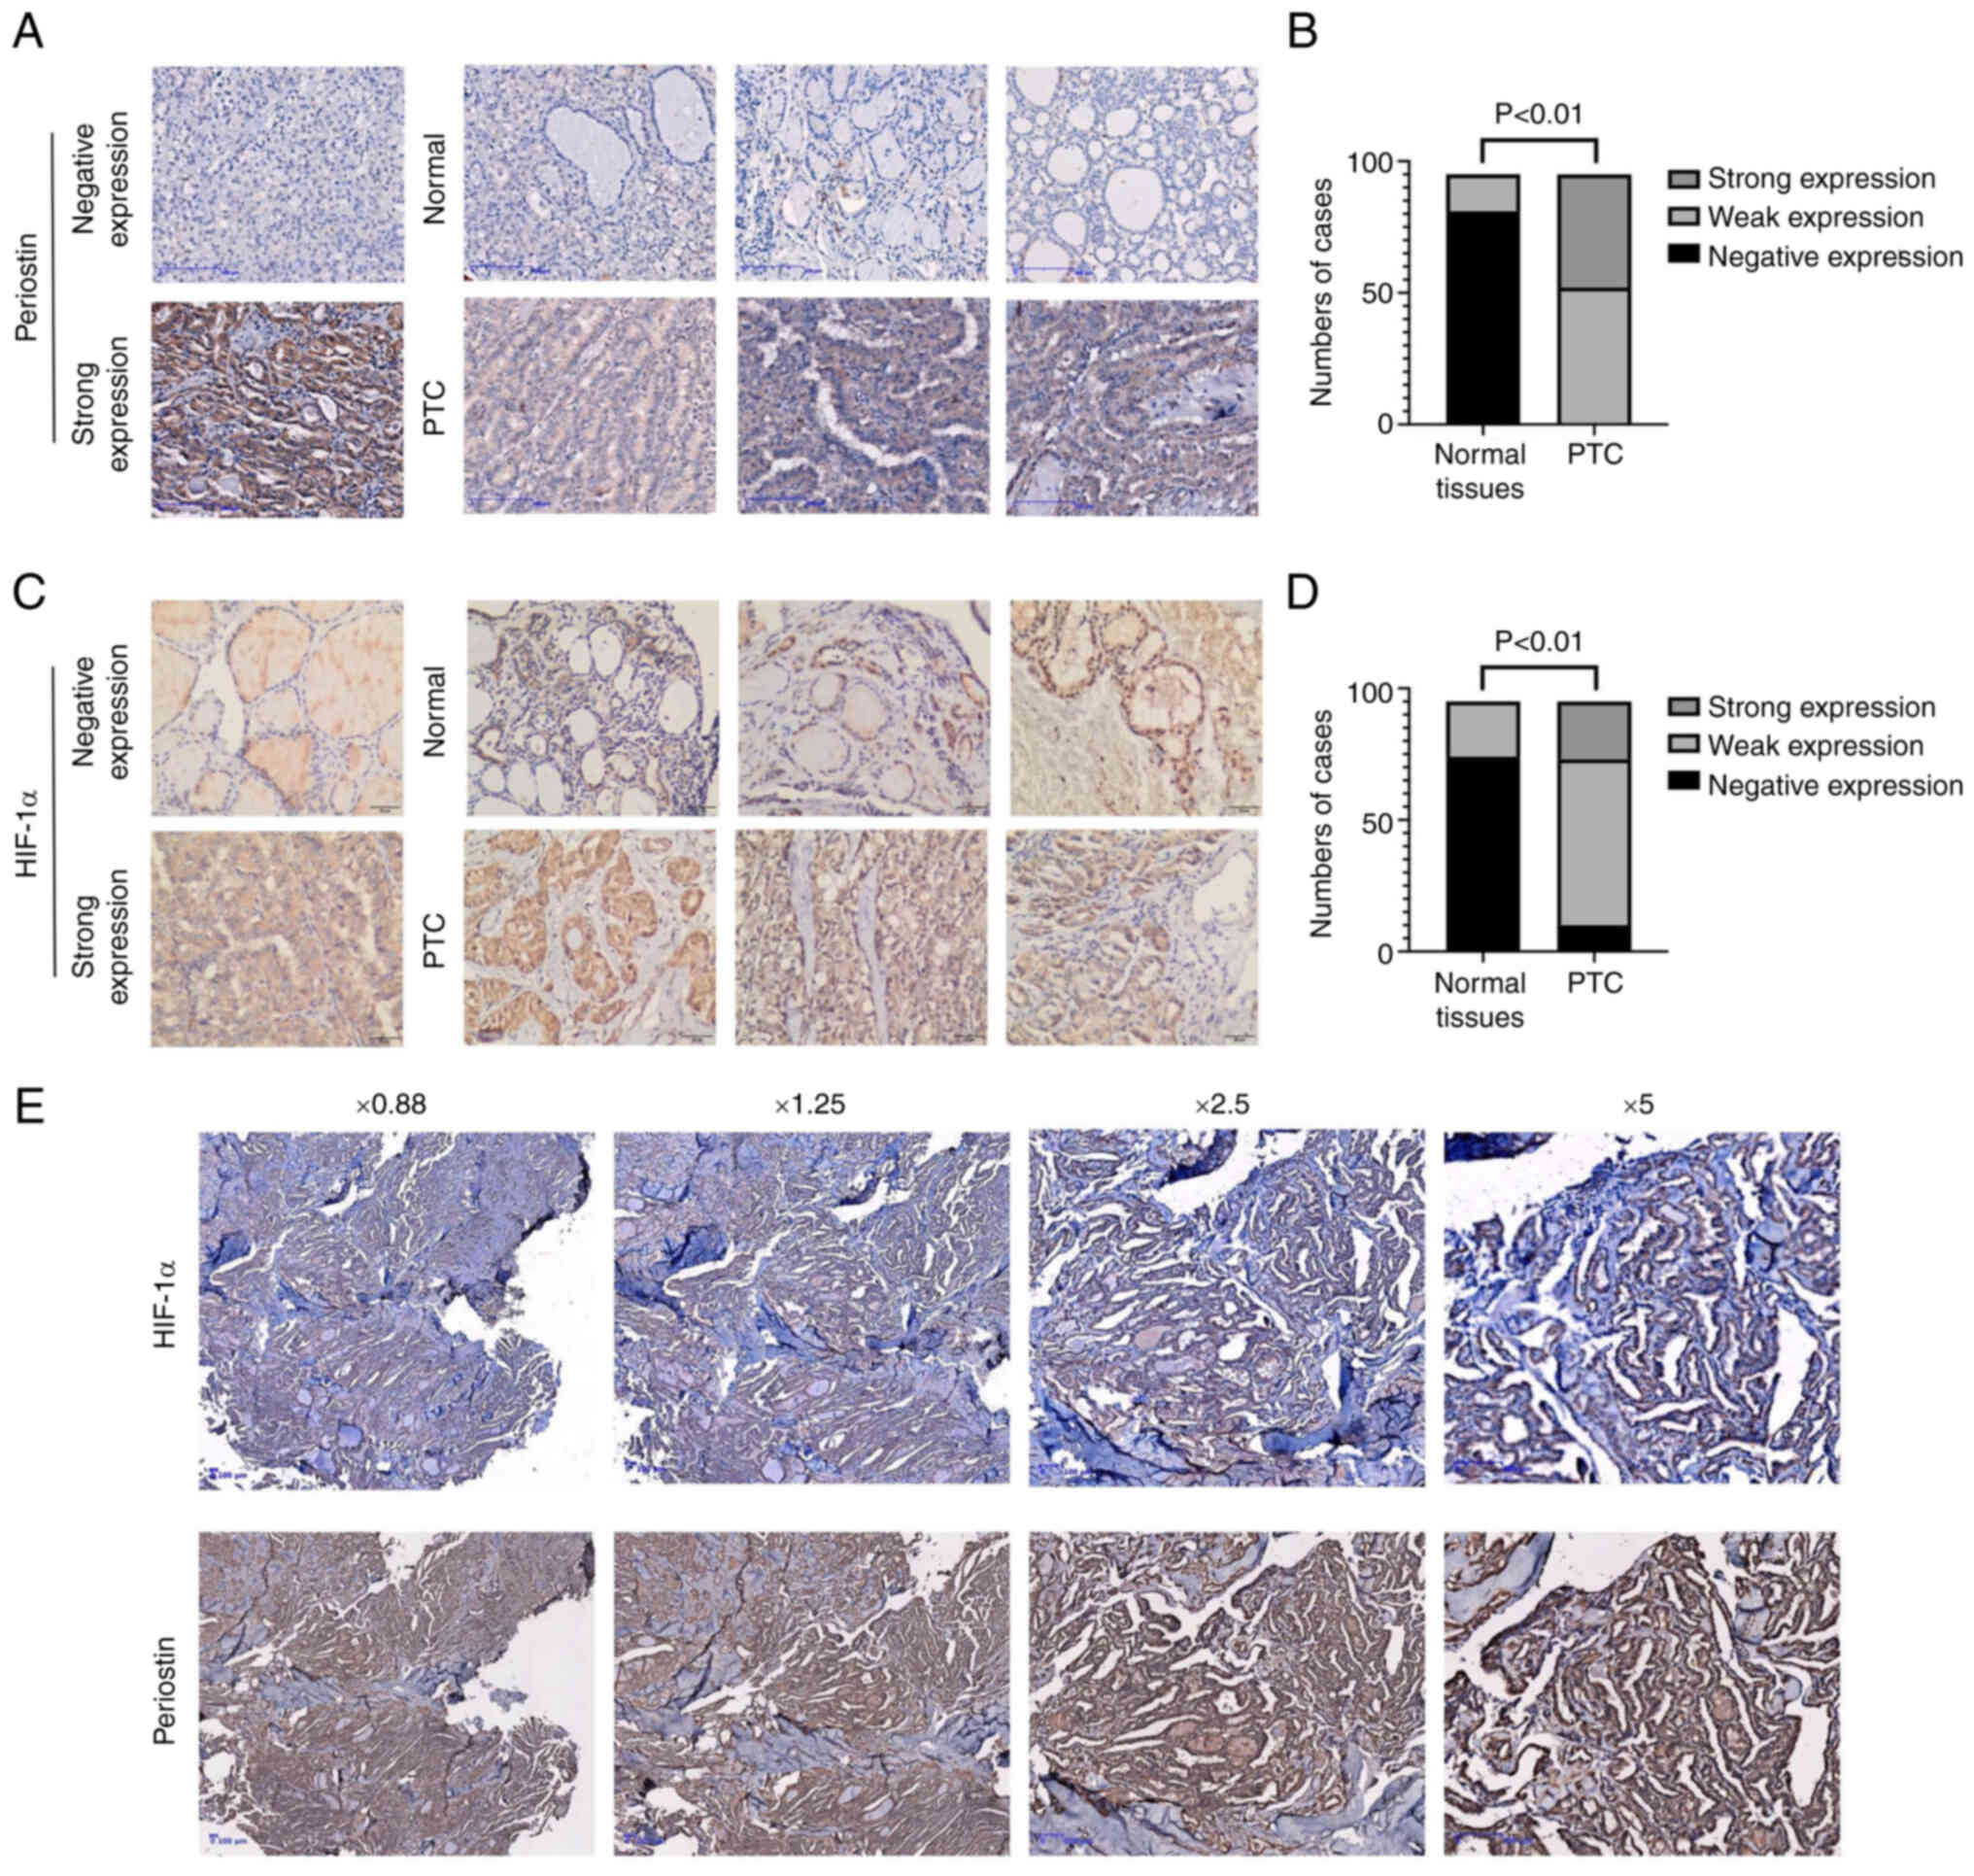
The expression levels of periostin and HIF-1α in 95
paired samples of papillary TC and adjacent normal thyroid tissues
were assessed using IHC of paraffin slides. As presented in
Fig. 1A, periostin was localized in
the cytoplasm and demonstrated strong staining in epithelial cancer
cells. Periostin expression was upregulated in TC tissues, as
compared with normal thyroid tissues, with 52 cases exhibiting a
weak expression and 43 cases a strong expression; by contrast, only
14 cases exhibited a weak expression and 81 a negative expression
in normal thyroid tissue (P<0.01; Fig. 1B). Similar to periostin, HIF-1α also
exhibited a higher expression in TC tissues than in normal tissues
(Fig. 1C), with 10 cases exhibiting
a negative expression, 63 a weak expression and 22 a strong
expression; by contrast, 74 cases exhibited a negative expression
and 21 a weak expression in normal tissues (P<0.01; Fig. 1D). In the 22 cases demonstrating a
strong expression of HIF-1α, 20 cases simultaneously exhibited a
strong expression of periostin. In addition, the HIF-1α-negative
cases exhibited a weak expression of periostin (data not shown). In
Fig. 1E, the coexistence of HIF-1α
and periostin strong expression in the adjacent sections of the
same tissue is presented.
Hypoxia upregulates the expression of
periostin in TCs via HIF-1α
A previous study by the authors demonstrated the
upregulated expression of periostin mRNA in the BCPAP cell line
(9). The BCPAP cell line is a TC
cell line with BRAF V600E mutation and exhibit poor biological
behavior, and the authors' team have experience using BCPAP cells
in a previous study (15). Thus,
the BCPAP cell line was used for the investigation of regulatory
mechanisms of periostin expression in TC. To assess the effects of
hypoxia on TC cells and the biological role of the
hypoxia-HIF-1α-periostin axis in TCs, the BCPAP cells were cultured
under normoxic (20% O2) or hypoxic (1% O2)
conditions separately. The HIF-1α and periostin mRNA levels in the
BCPAP cells were assessed using RT-qPCR under normoxic (20%
O2) and hypoxic (1% O2) conditions, with or
without transfection with periostin shRNA. The mRNA expression of
HIF-1α in the BCPAP cells under hypoxic conditions was
significantly higher in comparison to that under normoxic
conditions (P<0.05). In comparison to the BCPAP cells
transfected with periostin shRNA under normoxic conditions, the
HIF-1α mRNA expression level in the BCPAP cells was significantly
higher following transfection with periostin shRNA under hypoxic
conditions (Fig. 2A). The mRNA
expression of periostin in the BCPAP cells under hypoxic conditions
was significantly higher than that under normoxic conditions
(P<0.01). The mRNA expression of periostin significantly
decreased following transfection with periostin shRNA under
normoxic conditions (P<0.05). Additionally, in comparison to the
cells transfected with periostin shRNA under normoxic conditions,
the periostin mRNA expression level in the BCPAP cells
significantly increased following transfection with periostin shRNA
under hypoxic conditions (P<0.01; Fig. 2B). Subsequently, the HIF-1α and
periostin mRNA levels were examined using quantitative RT-qPCR in
the BCPAP cells under normoxic (20% O2) and hypoxic (1%
O2) conditions, with or without transfection with HIF-1α
shRNA. The results presented in Fig.
2C demonstrate that hypoxia significantly increased the
expression of HIF-1α (P<0.01) and transfection with HIF-1α shRNA
attenuated this effect (P<0.01). At the same time, hypoxic
conditions also induced a significant increase in periostin
expression (P<0.01). However, transfection with HIF-1α shRNA
limited the upregulation of periostin expression (P<0.01;
Fig. 2D). As demonstrated using
western blot analysis, hypoxia increased the protein expression of
HIF-1α and periostin, as well as that of the EMT-related proteins,
N-cadherin and NIS (sodium-iodide symporter), and decreased the
expression of E-cadherin. When the cells were transfected with
shRNA against periostin, the N-cadherin and NIS level decreased,
while that of E-cadherin increased under both normoxic and hypoxic
conditions (Fig. 2E). The knockdown
of HIF-1α exerted a similar effect on EMT-related proteins and
inhibited the protein expression of periostin (Fig. 2F).
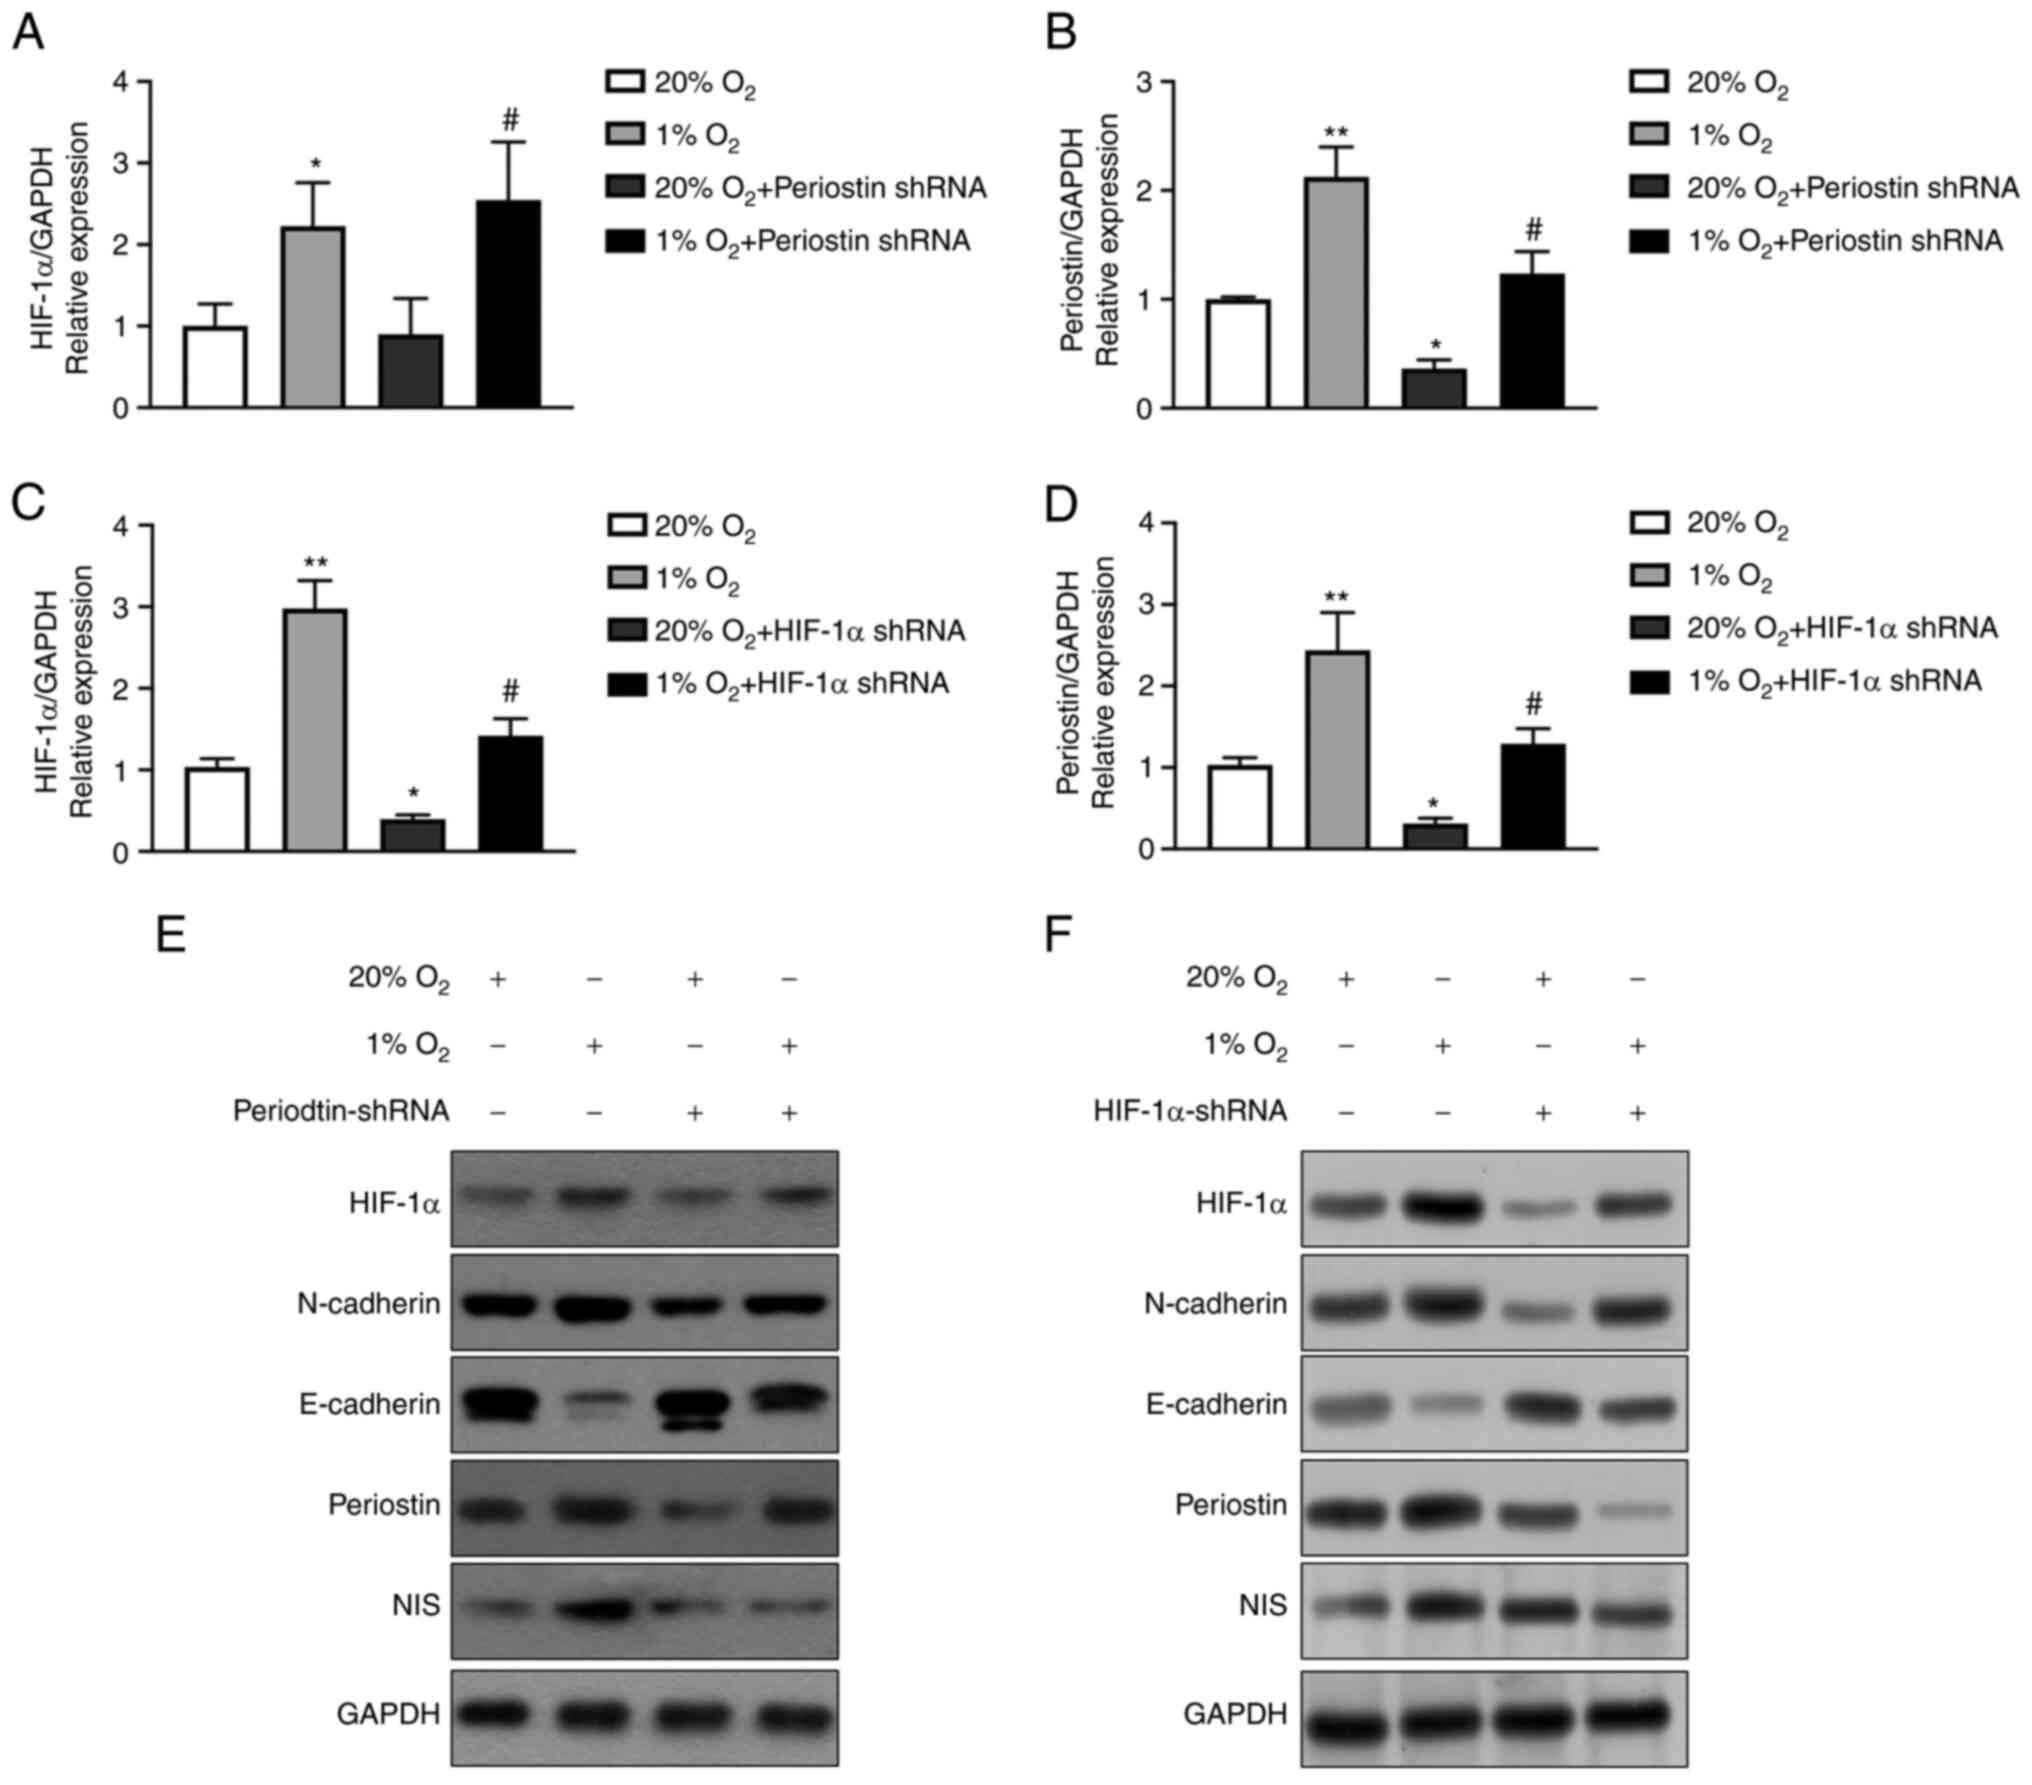 | Figure 2.Hypoxia upregulates the expression of
periostin in TC cells via HIF-1α. (A) Results of RT-qPCR analysis:
the expression of HIF-1α mRNA in BCPAP cells under hypoxic
conditions for 24 h was significantly greater than that under
normoxic conditions (*P<0.05). Compared to transfection with
periostin shRNA under normoxic conditions, the mRNA expression of
HIF-1α in BCPAP cells significantly increased with periostin shRNA
transfection under hypoxic conditions (#P<0.05). n=3
biological replicates. Error bars represent standard deviation. (B)
Results of RT-qPCR analysis: The mRNA expression of periostin in
BCPAP cells under hypoxic conditions for 24 h was significantly
greater than that under normoxic conditions (**P<0.01). The mRNA
expression of periostin significantly decreased following
transfection with periostin shRNA under normoxic conditions
(*P<0.05). As compared to transfection with periostin shRNA
under normoxic conditions, the mRNA expression of periostin in the
BCPAP cells significantly increased following periostin shRNA
transfection under hypoxic conditions (#P<0.01). n=3
biological replicates. Error bars represent standard deviation. (C)
Results of RT-qPCR analysis: The expression of HIF-1α mRNA in
BCPAPs under hypoxic conditions for 24 h is significantly greater
as compared normoxia (**P<0.01). The expression of HIF-1α mRNA
significantly decreased following transfection with HIF-1α shRNA
under normoxic conditions (*P<0.01). Compared to transfection
with HIF-1α shRNA under normoxic conditions, the mRNA expression of
HIF-1α in BCPAP cells increased following transfection with HIF-1α
shRNA under hypoxic conditions (#P<0.01). n=3
biological replicates. Error bars represent standard deviation. (D)
Results of RT-qPCR analysis: The mRNA expression of periostin in
BCPAP cells under hypoxic conditions for 24 h was significantly
greater than under normoxic conditions (**P<0.01). The
expression of periostin mRNA significantly decreased following the
transfection of HIF-1α shRNA under normoxic conditions
(*P<0.05). As compared to transfection with HIF-1α shRNA under
normoxic conditions, the mRNA expression of periostin in the BCPAP
cells significantly increased following transfection with HIF-1α
shRNA under hypoxic conditions (#P<0.01). n=3
biological replicates. Error bars represent standard deviation. (E)
Western blot analysis of HIF-1α, N-cadherin, E-cadherin, periostin
and NIS under normoxic or hypoxic conditions, with or without
periostin shRNA transfection. (F) Western blot analysis of HIF-1α,
N-cadherin, E-cadherin, periostin and NIS under normoxic or hypoxic
conditions, with or without HIF-1α shRNA transfection. TC, thyroid
cancer; HIF-1α, hypoxia inducible factor 1 subunit α; RT-qPCR,
reverse transcription-quantitative polymerase chain reaction; NIS,
solute carrier family 5 member 5. |
Effects of hypoxia and periostin on
the proliferation of TC cells
CCK-8 assay was conducted to examine the
proliferation of BCPAP and TPC-1 cells. The viability of the BCPAP
and TPC-1 cells at different time points (24, 48 and 72 h) of
culture under normoxic or hypoxic conditions with or without
periostin shRNA transfection is shown in Fig. 3A and B. The results revealed that
hypoxia enhanced the viability of the BCPAP cells, while periostin
shRNA inhibited the viability of the BCPAP cells under both
normoxic and hypoxic conditions. MTT assay also revealed similar
results. After culturing for 3 and 5 days, both the BCPAP and TPC-1
cells exhibited a significant elevation in proliferation under
hypoxic compared to normoxic conditions; however, transfection with
periostin shRNA inhibited the effects of hypoxia (Fig. 3C-F). Fig. 3C and E demonstrate that when
cultured for 72 h, the proliferation of BCPAP and TPC-1 cells under
hypoxic conditions was significantly greater than that under
normoxic conditions (P<0.05); transfection with periostin shRNA
inhibited the proliferation of BCPAP cells (P<0.01). Hypoxia
combined with periostin shRNA transfection inhibited the
proliferation of BCPAP cells compared to the cells subjected only
to hypoxia (P<0.05).
Effect of hypoxia and periostin on the
invasion and migration of TC cells
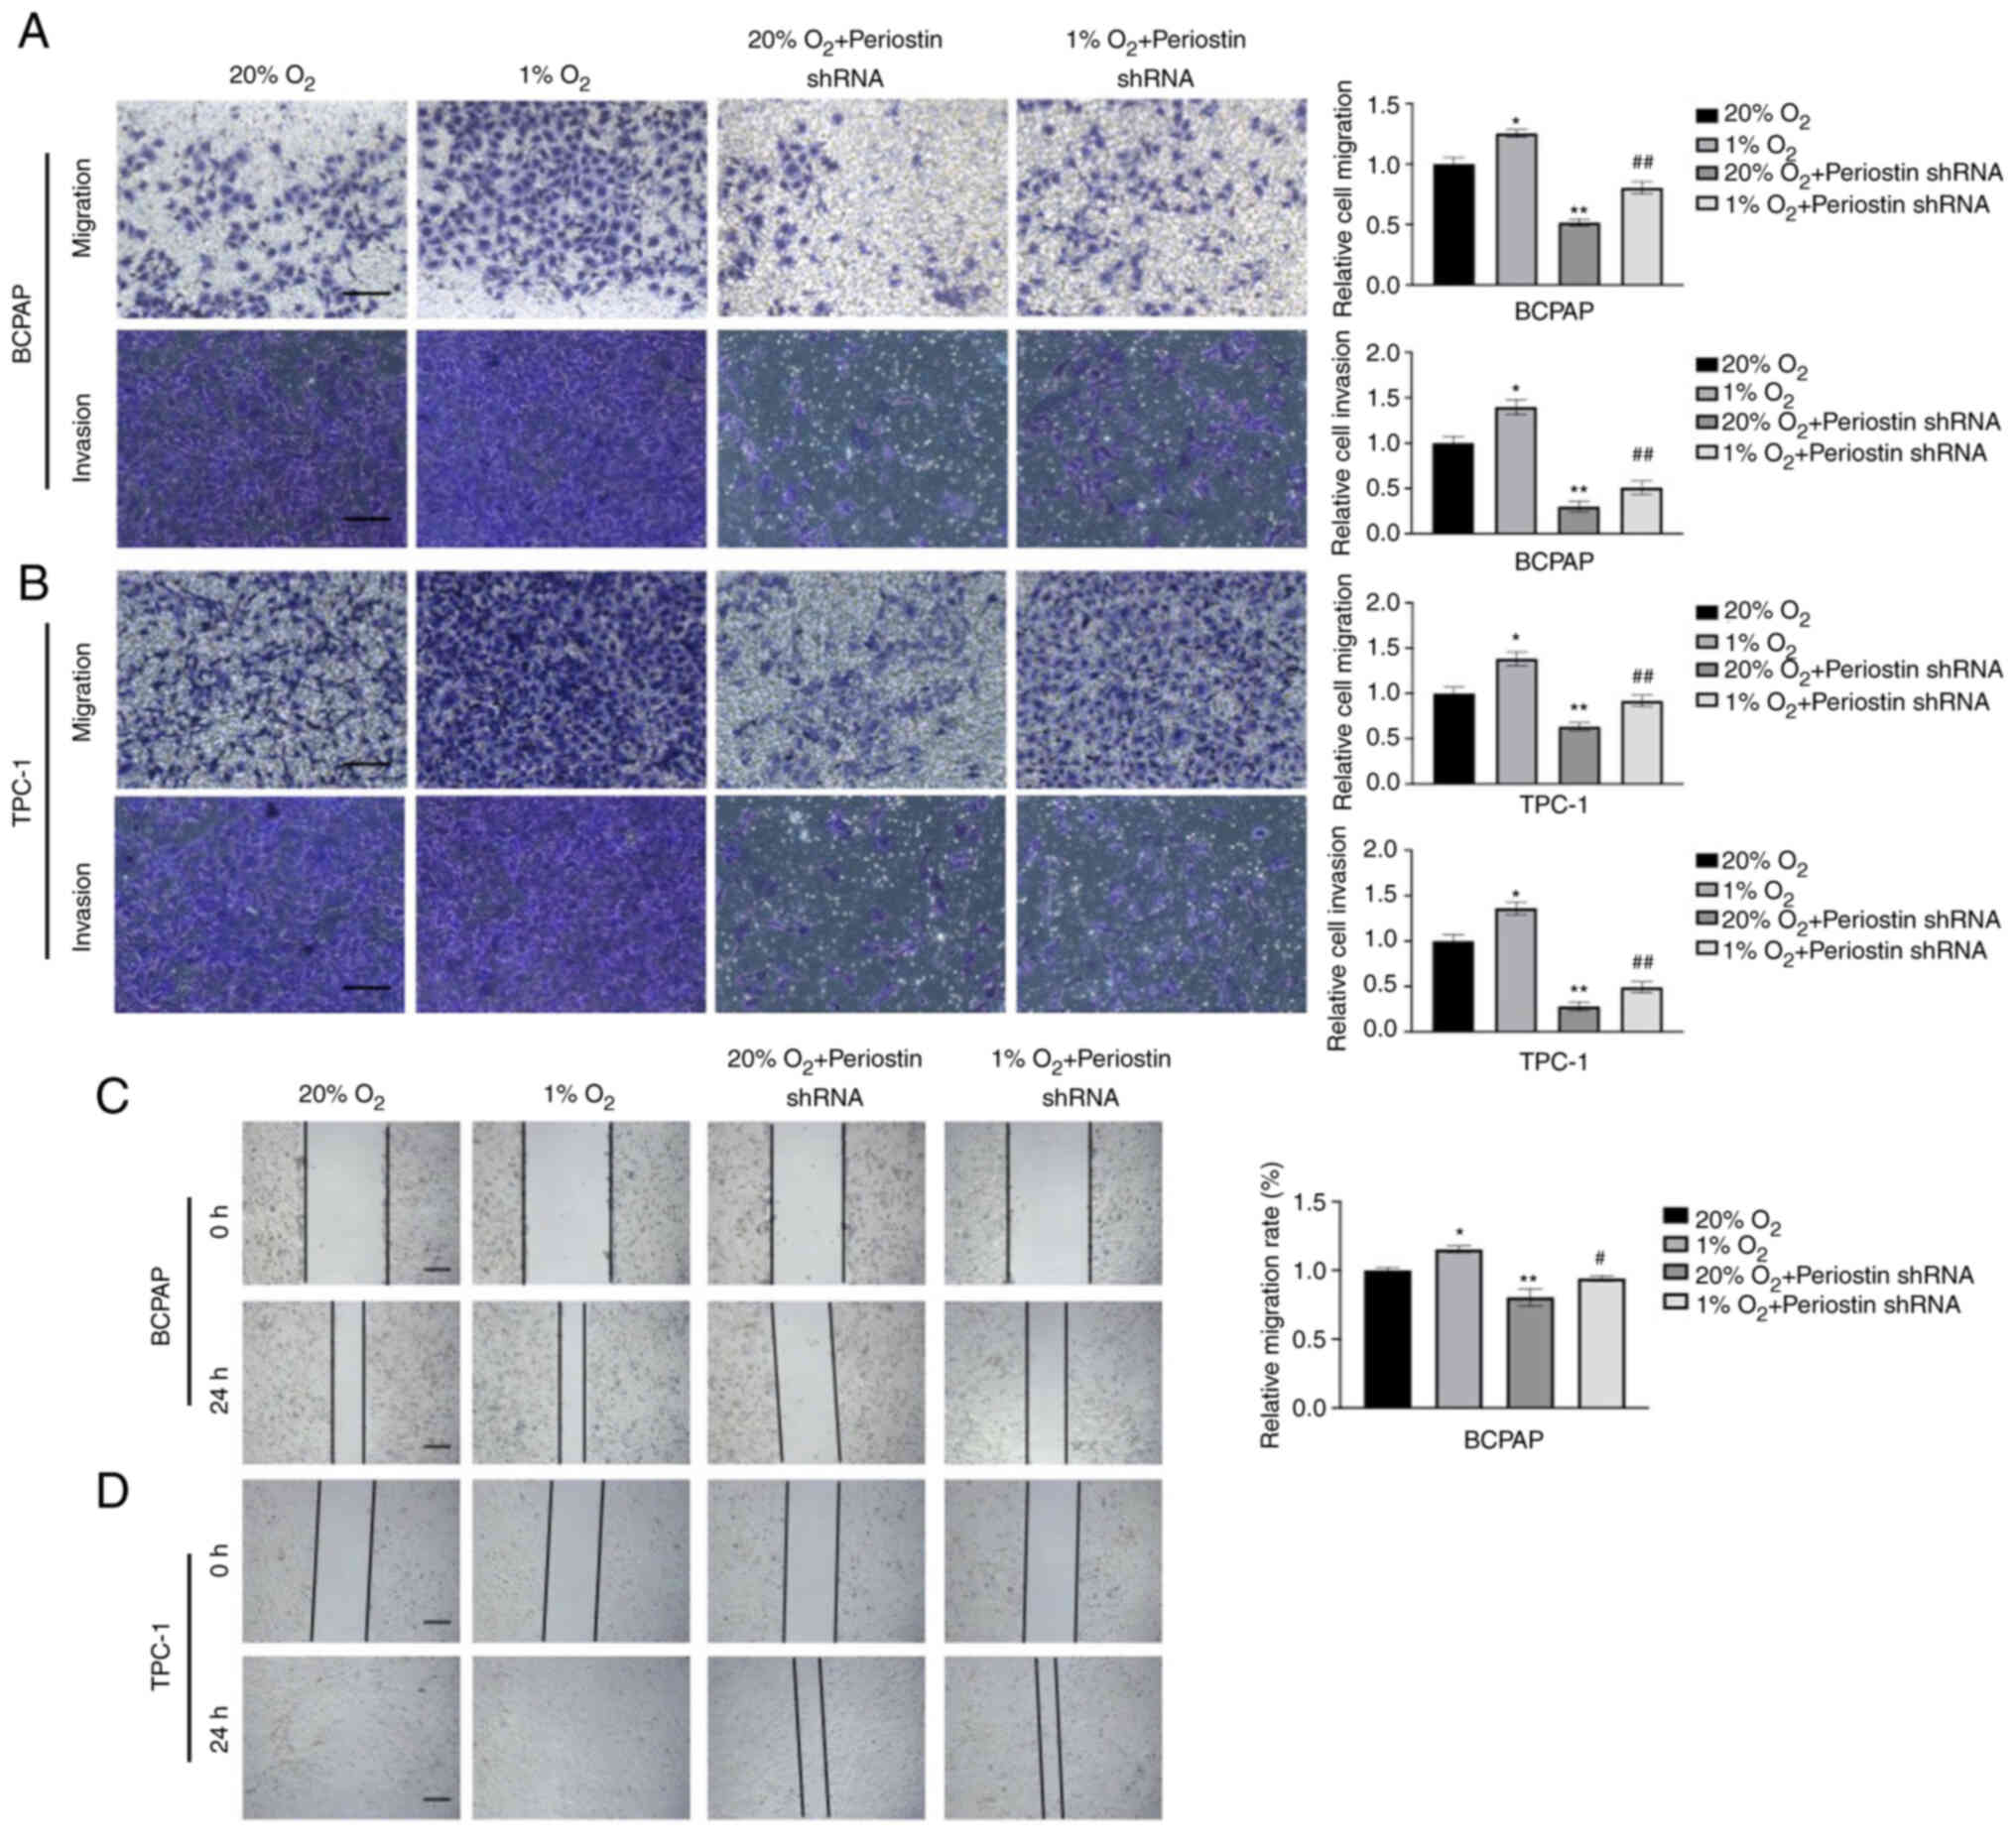
In a previous study by the authors, the knockdown of
periostin significantly reduced the invasiveness of BCPAP cells
(9). In the present study,
Transwell assay was performed to evaluate the effects of the
interaction between hypoxia and periostin on the invasion and
migration of BCPAP cells. As shown in Fig. 4A and B, the invasiveness and
migratory ability of the BCPAP and TPC-1 cells under hypoxic
conditions was significantly greater than that under normoxic
conditions (P<0.05). The knockdown of periostin following
transfection with periostin shRNA markedly inhibited the
invasiveness and migratory ability of the cells (P<0.01).
Notably, the combination of hypoxia and periostin shRNA
transfection remitted the invasiveness and migratory capability of
the cells compared with that of the cells transfected with
periostin shRNA under normoxic conditions. The results of wound
healing assay also suggested the same effect. A more rapid
migration was observed in the BCPAP cells under hypoxic conditions,
as compared with that under normoxic conditions (P<0.05), and in
TPC-1 cells, full confluency was observed under hypoxic conditions,
while partial confluency was observed under normoxic conditions.
Furthermore, periostin knockdown inhibited the migration in both
BCPAP and TPC-1 cells, and hypoxia combined with periostin shRNA
remitted the mobility of cells (Fig. 4C
and D).
Molecular mechanisms of regulation of
periostin expression by HIF-1α
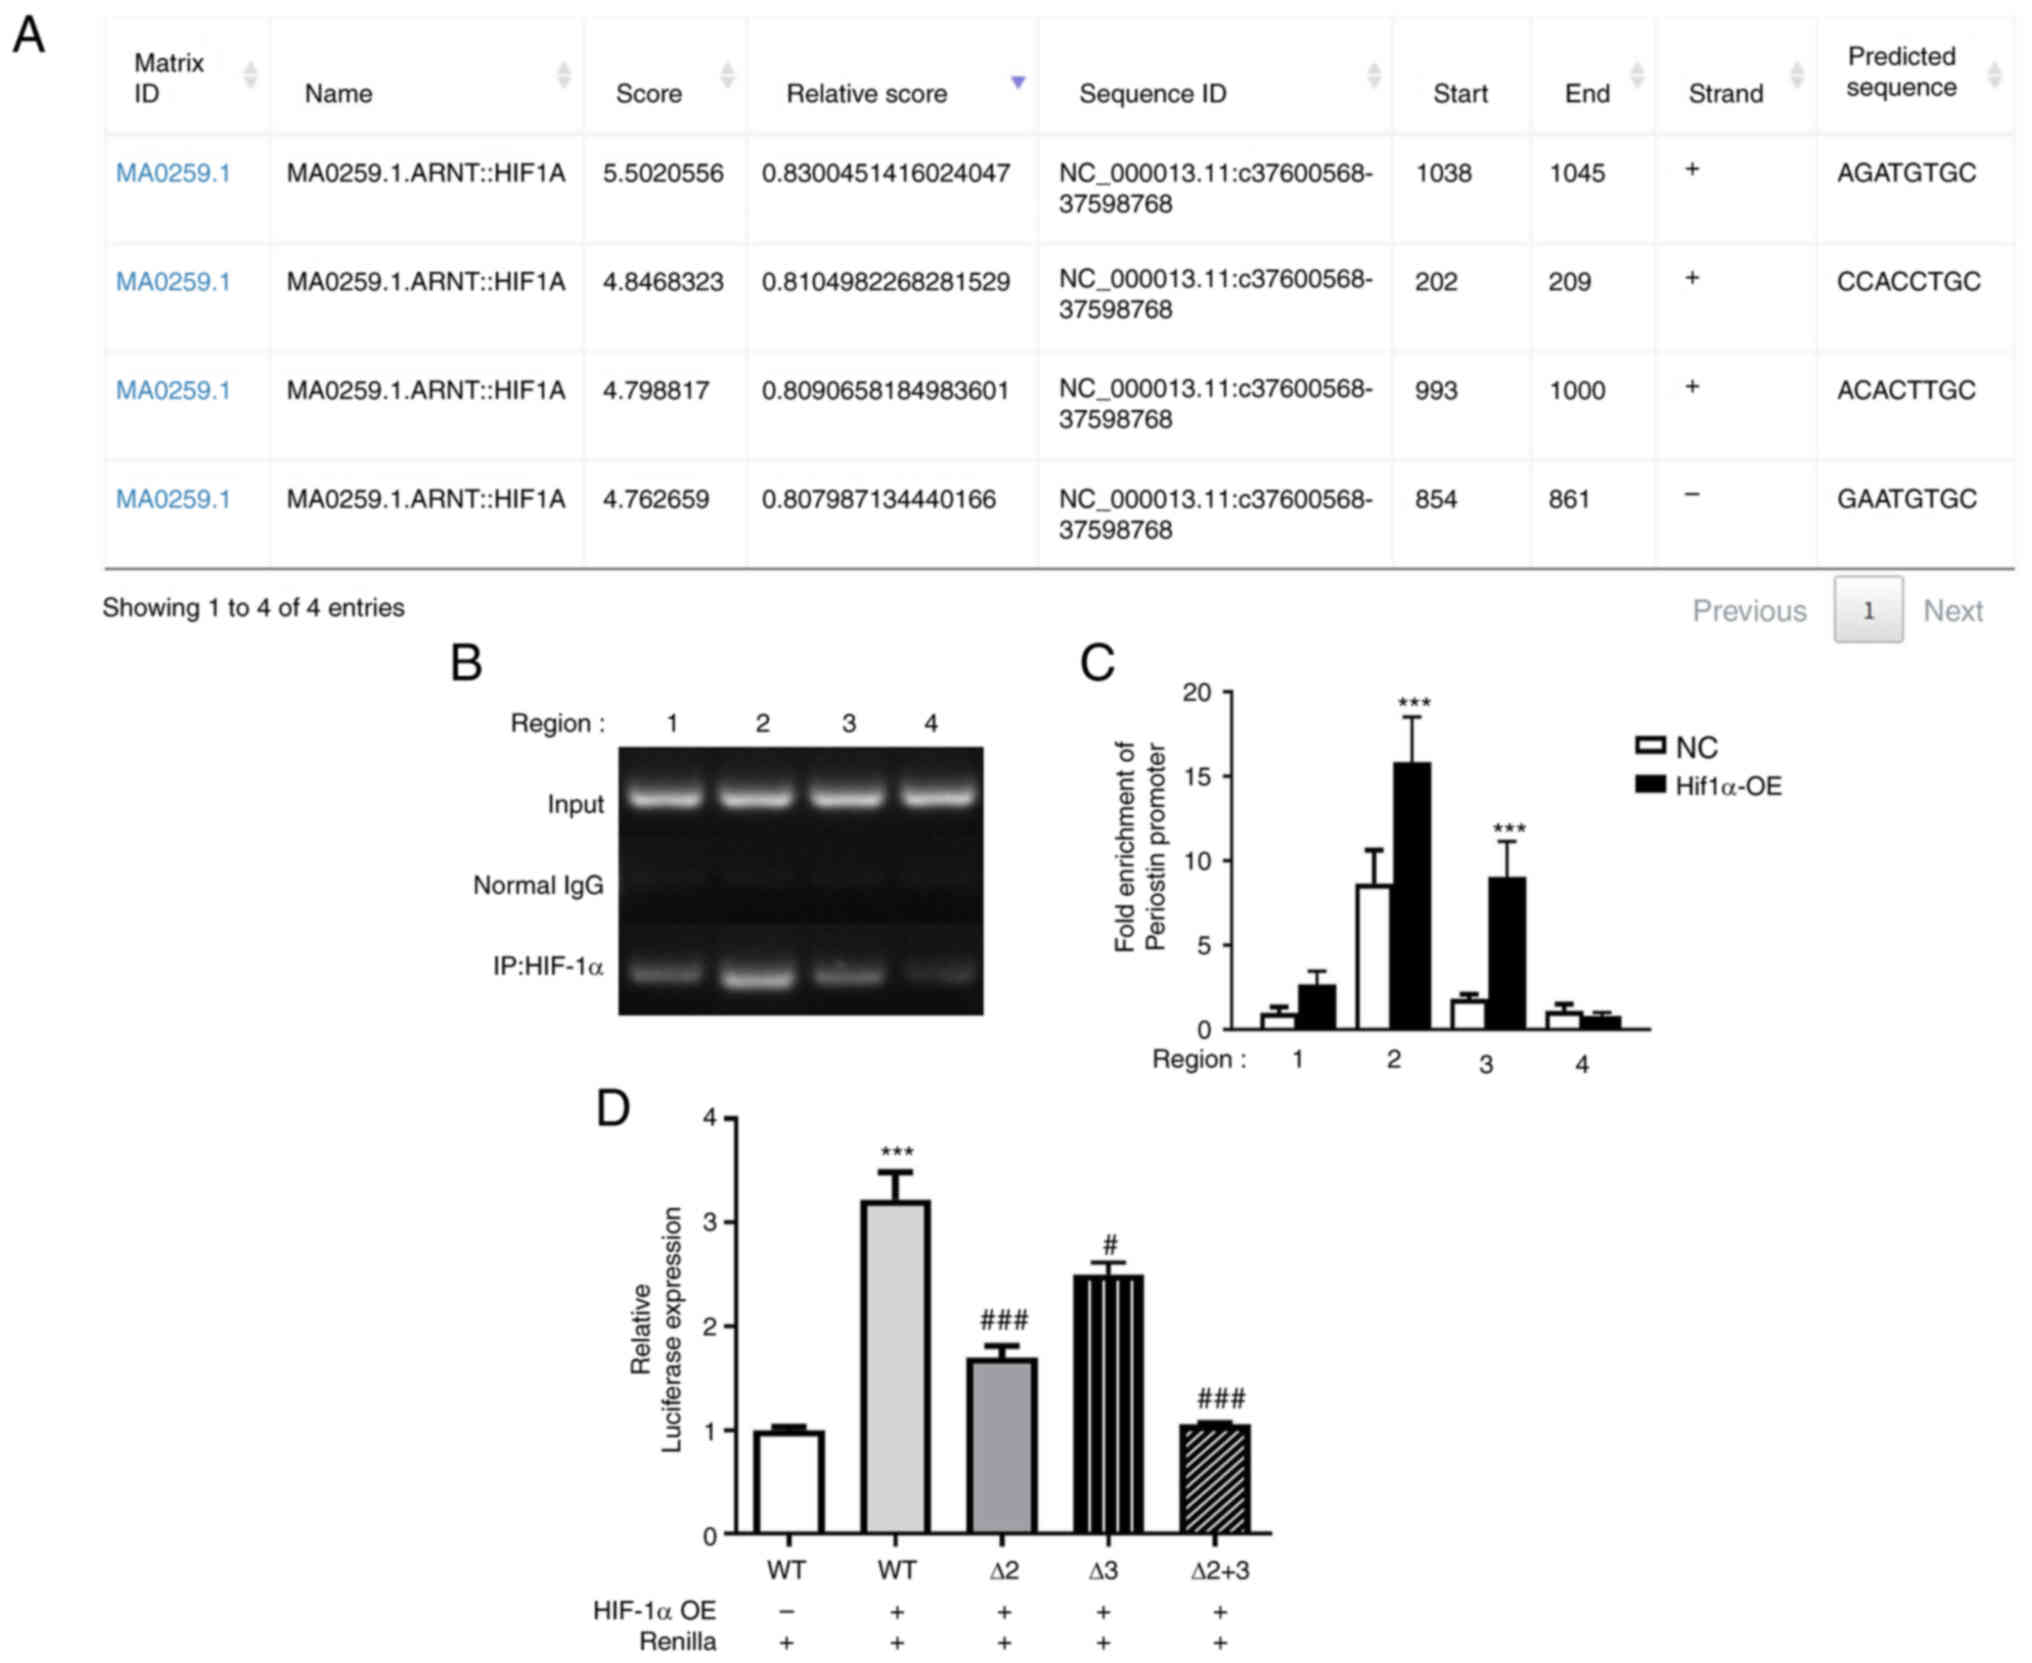
Subsequently, the present study aimed to investigate
the underlying molecular mechanisms by which HIF-1α regulates
periostin gene expression in TCs. Immunoprecipitation assay and
luciferase reporter assay were performed to analyze the human
periostin promoter with respect to putative HIF-1α binding sites.
The human periostin promoter contains four HIF-1α consensus
sequences as potential binding sites, which were predicted using
JASPAR, and are presented in Fig.
5A. Regions amplified with four different primer pairs (primer
1-primer 4) subsequently tested using immunoprecipitation.
Immunoprecipitation with BCPAP cells (negative control cells and
HIF-1α overexpression cells) was then performed. The results of DNA
agarose gel electrophoresis are presented in Fig. 5B, with region 2 demonstrating the
highest signal. The quantification of the target DNA was achieved
using RT-qPCR and the results are presented in Fig. 5C. Immunoprecipitation analysis
revealed that in HIF-1α-overexpressing cells, binding of HIF-1α in
region 2 and region 3 was significantly amplified as compared with
negative control BCPAP cells (P<0.001), and fold enrichment of
region 2 was higher. Additionally, luciferase reporter assay was
conducted, in order to further elucidate the mechanisms by which
HIF-1α regulates periostin (Fig.
5D). In comparison with the blank control group, the
co-transfection of periostin-promoter-wild type (WT) with HIF-1α
overexpression plasmid significantly increased the luciferase
activity (P<0.001). Conversely, the co-transfection of the
mutant periostin-promoter of Δ2 mutant-type (region 2 deletion
mutation) or Δ3 mutant-type (region 3 deletion mutation) with the
HIF-1α overexpression plasmid resulted in a significantly decreased
luciferase activity, as compared to periostin-promoter-WT
(P<0.05). When region 2 and region 3 were simultaneously mutated
(Δ2+3 mutant-type), the luciferase activity returned to baseline.
These results, combined with the results of immunoprecipitation
assay, suggested that HIF-1α increased the periostin levels by
binding to the periostin promoter.
Hypoxia induces Warburg effect via
upregulation of periostin expression
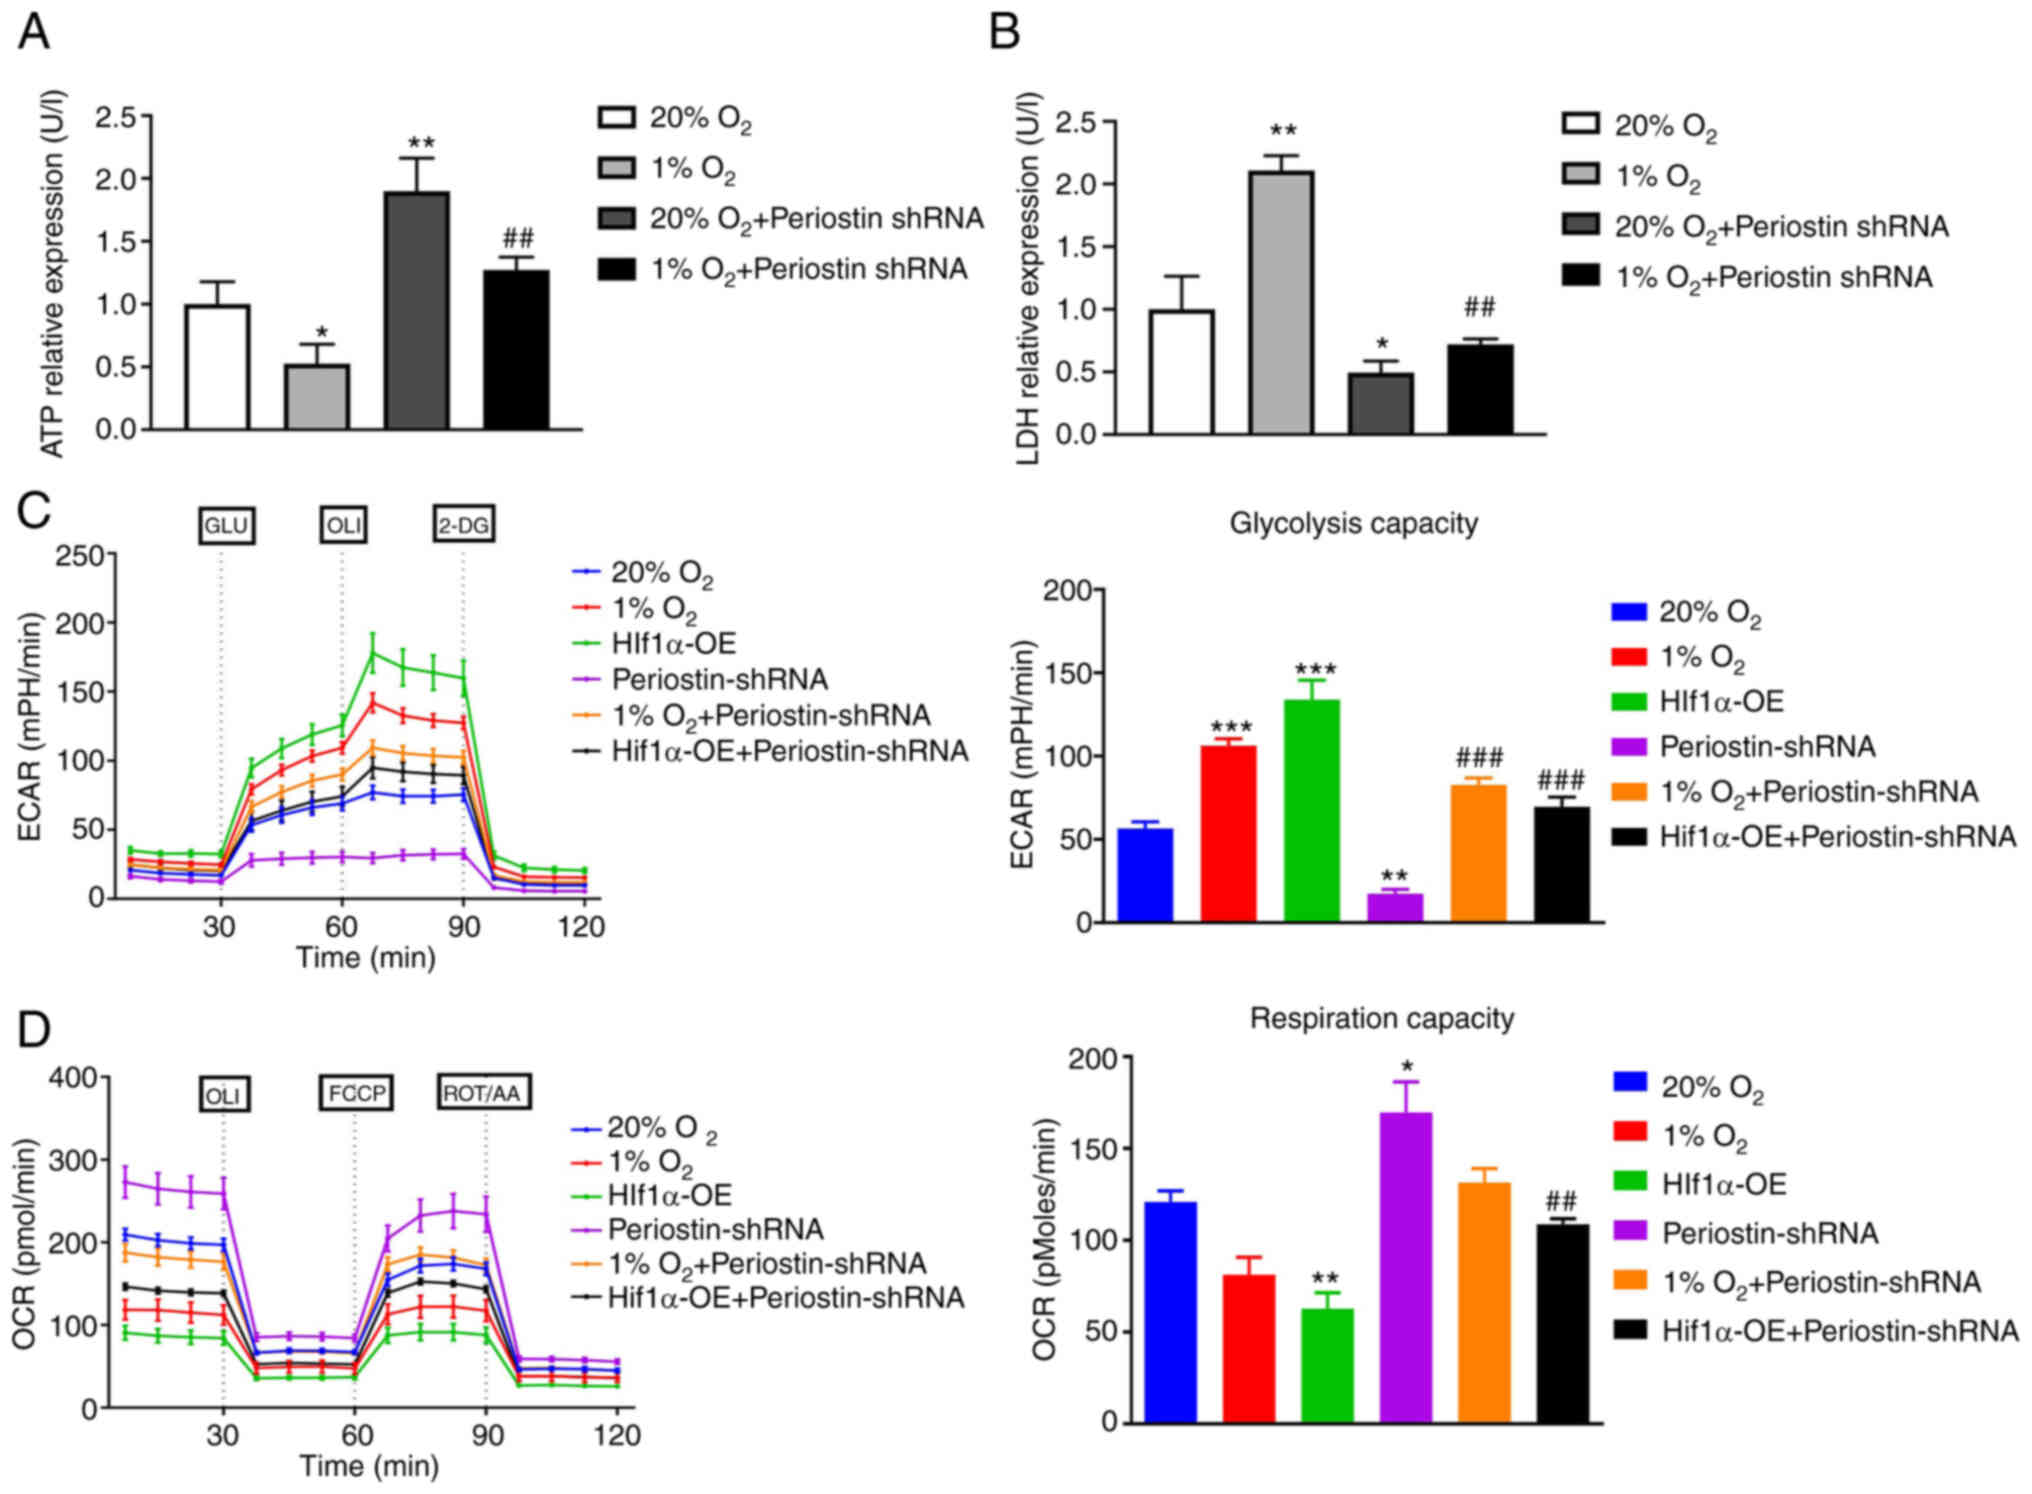
The Warburg effect refers to the phenomenon wherein
cancer cells utilize a significant amount of energy through
glycolysis, even in the presence of oxygen, in order to support
their uncontrolled growth (18).
Changes in ATP and LDH are key indicators of the switch of cellular
metabolism from the tricarboxylic acid cycle to glycolysis.
Phosphomolybdic acid colorimetry revealed that the level of ATP in
the BCPAP cells was significantly decreased under hypoxic
conditions compared to that under normoxic conditions (P<0.05).
Transfection with periostin shRNA under normoxic conditions
significantly increased the ATP expression in the BCPAP cells
(P<0.01). Compared to hypoxic group, transfection with periostin
shRNA under hypoxic conditions significantly increased ATP
expression in BCPAPs (P<0.01; Fig.
6A). Similarly, LDH expression in BCPAPs under hypoxic
conditions was significantly increased in comparison with normoxic
conditions (P<0.05). Transfection with periostin shRNA under
normoxic conditions significantly decreased the LDH expression in
BCPAPs (P<0.01). Compared to hypoxic group, transfection with
periostin shRNA under hypoxic conditions significantly decreased
the LDH expression in BCPAPs (P<0.01; Fig. 6B). The ECAR and OCR were further
tested by using a Seahorse metabolic analyzer under different
conditions in BCPAP cells (20% O2, 1% O2,
HIF-1α overexpression under 20% O2, periostin shRNA
under 20% O2, periostin shRNA under 1% O2 and
periostin shRNA plus HIF-1α overexpression under 20%
O2). The results demonstrated that the BCPAP cells under
hypoxic conditions or the BCPAP cells transfected with HIF-1α
overexpression plasmid significantly increased the ECAR of the
cells compared to that under normoxic conditions. Notably,
transfection with periostin shRNA significantly decreased the ECAR
(P<0.01), reflecting that periostin and HIF-1α may play crucial
roles in TC glycolysis (Fig. 6C).
Correspondingly, hypoxia or transfection with HIF-1α overexpression
plasmid decreased the OCR of the BCPAP cells as compared to the
cells under normoxic conditions and those transfected with
periostin shRNA (Fig. 6D). These
results indicate that hypoxia may induce the Warburg effect by
upregulating periostin expression.
Discussion
The extracellular matrix protein, periostin, is
usually expressed at reduced levels in normal adult tissues;
however, periostin expression is increased at sites of
inflammation, injury and in tumors (19–21).
The role of periostin in tumor development and progression has
attracted increasing attention in recent years. Periostin has a
number of biological functions in tumors, including the regulation
of proliferation, invasion, metastasis and angiogenesis.
It has been reported that periostin is secreted by
both stromal cells and tumor cells (22–25). A
previous study by the authors (9)
and the present study demonstrated the overexpression of periostin
in human TC cell lines, as well as in human TC tissues. Periostin
overexpression in TC has been demonstrated to be related to poor
prognostic features, including an advanced tumor stage,
extrathyroidal extension, or lymph node metastasis (26–30).
Therefore, in a previous study by the authors, the
effects of silencing periostin on the growth, invasion and
tumorigenesis of thyroid cancer cells were investigated.
Eventually, it was observed that periostin may regulate the growth
and progression of TC through the Akt/thyroid stimulating hormone
receptor axis (9). In the present
study, the role of periostin in the development of TC was further
explored and an attempt was made to identify the regulator of
periostin.
HIF-1 is a transcription factor that plays a crucial
role in cellular response to hypoxia. Under normoxic conditions,
HIF-1 is hydroxylated and targeted for degradation (31–33).
However, under hypoxic conditions or in the context of activated
RTK pathways, the hydroxylation is inhibited, leading to HIF-1
accumulation in the nucleus. Once in the nucleus, HIF-1 functions
as a transcription factor, binding to hypoxia response elements in
the promoter region of target genes (34,35).
HIF-1 target genes include those involved in angiogenesis, e.g.,
vascular endothelial growth factor (36); glucose metabolism, e.g., pyruvate
dehydrogenase kinase 1 (37) and
cell survival, e.g., p53 (38),
which are essential for adaptation to low oxygen conditions.
Periostin expression has been revealed to be induced
by inflammation or mechanical stress. However, the impact of
hypoxia on periostin has not yet been fully elucidated (39). Malignances are known to be
characterized by changes in energy metabolism. Srinivasan et
al (40) demonstrated the
involvement of periostin in the pathway inducing the metabolic
shift to glycolysis in esophageal squamous cell carcinoma and
breast cancer.
The effect of the hypoxia-HIF-1α-periostin axis has
been revealed in various processes of wound healing. The study by
Zhang et al (41) suggested
that in keloid fibroblasts, hypoxia-induced periostin
overexpression was regulated by HIF-1α. In the study by
Aukkarasongsup et al (42),
periostin silencing was reported to inhibit tge hypoxia-induced
apoptosis of human periodontal ligament cells. In addition to the
context of wound healing, the role of the hypoxia-HIF-1α-periostin
axis in tumor progression has attracted increasing attention in
recent years. In the present study, hypoxia was observed to promote
the viability and invasion of TC cells, with these effects being
inhibited by the knockdown of periostin. Subsequently, it was
observed that hypoxia upregulated the expression of periostin via
HIF-1α, both at the mRNA and protein level, preliminarily
establishing the hypoxia-HIF-1α-periostin axis in TC. This result
was consistent with the findings of the study by Guo et al
(43), in which the exposure of
glioma cells to hypoxia led to an increased expression of periostin
and HIF-1α. In the study by Liu et al (44), HIF-1α depletion blocked the
hypoxia-induced upregulation of periostin expression in
hepatocellular carcinoma cells.
The Warburg effect, also known as aerobic
glycolysis, is a phenomenon observed in cancer cells wherein
glycolysis is preferentially used for energy production even in the
presence of oxygen. This metabolic adaptation allows cancer cells
to rapidly generate energy and biosynthetic precursors required for
cell proliferation and viability, thus allowing cells to maintain
energy production despite reduced oxygen availability. The
increased glycolytic flux not only provides ATP but also metabolic
intermediates that can be used for various biosynthetic pathways
involved in cell proliferation and activity (10,18,45).
In the present study, lactate and ATP concentrations were measured
under different conditions and the ECAR and OCR of BCPAP cells were
tested under different conditions. The results revealed that in TC
cells, periostin plays a crucial role in the Warburg effect.
Similar to the findings of the present study, Yang et al
(46) demonstrated the involvement
of the Warburg effect in the promotion of tumorigenesis in TC;
however, their study focused on the association between the Warburg
effect and autophagy.
Under hypoxic conditions, the accumulation of
reactive oxygen species may lead to mitochondrial damage,
subsequently resulting in cell death (47). HIF-1 serves to induce a process
known as mitophagy, entailing the removal of impaired mitochondria
to prevent them from causing harm to cells (48). The pathways mediating mitophagy can
be categorized into ubiquitin-dependent (Ub-dependent) and
ubiquitin-independent (Ub-independent) pathways. The Ub-dependent
pathway predominantly involves the PTEN induced kinase 1/Parkin
signaling pathway (49), while
Ub-independent pathways, such as the FUN14 domain containing 1
pathway (50,51), have been reported to play a crucial
role in tumor progression. HIF-1α triggers mitophagy to protect
hypoxic cells from damage. On the other hand, the Warburg effect is
consequently induced, shifting oxidative metabolism toward
glycolysis to reduce oxygen demand and maintain normal energy
supply (18). This regulatory role
of HIF-1 in cell metabolism plays a pivotal role in ensuring the
survival and progression of tumor cells under hypoxic conditions.
In a previous study by the authors, hypoxia and the overexpression
of periostin led to an increase in LC3 levels (9). In future studies, the authors aim to
further investigate the interactions between the
hypoxia-HIF-1α-periostin axis and pathways associated with
mitophagy.
However, the mechanisms by which HIF-1α regulates
periostin remain unclear. Using informatics tools, it was predicted
that HIF-1α may potentially bind to the promoter of periostin.
Subsequent immunoprecipitation and dual luciferase reporter assays
revealed that HIF-1α induced by hypoxia upregulated the expression
of periostin through binding to the promoter of periostin.
Therefore, HIF-1α and periostin are potential biomarkers and
therapeutic targets in the context of TC.
The findings of the present study demonstrate the
existence of the hypoxia-HIF-1α-periostin axis in TC and suggest
its role in the progression of TC. Hypoxia was found to induce the
Warburg effect in TC and periostin was suggested to be involved in
the regulation of metabolism in TC.
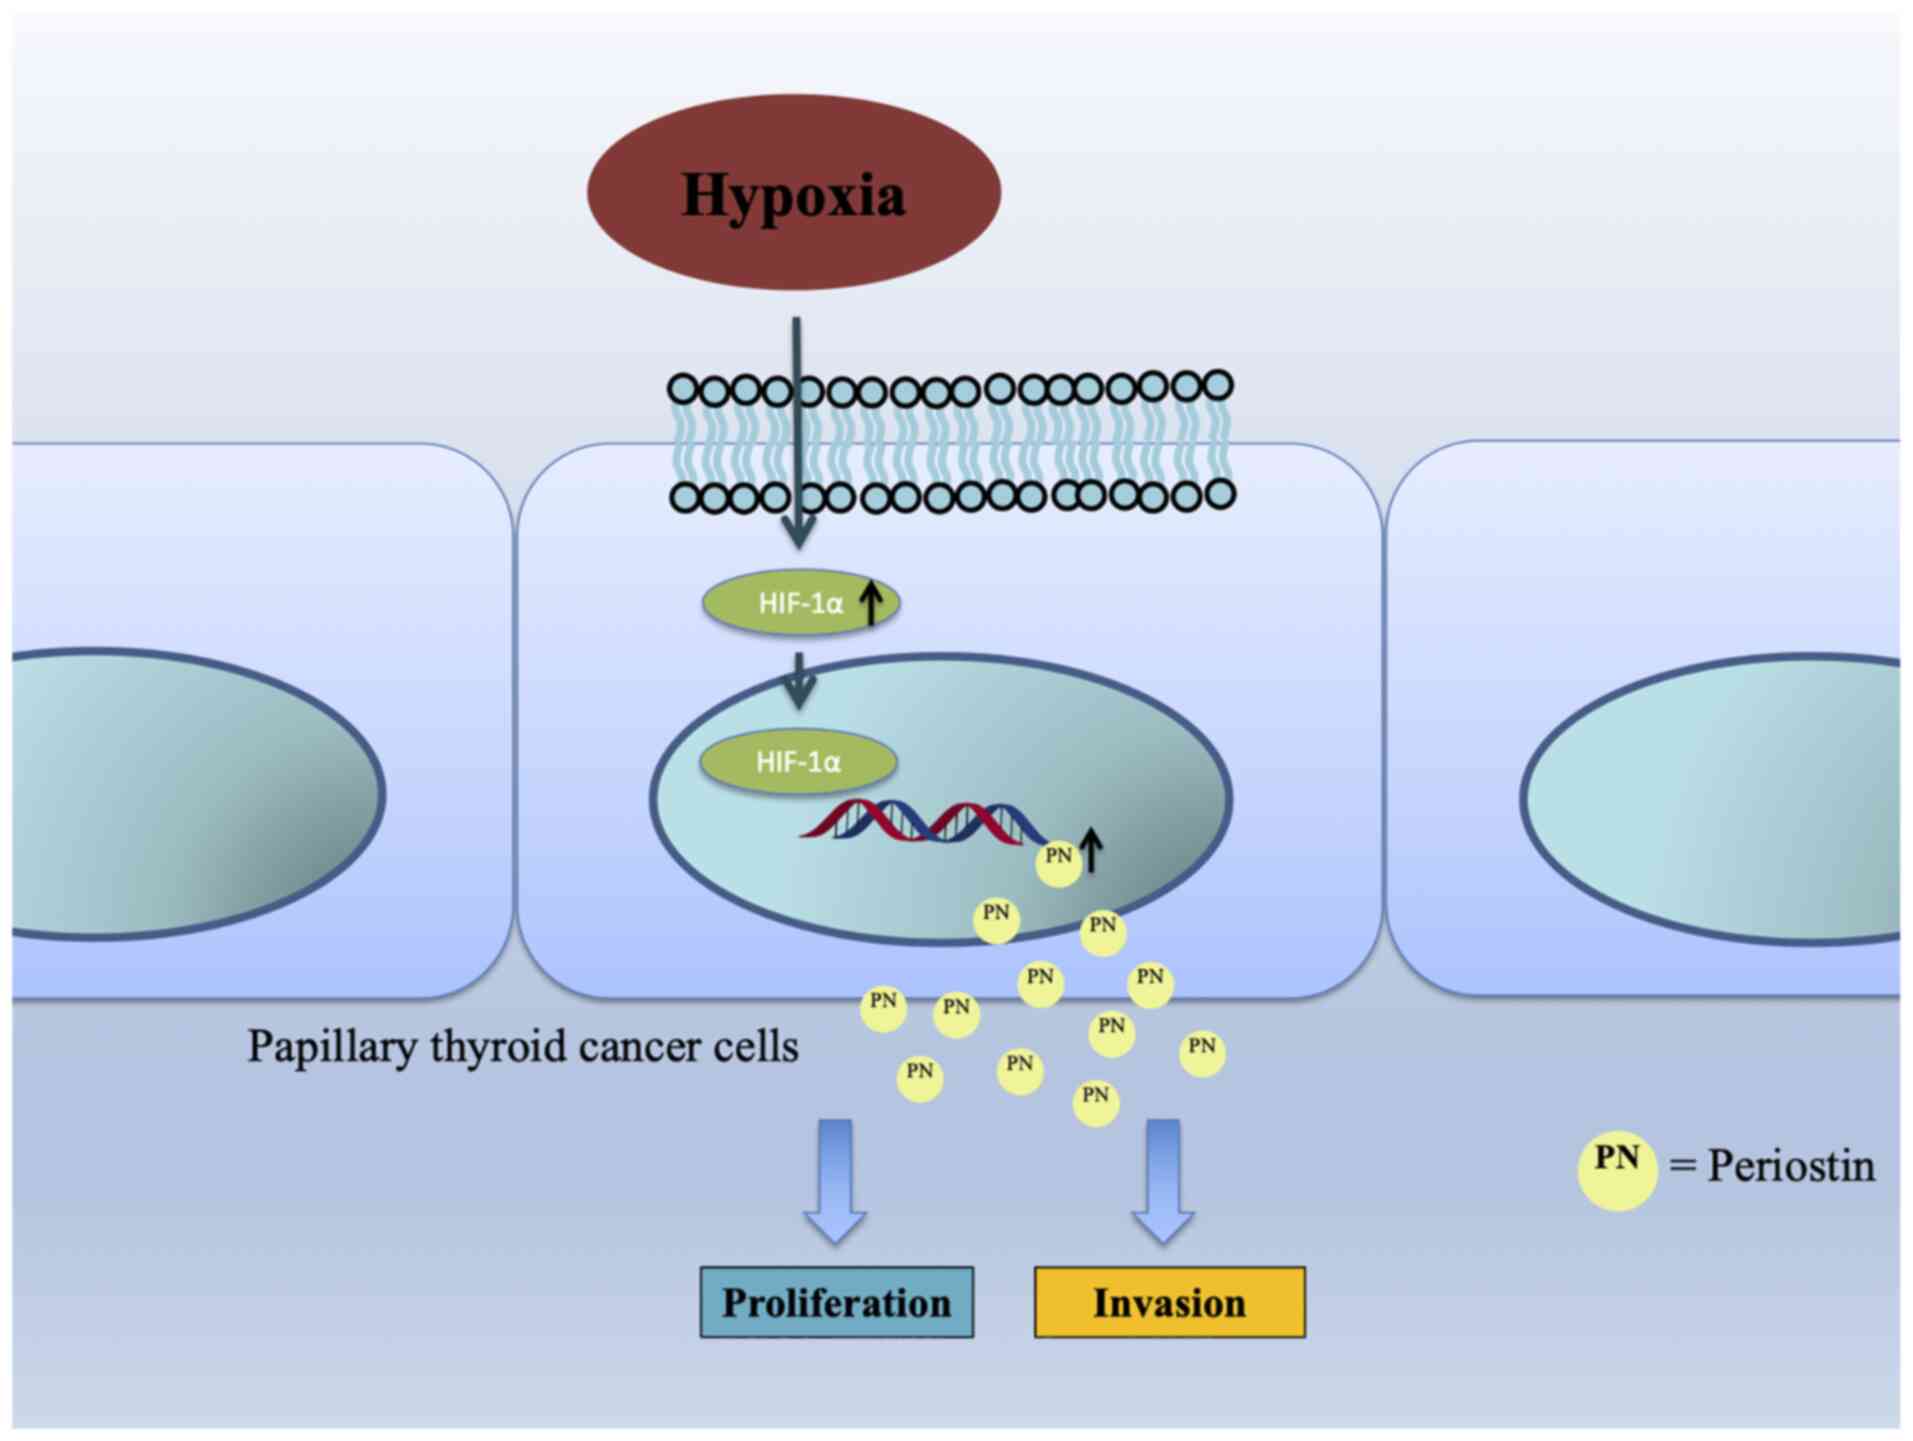
In conclusion, the findings of the present study
demonstrated the impact of the hypoxia-induced activation of
periostin via the HIF-1α pathway on the viability and migration of
TC cells, as well as the Warburg effect in TC (Fig. 7). These findings may provide
potential therapeutic targets in the context of TC.
Supplementary Material
Supporting Data
Supporting Data
Acknowledgements
Not applicable.
Funding
The present study was funded by the Shanghai General Hospital
Characteristic Research Project (grant no. CTCCR-2021C19).
Availability of data and materials
The datasets used and/or analyzed during the current
study are available from the corresponding author on reasonable
request.
Authors' contributions
YY and MW conceived and designed the study, and
drafted the manuscript. JW, HZ and JL performed the experiments. YL
and XS collected patient specimens and performed the statistical
analysis. All authors have read and approved the final manuscript.
YY and MW confirm the authenticity of all the raw data.
Ethics approval and consent to
participate
The present study was approved by the Ethics
Committee for Clinical Research of Shanghai General Hospital,
Shanghai Jiaotong University School of Medicine (Approval no.
2019KY016). Written informed consent was obtained from all patients
included in the study.
Patient consent for publication
Not applicable.
Competing interests
The authors declare that they have no competing
interests.
References
|
1
|
Wang J, Yu F, Shang Y, Ping Z and Liu L:
Thyroid cancer: Incidence and mortality trends in China, 2005–2015.
Endocrine. 68:163–173. 2020. View Article : Google Scholar : PubMed/NCBI
|
|
2
|
La Vecchia C, Malvezzi M, Bosetti C,
Garavello W, Bertuccio P, Levi F and Negri E: Thyroid cancer
mortality and incidence: A global overview. Int J Cancer.
136:2187–2195. 2015. View Article : Google Scholar : PubMed/NCBI
|
|
3
|
Hughes DT, Haymart MR, Miller BS, Gauger
PG and Doherty GM: The most commonly occurring papillary thyroid
cancer in the United States is now a microcarcinoma in a patient
older than 45 years. Thyroid. 21:231–236. 2011. View Article : Google Scholar : PubMed/NCBI
|
|
4
|
Lim H, Devesa SS, Sosa JA, Check D and
Kitahara CM: Trends in thyroid cancer incidence and mortality in
the United States, 1974–2013. JAMA. 317:1338–1348. 2017. View Article : Google Scholar : PubMed/NCBI
|
|
5
|
Ibrahimpasic T, Ghossein R, Shah JP and
Ganly I: Poorly differentiated carcinoma of the thyroid gland:
Current status and future prospects. Thyroid. 29:311–321. 2019.
View Article : Google Scholar : PubMed/NCBI
|
|
6
|
Dettmer MS, Schmitt A, Komminoth P and
Perren A: Poorly differentiated thyroid carcinoma: An
underdiagnosed entity. Pathologe. 41 (Suppl 1):S1–S8. 2020.
View Article : Google Scholar
|
|
7
|
González-González L and Alonso J:
Periostin: A matricellular protein with multiple functions in
cancer development and progression. Front Oncol. 8:2252018.
View Article : Google Scholar : PubMed/NCBI
|
|
8
|
Liu Y, Huang Z, Cui D and Ouyang G: The
multiaspect functions of periostin in tumor progression. Adv Exp
Med Biol. 1132:125–136. 2019. View Article : Google Scholar : PubMed/NCBI
|
|
9
|
Wang M, Gui C, Qiu S, Tang J and Peng Z:
Periostin silencing suppresses the aggressive phenotype of thyroid
carcinoma cells by suppressing the Akt/thyroid stimulating hormone
receptor axis. Cytotechnology. 70:275–284. 2018. View Article : Google Scholar : PubMed/NCBI
|
|
10
|
Schwartz L, Supuran CT and Alfarouk KO:
The Warburg effect and the hallmarks of cancer. Anticancer Agents
Med Chem. 17:164–170. 2017. View Article : Google Scholar : PubMed/NCBI
|
|
11
|
Wang HJ, Hsieh YJ, Cheng WC, Lin CP, Lin
YS, Yang SF, Chen CC, Izumiya Y, Yu JS, Kung HJ, et al: JMJD5
regulates PKM2 nuclear translocation and reprograms HIF-1α-mediated
glucose metabolism. Proc Natl Acad Sci USA. 111:279–284. 2014.
View Article : Google Scholar : PubMed/NCBI
|
|
12
|
Semenza GL: HIF-1 and mechanisms of
hypoxia sensing. Curr Opin Cell Biol. 13:167–171. 2001. View Article : Google Scholar : PubMed/NCBI
|
|
13
|
Semenza GL: Hypoxia-inducible factor 1
(HIF-1) pathway. Sci STKE. 2007:cm82007. View Article : Google Scholar : PubMed/NCBI
|
|
14
|
Kierans SJ and Taylor CT: Regulation of
glycolysis by the hypoxia-inducible factor (HIF): Implications for
cellular physiology. J Physiol. 599:23–37. 2021. View Article : Google Scholar : PubMed/NCBI
|
|
15
|
Schweppe RE, Klopper JP, Korch C,
Pugazhenthi U, Benezra M, Knauf JA, Fagin JA, Marlow LA, Copland
JA, Smallridge RC and Haugen BR: Deoxyribonucleic acid profiling
analysis of 40 human thyroid cancer cell lines reveals
cross-contamination resulting in cell line redundancy and
misidentification. J Clin Endocrinol Metab. 93:4331–4341. 2008.
View Article : Google Scholar : PubMed/NCBI
|
|
16
|
Rueden CT, Schindelin J, Hiner MC, DeZonia
BE, Walter AE, Arena ET and Eliceiri KW: ImageJ2: ImageJ for the
next generation of scientific image data. BMC Bioinformatics.
18:5292017. View Article : Google Scholar : PubMed/NCBI
|
|
17
|
Livak KJ and Schmittgen TD: Analysis of
relative gene expression data using real-time quantitative PCR and
the 2(−Delta Delta C(T)) method. Methods. 25:402–408. 2001.
View Article : Google Scholar : PubMed/NCBI
|
|
18
|
Vander Heiden MG, Cantley LC and Thompson
CB: Understanding the Warburg effect: The metabolic requirements of
cell proliferation. Science. 324:1029–1033. 2009. View Article : Google Scholar : PubMed/NCBI
|
|
19
|
Sonnenberg-Riethmacher E, Miehe M and
Riethmacher D: Periostin in allergy and inflammation. Front
Immunol. 12:7221702021. View Article : Google Scholar : PubMed/NCBI
|
|
20
|
Ratajczak-Wielgomas K and Dziegiel P: The
role of periostin in neoplastic processes. Folia Histochem
Cytobiol. 53:120–132. 2015. View Article : Google Scholar : PubMed/NCBI
|
|
21
|
Yamaguchi Y: Periostin in skin tissue and
skin-related diseases. Allergol Int. 63:161–170. 2014. View Article : Google Scholar
|
|
22
|
Kudo Y, Iizuka S, Yoshida M, Nguyen PT,
Siriwardena SB, Tsunematsu T, Ohbayashi M, Ando T, Hatakeyama D,
Shibata T, et al: Periostin directly and indirectly promotes tumor
lymphangiogenesis of head and neck cancer. PLoS One. 7:e444882012.
View Article : Google Scholar : PubMed/NCBI
|
|
23
|
Zhang Y, Zhang G, Li J, Tao Q and Tang W:
The expression analysis of periostin in human breast cancer. J Surg
Res. 160:102–106. 2010. View Article : Google Scholar : PubMed/NCBI
|
|
24
|
Utispan K, Thuwajit P, Abiko Y, Charngkaew
K, Paupairoj A, Chau-in S and Thuwajit C: Gene expression profiling
of cholangiocarcinoma-derived fibroblast reveals alterations
related to tumor progression and indicates periostin as a poor
prognostic marker. Mol Cancer. 9:132010. View Article : Google Scholar : PubMed/NCBI
|
|
25
|
Kikuchi Y, Kunita A, Iwata C, Komura D,
Nishiyama T, Shimazu K, Takeshita K, Shibahara J, Kii I, Morishita
Y, et al: The niche component periostin is produced by
cancer-associated fibroblasts, supporting growth of gastric cancer
through ERK activation. Am J Pathol. 184:859–870. 2014. View Article : Google Scholar : PubMed/NCBI
|
|
26
|
Kusafuka K, Yamashita M, Iwasaki T,
Tsuchiya C, Kubota A, Hirata K, Murakami A, Muramatsu A, Arai K and
Suzuki M: Periostin expression and its supposed roles in benign and
malignant thyroid nodules: An immunohistochemical study of 105
cases. Diagn Pathol. 16:862021. View Article : Google Scholar : PubMed/NCBI
|
|
27
|
Giusca SE, Amalinei C, Lozneanu L, Ciobanu
Apostol D, Andriescu EC, Scripcariu A, Balan R, Avadanei ER and
Căruntu ID: Heterogeneous periostin expression in different
histological variants of papillary thyroid carcinoma. Biomed Res
Int. 2017:87013862017. View Article : Google Scholar : PubMed/NCBI
|
|
28
|
Bai Y, Kakudo K, Nakamura M, Ozaki T, Li
Y, Liu Z, Mori I, Miyauchi A and Zhou G: Loss of cellular
polarity/cohesiveness in the invasive front of papillary thyroid
carcinoma and periostin expression. Cancer Lett. 281:188–195. 2009.
View Article : Google Scholar : PubMed/NCBI
|
|
29
|
Bai Y, Nakamura M, Zhou G, Li Y, Liu Z,
Ozaki T, Mori I and Kakudo K: Novel isoforms of periostin expressed
in the human thyroid. Jpn Clin Med. 1:13–20. 2010. View Article : Google Scholar : PubMed/NCBI
|
|
30
|
Fluge Ø, Bruland O, Akslen LA, Lillehaug
JR and Varhaug JE: Gene expression in poorly differentiated
papillary thyroid carcinomas. Thyroid. 16:161–175. 2006. View Article : Google Scholar : PubMed/NCBI
|
|
31
|
Lee JW, Bae SH, Jeong JW, Kim SH and Kim
KW: Hypoxia-inducible factor (HIF-1)alpha: Its protein stability
and biological functions. Exp Mol Med. 36:1–12. 2004. View Article : Google Scholar : PubMed/NCBI
|
|
32
|
Maxwell PH, Wiesener MS, Chang GW,
Clifford SC, Vaux EC, Cockman ME, Wykoff CC, Pugh CW, Maher ER and
Ratcliffe PJ: The tumour suppressor protein VHL targets
hypoxia-inducible factors for oxygen-dependent proteolysis. Nature.
399:271–275. 1999. View
Article : Google Scholar : PubMed/NCBI
|
|
33
|
Ivan M, Kondo K, Yang H, Kim W, Valiando
J, Ohh M, Salic A, Asara JM, Lane WS and Kaelin WG Jr: HIFalpha
targeted for VHL-mediated destruction by proline hydroxylation:
Implications for O2 sensing. Science. 292:464–468. 2001.
View Article : Google Scholar : PubMed/NCBI
|
|
34
|
Formenti F, Constantin-Teodosiu D,
Emmanuel Y, Cheeseman J, Dorrington KL, Edwards LM, Humphreys SM,
Lappin TR, McMullin MF, McNamara CJ, et al: Regulation of human
metabolism by hypoxia-inducible factor. Proc Natl Acad Sci USA.
107:12722–12727. 2010. View Article : Google Scholar : PubMed/NCBI
|
|
35
|
Ruas JL, Poellinger L and Pereira T: Role
of CBP in regulating HIF-1-mediated activation of transcription. J
Cell Sci. 118:301–311. 2005. View Article : Google Scholar : PubMed/NCBI
|
|
36
|
Forsythe JA, Jiang BH, Iyer NV, Agani F,
Leung SW, Koos RD and Semenza GL: Activation of vascular
endothelial growth factor gene transcription by hypoxia-inducible
factor 1. Mol Cell Biol. 16:4604–4613. 1996. View Article : Google Scholar : PubMed/NCBI
|
|
37
|
Kim JW, Tchernyshyov I, Semenza GL and
Dang CV: HIF-1-mediated expression of pyruvate dehydrogenase
kinase: A metabolic switch required for cellular adaptation to
hypoxia. Cell Metab. 3:177–185. 2006. View Article : Google Scholar : PubMed/NCBI
|
|
38
|
Schmid T, Zhou J and Brüne B: HIF-1 and
p53: Communication of transcription factors under hypoxia. J Cell
Mol Med. 8:423–431. 2004. View Article : Google Scholar : PubMed/NCBI
|
|
39
|
Kudo A: Introductory review:
Periostin-gene and protein structure. Cell Mol Life Sci.
74:4259–4268. 2017. View Article : Google Scholar : PubMed/NCBI
|
|
40
|
Srinivasan S, Guha M, Dong DW, Whelan KA,
Ruthel G, Uchikado Y, Natsugoe S, Nakagawa H and Avadhani NG:
Disruption of cytochrome c oxidase function induces the Warburg
effect and metabolic reprogramming. Oncogene. 35:1585–1595. 2016.
View Article : Google Scholar : PubMed/NCBI
|
|
41
|
Zhang Z, Nie F, Kang C, Chen B, Qin Z, Ma
J, Ma Y and Zhao X: Increased periostin expression affects the
proliferation, collagen synthesis, migration and invasion of keloid
fibroblasts under hypoxic conditions. Int J Mol Med. 34:253–261.
2014. View Article : Google Scholar : PubMed/NCBI
|
|
42
|
Aukkarasongsup P, Haruyama N, Matsumoto T,
Shiga M and Moriyama K: Periostin inhibits hypoxia-induced
apoptosis in human periodontal ligament cells via TGF-β signaling.
Biochem Biophys Res Commun. 441:126–132. 2013. View Article : Google Scholar : PubMed/NCBI
|
|
43
|
Guo X, Xue H, Shao Q, Wang J, Guo X, Chen
X, Zhang J, Xu S, Li T, Zhang P, et al: Hypoxia promotes
glioma-associated macrophage infiltration via periostin and
subsequent M2 polarization by upregulating TGF-beta and M-CSFR.
Oncotarget. 7:80521–80542. 2016. View Article : Google Scholar : PubMed/NCBI
|
|
44
|
Liu Y, Gao F and Song W: Periostin
contributes to arsenic trioxide resistance in hepatocellular
carcinoma cells under hypoxia. Biomed Pharmacother. 88:342–348.
2017. View Article : Google Scholar : PubMed/NCBI
|
|
45
|
Vaupel P and Multhoff G: Revisiting the
Warburg effect: Historical dogma versus current understanding. J
Physiol. 599:1745–1757. 2021. View Article : Google Scholar : PubMed/NCBI
|
|
46
|
Yang Z, Huang R, Wei X, Yu W, Min Z and Ye
M: The SIRT6-autophagy-Warburg effect axis in papillary thyroid
cancer. Front Oncol. 10:12652020. View Article : Google Scholar : PubMed/NCBI
|
|
47
|
Semenza GL: Hypoxia-inducible factor 1:
Regulator of mitochondrial metabolism and mediator of ischemic
preconditioning. Biochim Biophys Acta. 1813:1263–1268. 2011.
View Article : Google Scholar : PubMed/NCBI
|
|
48
|
Zhang H, Bosch-Marce M, Shimoda LA, Tan
YS, Baek JH, Wesley JB, Gonzalez FJ and Semenza GL: Mitochondrial
autophagy is an HIF-1-dependent adaptive metabolic response to
hypoxia. J Biol Chem. 283:10892–10903. 2008. View Article : Google Scholar : PubMed/NCBI
|
|
49
|
Ordureau A, Münch C and Harper JW:
Quantifying ubiquitin signaling. Mol Cell. 58:660–676. 2015.
View Article : Google Scholar : PubMed/NCBI
|
|
50
|
Zhang W: The mitophagy receptor FUN14
domain-containing 1 (FUNDC1): A promising biomarker and potential
therapeutic target of human diseases. Genes Dis. 8:640–654. 2020.
View Article : Google Scholar : PubMed/NCBI
|
|
51
|
Zhang W, Ren H, Xu C, Zhu C, Wu H, Liu D,
Wang J, Liu L, Li W, Ma Q, et al: Hypoxic mitophagy regulates
mitochondrial quality and platelet activation and determines
severity of I/R heart injury. Elife. 5:e214072016. View Article : Google Scholar : PubMed/NCBI
|