Introduction
Colorectal cancer (CRC) is one of the most common
malignancies and ranks third among the leading causes of
cancer-related death worldwide (1,2). Death
due to CRC is mainly caused by disease recurrence and metastasis
after surgery (3). Despite advances
in treatment strategies, including improved surgical techniques and
adjuvant therapy, the mortality rate among patients with CRC
remains high due to high rates of metastasis and recurrence
(4,5). Exploring the mechanisms that underlie
the progression of CRC may accelerate the search for new diagnostic
biomarkers and the development of effective therapeutic
targets.
Zinc finger proteins (ZNFs) belong to a large group
of proteins that bind to nucleic acids and perform various
functions. The zinc finger domain is a common amino acid sequence
motif that contains two cysteines and two histidines in specific
positions that coordinate zinc. Okada et al (6) reported that the zinc finger
transcription factor early growth response gene-1 may be involved
in inflammation caused by vascular injury and thrombosis. ZNF180
(also termed HHZ168) is a ZNF family member. It is a coded gene
that regulates immune cell infiltration in melanoma cells and has
an inverse relationship with plasminogen activator inhibitor-1
expression (7). Currently, research
on ZNF180 is limited, particularly regarding its expression profile
in CRC, and its association with tumor progression and prognosis
remains unknown.
DNA methylation is a common epigenetic modification
that regulates a variety of processes, such as differentiation,
development, aging and tumorigenesis. Aberrant DNA methylation is
one of the most common epigenetic aberrations in tumorigenesis
(8). Aberrant DNA hypermethylation
of CpG islands leads to silencing of genes involved in
differentiation and the reactivation of stem cell-related genes
(9). CpG methylation is primarily
mediated by DNA methyltransferases (DNMTs), such as DNMT1, DNMT3a
and DNMT3b (10). Hypermethylation
of tumor suppressor genes is an early event in some solid tumors,
and one of the earliest detectable features of neoplastic
alterations associated with tumorigenesis (11,12).
Several studies have identified specific DNA methylation sites for
some genes, such as septin 9, as biomarkers for CRC (13–15).
However, the association between ZNF180 and methylation, and its
potential value in CRC screening and early detection remains to be
further explored.
N6-methyladenosine (m6A), one of the most
common chemical modifications in eukaryotic mRNA, serves a crucial
role in tumorigenesis and development. m6A methylation
is regulated by multiple genes and can be catalyzed by
methyltransferases [e.g., methyltransferase 3/14/16,
N6-adenosine-methyltransferase complex catalytic subunit
(METTL3/14/16) ‘writers’] or removed by demethylases (e.g., FTO and
alkB homolog 5, RNA demethylase ‘erasers’). In addition, it
interacts with the m6A binding proteins [e.g., YTH
N6-methyladenosine RNA binding protein F1/2/3 (YTHDF1/2/3) and
insulin-like growth factor 2 mRNA binding protein 1/2/3 ‘readers’]
(16). METTL14 is a m6A
writing protein that is widely involved in the progression of major
diseases (17). Studies have shown
that METTL14 functions as a tumor suppressor in CRC (18), bladder cancer (19) and breast cancer (20); however, it has been reported to
serve a role as a carcinogenic factor in thyroid cancer (21), pancreatic cancer (22) and leukemia (23).
The present study hypothesized that ZNF180 functions
as a tumor suppressor gene, suppressing cell proliferation and
inducing apoptosis in CRC cells. Therefore, the aim of this study
was to investigate the molecular mechanisms underlying the function
of ZNF180 in CRC.
Materials and methods
Cell lines and cell culture
The human cell lines 293T, HCT8, RKO, CACO2, SW480,
SW620, LOVO, HCT116, HT29, DLD-1, HCT15, WIDR, SW48, COLO320 and
LS174T, and the intestinal epithelial cell line HIEC-6 were
cultured in Dulbecco's modified Eagle's medium (cat. no.
C11995500BT; Gibco; Thermo Fisher Scientific, Inc.) supplemented
with 10% FBS (cat. no. BS1614-105; BIOEXPLORER) at 37°C and 5%
CO2. The two cell lines with the highest efficiency of
overexpressing ZNF180 at the protein level (HCT116 and RKO) were
selected for subsequent functional studies. All cell lines were
purchased and certified from the American Type Culture Collection,
with the exception of the HIEC-6 and CACO2 cell lines, which were
obtained from the laboratory of Professor Ping Lan (The Sixth
Affiliated Hospital, Sun Yat-sen University, Guangzhou, China).
Lentiviral production and cell
transduction
Lentiviral-mediated cell transduction was performed
as described previously (24). To
prepare cells, several wells of target cells in the logarithmic
growth phase and parallel control 293T cells were inoculated in a
24-well culture plate at a confluence of ~50%, 100 µl medium was
added to each well, and the cells were cultured until they became
adherent. Notably, the optimal confluence of the cells for viral
infection was ~70%. Lentiviruses were produced by mixing the ZNF180
overexpression plasmid (GV341) with 3× Flag-tagged ZNF180 (Shanghai
GeneChem Co., Ltd.) and psPAX1 and pMD2.G packaging plasmids (3rd
generation system) (ratio, 20 µg:15 µg:10 µg; total, 45 µg
plasmid/10-cm dish) with Lipofectamine® 3000 (cat. no.
L3000015; Invitrogen; Thermo Fisher Scientific, Inc.) at room
temperature for 15 min. Subsequently, this mixture was used to
transfect 293T cells at 37°C for 12 h and the medium was then
changed. Lentiviruses were harvested 48 h after transfection, and
filtered through a 0.22-µm filter (MilliporeSigma). Subsequently,
the target cells were transduced with lentiviruses (MOI=10) at 37°C
for 12 h and were then cultured in medium. After 3 days, the medium
was replaced with medium containing 2 mg/ml puromycin (cat. no.
T19978; TargetMol Chemicals, Inc.) for 7 days. After 11 days, the
subsequent experiments were carried out.
Small interfering (si)RNA
transfection
The negative control siRNA (NC), METTL14 si#1 and
si#2 were purchased from Guangzhou IGE Biotechnology Co., Ltd. The
sequences were as follows: NC, sense 5′-UUCUCCGAACGUGUCACGUTT-3′,
antisense 5′-ACGUGACACGUUCGGAGAATT-3′; METTL14 si#1, sense
5′-GAACCUGAAAUUGGCAAUAUATT-3′, antisense
5′-UAUAUUGCCAAUUUCAGGUUCTT-3′; METTL14 si#2, sense
5′-GCUUACAAAUAGCAACUACAATT-3′, antisense
5′-UUGUAGUUGCUAUUUGUAAGCTT-3′. Transient transfections of CRC cells
were performed as described previously (25). Briefly, 60 pmol siRNA in Opti-MEM
(cat. no. 31985070; Gibco; Thermo Fisher Scientific, Inc.) was
mixed with Lipofectamine RNAiMAX Reagent (cat. no. 13778150;
Invitrogen; Thermo Fisher Scientific, Inc.) and incubated at room
temperature for 5 min. Subsequently, the mixture was added to the
cells and incubated at 37°C for 12 h. A total of 4 days
post-transfection, the subsequent experiments were performed.
Western blotting
Pre-chilled RIPA lysis buffer (cat. no. P0039;
Beyotime Institute of Biotechnology) supplemented with phosphatase
inhibitors (cat. no. P1009; Beyotime Institute of Biotechnology)
was used for protein extraction. The BCA protein assay kit (cat.
no. P10012S; Beyotime Institute of Biotechnology) was used for
protein determination. Subsequently, 20 µg proteins were loaded per
lane, separated by SDS-PAGE on 10% gels and were transferred to
0.45-µm PVDF membranes (cat. no. FFP39; Beyotime Institute of
Biotechnology). The membranes were blocked using 5% non-fat milk
(cat. no. P0216; Beyotime Institute of Biotechnology) diluted in
TBS-1% Tween 20 (TBST) at room temperature for 1 h, and were then
incubated with primary antibodies (1:1,000) at 4°C overnight,
followed by incubation with secondary antibodies (1:5,000) at room
temperature for 1 h. A chemiluminescence reagent (cat. no. MA0186;
Dalian Meilun Biology Technology Co., Ltd.) was used to visualize
the proteins. Standard western blotting procedures were performed
as described previously (26). The
following antibodies were used in the present study: Anti-ZNF180
(cat. no. bs-8485R; BIOSS), anti-GAPDH (cat. no. 6004-1-Ig;
Proteintech Group, Inc.), anti-β-actin (cat. no. 66009-1-Ig;
Proteintech Group, Inc.), anti-METTL14 (cat. no. 26158-1-AP;
Proteintech Group, Inc.), anti-PARP (cat. no. 9542S; Cell Signaling
Technology, Inc.), anti-cleaved-PARP (cat. no. 5625S; Cell
Signaling Technology, Inc.), and anti-mouse (cat. no. 7076; Cell
Signaling Technology, Inc.) and anti-rabbit (cat. no. 7074; Cell
Signaling Technology, Inc.) peroxidase-conjugated secondary
antibodies.
RNA isolation and reverse
transcription-quantitative PCR (RT-qPCR)
Total RNA was isolated from cultured cell lines and
tissues using TRIzol® reagent (Invitrogen; Thermo Fisher
Scientific, Inc.), and was reverse transcribed using a cDNA
Synthesis Kit (cat. no. R223-01; Vazyme Biotech Co., Ltd.),
performed according to the manufacturer's protocol. qPCR was
performed using a ChamQ Universal SYBR qPCR MasterMix (cat. no.
Q711-02; Vazyme Biotech Co., Ltd.) according to manufacturer's
protocol: 95°C for 30 sec; followed by 40 cycles at 95°C for 3 sec
and 60°C for 10 sec; and a final melt curve stage. The relative
expression levels of the target genes were calculated as
2−ΔΔCq (27) (Cq of
β-actin or GAPDH minus the Cq of the target gene). The sequences of
the qPCR primers used for amplification were as follows: β-actin,
forward 5′-CACCATTGGCAATGAGCGGTTC-3′, reverse
5′-AGGTCTTTGCGGATGTCCACGT-3′; GAPDH, forward
5′-GTCTCCTCTGACTTCAACAGCG-3′; reverse,
5′-ACCACCCTGTTGCTGTAGCCAA-3′; ZNF180, forward
5′-TGGAAGAGCAGGATGAGAAGCC-3′, reverse,
5′-GATGGTCAGAGACCCAGTGTCT-3′; METTL14, forward
5′-CTGAAAGTGCCGACAGCATTGG-3′, reverse
5′-CTCTCCTTCATCCAGATACTTACG-3′.
Immunofluorescence (IF)
A total of 2×10⁵ cells were cultured in a
cell culture dish for 24 h, after which they were fixed onto slides
with 4% paraformaldehyde for 15 min at room temperature, and then
washed in PBS three times (3 min/wash). Subsequently, the cells
were permeabilized with 1% Triton X-100 for 20 min at room
temperature, followed by blocking with 10% goat serum (cat. no.
I5256, Sigma-Aldrich; Merck KGaA; diluted in TBST) for 1 h at room
temperature. The cells were then incubated with the following
primary antibodies [1:200; diluted in QuickBlock buffer (cat. no.
P0256; Beyotime Institute of Biotechnology)]: ZNF180 (cat. no.
NBP1-92613; Novus Biologicals, Inc.) METTL14 (cat. no. 26158-1-AP;
Proteintech Group, Inc.) and Ki67 (cat. no. CL594-27309;
Proteintech Group, Inc.) at 4°C overnight, and with fluorescent
secondary antibodies [(1:1,000; diluted in dilution buffer (cat.
no. I917953, Macklin, Inc.)] at room temperature for 1 h. The
following secondary antibodies were used: Goat anti-Rabbit IgG
(H+L) cross-adsorbed secondary antibody with Alexa Fluor™ 594 (cat.
no. A-11012; Thermo Fisher Scientific, Inc.) and Alexa Fluor™ 488
(cat. no. A-11008; Thermo Fisher Scientific, Inc.). The nuclei of
the cells were stained with DAPI and a fluorescence microscope
(IX73; Olympus Corporation) was used to visualize the cells.
Cell cycle analysis
After centrifugation at 1,000 × g for 5 min at room
temperature, the supernatant removed and 1 ml PBS was added to the
cells in an ice bath for resuspension. The cells were then
transferred to a 1.5-ml microcentrifuge tube, centrifuged at 1,000
× g for 5 min at 4°C, the supernatant was removed and the cells (in
50 µl) were washed twice with PBS, and resuspended in PBS
containing 50 µg/ml PI and 0.1 mg/ml RNase A (cat. no. C1052;
Beyotime Institute of Biotechnology). After 30 min of incubation at
37°C in the dark, the cells were measured by flow cytometry
(CytoFLEX S; Beckman Coulter, Inc.) and analyzed by software
(CytExpert 2.4; Beckman Coulter, Inc.).
Human tissue samples
The present study included patients diagnosed with
CRC between 2013 and 2020 at The Sixth Affiliated Hospital, Sun
Yat-sen University (SYSU6; Guangzhou, China); also known as the
SYSU6 cohort (n=244. Patient data were extracted from pathology
report records. Only those patients with CRC who had complete
clinical information and underwent surgery were selected. The
average age of the patients recruited was ~56.7 years (range, 20–90
years), 41% of patients were women and 59% were men. To compare the
ZNF180 and METTL14 levels among normal and tumor tissues, 24 CRC
patient tissue samples and 24 matched normal tissues were obtained
from the SYSU6 cohort (among them, 12 paired tissues were used for
qPCR, and 24 paired tissues were used for western blot). In
addition, ZNF180 levels were measured in the remaining
formalin-fixed paraffin-embedded 220 CRC tissue sections from the
SYSU6 cohort by immunohistochemistry (IHC). A total of 40 CRC
tissues (from these 220 formalin-fixed paraffin-embedded tissues)
that had both tumor cells and normal cells were used to detect the
expression levels of ZNF180 and METTL14 by IHC.
IHC
Sections were fixed with 10% neutral buffered
formalin at room temperature for 20 h and hydrated in a descending
series of ethanol. All tissues were embedded in paraffin and cut
into 3-µm sections. Antigen retrieval was performed in 500 ml 0.01
M citrate buffer (pH=6.0; cat. no. 420901; Biolegend, Inc.) in a
microwave for 10 min. After rinsing under cold tap water for 10
min, the sections were incubated for 10 min at room temperature
with 10% serum blocking solution (cat. no. ZLI-9056; OriGene
Technologies, Inc.). Subsequently, the sections were incubated with
the following primary antibodies: ZNF180 (cat. no. NBP1-92613;
Novus Biologicals, Inc.) and METTL14 (cat. no. 26158-1-AP;
Proteintech Group, Inc.) in a 1:400 dilution in dilution buffer
(cat. no. ZLI-9030; OriGene Technologies, Inc.) at 4°C for 12 h.
The sections were then incubated for 10 min at room temperature
with a biotinylated secondary antibody (cat. no. PV-9000-1; OriGene
Technologies, Inc.) and for 10 min at room temperature with a
streptavidin-enzyme conjugate (cat. no. PV-9000-2; OriGene
Technologies, Inc.), and for 2 min at room temperature with a
substrate-chromogen mixture (cat. no. PV-9000-3; OriGene
Technologies, Inc.). A light microscope (BX53; Olympus Corporation)
was used to visualize the cells. For each tissue, a proportional
score and an intensity score were determined. The proportional
score was classified as: 0, no staining; 1, 1–10% stained cells; 2,
11–50% stained cells; 3, 51–80% stained cells; 4, 81–100% stained
cells. The intensity score represents the intensity of cytoplasmic
and membranous staining of positive cells, as follows: 0, no
staining; 1, weak staining; 2, moderate staining; 3, strong
staining.
Hematoxylin and eosin staining
Sections were fixed with 10% neutral buffered
formalin at room temperature for 20 h and hydrated in a descending
series of ethanol. All tissues were embedded in paraffin and cut
into 3-µm sections. Sections were deparaffinized and rehydrated in
xylene and a descending series of ethanol. Subsequently, the
sections were incubated with hematoxylin stain (cat. no. C0105S-1;
Beyotime Institute of Biotechnology) for 3 min and 0.5% eosin (cat.
no. C0105S-2; Beyotime Institute of Biotechnology) for 30 sec. The
cells were mounted using Permount mounting medium (cat. no.
ZLI-9516; OriGene Technologies, Inc.) after staining. A light
microscope (BX53; Olympus Corporation) was used to visualize the
cells.
Ethical statement
The present study involving human samples was
approved by the Institutional Review Board of SYSU6 (approval no.
2021ZSLYEC-228), and complied with The Declaration of Helsinki
(World Medical Association Declaration of Helsinki 2013). All
patients provided written informed consent to allow their
electronic medical records to be used for cancer research
voluntarily during their first visit to the hospital, and data were
anonymized at the beginning of statistical analyses to protect
patients' privacy. All patients provided consent for their tissues
to be used in medical research
DNA methylation
HCT116 and RKO cells were treated with 10 and 20 µM
5-azacytidine (5-AzaC) (cat. no. S1782; Selleck Chemicals) for ~48
h. 5-AzaC is a DNA methyltransferase, which is commonly used for
DNA methylation research. Cells were harvested within 3 days of
treatment with 5-AzaC, total RNA was isolated for RT-qPCR and
proteins were extracted for western blotting.
5-Ethynyl-20-deoxyuridine (EdU)
staining
The EdU solution (cat. no. C0071S; Beyotime
Institute of Biotechnology) was proportionally diluted with
complete cell medium to prepare an appropriate amount of 2X EdU
working solution with a final concentration of 50 µM; briefly, 500
µl dilution buffer and 500 µl EdU working solution (1:1) were added
to a 6-well plate, mixed evenly and incubated at 37°C for 6–7 h to
achieve a final concentration of 50 µM. For EdU staining, the
medium was removed from cells and they were washed in PBS three
times (5 min/wash), before being washed with PBS containing 3% BSA
(cat. no. ST023; Beyotime Institute of Biotechnology) at room
temperature. The cells were then permeabilized in PBS containing
0.5% Triton X-100 for 20 min at room temperature, and, after
washing them with 3% BSA solution, the Click-iT EdU solution was
added to the cells for 30 min at room temperature; the nuclei were
stained with Hoechst 33342 (cat. no. C0071S-6; Beyotime Institute
of Biotechnology). Subsequently, DNA synthesis was observed under a
confocal microscope.
Cell apoptosis detection
Apoptosis was assessed by Annexin V and PI staining
using the Annexin V apoptosis detection kit (cat. no. C1062;
Beyotime Institute of Biotechnology). Briefly, HCT116 and RKO
vector and ZNF180-overexpression groups were treated with
5-fluorouracil (5-FU; 0, 10 or 20 µm; cat. no. F6627;
Sigma-Aldrich; Merck KGaA) diluted in DMSO. All cells were
collected after treatment with 5-FU at 37°C for 2 days. Cells were
washed twice with PBS and resuspended in binding buffer (500 µl,
5×10⁵ cells). Annexin V (5 µl) and PI (5 µl) were then
added to the cells and incubated for 15 min at room temperature in
the dark. The cells were measured by flow cytometry (CytoFLEX S;
Beckman Coulter, Inc.) and analyzed using CytExpert 2.4 software
(Beckman Coulter, Inc.).
Chromatin immunoprecipitation (ChIP)
assay
ChIP was performed using the SimpleChIP®
Enzymatic Chromatin IP Kit (cat. no. 9003S; Cell Signal Technology,
Inc.), according to the manufacturer's protocol. First, DNA
extracted from lysed cells was digested into 10-1,000 bp fragments
using a micrococcal nuclease. For ZNF180-overexpressing HCT116
cells, a Flag antibody (cat. no. F1804; Sigma-Aldrich; Merck KGaA)
was used to pull down ZNF180 protein (overexpression plasmid with
3× Flag-tagged ZNF180); normal rabbit IgG antibody (cat. no. 2729;
Cell Signaling Technology, Inc.) was used as a negative control and
Histone H3 rabbit monoclonal antibody was used as a positive
control (cat. no. 4620; Cell Signaling Technology, Inc.). An
anti-Flag antibody, and protein A and G magnetic beads were then
added to the lysate and immunoprecipitated over 12 h. The enriched
chromatin was then eluted for standard PCR followed by agarose gel
electrophoresis (cat. no. DYCP-31CN; Beijing Liuyi Biotechnology
Co., Ltd.) on a 1% agarose gel (cat. no. BS081; Biosharp Life
Sciences), which was visualized using Gel-green (cat. no. D0143;
Beyotime Institute of Biotechnology). The specific primers of
METTL14 used for ChIP-PCR were: sense: 5′-GGCGCAACAGATCCCTTACT-3′,
antisense: 5′-CTCAGTAGAGACTTCCGGCG-3′. The standard PCR reaction
program was as follows: Initial denaturation at 95°C for 5 min;
followed by 34 cycles of denaturation at 95°C for 30 sec, annealing
at 62°C for 30 sec and extension at 72°C for 30 sec; and a final
extension step at 72°C for 5 min. In addition, RT-qPCR was
performed as aforementioned.
Cell proliferation assay
The colorimetric MTS assay (cat. no. G3580; Promega
Corporation) was performed to determine cancer cell proliferation.
Briefly, cells were seeded into 96-well plates (1,000 cells/well)
and were incubated at 37°C for 6 days. Subsequently, a mixed
solution of MTS and phenazine ethosulfate (20:1 ratio) was added to
each well and incubated for a further 4 h. A microplate reader was
then used to determine the absorbance value at 490.
Animal experiments
To generate ZNF180-overexpressing tumor xenografts,
male BALB/c athymic nude mice (GemPharmatech Co., Ltd.) (age, 4
weeks; weight, 12–14 g) were randomly divided into the vector and
ZNF180-overexpression groups (n=12 mice each). The mice were housed
under the following conditions: Temperature, 25°C; humidity, 60%;
12-h light/dark cycle; ad libitum access to food and water
that was changed three times every week). HCT116 cells
(2×10⁶ cells/tumor in 100 µl DMEM) were injected
subcutaneously into the right flanks of the nude mice. For
inoculation, the needle was inserted under the skin (~1 cm deep)
and was slid left and right several times, so that the cells were
seeded into clumps and to reduce an overflow of cell suspension
from the injection site. The tumor diameter was measured every 2-4
days after tumor establishment. The humane endpoint was that the
tumor diameter of the mice should not exceed 1.5 cm. A total of 11
days after the injection of tumor cells, the mice were euthanized
using CO2 followed by cervical dislocation; initially,
CO2 was released at 30% chamber volume/min, but was
increased to 50% chamber volume/min once the mice lost
consciousness. CO2 flow was maintained for >60 sec
following respiratory arrest, followed by cervical dislocation to
confirm the mice were euthanized. All animal experiments were
approved by the Institutional Animal Care and Use Committee of
SYSU6 (approval no. IACUC-2023101301).
Wound healing assay
HCT116 cells were seeded into 6-well plate and
cultured to 90% confluence. Subsequently, serum was removed from
the medium and the cells were cultured for 24 h before wound
generation, after which, a sterile 200-µl pipette tip was used to
create an artificial wound in each 6-well plate and the floating
cells were removed by washing with PBS. The corresponding images
were captured at 0 and 24 h using an inverted light microscope
(IX73; Olympus Corporation).
Transwell assay
For the Transwell migration assay, 5×10⁴
cells in 200 µl serum-free DMEM were added to uncoated cell culture
inserts (pore size 8 µm; cat. no. 3428; Corning, Inc.) in a 24-well
plate. In addition, 800 µl complete medium containing 10% FBS was
added to the lower chamber of the 24-well plate. The cells were
incubated at 37°C (5% CO2 and 90% humidity) for 22 h,
and then stained with 1% crystal violet (cat. no. T1343L; TargetMol
Chemicals, Inc.) at room temperature for 4 h and examined under an
inverted light microscope (IX73; Olympus Corporation).
Luciferase assay
Briefly, 293T cells were seeded into 96-well plates
at a density of 5,000 cells/well. The cells were then
co-transfected with a Renilla luciferase plasmid
(GemPharmatech Co., Ltd.), a firefly luciferase plasmid containing
METTL14 promoter (GemPharmatech Co., Ltd.), and the aforementioned
ZNF180 overexpression plasmid using the Roche X-tremeGENE™ HP DNA
(cat. no. 6366546001; MilliporeSigma), according to the
manufacturer's protocols, with three replicates for each test.
Plasmid luciferase activities were normalized against the
Renilla luciferase activity of the co-transfected internal
control plasmid. Cells were harvested 48 h post-transfection, and
luciferase activities were measured using the Dual-Luciferase
Reporter Assay System (cat. no. E1910; Promega Corporation). The
METTL14 promoter sequence is listed in Table SI.
Data source
The Cancer Genome Atlas (TCGA) RNA-seq transcriptome
data and clinical information were obtained from TCGA database
(https://portal.gdc.cancer.gov). The
GSE39582 (28) and GSE87211
datasets (29) were retrieved from
the Gene Expression Omnibus database (http://www.ncbi.nlm.nih.gov/geo/). The raw data were
processed using the R packages GEOquery (https://bioconductor.org/packages/release/bioc/html/GEOquery.html)
and Stringr (https://cran.r-project.org/web/packages/stringr/index.html).
The mRNA expression levels of ZNF180 and METTL14 data in numerous
CRC cell lines were obtained the DepMap portal (https://depmap.org/portal/). The CpG islands of the
ZNF180 promoter were searched for using the UCSC Genome Browser
(http://www.genome.ucsc.edu).
Risk signature construction and
validation
Univariate Cox regression and Kaplan-Meier (KM)
analysis using the survival R package (https://cran.r-project.org/web/packages/survival/index.html)
were performed to identify genes associated with patient overall
survival (OS) time from TCGA and GSE39582 datasets. Only when the
P-values of both analysis methods were ≤0.05 were the genes
included in the next step. The intersecting genes, identified by
univariate Cox regression and KM analysis from TCGA and GSE39582
datasets were then analyzed by least absolute shrinkage and
selection operator (LASSO) regression analysis using the glmnet R
package (https://cran.r-project.org/web/packages/glmnet/index.html)
in TCGA database to narrow the range of prognosis-related genes.
Subsequently, the Akaike information criterion (AIC) method of
multivariate Cox regression analysis was performed using the
survival package to establish an optimal risk signature based on
linear integration of the regression coefficient obtained from the
multivariate Cox regression analysis and the expression level of
the selected genes. The risk score was computed as follows:
where Expi is the expression value of the genes and
Coefi is the corresponding regression coefficient calculated by
multivariate Cox regression analysis. TCGA data were used as the
training cohort and GSE39582 data were used as the validation
cohort.
Statistical analysis
All in vitro experiments were repeated three
times. Statistical analysis was performed using SPSS version 26
(IBM Corporation). Continuous variables are presented as the mean
and standard deviation (SD), whereas categorical variables are
presented as frequencies. The significance between two different
groups of continuous variables was assessed using unpaired
Student's t-test or paired Student's t-test, whereas the
significance between the proportions of different groups was
assessed using χ2 test. The significance among multiple
groups was assessed using one-way ANOVA for parametric data and the
Scheffe post hoc test. KM analysis with log-rank test was used to
compare the survival rates of each group. Multivariate analysis was
conducted for the variables that were significantly associated with
disease-free survival (DFS) in the univariate Cox regression model,
using the Cox proportional hazards regression model. Hazard ratios
(HRs) and 95% confidence intervals were provided for the
multivariate analysis. The correlation between two groups was
evaluated using Pearson's correlation analysis (two-tailed). Unless
specifically stated, all statistical tests were two-sided, and
P<0.05 was considered to indicate a statistically significant
difference.
Results
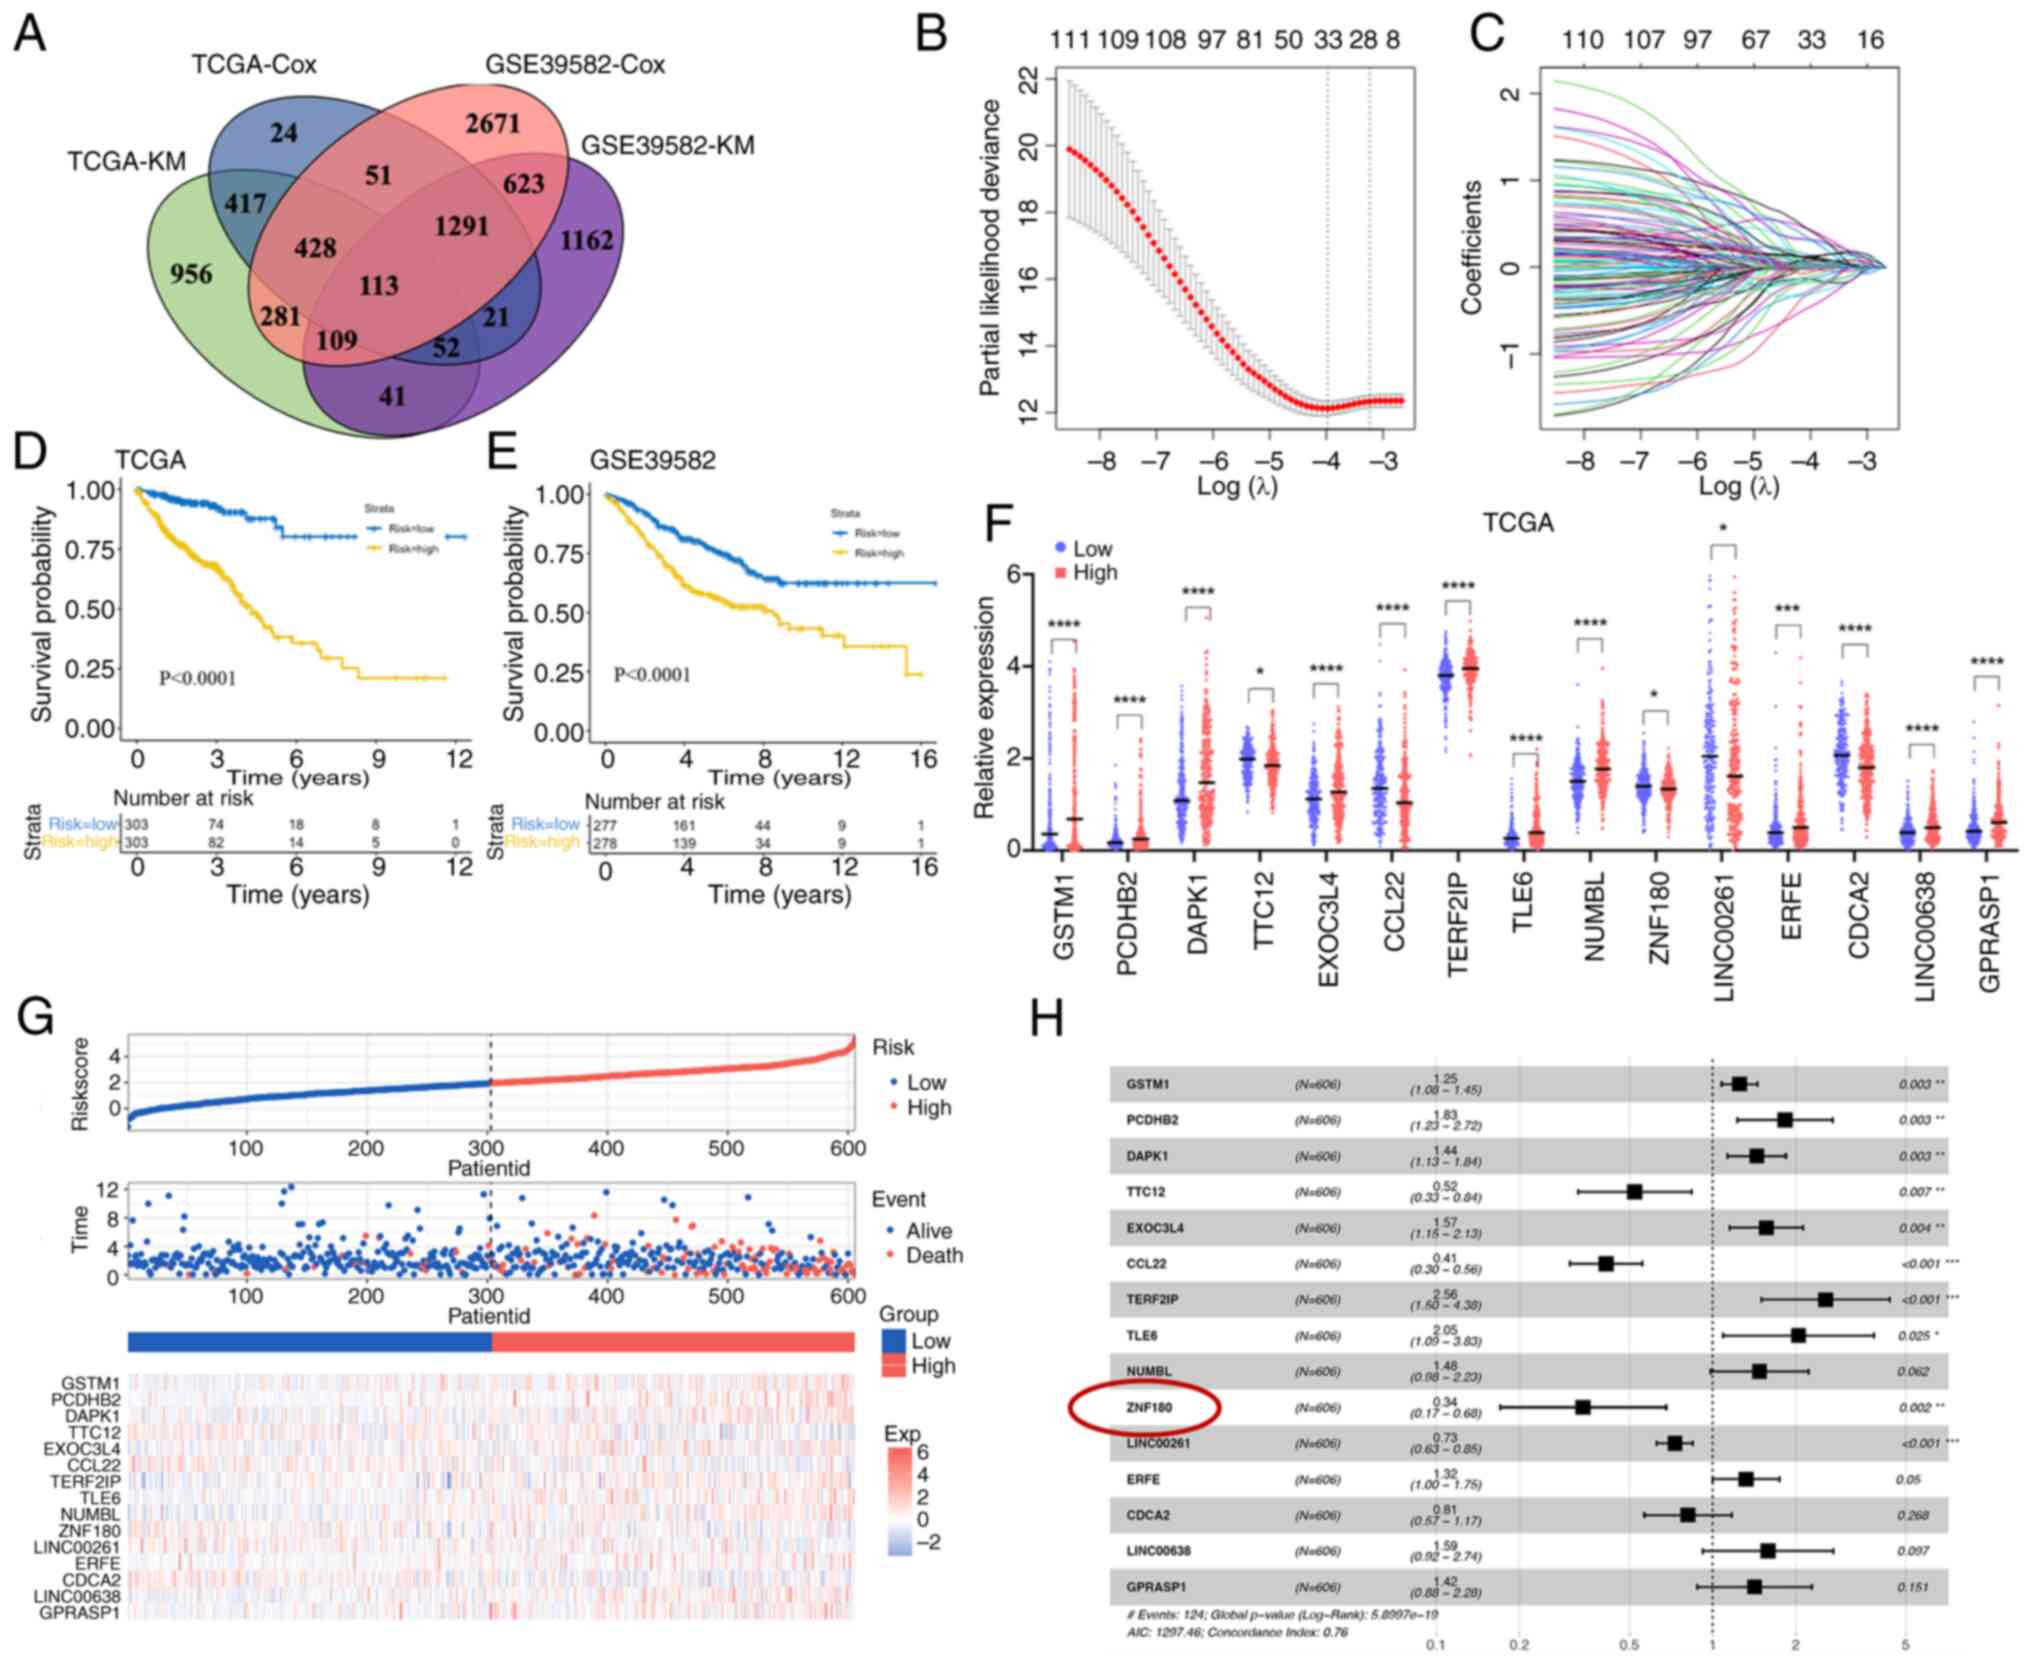
A total of 15 prognosis-related genes
were identified to develop a risk model
To construct a risk model, all genes from TCGA and
GSE39582 datasets were extracted and used to generate a prognostic
gene signature. These genes were then subjected to univariate Cox
regression and KM analyses. In TCGA and GSE39582 datasets, 113
genes are significantly associated with prognosis in patients with
CRC (Fig. 1A). These overlapping
genes were then used for the LASSO regression analysis to avoid
overfitting problems in the risk signature. The AIC method of the
multivariate Cox regression analysis was applied to the genes
returned from the LASSO regression analysis to construct the
optimal model, which included 15 genes (GSTM1, PCDHB2, DAPK1,
TTC12, EXOC3L4, CCL22, TERF2IP, TLE6, NUMBL, ZNF180, LINC00261,
ERFE, CDCA2, LINC00638 and GPRASP1) (Fig. 1B and C). Among these genes, TTC12,
CCL22, ZNF180, LINC00261 and CDCA2 were revealed to be protective
factors with HRs <1, whereas GSTM1, PCDHB2, DAPK1, EXOC3L4,
TERF2IP, TLE6, NUMBL, ERFE, LINC00638 and GPRASP1 were considered
risk factors with HRs >1 (Fig.
1H). TCGA dataset was used as a training cohort to construct
the risk signature. Samples in TCGA and GSE39582 cohorts were
stratified into low- and high-risk groups based on the median risk
score in each cohort. The KM analysis showed that patients in the
low-risk group were associated with better outcomes than those in
the high-risk group (Fig. 1D and
E). All 15 genes exhibited significant differences in gene
expression between the low- and high-risk groups (Fig. 1F); 10 genes were upregulated in the
high-risk group and five genes were upregulated in the low-risk
group. In addition, most of them exhibited differential expression
between tumor and adjacent normal tissues in TCGA dataset (Fig. S1A). The OS-related prediction model
distribution of patients in TCGA and GSE39582 datasets is shown in
Fig. 1G.
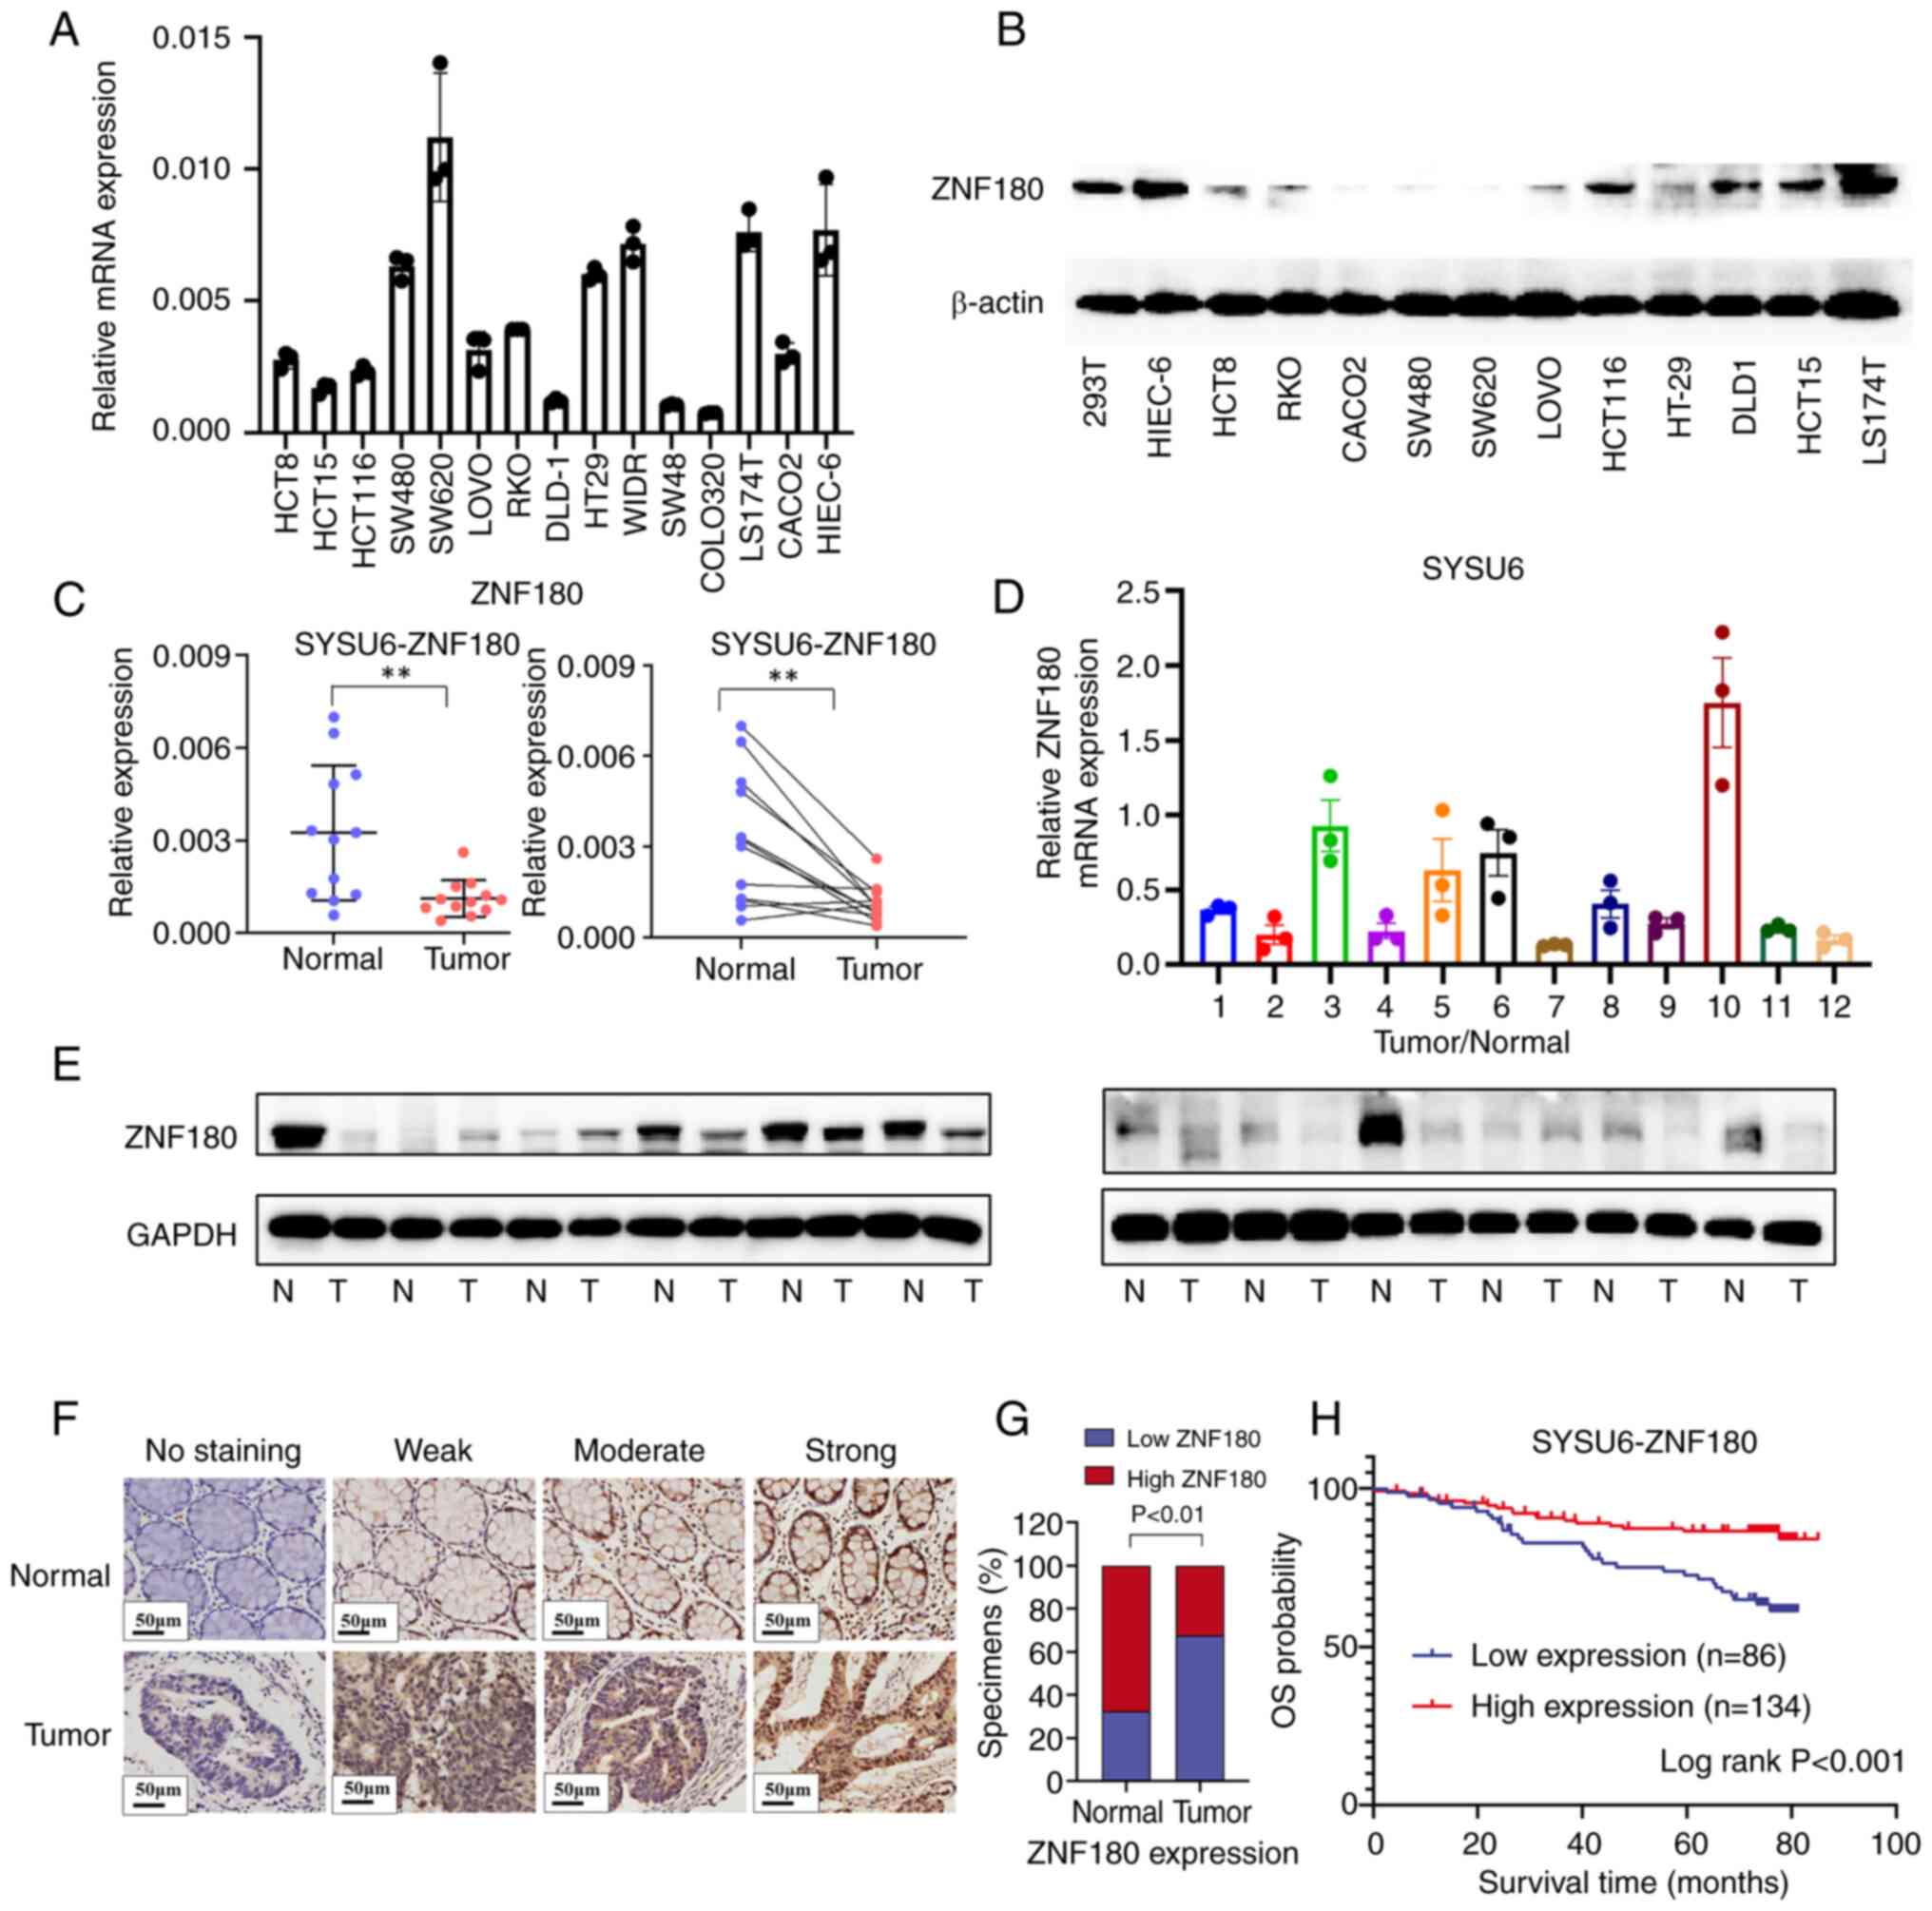
ZNF180 is dysregulated in CRC cell
lines and tissues
Among the 15 genes identified, only ZNF180 encoded a
transcription factor. Transcription factors are potential
regulatory genes and mediators of tumor progression (30,31).
Notably, the function and mechanisms of ZNF180 in CRC are poorly
understood; therefore, ZNF180 was selected for further functional
and downstream target exploration, aiming to elucidate its clinical
characteristics and prognostic value in CRC. To investigate the
role of ZNF180 in CRC progression, its expression was assessed in
CRC cells and tissues. The results revealed that the mRNA
expression levels of ZNF180 were decreased in most CRC cell lines
compared with those in HIEC-6 immortalized intestinal epithelial
cells (Fig. 2A). In addition,
ZNF180 mRNA and protein expression levels were detected in CRC
patient tissue samples and matched normal tissues by RT-qPCR and
western blotting. The relative expression levels of ZNF180 were
significantly lower in 12 CRC tissues than those in 12 normal
tissues from the SYSU6 cohort (Figs.
2C-E and S1F); these results
were consistent with those recorded from TCGA and GSE39582 datasets
(Fig. S1B). The mRNA expression
levels of ZNF180 in numerous CRC cell lines were obtained from the
DepMap portal (Fig. S3A).
Based on these findings, it was hypothesized that
ZNF180 may serve a crucial role in CRC tumorigenesis. The clinical
implications of ZNF180 expression were further evaluated using IHC
staining in 220 CRC samples from the SYSU6 cohort (Fig. 2F). Based on the ROC curve, the
optimal cut-off of ZNF180 expression was identified and patients
were divided into low- and high ZNF180 expression groups. The KM
analysis showed that patients with high ZNF180 expression had a
longer OS and DFS than those with low ZNF180 expression in the
SYSU6 cohort (Figs. 2H and S1C); this was also observed in TCGA and
GSE39582 datasets (Fig. S1D).
ZNF180 expression was slightly associated with the risk score in
both TCGA and GSE39582 datasets (Fig.
S1E). Notably, there was a high proportion of high ZNF180
expression in normal tissues (Fig.
2G). The associations between ZNF180 expression and
clinicopathological characteristics of 220 patients with CRC in the
SYSU6 cohort are presented in Table
I. Low levels of ZNF180 in primary tumors were significantly
associated with advanced T, N, M and clinical stages, and a high
risk of mortality and disease progression. Collectively, these
results indicated a strong association between ZNF180 expression
and patient survival outcomes, suggesting a critical role of ZNF180
in CRC pathogenesis.
 | Table I.Association of ZNF180 expression and
clinical characteristics in 220 patients with colorectal cancer
form The Sixth Affiliated Hospital of Sun Yat-sen University
cohort. |
Table I.
Association of ZNF180 expression and
clinical characteristics in 220 patients with colorectal cancer
form The Sixth Affiliated Hospital of Sun Yat-sen University
cohort.
|
|
| ZNF180
expression |
|
|---|
|
|
|
|
|
|---|
| Characteristic | No. | Low | High | P-value |
|---|
| Sex |
|
|
| 0.401 |
|
Male | 130 | 54 | 76 |
|
|
Female | 90 | 32 | 58 |
|
| Age |
|
|
| 0.052 |
| ≤60
years | 128 | 43 | 85 |
|
| >60
years | 92 | 43 | 49 |
|
| OS |
|
|
| 0.0001a |
| No | 172 | 56 | 116 |
|
|
Yes | 48 | 30 | 18 |
|
| DFS |
|
|
| 0.012a |
| No | 150 | 50 | 100 |
|
|
Yes | 70 | 36 | 34 |
|
| Location |
|
|
| 0.624 |
|
Right | 51 | 18 | 33 |
|
|
Left | 169 | 68 | 101 |
|
| T stage |
|
|
| 0.003a |
|
I–II | 61 | 14 | 47 |
|
|
III–IV | 159 | 72 | 87 |
|
| N stage |
|
|
| 0.005a |
|
N0 | 144 | 45 | 99 |
|
|
N1-X | 76 | 41 | 35 |
|
| M stage |
|
|
| 0.001a |
|
M0 | 190 | 66 | 124 |
|
|
M1 | 30 | 20 | 10 |
|
| Clinical stage |
|
|
| 0.0001a |
|
I–II | 135 | 40 | 95 |
|
|
III–IV | 85 | 46 | 39 |
|
ZNF180 is downregulated and regulated
by methylation in CRC
Aberrant DNA methylation is one of the most common
defects in epigenetic regulation observed in tumorigenesis
(12,32), and DNA methylation can decrease gene
expression. As aforementioned, ZNF180 expression was significantly
decreased in tumor tissues compared with in adjacent normal tissues
(Fig. 2C and D); therefore, the
present study investigated whether the downregulation of ZNF180
expression was regulated by methylation in CRC. The CpG islands in
the ZNF180 promoter region are shown in Fig. 3A. Initially, CRC cells were treated
with 5-AzaC, a DNMT inhibitor. The results revealed that treatment
with 5-AzaC significantly increased the mRNA and protein expression
levels of ZNF180 in CRC cells (Fig. 3B
and C). In addition, ZNF180 methylation was slightly associated
with ZNF180 mRNA expression in TCGA dataset (Fig. 3D). The KM analysis showed that
patients with low ZNF180 methylation levels had a longer OS than
those with high ZNF180 methylation levels in TCGA dataset (Fig. 3E). Moreover, the expression of
ZNF180 was also associated with genomic alteration (Fig. 3F). In summary, it may be
hypothesized that the expression of ZNF180 is regulated by
methylation and genomic alteration. To examine the role of ZNF180
in CRC progression, ZNF180-overexpressing HCT116 and RKO stable
cell lines were established. ZNF180 mRNA and protein expression
levels were verified by RT-qPCR and western blotting, respectively
(Fig. 3G and H). The effect of
ZNF180 overexpression on HCT15 cells was poor at the protein level,
and since the function of genes mainly depends on protein levels,
the two other cell lines (HCT116 and RKO) that exhibited
overexpression at the protein level were selected for the
subsequent functional study.
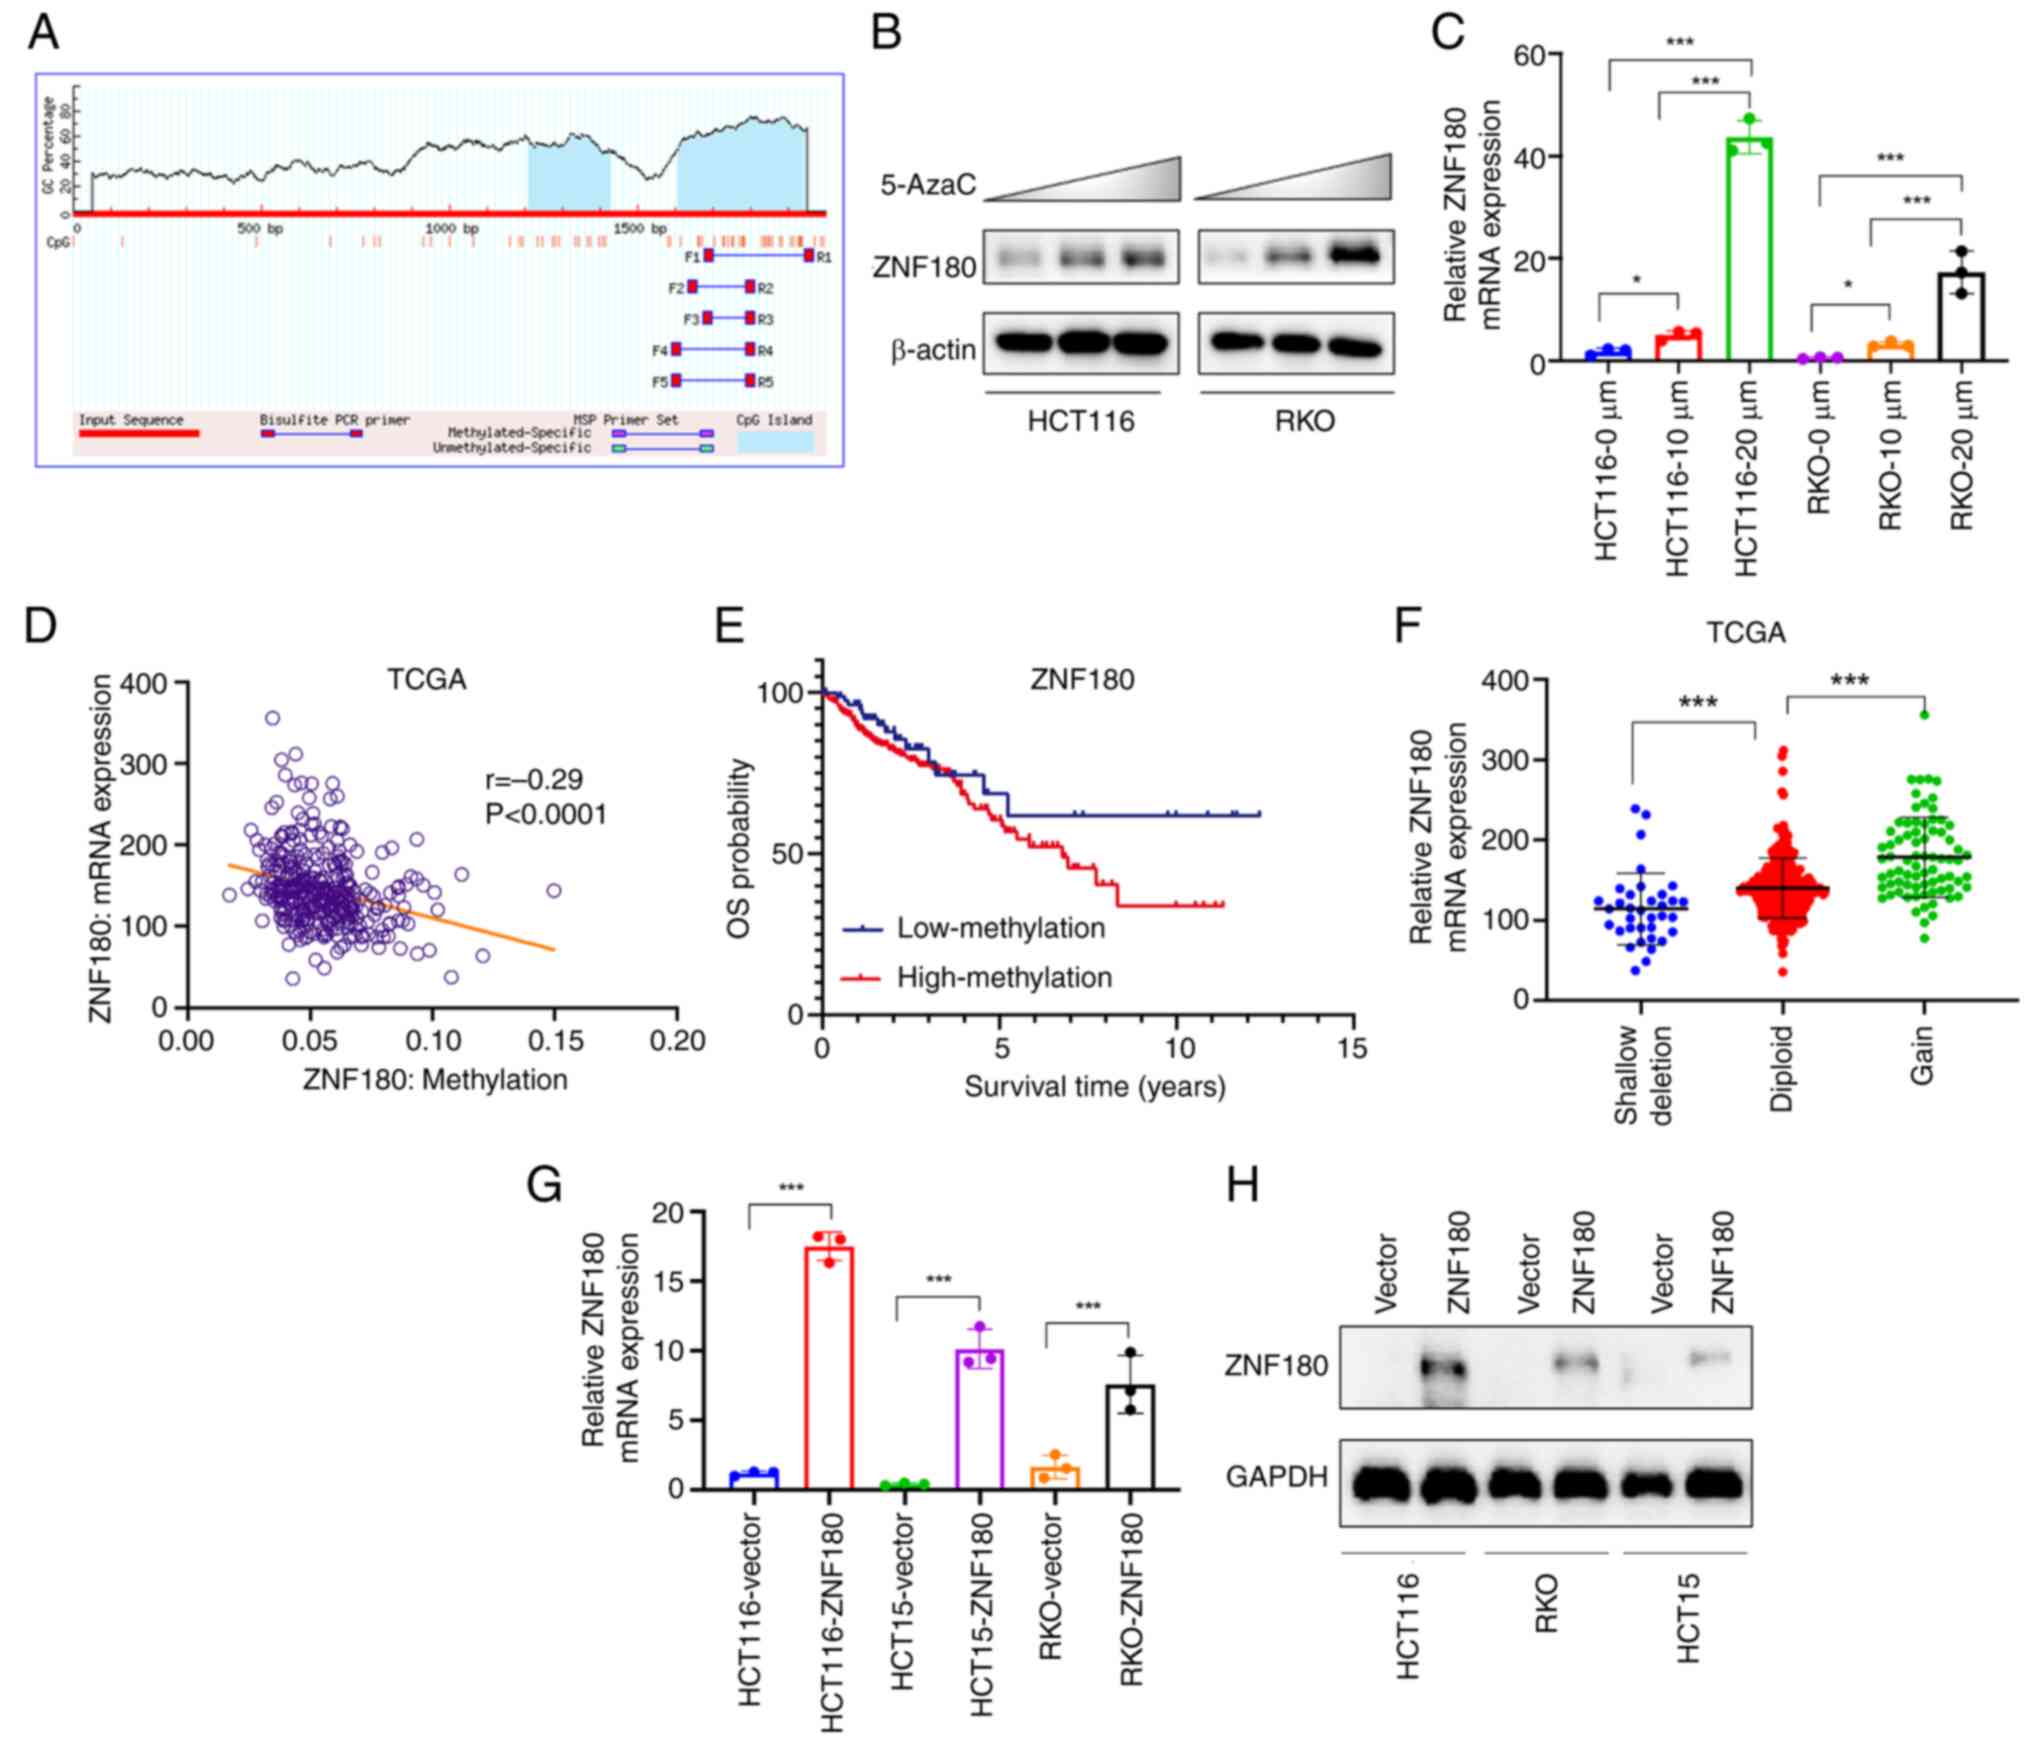 | Figure 3.ZNF180 is downregulated and its
promoter hypermethylated in colorectal cancer. (A) Schematic
representation of the CpG islands and bisulfite sequencing region
in the ZNF180 promoter. HCT116 and RKO cells were subjected to 3
days of treatment with increasing doses of 5-AzaC; blue: CpG island
of ZNF180 promoter; Input Sequence: Promoter region of ZNF180. (B)
Protein expression levels were determined by western blotting. (C)
mRNA expression levels were determined by RT-qPCR, respectively.
The untreated group was used as the control group, and the relative
expression levels of each group were divided by the relative
expression levels of the control group. P-values were calculated
using one-way ANOVA and Scheffe test, *P<0.05, ***P<0.001.
(D) Correlation between ZNF180 mRNA expression level and ZNF180
methylation level in TCGA data set. (E) Overall survival rate was
significantly higher in the low ZNF180 methylation group in TCGA
dataset. (F) ZNF180 mRNA expression in patients with different DNA
statuses in TCGA dataset. P-values were calculated using one-way
ANOVA and Scheffe test, ***P<0.001. Relative (G) mRNA and (H)
protein expression levels were determined by RT-qPCR and
immunoblotting, respectively. P-values were calculated using
unpaired Student's t-test, ***P<0.001. 5-AzaC, 5-azacytidine;
RT-qPCR, reverse transcription-quantitative PCR; TCGA, The Cancer
Genome Atlas; ZNF180, zinc finger protein 180. |
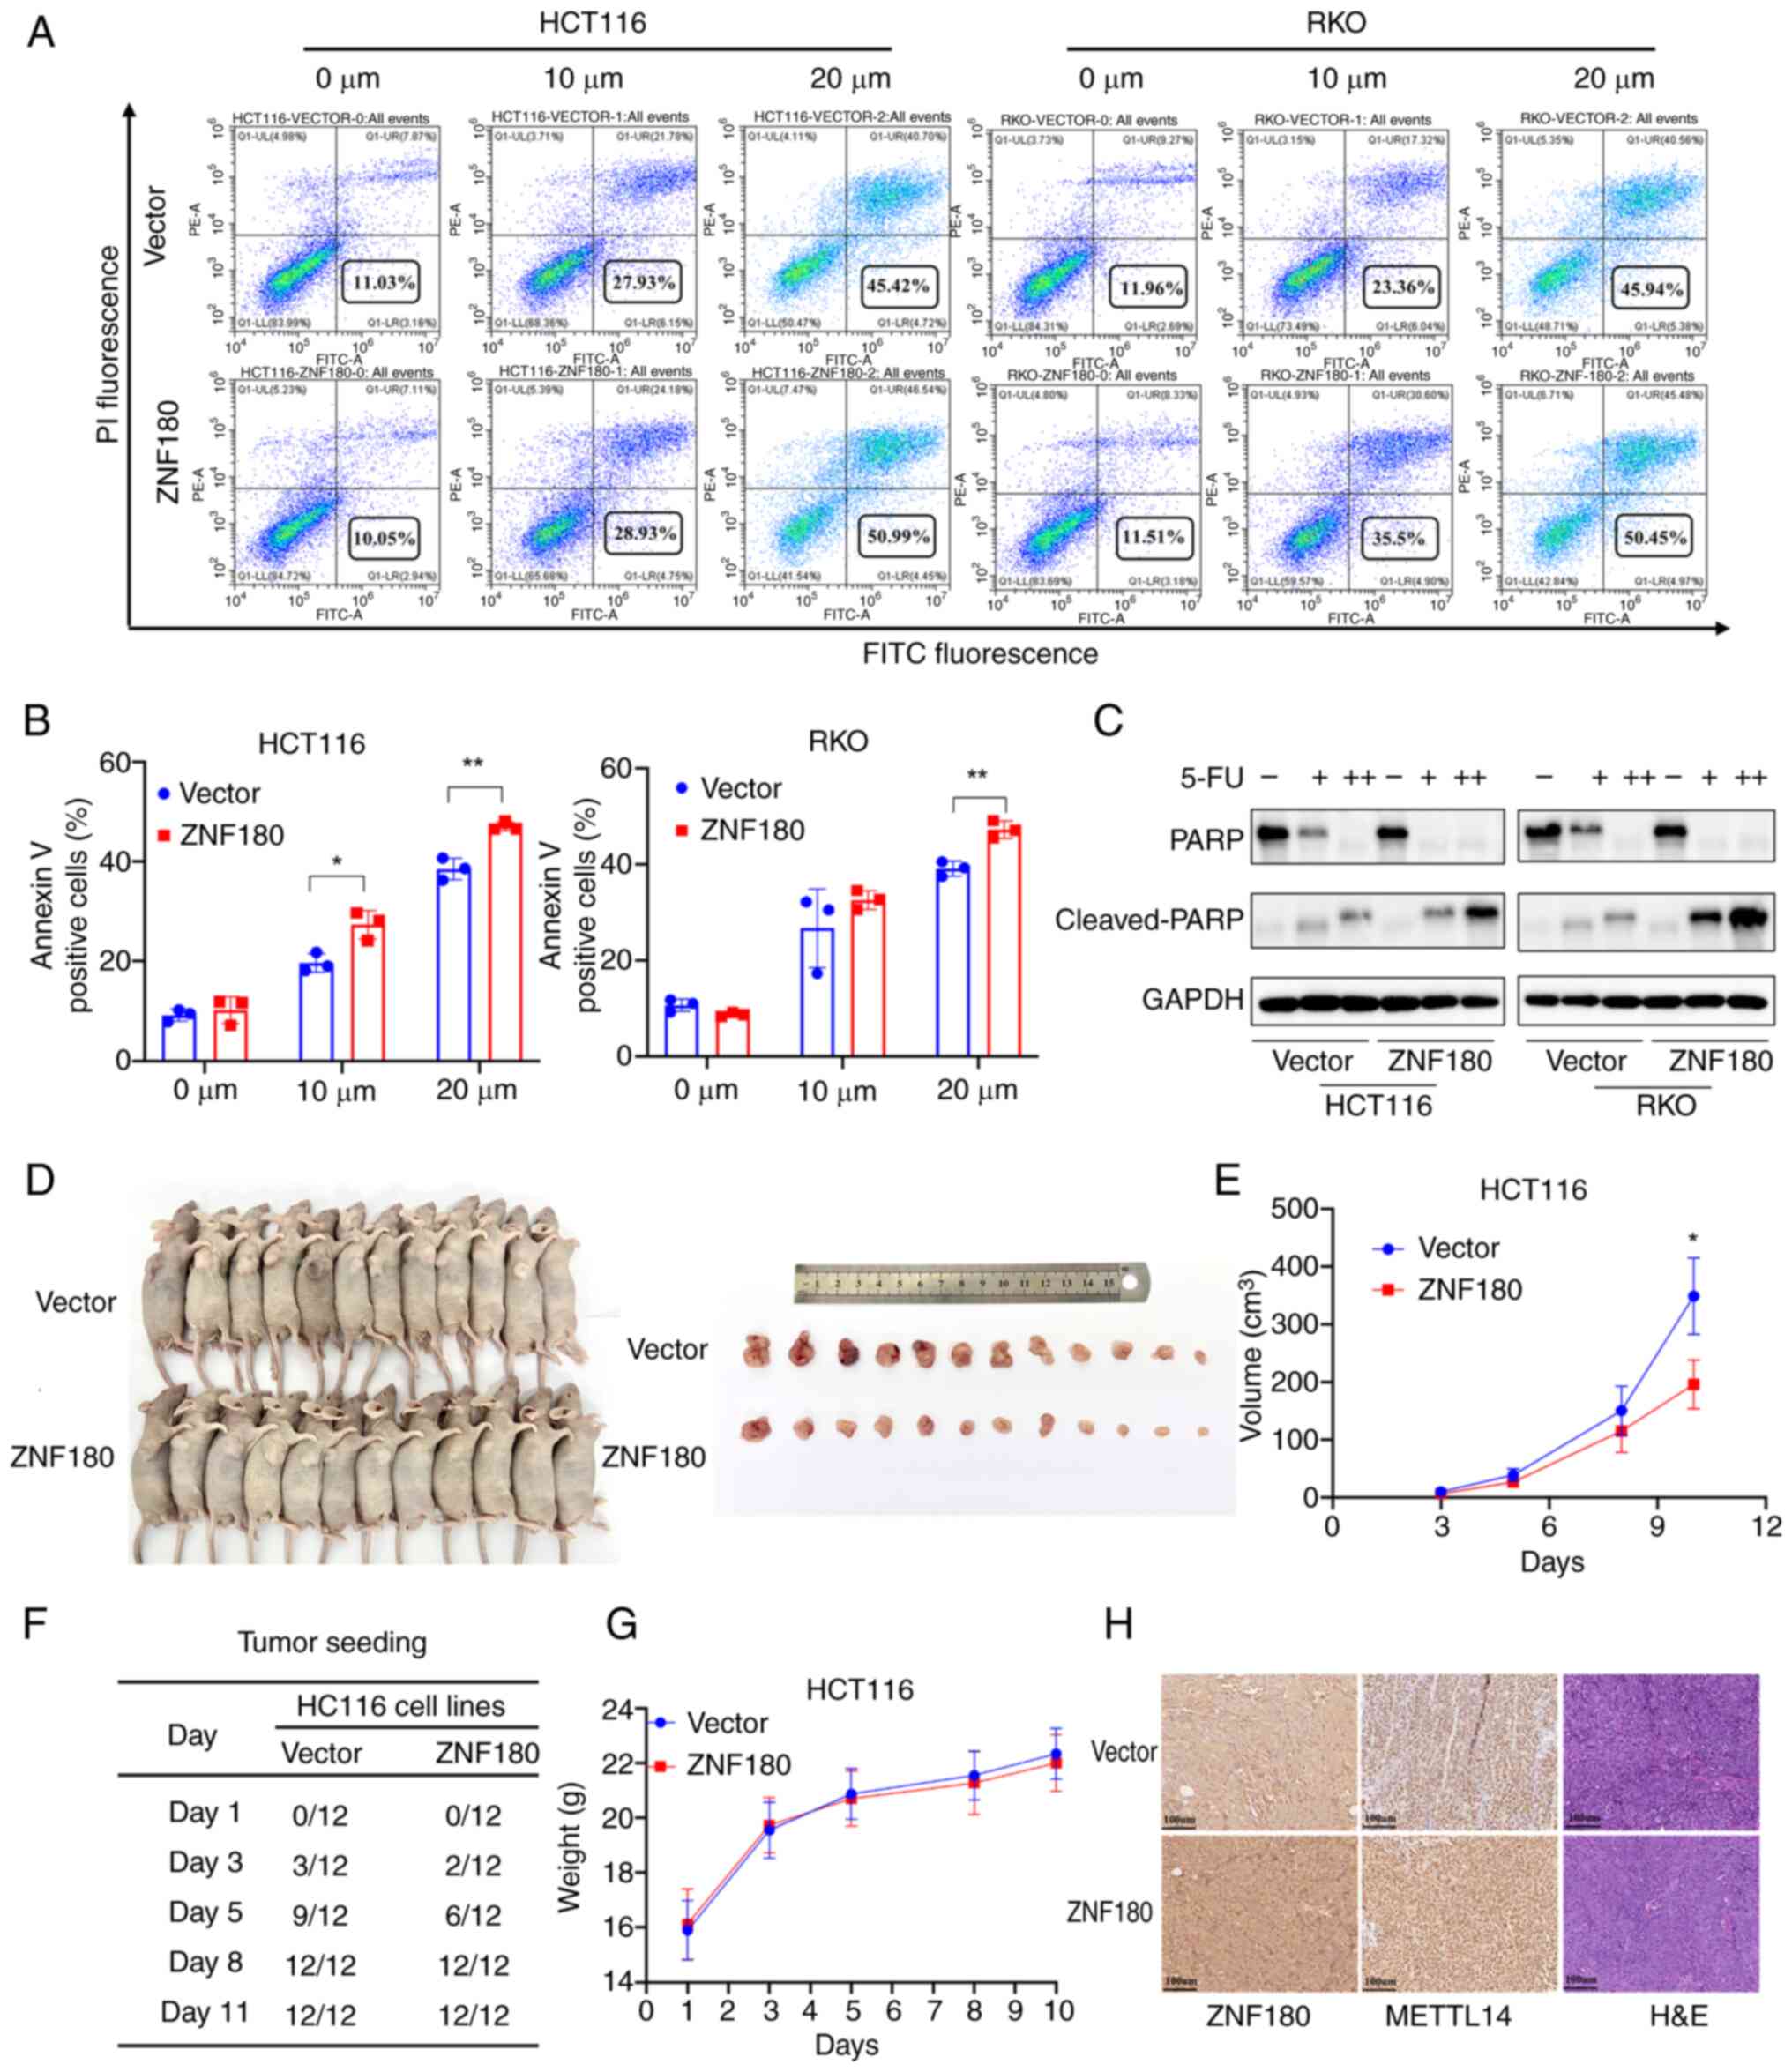
ZNF180 overexpression inhibits CRC
cell proliferation and induces apoptosis
To examine the effect of ZNF180 on apoptosis, flow
cytometry and western blotting were performed. Annexin V and PI
staining indicated that 5-FU induced more apoptosis in the
ZNF180-overexpressing HCT116 and RKO cells than in the
vector-transduced cells in a dose-dependent manner (Fig. 4A and B). This indicated that the
ZNF180-overexpressing cell line was more sensitive to 5-FU than the
control cell line. Moreover, the expression levels of cleaved-PARP
were increased in ZNF180-overexpressing cells upon treatment with
5-FU, whereas the expression levels of PARP were lower, compared
with those in the vector-transduced cells (Fig. 4C). These data suggested that ZNF180
may confer sensitivity to 5-FU. EdU staining was also performed to
assess the effects of ZNF180 on proliferation. The results showed
that ZNF180-overexpressing cells exhibited less EdU staining than
vector-transduced cells (Fig. S2C and
D). The results of IF staining showed that Ki67 expression was
also decreased in ZNF180-overexpressing cells (Fig. S2E-G).
Subsequently, an animal xenograft model was prepared
by subcutaneously injecting cells with stable overexpression of
ZNF180 and vector-transduced cells into nude mice. The
ZNF180-overexpressing group presented decreased tumor growth
compared with the vector group (Fig.
4E). Images of the isolated tumors are shown in Fig. 4D. Additionally, when
2×10⁶ cells were injected into nude mice, 75% of the
mice (9/12) formed palpable tumors in the HCT116 vector group
compared with 50% of the mice (6/12) in the HCT116
ZNF180-overexpressing group on day 5 (Fig. 4F). There was no difference in the
body weight of mice between the ZNF180-overexpressing group and
vector group (Fig. 4G). In
addition, the expression of ZNF180 and METTL14 were assessed using
IHC staining in tumor tissues obtained from the mice (Fig. 4H). In the ZNF180-overexpression
group, higher expression of ZNF180 and METTL14 was detected in
mouse tumor tissues.
To investigate the possible mechanism underlying the
inhibitory effects of ZNF180 on cell proliferation, the cell cycle
progression of ZNF180-overexpressing and vector-transduced cells
was assessed. The results showed that ZNF180 did not exert an
effect on cell cycle progression (Fig.
S2H). To investigate the biological function of ZNF180 in CRC,
wound healing and Transwell assays were carried out. The
experiments demonstrated that ZNF180 did not have an effect on
migration and invasion (Fig. S2I and
J). These results revealed the critical role of ZNF180 in
inhibiting cell proliferation and inducing apoptosis.
METTL14 is a candidate downstream
molecule in ZNF180 signaling
Transcription factors can finely regulate the
expression of downstream genes at specific developmental stages by
directly binding gene promoters and enhancers, or changing
chromatin structure (33,34). Currently, the function of ZNF180 in
CRC, particularly in the regulation of downstream genes, is poorly
characterized. To identify the potential target genes of ZNF180 in
CRC, 478 genes that were significantly co-expressed with ZNF180
were selected by overlapping three different cohorts, namely TCGA,
GSE39582 and GSE87211 (Fig. 5A and
B). In the correlation analysis, the correlation coefficient
between METTL14 and ZNF180 was ranked in the top 10. Moreover,
previous literature has reported that METTL14 is a tumor suppressor
gene (18–20), and that METTL14 expression in
primary CRC may be an independent favorable prognostic factor for
OS in patients (35).
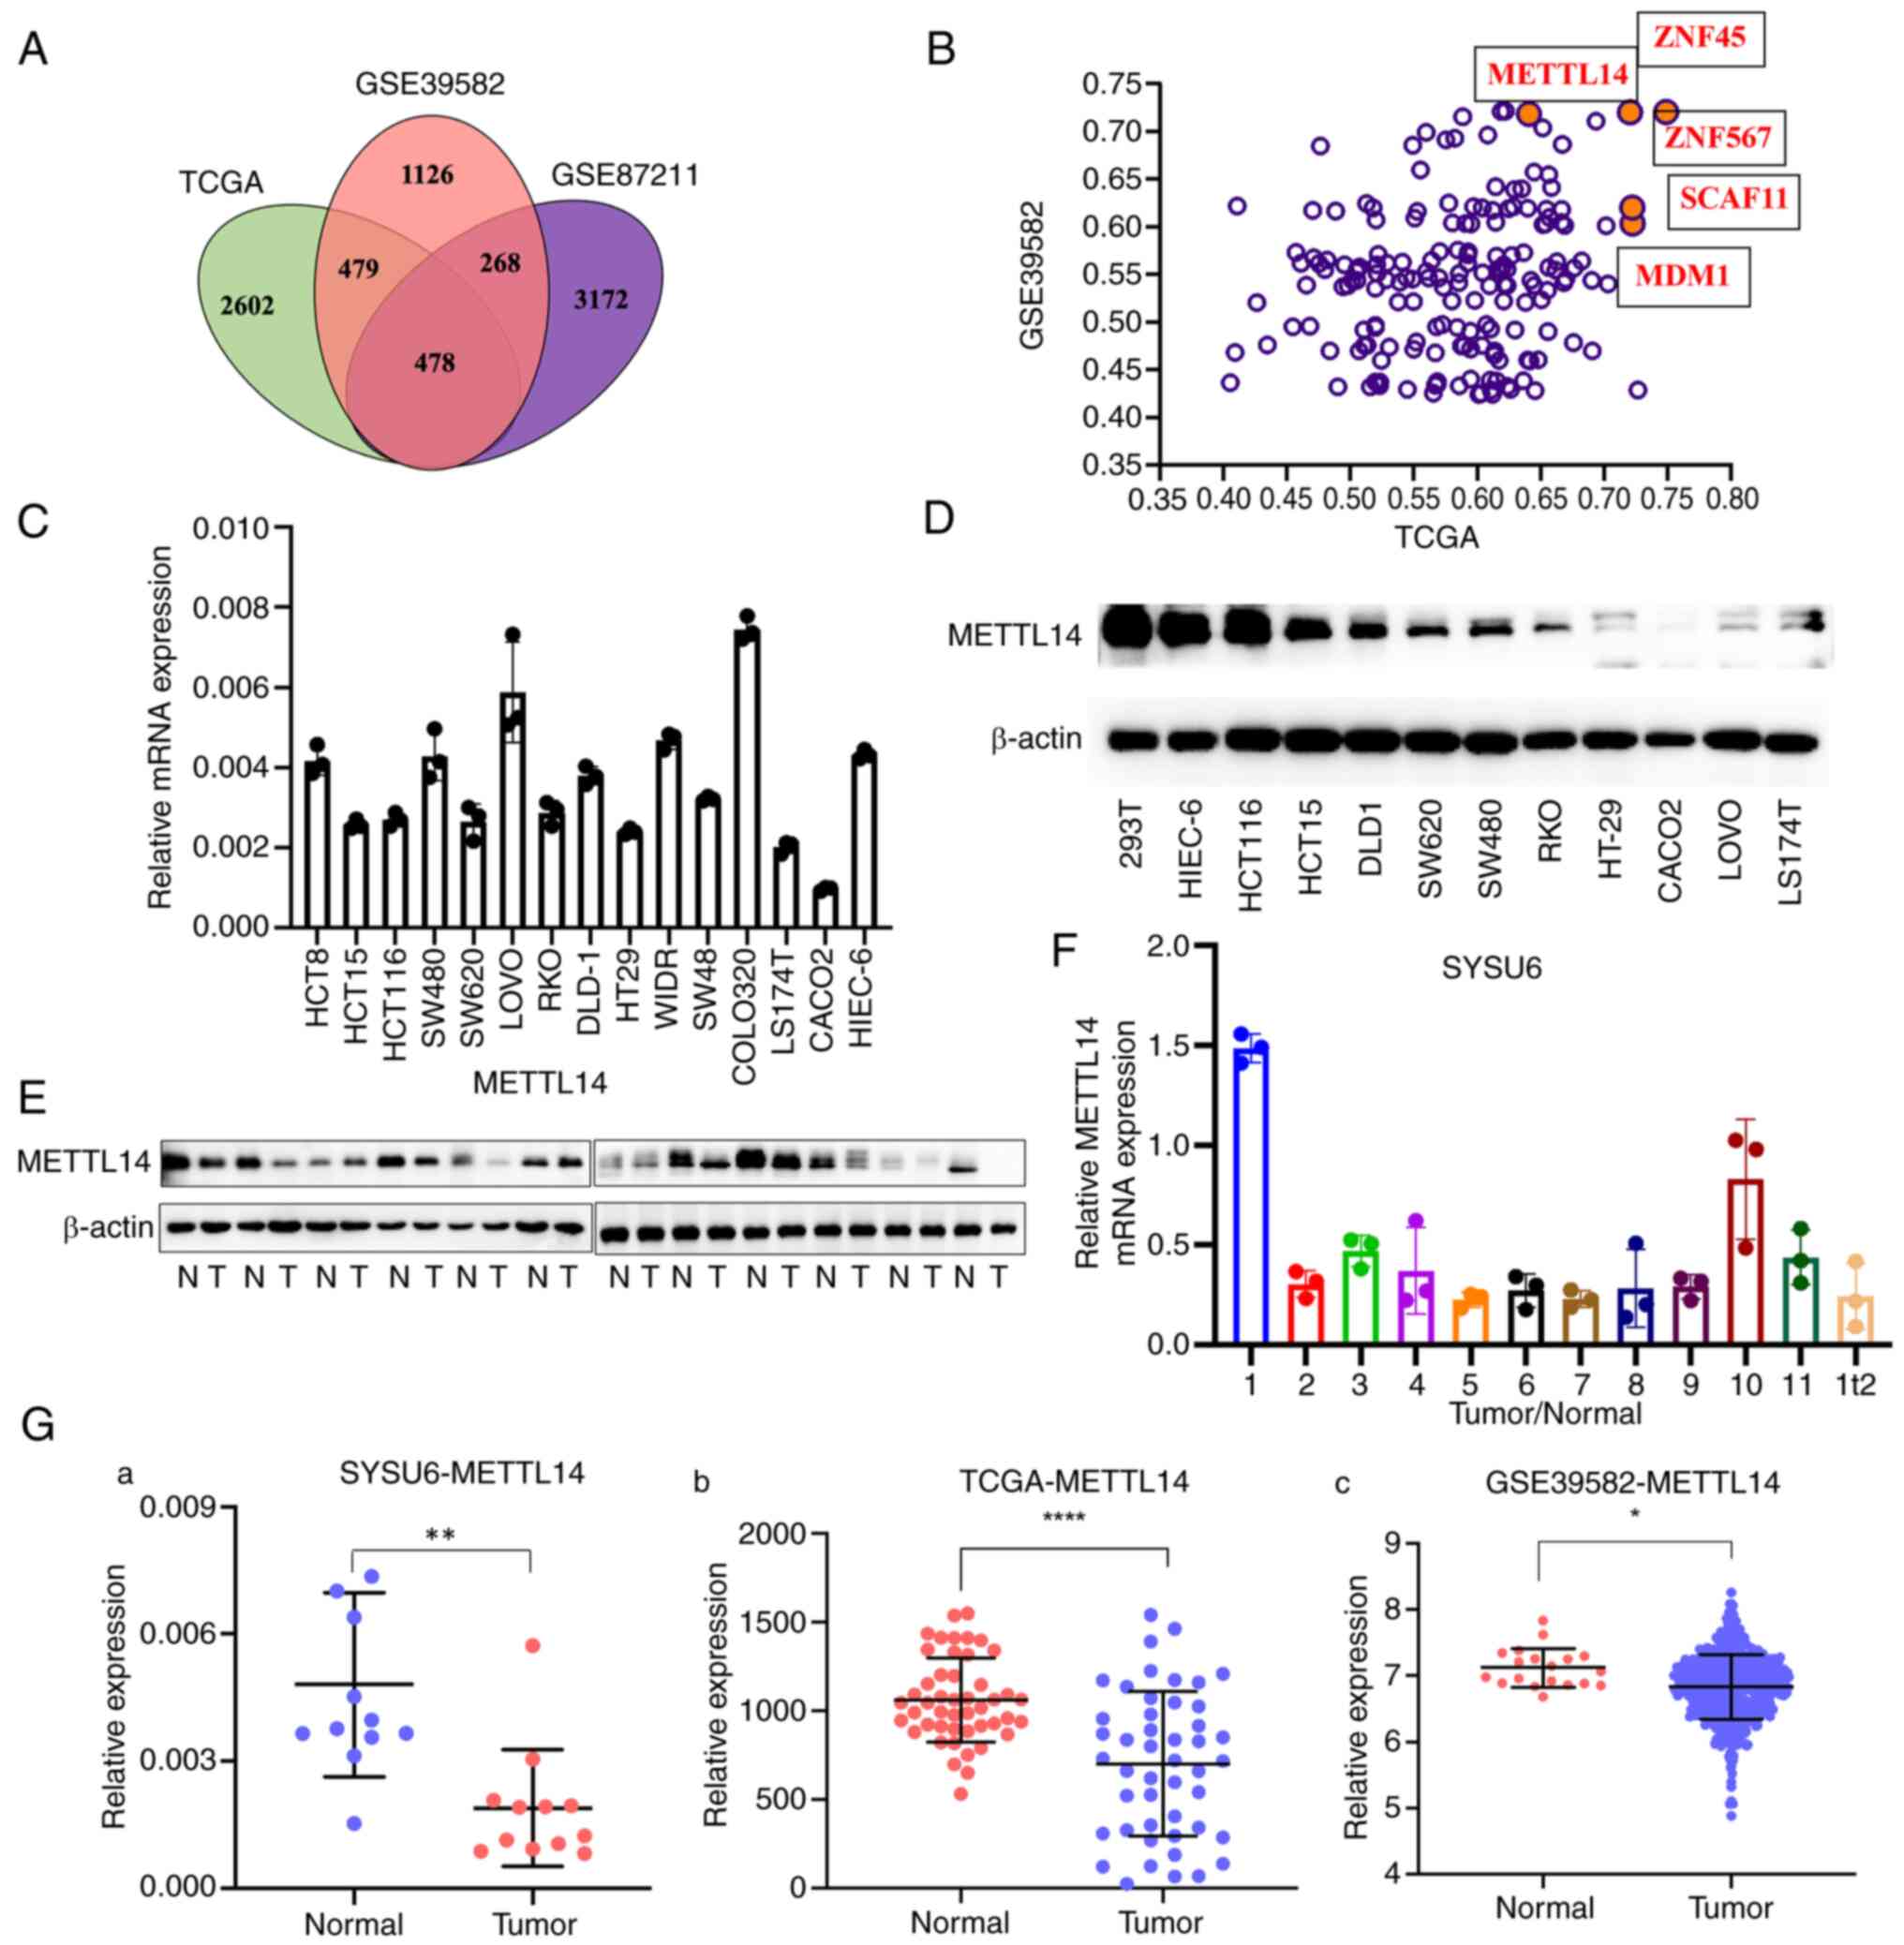 | Figure 5.METTL14 is a candidate target gene of
ZNF180. (A) Overlapping of the differentially expressed genes from
TCGA, GSE39582 and GSE87211 cohorts; 478 genes were identified to
be correlated with ZNF180. (B) Correlation between candidate target
genes and ZNF180 in TCGA and GSE39582 cohorts. (C) mRNA expression
levels of METTL14 in CRC cell lines and HIEC-6 immortalized
intestinal epithelial cells. (D) Protein expression level of
METTL14 in CRC cell lines and HIEC-6 immortalized intestinal
epithelial cells. (E) Protein and (F) mRNA expression levels of
METTL14 in 12 paired CRC tissues and noncancerous tissues from the
SYSU6 cohort were confirmed by western blotting and reverse
transcription-quantitative PCR, respectively. (G) mRNA expression
levels of METTL14 in CRC tissues and noncancerous tissues in SYSU6
(12 pairs), TCGA (47 pairs) and GSE39582 (normal tissues=19, tumor
tissue=566) cohorts. P-values were calculated using paired
Student's t-test (a and b) or unpaired Student's t-test (c).
*P<0.05, **P<0.01, ****P<0.0001. CRC, colorectal cancer;
METTL14, methyltransferase 14, N6-adenosine-methyltransferase
non-catalytic subunit; N, normal; SYSU6, The Sixth Affiliated
Hospital of Sun Yat-sen University; T, tumor; TCGA, The Cancer
Genome Atlas; ZNF180, zinc finger protein 180. |
Based on the aforementioned analysis, METTL14 may be
considered a candidate target for the ZNF180 gene. Considering that
ZNF180 was regulated by methylation in CRC, the present study
mainly focused on the candidate genes relevant to DNA methylation.
According to previous literature, METTL14 is a well-established
m6A writer protein and m6A methylation can be
catalyzed by METTL14 (16). To
examine the role of METTL14 in CRC progression, its expression was
assessed in CRC cells and tissues. It was observed that the mRNA
and protein expression levels of METTL14 were decreased in most CRC
cell lines compared with those in HIEC-6 immortalized intestinal
epithelial cells (Figs. 5C and D).
The mRNA expression levels of METTL14 in numerous CRC cell lines
were obtained from DepMap portal (Fig.
S3B). In addition, the mRNA and protein expression levels of
METTL14 were detected in 12 CRC tissue samples and matched normal
tissues by RT-qPCR and western blotting (Figs. 5E and F, and S1G). The relative expression levels of
METTL14 were significantly lower in CRC tissues than in normal
colorectal tissues in the SYSU6, TCGA, GSE39582 and GSE87211
cohorts (Figs. 5G and S2A). These findings indicated that ZNF180
expression was closely associated with the candidate gene METTL14
expression.
METTL14 is positively correlated with
ZNF180 expression in CRC cell lines and tissues
To examine the role of METLL14 in CRC progression,
its expression was assessed in CRC cells and tissues. The mRNA and
protein expression levels of METTL14 were detected in 12 CRC tissue
samples and 12 non-cancerous colorectal tissues by RT-qPCR in the
SYSU6 cohort (Figs. 5G and 6A). The relative expression levels of
METTL14 were significantly lower in CRC tissues than in normal
colorectal tissues in the SYSU6 cohort (Fig. 5G); ZNF180 expression was positively
correlated with METTL14 expression in CRC cell lines, and tissues
in the SYSU6, TCGA and GEO cohorts (Fig. 6A-E). The KM analysis showed that
patients with high METTL14 expression had better outcomes than
those with low METTL14 expression in TCGA dataset (Fig. 6F). The result was consistent with
previously reported data (36). The
clinical implications of METTL14 expression were further assessed
using IHC staining of 40 pairs of CRC samples. The relative protein
levels of METTL14 were markedly decreased in CRC tissues compared
with in normal colorectal tissues by IHC staining (Fig. 6G); there was a high proportion of
high METTL14 expression in normal tissues, and a high proportion
for high METTL14 expression in high ZNF180-expressing tissues
(Fig. 6H). Collectively, these
results indicated a positive correlation between METTL14 and ZNF180
expression levels.
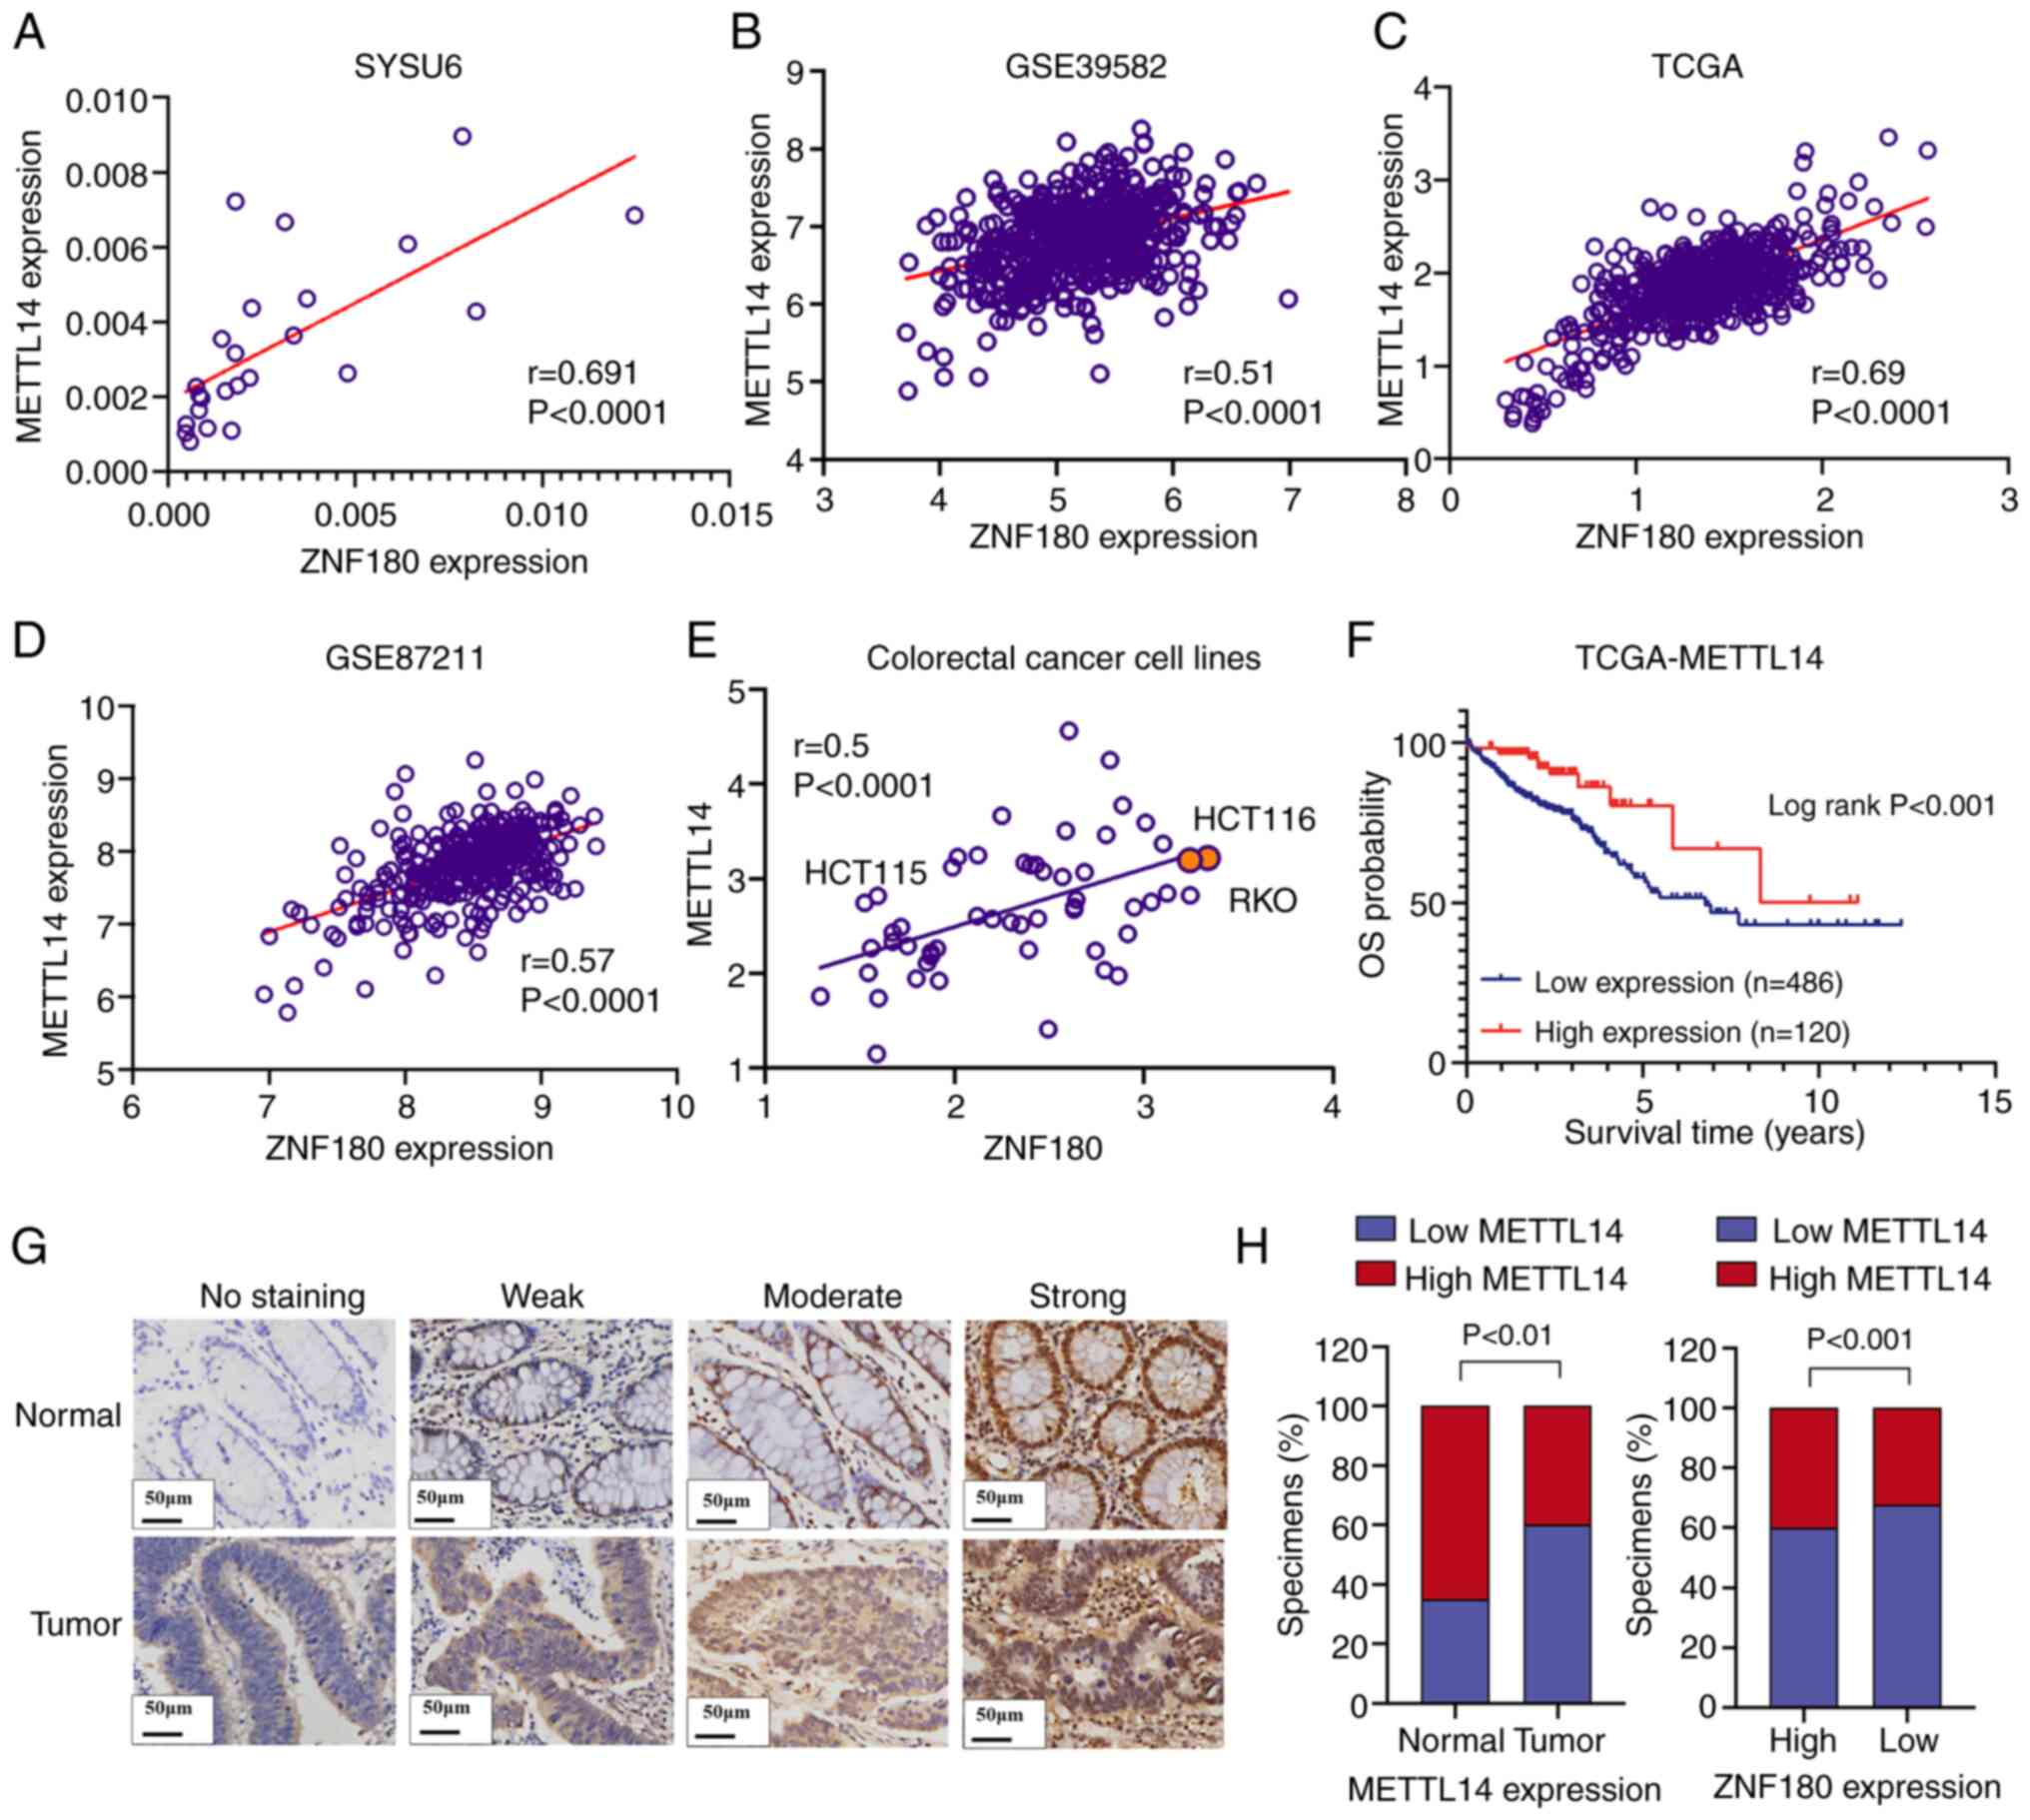 | Figure 6.METTL14 is associated with ZNF180 in
CRC cell lines and tissues. (A) mRNA expression levels of METTL14
in 12 paired CRC tissues and noncancerous tissues from the SYSU6
cohort, and the positive correlation between METTL14 and ZNF180
expression in the SYSU6 cohort. Pearson correlation coefficient was
used for correlation analyses. **P<0.01. (B) ZNF180 expression
was positively correlated with METTL14 expression in the GSE39582
dataset. (C) mRNA expression levels of ZNF180 and METTL14 in CRC
tissues, the positive correlation between METTL14 and ZNF180
expression in TCGA dataset. Pearson correlation coefficient was
used for correlation analyses. ****P<0.0001. (D) ZNF180
expression was positively correlated with METTL14 expression in the
GSE87211 data set. (E) Positive correlation between METTL14 and
ZNF180 expression in CRC cell lines. Pearson correlation
coefficient was used for correlation analyses. ****P<0.0001. (F)
Kaplan-Meier analysis indicated downregulation of METTL14 was
significantly associated with poorer overall survival in patients
with CRC in TCGA dataset. (G) Levels of METTL14 protein expression
in CRC tissues under high magnifications microscopy. (H) Low
METTL14 expression rate was higher in CRC tissues, and the high
METTL14 expression rate was increased in the high ZNF180 expression
group; tissues from 40 patients with CRC in the SYSU6 cohort with
both tumor cells and normal cells were assessed. CRC, colorectal
cancer; METTL14, methyltransferase 14,
N6-adenosine-methyltransferase non-catalytic subunit; SYSU6, The
Sixth Affiliated Hospital, Sun Yat-sen University; TCGA, The Cancer
Genome Atlas; ZNF180, zinc finger protein 180. |
ZNF180 directly binds to and promotes
METTL14 in CRC
The increase in METTL14 expression at the mRNA and
protein levels after the overexpression of ZNF180 was validated by
RT-qPCR and western blotting, respectively (Fig. 7A and C). The IF assay showed that
ZNF180 and METTL14 were mainly located in the nucleus, and that the
overexpression of ZNF180 increased METTL14 expression (Figs. 7B and S2K). Since ZNF180 is a transcription
factor, it was hypothesized that the METTL14 promoter could be
regulated by ZNF180. For the mechanistic analysis, a ChIP assay was
performed. ZNF180 was detected in cell lines stably overexpressing
ZNF180 by blotting using a specific anti-Flag antibody. Using the
ChIP assay, DNA was digested into 100–750 bp fragments (Fig. 7D), and the ZNF180 protein was
successfully pulled down with an anti-Flag antibody. A METTL14 DNA
element was detected in the anti-Flag group (Fig. 7E). Based on the METTL14 promoter
regions (Table SI), specific
primers were designed for standard PCR assay, and the METTL14
levels were also detected by RT-qPCR and normalized to those of IgG
(Fig. 7F), thus indicating that
METTL14 may be a downstream target gene of ZNF180. To verify
whether ZNF180 can bind to the METTL14 promoter, the METTL14
promoter (2,030 bp) was cloned into a luciferase plasmid. The
luciferase assay results showed that the transcriptional activity
was increased in the METTL14 promoter plasmid group compared with
the vector group (Fig. 7G). This
finding showed that the region of the METTL14 promoter was
transcriptionally activated by ZNF180. Furthermore, METTL14 was
knocked down using siRNA and validated by western blot (Fig. 7H); the proliferation assay results
showed that knockdown of METTL14 promoted tumor cell proliferation
(Fig. 7I), and knockdown of METTL14
could reverse the inhibition of cell proliferation by ZNF180
(Fig. S1H). To demonstrate whether
METTL14 can rescue the effect of ZNF180 by increasing apoptosis,
cell lines with stable overexpression of ZNF180 and METTL14
knockdown were constructed using siRNA in ZNF180-overexpressing
HCT116 cell lines. Following treatment with 5-FU, flow cytometry
was performed to determine the effects of METTL14 on cancer cell
apoptosis (Fig. 7J and K); the
results revealed that knockdown of METTL14 could rescue the effects
of ZNF180 on apoptosis. These results indicated that ZNF180
directly binds to the METTL14 DNA element and activates the
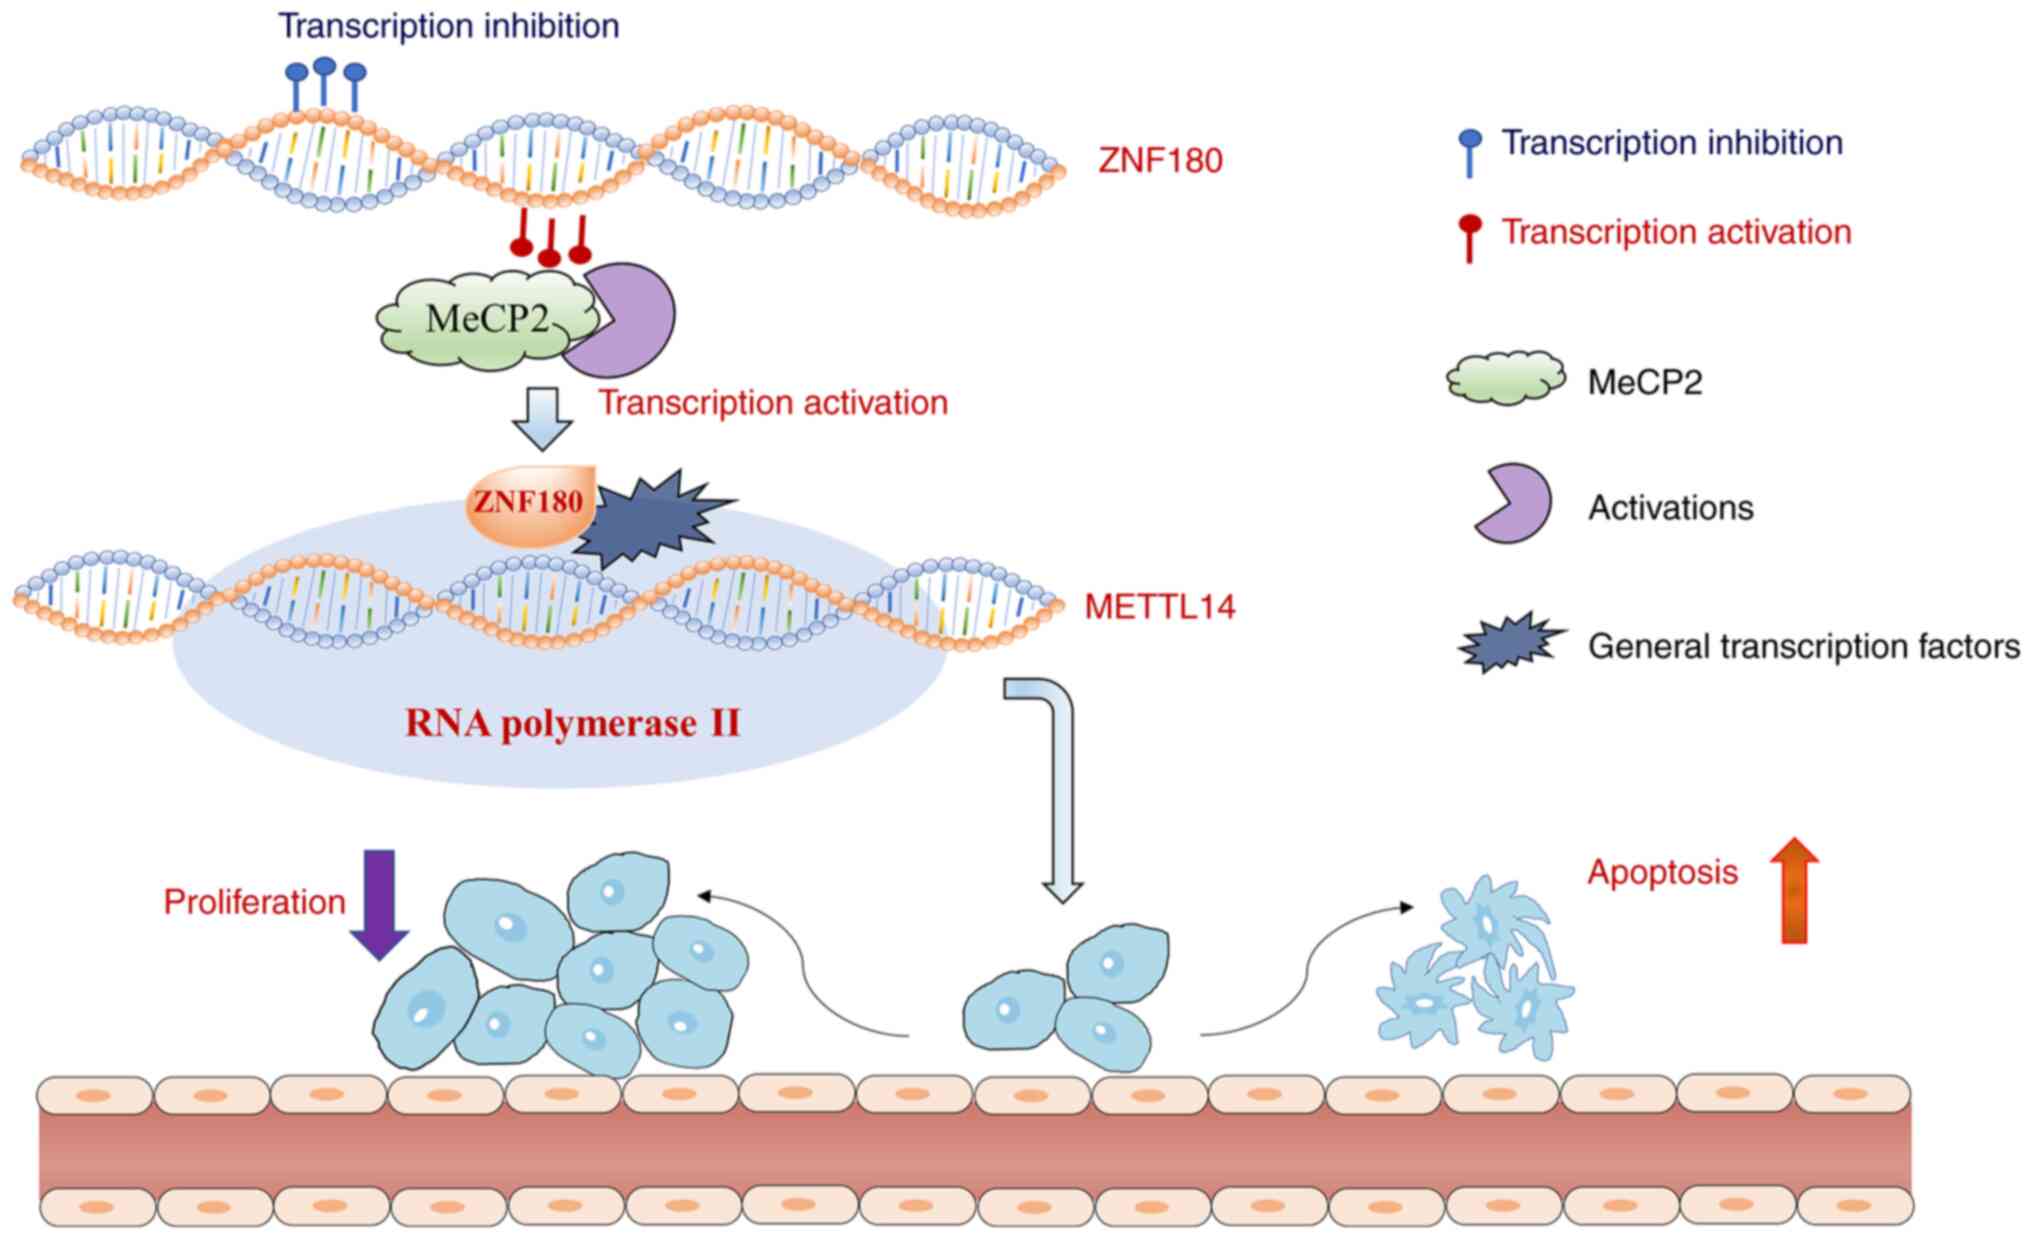
transcriptional activity of the METTL14 gene (Fig. 8).
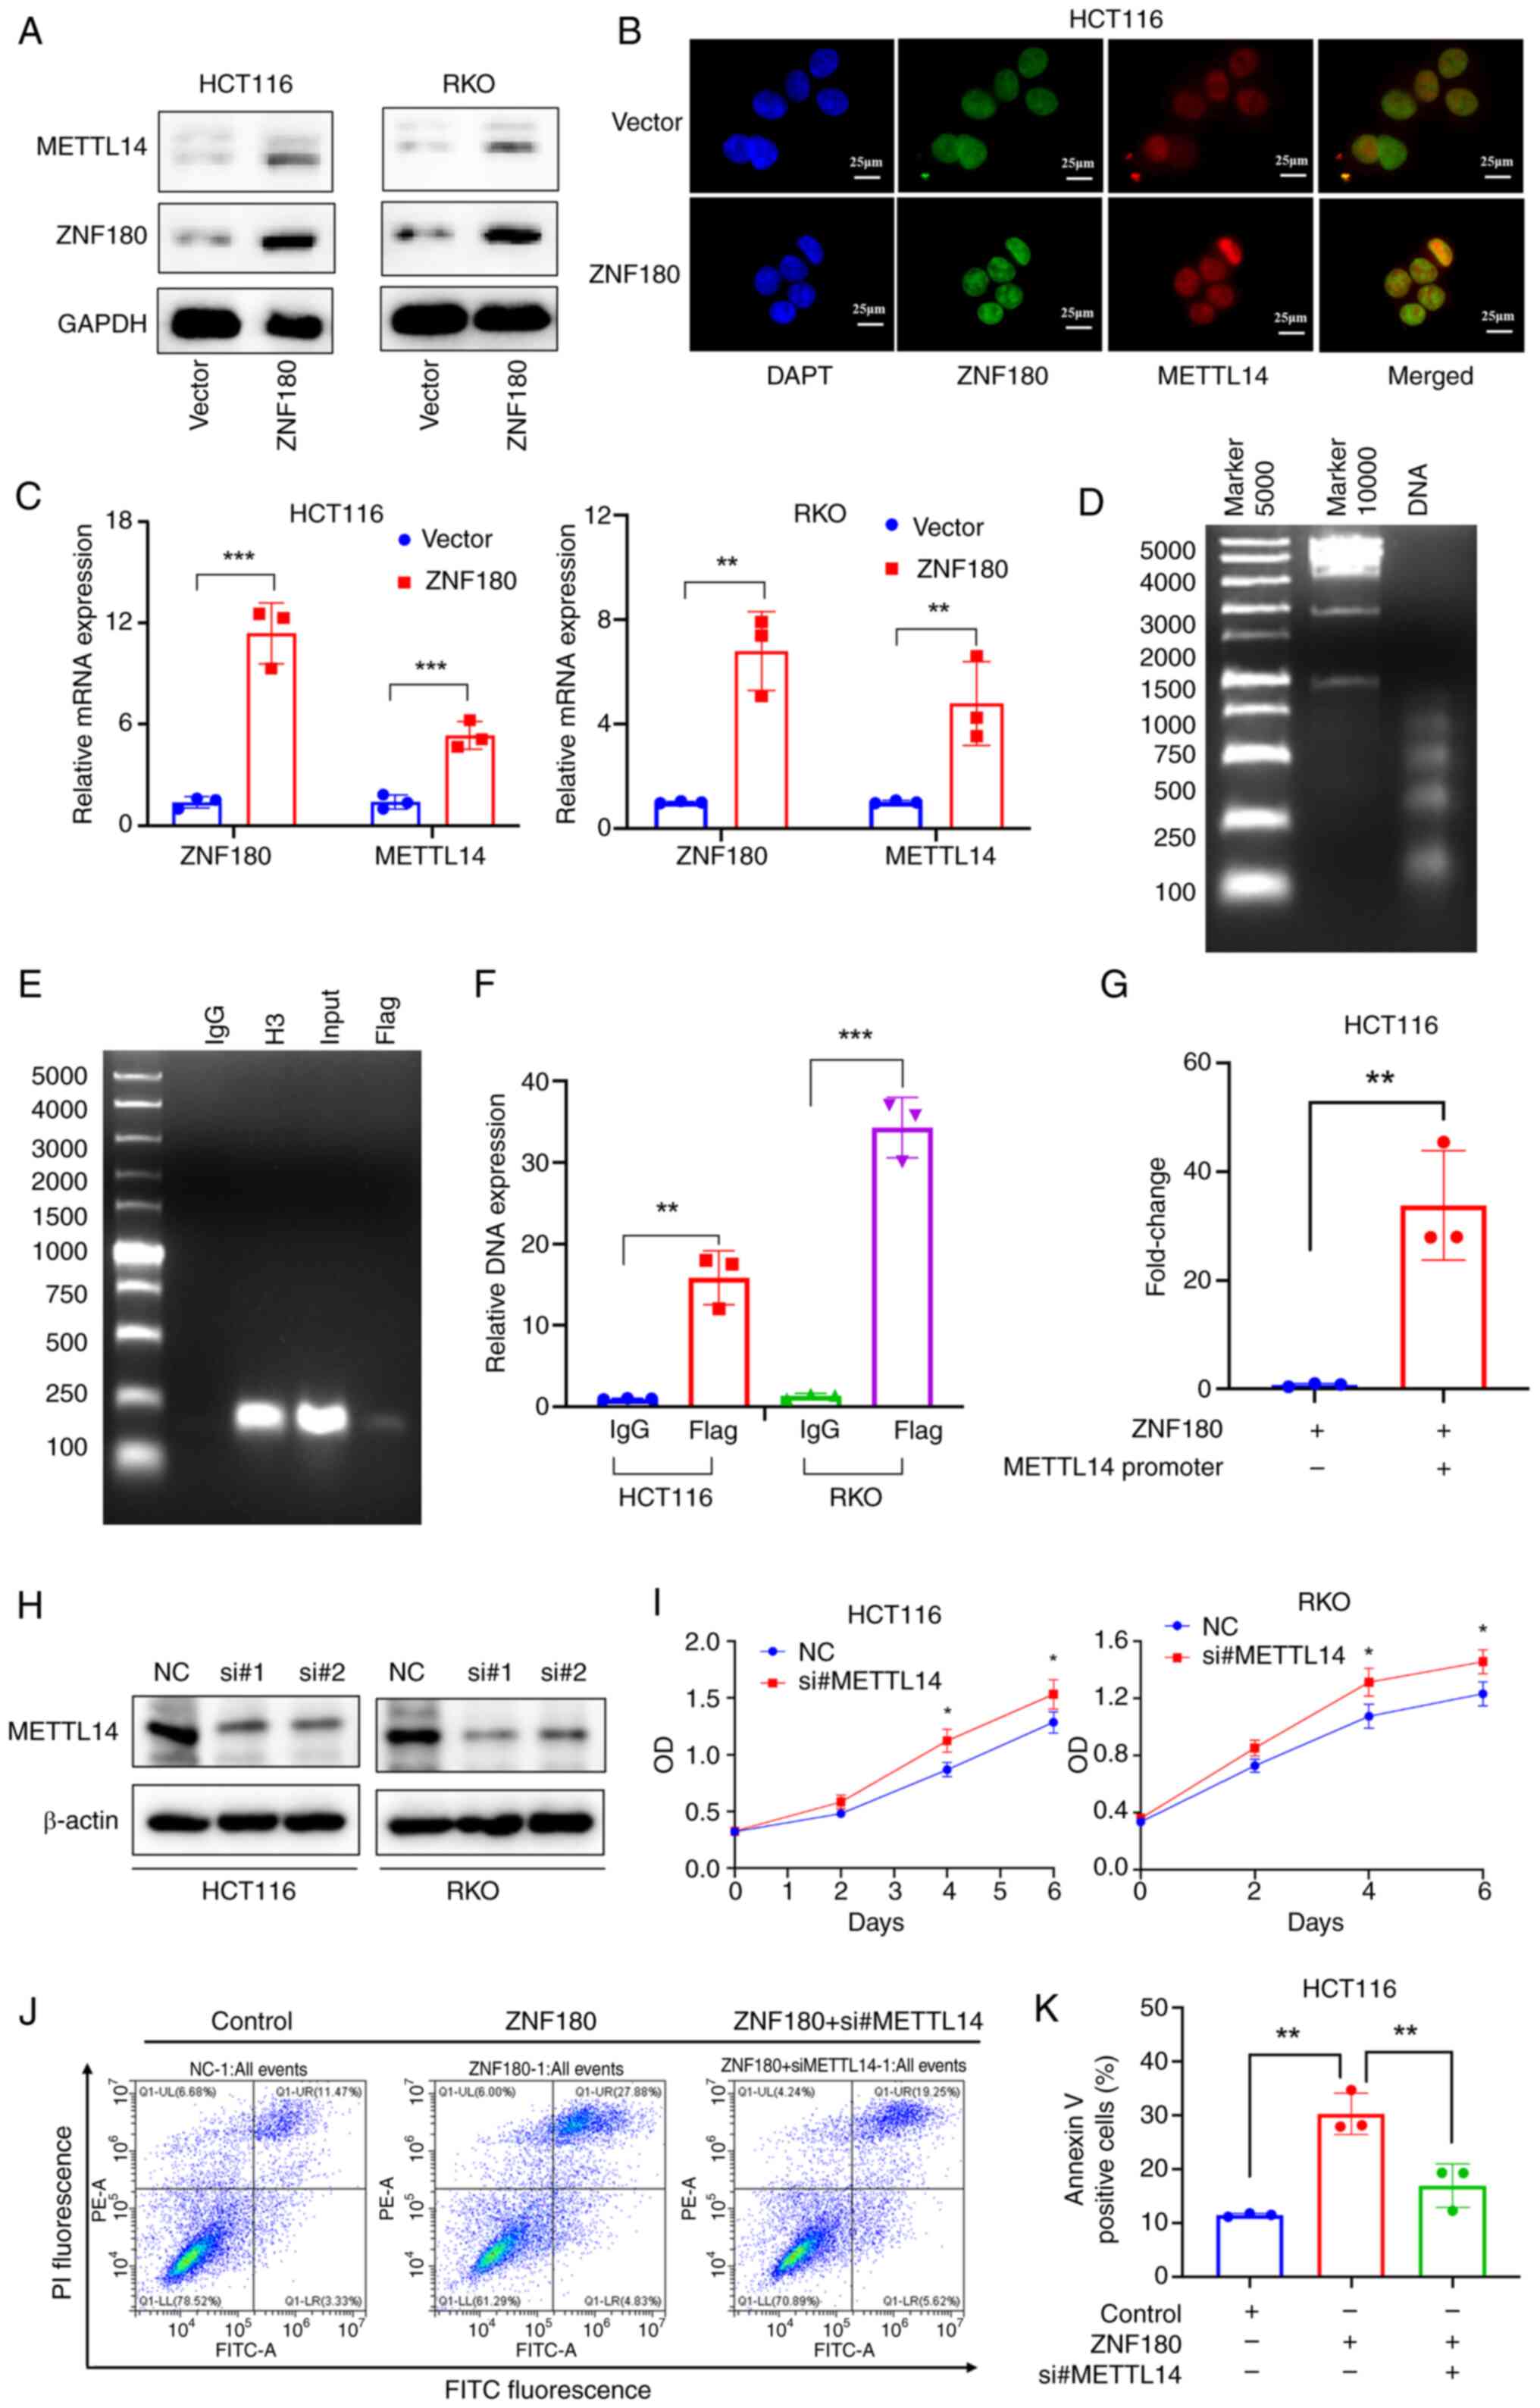 | Figure 7.METTL14 is a candidate downstream
molecule in ZNF180 signaling. (A) ZNF180 and METTL14 expression
were measured by western blotting. (B) Localization of ZNF180 and
METTL14 in HCT116 cells by confocal immunofluorescence analysis.
(C) Overexpression of ZNF180 in HCT116 and RKO cells; ZNF180 and
METTL14 mRNA expression levels were detected by RT-qPCR. P-values
were calculated using unpaired Student's t-test, **P<0.01,
***P<0.001. (D) Agarose gel electrophoresis showed that DNA was
digested into 100–750 bp. (E) Cells stably transfected with vector
or flag-ZNF180 were analyzed by ChIP, and METTL14 DNA was
qualitatively analyzed using DNA agarose gel electrophoresis. IgG
refers to normal rabbit IgG (negative control) and H3 refers to
histone H3 (positive control). (F) METTL14 DNA element was
quantified by RT-qPCR. P-values were calculated using unpaired
Student's t-test, **P<0.01, ***P<0.001. (G)
METTL14-luciferase activity in 293T cells overexpressing ZNF180.
P-values were calculated using unpaired Student's t-test,
**P<0.01. (H) Protein expression levels of METTL14 were
determined by immunoblotting. (I) Cell proliferation was determined
using the MTS assay. P-values were calculated using unpaired
Student's t-test, *P<0.05 vs. NC. (J) Cells were double-stained
with PI and Annexin V, and analyzed by flow cytometry to evaluate
apoptosis. (K) Quantification of the percentage of apoptotic cells.
P-values were calculated using one-way ANOVA (parametric) test and
Scheffe test, **P<0.01. METTL14, methyltransferase 14,
N6-adenosine-methyltransferase non-catalytic subunit; NC, negative
control; OD, optical density; RT-qPCR, reverse
transcription-quantitative PCR; si, small interfering; ZNF180, zinc
finger protein 180. |
Discussion
CRC is a disorder caused by the progressive
accumulation of genetic and epigenetic alterations that may promote
dysplasia and tumorigenesis (37,38).
The popularity of next-generation sequencing has facilitated the
production of large amounts of data for the construction of
multi-gene profiles, which can help stratify risk and guide
chemotherapy for various types of cancer (39–41).
Artificial intelligence and bioinformatics can uncover
differentially expressed and survival-associated genes with
potential prognostic and treatment-related properties. Therefore,
investigating the dysregulated genes involved in carcinogenesis and
disease development may improve the prognosis and treatment of
patients with CRC.
Gene expression is regulated by a combination of
numerous cis-regulatory elements, including core promoters
and promoter-proximal elements, as well as various
cis-regulatory modules located distant from the
transcription start sites, such as enhancers (42,43),
silencers (44–46), insulators (47) and tethering elements (48,49).
Among these elements, enhancers and their associated transcription
factors serve a leading role in the initiation of gene expression.
The identification of enhancer and promoter positions has been the
focus of several studies (50,51).
The present study performed transcriptome analysis
and obtained relevant clinicopathological data from 606 and 505
patients with CRC from TCGA and GSE39582 cohorts, respectively. A
novel prognostic model was generated based on a gene expression
signature classifier to predict the OS of patients with CRC. LASSO
regression analysis was used to construct the optimal model, which
included 15 genes (GSTM1, PCDHB2, DAPK1, TTC12, EXOC3L4, CCL22,
TERF2IP, TLE6, NUMBL, ZNF180, LINC00261, ERFE, CDCA2, LINC00638 and
GPRASP1), and developed a prognostic model that stratified patients
into low- and high-risk groups. This model was validated in TCGA
and GSE39582 cohorts. Transcription factors are potential
regulatory genes and mediators of tumor progression, and the
functions and mechanisms of ZNF180 in CRC are poorly understood.
Thus, ZNF180 was selected for further functional and downstream
target exploration, aiming to elucidate its clinical
characteristics and prognostic value in CRC.
The present study first demonstrated that the
expression of ZNF180 was regulated by methylation. Moreover, it was
determined that ZNF180 was a prognostic protective factor for CRC
based on gene expression data. To examine the role of ZNF180 in CRC
progression, ZNF180-overexpressing HCT116 and RKO stable cell lines
were established. The functional assays revealed that elevated
ZNF180 expression suppressed cell proliferation, induced a higher
rate of apoptosis, and enhanced cell chemotherapeutic sensitivity
by treatment with 5-FU compared with a vector. Taken together,
these data revealed the critical role of ZNF180 in inhibiting
proliferation and inducing apoptosis.
ZNF180 is a member of the ZNF family of
transcription factors (52).
Transcription factors serve vital roles in regulating
tumorigenesis, and individual transcription factors may have
different or even opposite functions among various cancer types
(36,53). Thus, a suitable tool was necessary
to elucidate the role of ZNF180 in the tumorigenesis of CRC. Based
on the ChIP assay and clinical correlation analysis, the present
study identified METTL14, which is a major RNA N6-adenosine
methyltransferase, as a candidate downstream target of ZNF180.
Subsequently, the present study focused on METTL14
for further analysis, and it was revealed to be located in the
nucleoplasm. Its principal function is to enable mRNA binding
activity, and it contributes to mRNA
(2′-O-methyladenosine-N6-)-methyltransferase activity (54,55).
It is also involved in the mRNA metabolic process, and regulation
of hematopoietic progenitor cell differentiation and positive
regulation of translation (19,56).
To identify the potential target genes of ZNF180 in CRC, 478 genes
significantly co-expressed with ZNF180 were selected by overlapping
three different cohorts. In the correlation analysis, the
correlation coefficient between METTL14 and ZNF180 was ranked in
the top 10. By conducting a series of experiments, a positive
correlation was identified between ZNF180 and METTL14 expression at
the mRNA and protein levels, and ZNF180 overexpression was shown to
increase METTL14 expression in CRC cell lines. Further
investigation suggested that METTL14 was a potential downstream
target gene of ZNF180 in CRC and may be a prognostic protective
factor in CRC. Previous research has shown that METTL14 expression
in primary CRC may be an independent favorable prognostic factor
for OS in patients (35). Moreover,
the evidence showed that METTL14 suppresses proliferation in CRC.
This finding is consistent with the data obtained for ZNF180
signaling in the present study. METTL14 is a key protein in the
m6A pathway, and its role in CRC has been reported by
Chen et al (18); METTL14
has been shown to inhibit CRC cell migration, invasion and
metastasis, and to epigenetically inhibit the expression of SOX4
via an m6A-YTHDF2-dependent mechanism in CRC. METTL14
has also been demonstrated to participate in promoting
cardiovascular endothelial cell proliferation and invasion
(17).
To the best of our knowledge, the present study is
the first to evaluate the critical roles of ZNF180 in inhibiting
CRC proliferation and inducing apoptosis. The results demonstrated
that ZNF180 may have a crucial role in CRC tumorigenesis, and that
ZNF180 is regulated by methylation. In addition, ZNF180 and METTL14
genes were identified as prognostic protective factors in CRC.
Moreover, a close relationship between ZNF180 and METTL14
expression was revealed in cell lines, tissues and different
cohorts. The present findings confirmed that ZNF180 is a tumor
suppressor gene that may directly bind to the upstream region of
METTL14 and activate its expression in CRC cells.
In summary, the findings of the present study
reveal a fundamental relationship between ZNF180 and METTL14.
ZNF180 was shown to be downregulated by methylation, and to
upregulate METTL14 by binding directly to METTL14 DNA elements,
thereby inhibiting cell proliferation and inducing apoptosis. The
present results suggested that ZNF180 directly interacts with and
activates METTL14 transcriptional activity and positively regulates
its expression. The ZNF180/METTL14 axis may be a prognostic
biomarker and effective therapeutic target for CRC.
Supplementary Material
Supporting Data
Supporting Data
Acknowledgements
The authors would like to thank Mr. Minzhi Qiu for
his contributions to the adjustment of the figures.
Funding
This work was supported by grants from the National Key R&D
Program of China (grant no. 2022YFA1304000), the National Natural
Youth Science Foundation of China (grant no. 32000555), the
Guangzhou Basic and Applied Basic Research Project (grant no.
SL2022A04J01659), the program of Guangdong Provincial Clinical
Research Center for Digestive Diseases (grant no. 2020B1111170004)
and the National Key Clinical Discipline.
Availability of data and materials
The data generated in the present study may be
requested from the corresponding author.
Authors' contributions
QY and LX wrote the original draft. YH, PL, LSZ,
LX, XJC, HLL, XTL, JPX, WTS, JLH, ZTC, XLT, HJL and XHF wrote,
reviewed and edited the manuscript. YH, PL, QY, LX, LSZ, JPX, and
XJC performed the conceptualization. XJC, HLL, XTL, XLT, HJL, and
ZTC performed the data analysis. LX, XTL, XHF and JLH performed the
formal analysis. YH, PL, QY, LSZ and LX provided the funding. YH,
QY, LX, HLL and WTS designed the methodology, created the animal
models and performed some experiments. XTL and JLH performed the
project administration. LSZ, LX, XJC, XLT, XTL and JPX provided
study materials and reagents. PL, QY and LSZ performed the
supervision. LX and HJL performed the validation. HLL and JPX
generated the figures. LX and YH confirm the authenticity of all
the raw data. All authors read and approved the final version of
the manuscript.
Ethics approval and consent to
participate
The present study involving human samples was
approved by the Institutional Review Board of SYSU6 (approval no.
2021ZSLYEC-228), and all patients provided written informed consent
for their tissues to be used in medical research. The animal
experiment was approved by the Investigation Ethical Committee of
The Sixth Affiliated Hospital of Sun Yat-sen University (approval
no. IACUC-2023101301).
Patient consent for publication
Not applicable.
Competing interests
The authors declare that they have no competing
interests.
References
|
1
|
Siegel RL, Miller KD, Fuchs HE and Jemal
A: Cancer Statistics, 2021. CA Cancer J Clin. 71:7–33. 2021.
View Article : Google Scholar
|
|
2
|
Siegel RL, Wagle NS, Cercek A, Smith RA
and Jemal A: Colorectal cancer statistics, 2023. CA Cancer J Clin.
73:233–254. 2023. View Article : Google Scholar
|
|
3
|
Roth AD, Tejpar S, Delorenzi M, Yan P,
Fiocca R, Klingbiel D, Dietrich D, Biesmans B, Bodoky G, Barone C,
et al: Prognostic role of KRAS and BRAF in stage II and III
resected colon cancer: Results of the translational study on the
PETACC-3, EORTC 40993, SAKK 60–00 trial. J Clin Oncol. 28:466–474.
2010. View Article : Google Scholar
|
|
4
|
Xu RH, Muro K, Morita S, Iwasa S, Han SW,
Wang W, Kotaka M, Nakamura M, Ahn JB, Deng YH, et al: Modified
XELIRI (capecitabine plus irinotecan) versus FOLFIRI (leucovorin,
fluorouracil, and irinotecan), both either with or without
bevacizumab, as second-line therapy for metastatic colorectal
cancer (AXEPT): A multicentre, open-label, randomised,
non-inferiority, phase 3 trial. Lancet Oncol. 19:660–671. 2018.
View Article : Google Scholar
|
|
5
|
Xie Y, Shi L, He X and Luo Y:
Gastrointestinal cancers in China, the USA, and Europe.
Gastroenterol Rep (Oxf). 9:91–104. 2021. View Article : Google Scholar
|
|
6
|
Okada M, Wang CY, Hwang DW, Sakaguchi T,
Olson KE, Yoshikawa Y, Minamoto K, Mazer SP, Yan SF and Pinsky DJ:
Transcriptional control of cardiac allograft vasculopathy by early
growth response gene-1 (Egr-1). Circ Res. 91:135–142. 2002.
View Article : Google Scholar
|
|
7
|
Song WM, Agrawal P, Von Itter R,
Fontanals-Cirera B, Wang M, Zhou X, Mahal LK, Hernando E and Zhang
B: Network models of primary melanoma microenvironments identify
key melanoma regulators underlying prognosis. Nat Commun.
12:12142021. View Article : Google Scholar
|
|
8
|
Klutstein M, Nejman D, Greenfield R and
Cedar H: DNA methylation in cancer and aging. Cancer Res.
76:3446–3450. 2016. View Article : Google Scholar
|
|
9
|
El Helou R, Wicinski J, Guille A, Adélaïde
J, Finetti P, Bertucci F, Chaffanet M, Birnbaum D, Charafe-Jauffret
E and Ginestier C: Brief reports: A distinct DNA methylation
signature defines breast cancer stem cells and predicts cancer
outcome. Stem Cells. 32:3031–3036. 2014. View Article : Google Scholar
|
|
10
|
Subramaniam D, Thombre R, Dhar A and Anant
S: DNA methyltransferases: A novel target for prevention and
therapy. Front Oncol. 4:802014. View Article : Google Scholar
|
|
11
|
Baylin SB and Jones PA: A decade of
exploring the cancer epigenome-biological and translational
implications. Nat Rev Cancer. 11:726–734. 2011. View Article : Google Scholar
|
|
12
|
Baylin SB and Jones PA: Epigenetic
determinants of cancer. Cold Spring Harb Perspect Biol.
8:a0195052016. View Article : Google Scholar
|
|
13
|
Kok-Sin T, Mokhtar NM, Ali Hassan NZ,
Sagap I, Mohamed Rose I, Harun R and Jamal R and Jamal R:
Identification of diagnostic markers in colorectal cancer via
integrative epigenomics and genomics data. Oncol Rep. 34:22–32.
2015. View Article : Google Scholar
|
|
14
|
Church TR, Wandell M, Lofton-Day C, Mongin
SJ, Burger M, Payne SR, Castaños-Vélez E, Blumenstein BA, Rösch T,
Osborn N, et al: Prospective evaluation of methylated SEPT9 in
plasma for detection of asymptomatic colorectal cancer. Gut.
63:317–325. 2014. View Article : Google Scholar
|
|
15
|
Chen WD, Han ZJ, Skoletsky J, Olson J, Sah
J, Myeroff L, Platzer P, Lu S, Dawson D, Willis J, et al: Detection
in fecal DNA of colon cancer-specific methylation of the
nonexpressed vimentin gene. J Natl Cancer Inst. 97:1124–1132. 2005.
View Article : Google Scholar
|
|
16
|
Chen XY, Zhang J and Zhu JS: The role of
m6A RNA methylation in human cancer. Mol Cancer. 18:1032019.
View Article : Google Scholar
|
|
17
|
Zhang BY, Han L, Tang YF, Zhang GX, Fan
XL, Zhang JJ, Xue Q and Xu ZY: METTL14 regulates M6A
methylation-modified primary miR-19a to promote cardiovascular
endothelial cell proliferation and invasion. Eur Rev Med Pharmacol
Sci. 24:7015–7023. 2020.
|
|
18
|
Chen X, Xu M, Xu X, Zeng K, Liu X, Pan B,
Li C, Sun L, Qin J, Xu T, et al: METTL14-mediated
N6-methyladenosine modification of SOX4 mRNA inhibits tumor
metastasis in colorectal cancer. Mol Cancer. 19:1062020. View Article : Google Scholar
|
|
19
|
Gu C, Wang Z, Zhou N, Li G, Kou Y, Luo Y,
Wang Y, Yang J and Tian F: Mettl14 inhibits bladder TIC
self-renewal and bladder tumorigenesis through N6-methyladenosine
of Notch1. Mol Cancer. 18:1682019. View Article : Google Scholar
|
|
20
|
Gong PJ, Shao YC, Yang Y, Song WJ, He X,
Zeng YF, Huang SR, Wei L and Zhang JW: Analysis of
N6-Methyladenosine methyltransferase reveals METTL14 and ZC3H13 as
tumor suppressor genes in breast cancer. Front Oncol.
10:5789632020. View Article : Google Scholar
|
|
21
|
Zhang X, Li D, Jia C, Cai H, Lv Z and Wu
B: METTL14 promotes tumorigenesis by regulating lncRNA
OIP5-AS1/miR-98/ADAMTS8 signaling in papillary thyroid cancer. Cell
Death Dis. 12:6172021. View Article : Google Scholar
|
|
22
|
Wang M, Liu J, Zhao Y, He R, Xu X, Guo X,
Li X, Xu S, Miao J, Guo J, et al: Upregulation of METTL14 mediates
the elevation of PERP mRNA N6 adenosine methylation
promoting the growth and metastasis of pancreatic cancer. Mol
Cancer. 19:1302020. View Article : Google Scholar
|
|
23
|
Weng H, Huang H, Wu H, Qin X, Zhao BS,
Dong L, Shi H, Skibbe J, Shen C, Hu C, et al: METTL14 inhibits
hematopoietic stem/progenitor differentiation and promotes
leukemogenesis via mRNA m6A modification. Cell Stem
Cell. 22:191–205.e9. 2018. View Article : Google Scholar
|
|
24
|
Xu L, Hu H, Zheng LS, Wang MY, Mei Y, Peng
LX, Qiang YY, Li CZ, Meng DF, Wang MD, et al: ETV4 is a theranostic
target in clear cell renal cell carcinoma that promotes metastasis
by activating the pro-metastatic gene FOSL1 in a PI3K-AKT dependent
manner. Cancer Lett. 482:74–89. 2020. View Article : Google Scholar
|
|
25
|
Bao YN, Cao X, Luo DH, Sun R, Peng LX,
Wang L, Yan YP, Zheng LS, Xie P, Cao Y, et al: Urokinase-type
plasminogen activator receptor signaling is critical in
nasopharyngeal carcinoma cell growth and metastasis. Cell Cycle.
13:1958–1969. 2014. View Article : Google Scholar
|
|
26
|
Li G, Su Q, Liu H, Wang D, Zhang W, Lu Z,
Chen Y, Huang X, Li W, Zhang C, et al: Frizzled7 promotes
epithelial-to-mesenchymal transition and stemness via activating
canonical Wnt/beta-catenin pathway in gastric cancer. Int J Biol
Sci. 14:280–293. 2018. View Article : Google Scholar
|
|
27
|
Livak KJ and Schmittgen TD: Analysis of
relative gene expression data using real-time quantitative PCR and
the 2(−Delta Delta C(T)) method. Methods. 25:402–408. 2001.
View Article : Google Scholar
|
|
28
|
Marisa L, de Reynies A, Duval A, Selves J,
Gaub MP, Vescovo L, Etienne-Grimaldi MC, Schiappa R, Guenot D,
Ayadi M, et al: Gene expression classification of colon cancer into
molecular subtypes: Characterization, validation, and prognostic
value. PLoS Med. 10:e10014532013. View Article : Google Scholar
|
|
29
|
Hu Y, Gaedcke J, Emons G, Beissbarth T,
Grade M, Jo P, Yeager M, Chanock SJ, Wolff H, Camps J, et al:
Colorectal cancer susceptibility loci as predictive markers of
rectal cancer prognosis after surgery. Genes Chromosomes Cancer.
57:140–149. 2018. View Article : Google Scholar
|
|
30
|
Raap M, Gierendt L, Kreipe HH and
Christgen M: Transcription factor AP-2beta in development,
differentiation and tumorigenesis. Int J Cancer. 149:1221–1227.
2021. View Article : Google Scholar
|
|
31
|
Liu J, Liu Z, Li M, Tang W, Pratap UP, Luo
Y, Altwegg KA, Li X, Zou Y, Zhu H, et al: Interaction of
transcription factor AP-2 gamma with proto-oncogene PELP1 promotes
tumorigenesis by enhancing RET signaling. Mol Oncol. 15:1146–1161.
2021. View Article : Google Scholar
|
|
32
|
Moore LD, Le T and Fan G: DNA methylation
and its basic function. Neuropsychopharmacology. 38:23–38. 2013.
View Article : Google Scholar
|
|
33
|
Krebs AR: Studying transcription factor
function in the genome at molecular resolution. Trends Genet.
37:798–806. 2021. View Article : Google Scholar
|
|
34
|
Xu L, Huang TJ, Hu H, Wang MY, Shi SM,
Yang Q, Lin F, Qiang YY, Mei Y, Lang YH, et al: The developmental
transcription factor IRF6 attenuates ABCG2 gene expression and
distinctively reverses stemness phenotype in nasopharyngeal
carcinoma. Cancer Lett. 431:230–243. 2018. View Article : Google Scholar
|
|
35
|
Yang X, Zhang S, He C, Xue P, Zhang L, He
Z, Zang L, Feng B, Sun J and Zheng M: METTL14 suppresses
proliferation and metastasis of colorectal cancer by
down-regulating oncogenic long non-coding RNA XIST. Mol Cancer.
19:462020. View Article : Google Scholar
|
|
36
|
Bhoumik A and Ronai Z: ATF2: A
transcription factor that elicits oncogenic or tumor suppressor
activities. Cell Cycle. 7:2341–2345. 2008. View Article : Google Scholar
|
|
37
|
Yang J, Lin Y, Huang Y, Jin J, Zou S,
Zhang X, Li H, Feng T, Chen J, Zuo Z, et al: Genome landscapes of
rectal cancer before and after preoperative chemoradiotherapy.
Theranostics. 9:6856–6866. 2019. View Article : Google Scholar
|
|
38
|
Bolli N, Avet-Loiseau H, Wedge DC, Van Loo
P, Alexandrov LB, Martincorena I, Dawson KJ, Iorio F, Nik-Zainal S,
Bignell GR, et al: Heterogeneity of genomic evolution and
mutational profiles in multiple myeloma. Nat Commun. 5:29972014.
View Article : Google Scholar
|
|
39
|
Corcoran RB, Andre T, Atreya CE, Schellens
JHM, Yoshino T, Bendell JC, Hollebecque A, McRee AJ, Siena S,
Middleton G, et al: Combined BRAF, EGFR, and MEK inhibition in
patients with BRAFV600E-Mutant colorectal cancer. Cancer Discov.
8:428–443. 2018. View Article : Google Scholar
|
|
40
|
Xu L, Lin Y, Chen X, Zheng L, Cheng Y, Hu
J, Zheng B, Zhang B, Li G, Chi Z, et al: A mutational signature for
colorectal cancer prognosis prediction: Associated with immune cell
infiltration. Clin Transl Med. 11:e4142021. View Article : Google Scholar
|
|
41
|
Kim AS, Bartley AN, Bridge JA, Kamel-Reid
S, Lazar AJ, Lindeman NI, Long TA, Merker JD, Rai AJ, Rimm DL, et
al: Comparison of laboratory-developed tests and FDA-approved
assays for BRAF, EGFR, and KRAS testing. JAMA Oncol. 4:838–841.
2018. View Article : Google Scholar
|
|
42
|
Levine M: Transcriptional enhancers in
animal development and evolution. Curr Biol. 20:R754–R763. 2010.
View Article : Google Scholar
|
|
43
|
Bulger M and Groudine M: Functional and
mechanistic diversity of distal transcription enhancers. Cell.
144:327–339. 2011. View Article : Google Scholar
|
|
44
|
Petrykowska HM, Vockley CM and Elnitski L:
Detection and characterization of silencers and enhancer-blockers
in the greater CFTR locus. Genome Res. 18:1238–1246. 2008.
View Article : Google Scholar
|
|
45
|
Vokes SA, Ji H, Wong WH and McMahon AP: A
genome-scale analysis of the cis-regulatory circuitry underlying
sonic hedgehog-mediated patterning of the mammalian limb. Genes
Dev. 22:2651–2663. 2008. View Article : Google Scholar
|
|
46
|
Ayer S and Benyajati C: Conserved enhancer
and silencer elements responsible for differential Adh
transcription in Drosophila cell lines. Mol Cell Biol.
10:3512–3523. 1990. View Article : Google Scholar
|
|
47
|
Gaszner M and Felsenfeld G: Insulators:
exploiting transcriptional and epigenetic mechanisms. Nat Rev
Genet. 7:703–713. 2006. View Article : Google Scholar
|
|
48
|
Ohtsuki S, Levine M and Cai HN: Different
core promoters possess distinct regulatory activities in the
Drosophila embryo. Genes Dev. 12:547–556. 1998. View Article : Google Scholar
|
|
49
|
Calhoun VC, Stathopoulos A and Levine M:
Promoter-proximal tethering elements regulate enhancer-promoter
specificity in the Drosophila Antennapedia complex. Proc Natl Acad
Sci USA. 99:9243–9247. 2002. View Article : Google Scholar
|
|
50
|
Spitz F and Furlong EE: Transcription
factors: From enhancer binding to developmental control. Nat Rev
Genet. 13:613–626. 2012. View Article : Google Scholar
|
|
51
|
Field A and Adelman K: Evaluating enhancer
function and transcription. Annu Rev Biochem. 89:213–234. 2020.
View Article : Google Scholar
|
|
52
|
Shannon M, Hamilton AT, Gordon L,
Branscomb E and Stubbs L: Differential expansion of zinc-finger
transcription factor loci in homologous human and mouse gene
clusters. Genome Res. 13:1097–1110. 2003. View Article : Google Scholar
|
|
53
|
Yang L, Han Y, Suarez Saiz F and Minden
MD: A tumor suppressor and oncogene: The WT1 story. Leukemia.
21:868–876. 2007. View Article : Google Scholar
|
|
54
|
Das Mandal S and Ray PS:
Transcriptome-wide analysis reveals spatial correlation between
N6-methyladenosine and binding sites of microRNAs and RNA-binding
proteins. Genomics. 113:205–216. 2021. View Article : Google Scholar
|
|
55
|
Li B, Wang X, Li Z, Lu C, Zhang Q, Chang
L, Li W, Cheng T, Xia Q and Zhao P: Transcriptome-wide analysis of
N6-methyladenosine uncovers its regulatory role in gene expression
in the lepidopteran Bombyx mori. Insect Mol Biol. 28:703–715. 2019.
View Article : Google Scholar
|
|
56
|
Zhou H, Yin K, Zhang Y, Tian J and Wang S:
The RNA m6A writer METTL14 in cancers: Roles, structures, and
applications. Biochim Biophys Acta Rev Cancer. 1876:1886092021.
View Article : Google Scholar
|