Introduction
Global statistics indicate that cancer has become
the primary cause of death, posing a significant threat to human
health (1). Despite advancements in
cancer treatment modalities, including surgery, chemotherapy,
targeted therapy and immunotherapy, which have notably improved
patient survival rates, individuals with advanced lung cancer
continue to face poor overall survival (OS) rates (2). Consequently, there is a need to
explore more effective strategies for the prevention, early
detection and treatment of cancer. Additionally, understanding the
pathophysiological processes that initiate and drive cancer
progression is crucial, offering both theoretical insights and
practical applications.
The inner mitochondrial membrane of eukaryotic cells
houses a class of transmembrane proteins referred to as
sideroflexins (SFXNs), which were previously presumed to function
solely as iron-utilizing metabolite transporters with limited known
molecular roles (3,4). Serine, rich in one-carbon units,
serves a pivotal role in supplying the one-carbon units essential
for anabolic processes in dividing human cells (5,6).
Mitochondrial serine metabolism predominantly fulfills this
requirement, with cytosolic serine-driven one-carbon metabolism
providing supplementary support when required (7). Among the SFXN family, SFXN1 has
emerged as a key player in one-carbon metabolism and mitochondrial
iron homeostasis, exerting effects on cellular proliferation,
development and other vital biological processes (8–11).
Emerging evidence suggests a robust association between SFXN1 and
various malignancies, including lung cancer and glioma (12,13).
Given that SFXN1 functions as an iron regulatory protein, its
dysregulated expression may serve a role in the process of
carcinogenesis (12). It has been
hypothesized that SFXN1 expression on the mitochondrial membrane
triggers the generation of reactive oxygen species (ROS) and iron
accumulation, leading to ferroptosis in cancerous cells and
potential organ damage (14).
During ferroptosis, iron overload and lipid peroxidation act as
central mediators, instigating oxidative damage to cellular
membranes, a process critical to the execution of this
non-apoptotic form of cell death (15).
The present study utilized publicly accessible
databases to examine SFXN1 expression profiles in tumor tissues,
investigating its prognostic significance in patients with cancer.
The present study further delved into SFXN1 mutation patterns and
the landscape of immune infiltration. These comprehensive analyses
were undertaken with the overarching goal of providing a refreshed
theoretical foundation to elucidate the fundamental mechanisms
governing tumorigenesis. Simultaneously, the present study aimed to
pinpoint innovative diagnostic and prognostic biomarkers for
malignancies, thereby contributing to the advancement of
personalized cancer care and management.
Materials and methods
SFXN1 expression in human tissues and
pan-cancer
The Human Protein Atlas (HPA; http://www.proteinatlas.org/) (16) was used to examine SFXN1 expression
in various human tissues and organs at the mRNA and protein levels
utilizing transcriptomics and proteomics methods. For statistical
analysis and visualization of SFXN1 expression in cancer,
RNA-sequencing (RNA-seq) data were obtained from the ALL
(pan-cancer) project in The Cancer Genome Atlas (TCGA; http://portal.gdc.cancer.gov/) (17). The data were processed using the
log2 function and the R ggplot2 package (version 4.3.1;
2023-06-16; The Comprehensive R Archive Network) was utilized. The
Tumor Immune Estimation Resource (TIMER; http://cistrome.shinyapps.io/timer/) (18) was employed to validate SFXN1
expression in various cancer types compared with that in normal
tissues. Gene Expression Omnibus (GEO) is a public repository
maintained by the National Center for Biotechnology Information for
high-throughput gene expression data, including microarray and
RNA-Seq data (https://www.ncbi.nlm.nih.gov/gds/). The GSE22820
(19), GSE44861 (20), GSE75241 (21), GSE107591 (22), GSE84784 (23), GSE32863 (24), GSE16515 (25) and GSE27342 (26) datasets were used to verify SFXN1
expression.
Tissue microarrays (TMAs)
Human pan-cancerous TMAs (ZL-MTU122) were provided
by Shanghai Zhuoli Biotech Company Co., Ltd. Tissues were fixed in
10% neutral buffered formalin at room temperature for 24 h,
embedded in optimal cutting temperature compound and stored at
−80°C. Sections were cut at 4-µm thickness, incubated with 3%
hydrogen peroxide (H2O2) in methanol for
10–15 min at room temperature, and then washed with 1X PBS to
remove residual H2O2, to block endogenous
peroxidase activity. Sections were permeabilized with 0.3% Triton-X
100, and blocked with 1X TBS containing 0.3% Triton-X 100 and 5%
goat serum (BL210A; Biosharp Life Sciences) at room temperature for
30 min. Sections were incubated with a primary antibody against
SFXN1 (1:100; ab127751; Abcam) at 4°C overnight. The goat
anti-rabbit HRP-conjugated antibody (ASR1038; Abcepta) was diluted
at 1:200, and applied as the secondary antibody at room temperature
for 60 min. Sections were then incubated with 3,
3′-diaminobenzidine solution for 5–10 min at room temperature until
the desired color intensity was achieved. Sections were washed with
1X PBS to terminate the reaction. Detection was performed using a
light microscope equipped with the VIS DIA VisioMorph system
(Visiopamm®; Visiopharm A/S). The location of each tumor
type is shown in Table SI.
Pan-cancer SFXN1 protein levels were explored using data from the
Clinical Proteomic Tumor Analysis Consortium (https://ualcan.path.uab.edu/analysis-prot.html) from
the University of Alabama at Birmingham Cancer Data Analysis Portal
(UALCAN; http://ualcan.path.uab.edu/cgi–bin/ualcan–res.pl)
(27,28).
Association between SFXN1 expression
and tumor clinicopathologic features and prognosis
RNA-seq data and clinical data (T stage, N stage and
clinicopathological stage) were downloaded from TCGA, and normal
samples and samples without clinical information were excluded. The
stats package (version 4.2.1; 2022-06-23; The Comprehensive R
Archive Network) was used to perform various statistical analyses,
the car package (version 3.1.0; 2023-06-16; The Comprehensive R
Archive Network) was used for processing and enhancing the
statistical analyses of regression modeling and the related
diagnostics, and the ggplot2 package (version 4.3.1; 2023-06-16;
The Comprehensive R Archive Network) was used for visualization of
the results, enhancing the interpretability and presentation of the
findings. Kaplan-Meier plotter (https://kmplot.com/) (29) integrates chip data from GEO, TCGA
and other databases to provide prognostic information for a variety
of cancer types. The present study explored the association between
SFXN1 expression and prognosis [OS and disease-free survival (DFS)]
in breast invasive carcinoma (BRCA), esophageal carcinoma (ESCA),
head and neck squamous cell carcinoma (HNSC), kidney renal clear
cell carcinoma (KIRC), liver hepatocellular carcinoma (LIHC), lung
adenocarcinoma (LUAD), thyroid carcinoma (THCA), uterine corpus
endometrial carcinoma (UCEC) and testicular germ cell tumors
(TGCT). The cut-off value selected for dichotomizing the gene
expression levels is typically chosen based on the median
expression level of the gene in the dataset, which was also
selected in the present study. The Gene Expression Profiling
Interactive Analysis 2 (GEPIA2; http://gepia2.cancer-pku.cn/#index) (30) database is a public database that can
analyze RNA-seq expression data from a total of 9,736 tumor samples
and 8,587 normal samples from TCGA and Genotype-Tissue Expression
projects. GEPIA2.0 was used to determine the association between
SFXN1 expression and OS and DFS in pan-cancer.
Receiver operating characteristic
(ROC) curve analysis
The R program pROC (version 1.18.0) (https://www.rdocumentation.org/packages/pROC/versions/1.18.0)
was used to analyze the RNA-seq data in TCGA to draw the ROC curve.
ggplot2 was used for visualization.
SFXN1 mutation analysis
The Memorial Sloan Kettering Cancer Center has
created cBioPortal (http://www.cbioportal.org/) (31), a comprehensive open and
multifunctional data mining, integration and visualization platform
built on TCGA. The present study investigated the alteration
frequency, mutation type, mutated site details and copy number
alterations of SFXN1 in pan-cancer using cBioPortal.
The tumor mutation burden (TMB) is defined as the
total number of base mutations per million tumor cells. It is
widely acknowledged that the TMB serves as an emerging biomarker
for predicting the efficacy of cancer immunotherapies (32–35). A
high TMB indicates a greater number of neoantigens, thereby
providing more opportunities for T cell recognition. Clinically,
the TMB is associated with an improved response to immune
checkpoint inhibitors (36).
Microsatellite instability (MSI) is caused by abnormal DNA mismatch
repair, resulting in gene replication errors and tumor development,
which is associated with tumor prognosis (37). The correlation of SFXN1 with TMB and
MSI was determined using Spearman analysis, while radar plots were
created using the fmsb package (version 0.7.5; http://minato.sip21c.org/msb/).
DNA methylation analysis of SFXN1 in
pan-cancer
DNA methylation is a common form of epigenetic
modification. The methylation levels of the SFXN1 promoter were
examined using UALCAN (https://ualcan.path.uab.edu/cgi-bin/ualcan-res.pl)
(27,28).
Association between pan-cancer immune
subtypes and SFXN1 expression
The TISIDB (http://cis.hku.hk/TISIDB/index.php) (24) database, comprising 4,176 records
from 2,530 papers and 988 genes associated with antitumor immunity,
is a database for tumor immunoassays. The statistical analysis of
the association between immunological subtypes and SFXN1 expression
was performed using TISIDB.
Association between SFXN1 and cancer
immunity
The RNA-seq data and clinical information for 33
tumor types were obtained from TCGA. For reliable immune score
evaluation, the immunedeconv package (version 2.0.3; http://github.com/omnideconv/immunedeconv), which
integrates six of the latest algorithms, including MCPCOUNTER,
QUANTISEQ and EPIC, was used. These algorithms have been
systematically benchmarked, and each algorithm has its own unique
performance and advantages.
RNA-seq expression (level 3) profiles and associated
clinical data of 33 tumor types were downloaded from TCGA. The
expression levels of eight immune checkpoint transcripts (SIGLEC15,
TIGIT, CD274, HAVCR2, PDCD1, CTLA4, LAG3 and PDCD1LG2) were
analyzed.
Single-cell sequencing
CancerSEA (http://biocc.hrbmu.edu.cn/CancerSEA/) (38) is a multi-functional website designed
to comprehensively explore 14 different functional states of cancer
cells at the single-cell level. SFXN1 expression and functional
states at the single-cell level were examined using CancerSEA. The
t-distributed stochastic neighbor embedding maps were drawn using
the CancerSEA website.
Screening of SFXN1-related genes in
pan-cancer
The top 200 SFXN1-related genes (Table SII) in pan-cancer were obtained
from TCGA using GEPIA2.0. The protein-protein interaction (PPI)
network of the related genes was constructed using Search Tool for
the Retrieval of Interacting Genes/Proteins (version 12.0;
http://cn.string-db.org), and visualized using
Cytoscape (version 3.9.1; http://cytoscape.org/) with the CytoHubba plugin to
identify the most important modules.
Gene ontology (GO) and kyoto
encyclopedia of genes and genomes (KEGG) enrichment analysis
The Database for Annotation, Visualization and
Integrated Discovery (DAVID) website (https://david.ncifcrf.gov/) is a health information
database with systematic biological function annotation information
for a large number of genes and proteins (39). The selected SFXN1-related genes were
analyzed by GO and KEGG enrichment analysis using DAVID to explore
the possible biological processes, cellular components, molecular
functions and pathways involved. The Chiplot (https://www.chiplot.online/#BioPlot) website was
used to visualize the enrichment analyses.
Gene set enrichment analysis (GSEA) of
SFXN1 in LUAD
LUAD RNA-seq data and clinical information were
downloaded from TCGA to extract the expression data of the
differentially expressed molecules. The DESeq2 package (version
1.40.1; http://bioconductor.org/packages/release/bioc/html/DESeq2.html)
was used to analyze the single gene differences (Table SIII). The dataset comes from the
MSigDB Collections database (https://www.gsea-msigdb.org/gsea/msigdb). The
clusterProfiler package (version 4.8.1; http://www.bioconductor.org/packages/release/bioc/html/clusterProfiler.html)
was utilized for GSEA.
Collection of human LUAD
specimens
A total of 35 pairs of LUAD and adjacent
non-cancerous tissues were collected from patients (22 male and 13
female patients) undergoing lung surgery at the Affiliated Hospital
of Jining Medical University (Jining, China) between November 2021
and November 2022. The patient age ranged between 50 and 75 years,
with a median age of 55 years. Prior to surgery, none of the
patients had a documented history of cancer, nor had they undergone
chemotherapy, radiotherapy or targeted therapies. Patients with a
Karnofsky Performance Status score (40) of 70 or higher, without significant
comorbidities such as uncontrolled hypertension, severe cardiac
disease or active infection, and without a history of autoimmune
diseases or immunosuppressive therapy within the past 6 months were
included in the study. Each patient signed an informed consent
form. The Ethics Committee of the Affiliated Hospital of Jining
Medical University (Jining, China) examined and approved the
present study (approval no. 2021-11-C009).
RNA extraction and reverse
transcription-quantitative PCR (RT-qPCR)
TRIzol reagent (Invitrogen; Thermo Fisher
Scientific, Inc.) was used to extract total cellular RNA of LUAD
tissues and cells. A commercial cDNA synthesis kit (SuperScript
First-Strand Synthesis System; Thermo Fisher Scientific, Inc.) was
utilized to generate cDNAs by reverse transcription according to
the manufacturer's instructions. The SYBR Green Assay Kit (Takara
Bio, Inc.) was used to detect the presence of mRNA. Using the
Biosystems ViiA7 Sequence Detection System (ViiA™ 7
Real-Time PCR System; Thermo Fisher Scientific, Inc.), RT-qPCR was
carried out at least three times. The qPCR thermocycling conditions
were as follows: Initial denaturation at 95°C for 30 sec; followed
by 40 cycles of denaturation at 95°C for 5 sec, annealing at 60°C
for 30 sec and extension at 72°C for 30 sec. SFXN1 expression was
normalized to GAPDH using the 2−ΔΔCq method (41). The primers were as follows: SFXN1
forward, 5′-AGGAATTGTTCCTCCTGGTCT-3′ and reverse,
5′-AGGAAACAGGGCACAACACA-3′; and GAPDH forward,
5′-TCTTTTGCGTCGCCAGCCGAG-3′ and reverse,
5′-TGACCAGGCGCCCAATACGAC-3′.
Western blot analysis
Protein was extracted from tissues and cells using
RIPA cleavage buffer (Abcam). A BCA assay was used for protein
determination and 20 µg protein was loaded per lane on a 10%
polyacrylamide gel with SDS and separated by electrophoresis. The
protein in the gel was transferred to a PVDF membrane
(Sigma-Aldrich; Merck KGaA). The membrane was blocked for 60 min
with 5% BSA (cat. no. 9048-46-8; Beijing Solarbio Science &
Technology Co., Ltd.) at room temperature, then incubated overnight
at 4°C with specific primary antibodies, including anti-SFXN1
(1:3,000 dilution; ab127751; Abcam) and anti-GAPDH (1:3,000
dilution; ab9485; Abcam) antibodies. The antibodies were removed
and the membrane was washed with TBS-0.1% Tween-20 three times.
Subsequently, the membrane was incubated with secondary antibodies
(anti-rabbit IgG, HRP-linked antibody; 1:5,000; cat. no.
SA-00001-2; Proteintech Group, Inc.) at room temperature for 1 h.
The protein bands were detected using the Clarity Western ECL
substrate kit (Bio-Rad Laboratories, Inc.) and visualized using a
Tanon 5200 imaging system (Tanon Science and Technology Co., Ltd.).
The intensity of the protein bands was semi-quantified using ImageJ
software (1.52a; National Institutes of Health) and the protein
expression levels were normalized to the respective GAPDH
bands.
Cell culture and transfection
Two lung cancer cell lines (A549 and Calu-1) were
purchased from The Cell Bank of Type Culture Collection of The
Chinese Academy of Sciences. All cells were cultured in RPMI 1640
(Thermo Fisher Scientific, Inc.) medium containing 10% FBS (Thermo
Fisher Scientific, Inc.) with 100 U/ml penicillin and 100 mg/ml
streptomycin (Thermo Fisher Scientific, Inc.), and incubated at
37°C with 5% CO2 in an incubator. Small interfering RNA
(siRNA/si-) targeting SFXN1 (si-SFXN1) and its corresponding
negative control (si-NC) were synthesized by Shanghai GenePharma
Co., Ltd. Lipofectamine 3000 (Invitrogen; Thermo Fisher Scientific,
Inc.) was utilized for cell transfection. A549 and Calu-1 cells
(3×10⁵ cells/well) were cultured in 6-well plates and
transfected with siRNA (5 nM) at 37°C. The transfection medium was
replaced with fresh complete medium containing serum and
antibiotics after 18 h. Cells were harvested 48 h post-transfection
and the knockdown efficiency was verified by RT-qPCR and western
blotting. Other experiments were also performed at this timepoint.
The targeting sequences were as follows: si-NC sense,
5′-UUCUCCGAACGUGUCACGUTT-3′ and antisense,
5′-ACGUGACACGUUCGGAGAATT-3′; si-SFXN1-1 sense,
5′-GCUGCUAAUUGCAUUAAUATT-3′ and antisense,
5′-UAUUAAUGCAAUUAGCAGCTT-3′; and si-SFXN1-2 sense,
5′-GGGAACAGCUUACGUUUCUTT-3′ and antisense,
5′-AGAAACGUAAGCUGUUCCCTT-3′.
Cell counting kit-8 (CCK-8) assay
In a 96-well plate, 2×10³ cells (A549 and
Calu-1) were seeded and cultured in triplicate wells. A total of 10
µl CCK-8 solution (CK04-100T; Dojindo Laboratories, Inc.) was added
and cells were incubated at 37°C for 1 h. The absorbance was
analyzed at 450 nm with a standard microplate reader (BioTek;
Agilent Technologies, Inc.).
Scratch wound healing assay
Six-well plates with a cell density of
5×10⁵ A549 and Calu-1cells per well were cultured
without 10% FBS. Upon achieving a cell confluence of 90%, the cells
were scratched with 10-ml pipette tips and washed with PBS. Culture
medium without FBS was added to continue the culture. The images
were captured under a light microscope at 0 and 24 h, and analyzed
using ImageJ software (1.52a).
Transwell assay
The upper Transwell chamber was precoated with 1:8
diluted Matrigel (BD Biosciences) at 37°C for 1 h. A total of
5×10⁴ transfected A549 and Calu-1 cells in serum-free
RPMI 1640 medium were seeded in the upper chamber of an 8-µm
Transwell system at room temperature, while 0.6 ml RPMI 1640 medium
supplemented with 10% FBS was added to the lower chamber in a
24-well plate. After incubation at 37°C for 48 h, the migrated
cells were fixed with 4% paraformaldehyde for 20 min at room
temperature and stained with 0.1% crystal violet solution for 30
min at room temperature. For quantification, images from five
random fields were captured and the cells were counted under a
light microscope.
Detection of cell apoptosis by flow
cytometry
A total of 3×10⁵ cells/well were cultured
in a six-well plate. After 48 h of siRNA transfection, the cells
were harvested, rinsed with PBS and re-suspended in 1X binding
buffer. The cells were dual-stained with APC-Annexin V and 7-AAD
(C1062L; Beyotime Institute of Biotechnology) at room temperature
for 20 min and immediately analyzed by flow cytometry using the
Beckman Coulter CytoFLEX instrument (Beckman Coulter, Inc.) to
assess apoptosis. Data were acquired and analyzed using the Beckman
Coulter CytExpert software (version 2.4; Beckman Coulter,
Inc.).
Statistical analysis
To ensure accuracy, all experiments were
independently repeated three times. All statistical analyses were
performed using SPSS 23.0 software (IBM Corp.). The data are
presented as the mean ± SD. The expression differences between
paired cancer and para-cancerous tissues were compared using a
paired two-tailed t-test. For multiple groups, one-way ANOVA was
used. Following a significant ANOVA result, the Tukey post hoc test
was applied to pinpoint specific differences among the groups. The
Wilcoxon rank sum test was used to determine the association
between SFXN1 expression and the clinicopathological variables
(pathologic T stage, pathologic N stage and pathologic stage) of
the samples. The survival curve was plotted using the Kaplan-Meier
method and groups were compared using the log-rank test. Spearman's
rank correlation was used to quantitatively assess the relationship
between SFXN1 expression levels and the infiltration of distinct
immune cell populations. The relationship between SFXN1 expression
and TMB and MSI was explored by Spearman's rank correlation
analysis. The relationship between SFXN1 expression and tumor
functional states was analyzed using Pearson's correlation
coefficient. The positive correlation between SFXN1 and the top 20
genes across pan-cancer was assessed using Spearman's rank
correlation analysis. P<0.05 was considered to indicate a
statistically significant difference.
Results
SFXN1 gene expression in human tissues
and pan-cancer
To elucidate the role of SFXN1, the initial step was
to examine its expression across different tissues. Through an
extensive search of the HPA database, it was identified that SFXN1
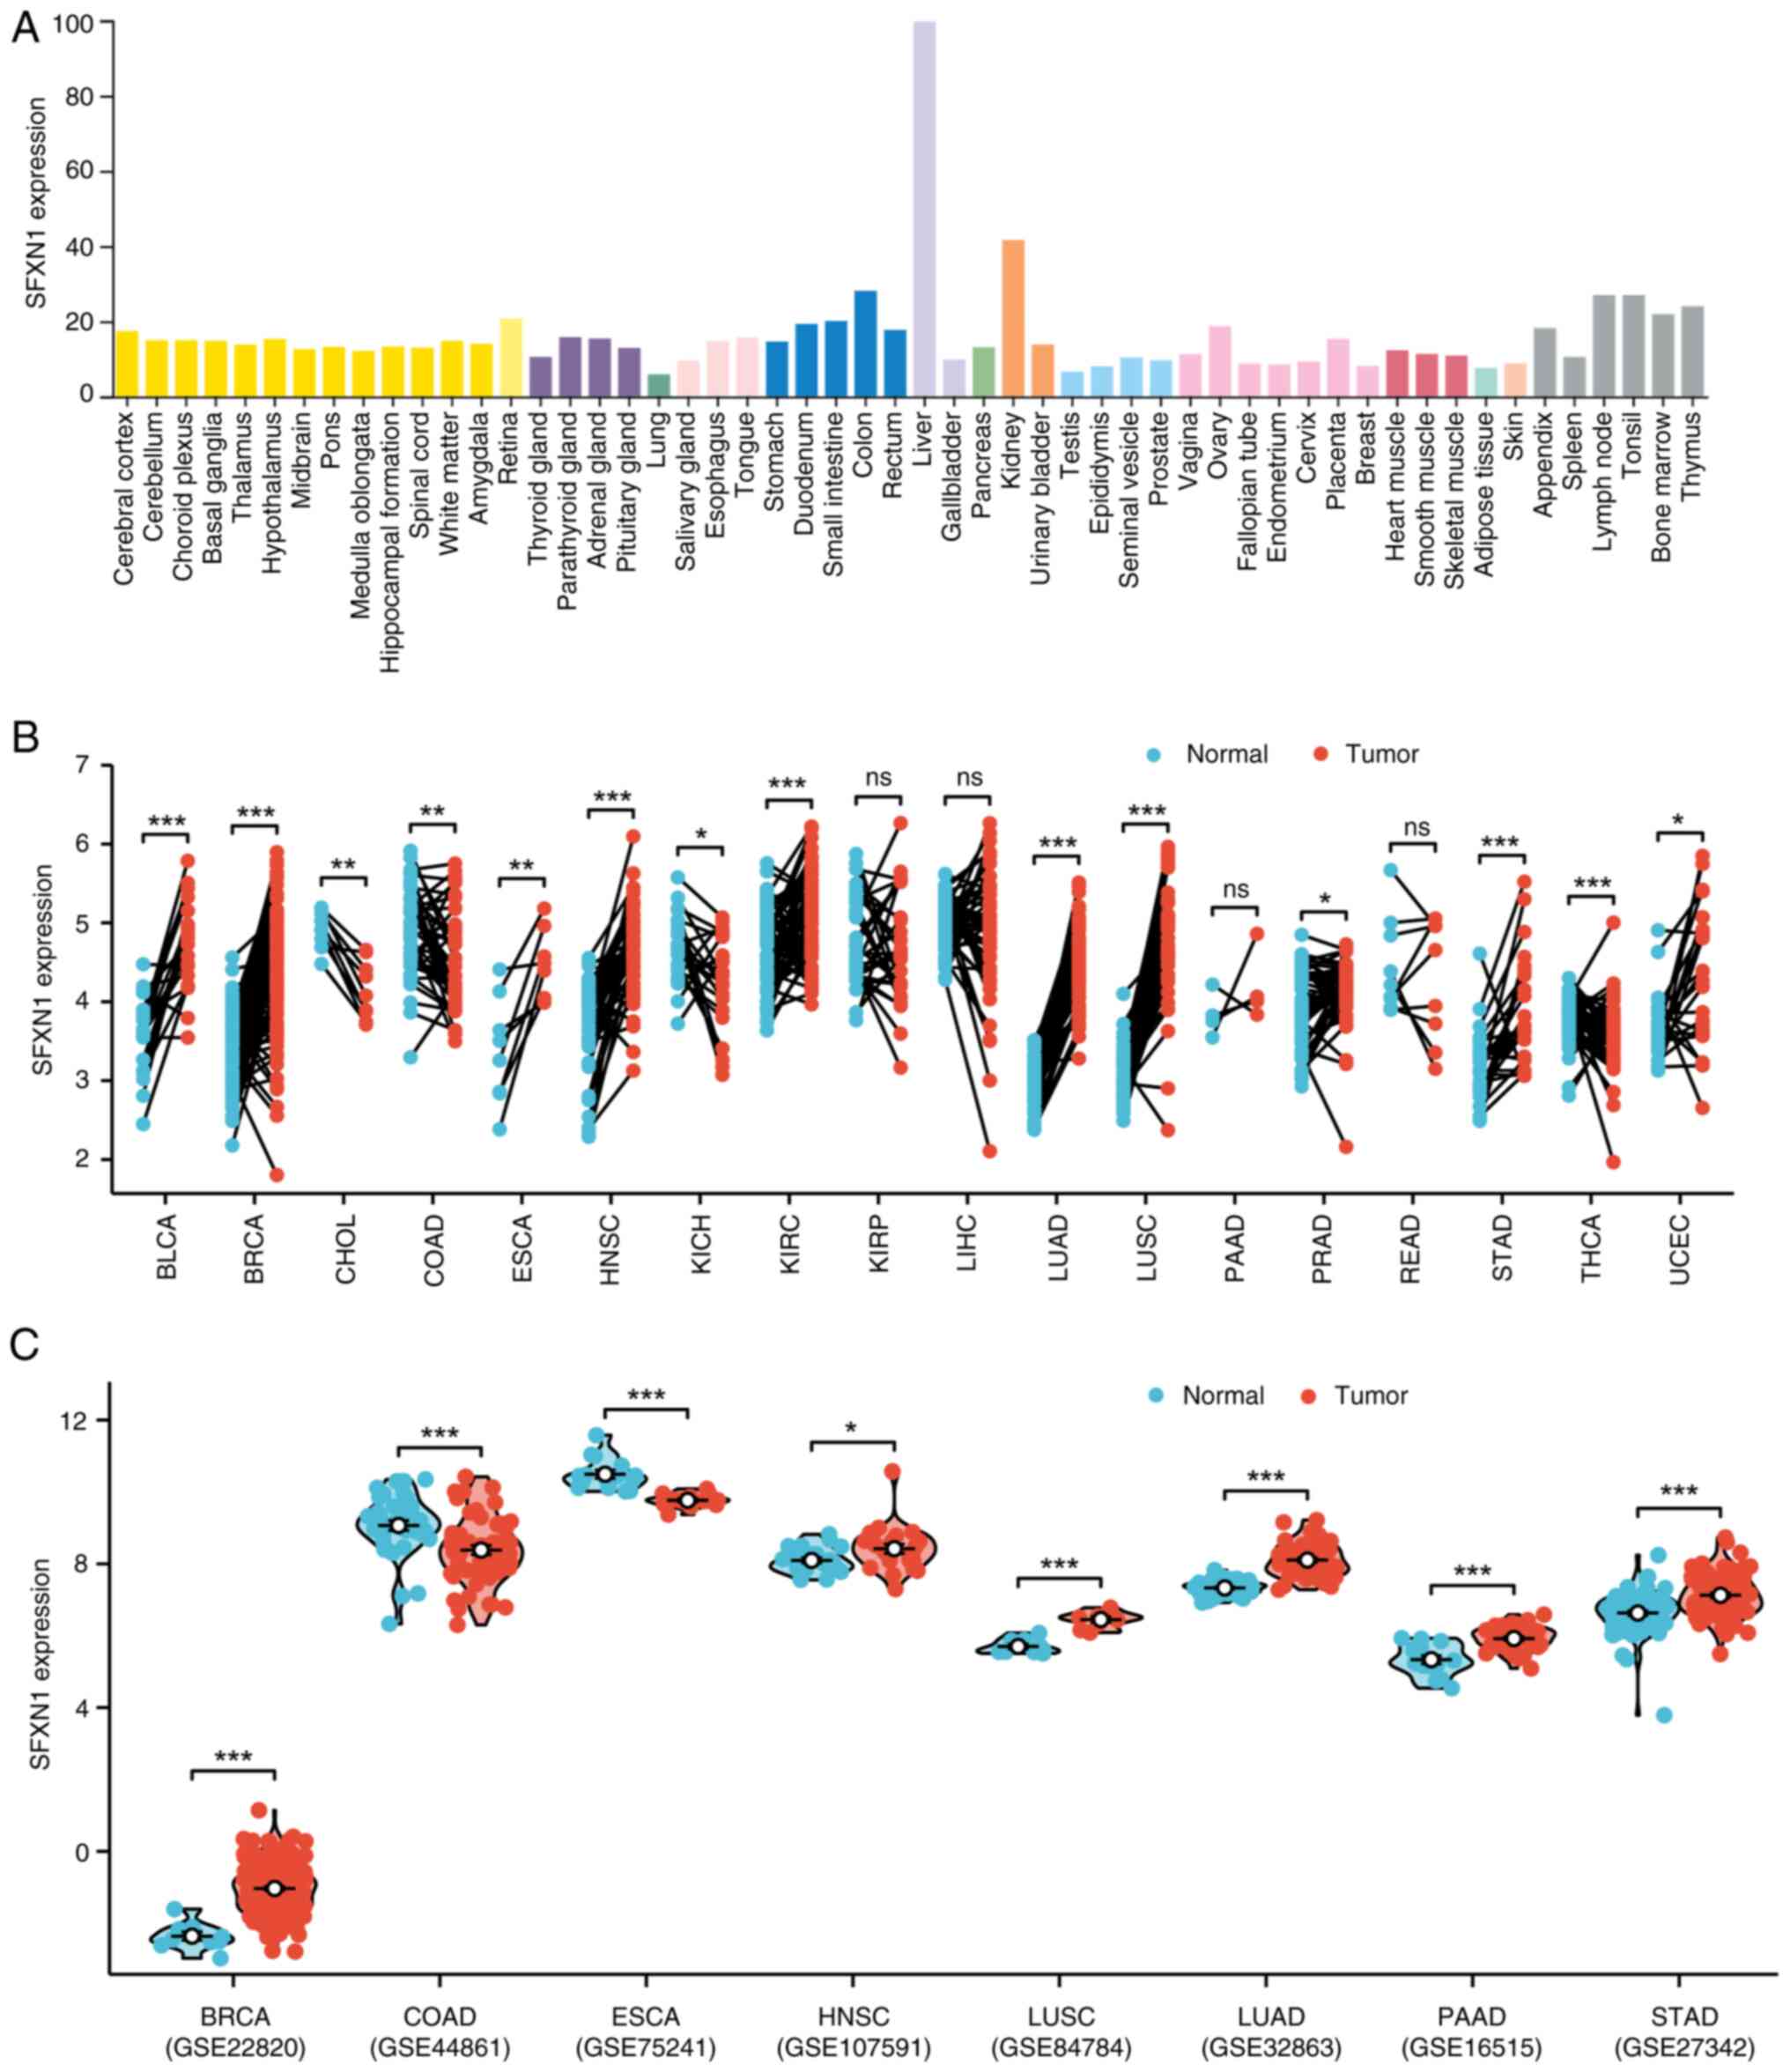
expression was particularly high in the liver and kidney (Fig. 1A). Subsequently, SFXN1 expression in
tumor tissues was investigated using data from TCGA and TIMER.
Analysis of paired samples in TCGA revealed significantly elevated
mRNA levels of SFXN1 in bladder urothelial carcinoma (BLCA;
P<0.001), BRCA (P<0.001), ESCA (P<0.01), HNSC
(P<0.001), KIRC (P<0.001), LUAD (P<0.001), lung squamous
cell carcinoma (LUSC; P<0.001), stomach adenocarcinoma (STAD;
P<0.001) and UCEC (P<0.05), and low expression in
cholangiocarcinoma (CHOL; P<0.01), colon adenocarcinoma (COAD;
P<0.01), kidney chromophobe (KICH; P<0.05), prostate
adenocarcinoma (PRAD; P<0.05) and THCA (P<0.001) (Fig. 1B). Furthermore, the pan-cancer
non-paired data from TCGA indicated that SFXN1 expression was high
in BLCA, BRCA, cervical squamous cell carcinoma and endocervical
adenocarcinoma (CESC), ESCA, HNSC, KIRC, LUAD, LUSC, STAD, and
UCEC, and low in CHOL, COAD, KICH, kidney renal papillary cell
carcinoma (KIRP), LIHC and THCA (Fig.
S1A). Consistently, the findings from the TIMER database
demonstrated elevated SFXN1 levels in BLCA, BRCA, CESC, ESCA, HNSC,
LUAD, LUSC, STAD and UCEC, and decreased SFXN1 levels in CHOL,
COAD, KICH, KIRP, LIHC and THCA (Fig.
S1B). Furthermore, SFXN1 expression patterns were examined by
incorporating validation from the GEO datasets GSE22820 (BRCA),
GSE44861 (COAD), GSE75241 (ESCA), GSE107591 (HNSC), GSE84784
(LUSC), GSE32863 (LUAD), GSE16515 (PAAD) and GSE27342 (STAD)
(Fig. 1C). Notably, SFXN1
expression was lower in ESCA and higher in PAAD tumor tissues,
contrary to TCGA results.
SFXN1 protein expression in 20 types
of cancer
TMAs were used to investigate the protein levels of
SFXN1 in tumor tissues (Fig. 2A).
The findings revealed that SFXN1 protein expression was elevated in
BRCA, LIHC, LUAD, non-Hodgkin lymphoma, rectum adenocarcinoma
(READ), small cell lung cancer and skin cutaneous melanoma (SKCM)
compared with para-cancerous tissues (Fig. 2B-H), while it was lower in STAD
(Fig. 2I). Furthermore, pan-cancer
protein expression analysis indicated that there was a significant
increase in SFXN1 protein expression in BRCA, COAD, UCEC, lung
cancer, pancreatic cancer (PAAD) and HNSC, whereas a decrease was
observed in KIRC, glioblastoma multiforme (GBM) and LIHC (Fig. 2J).
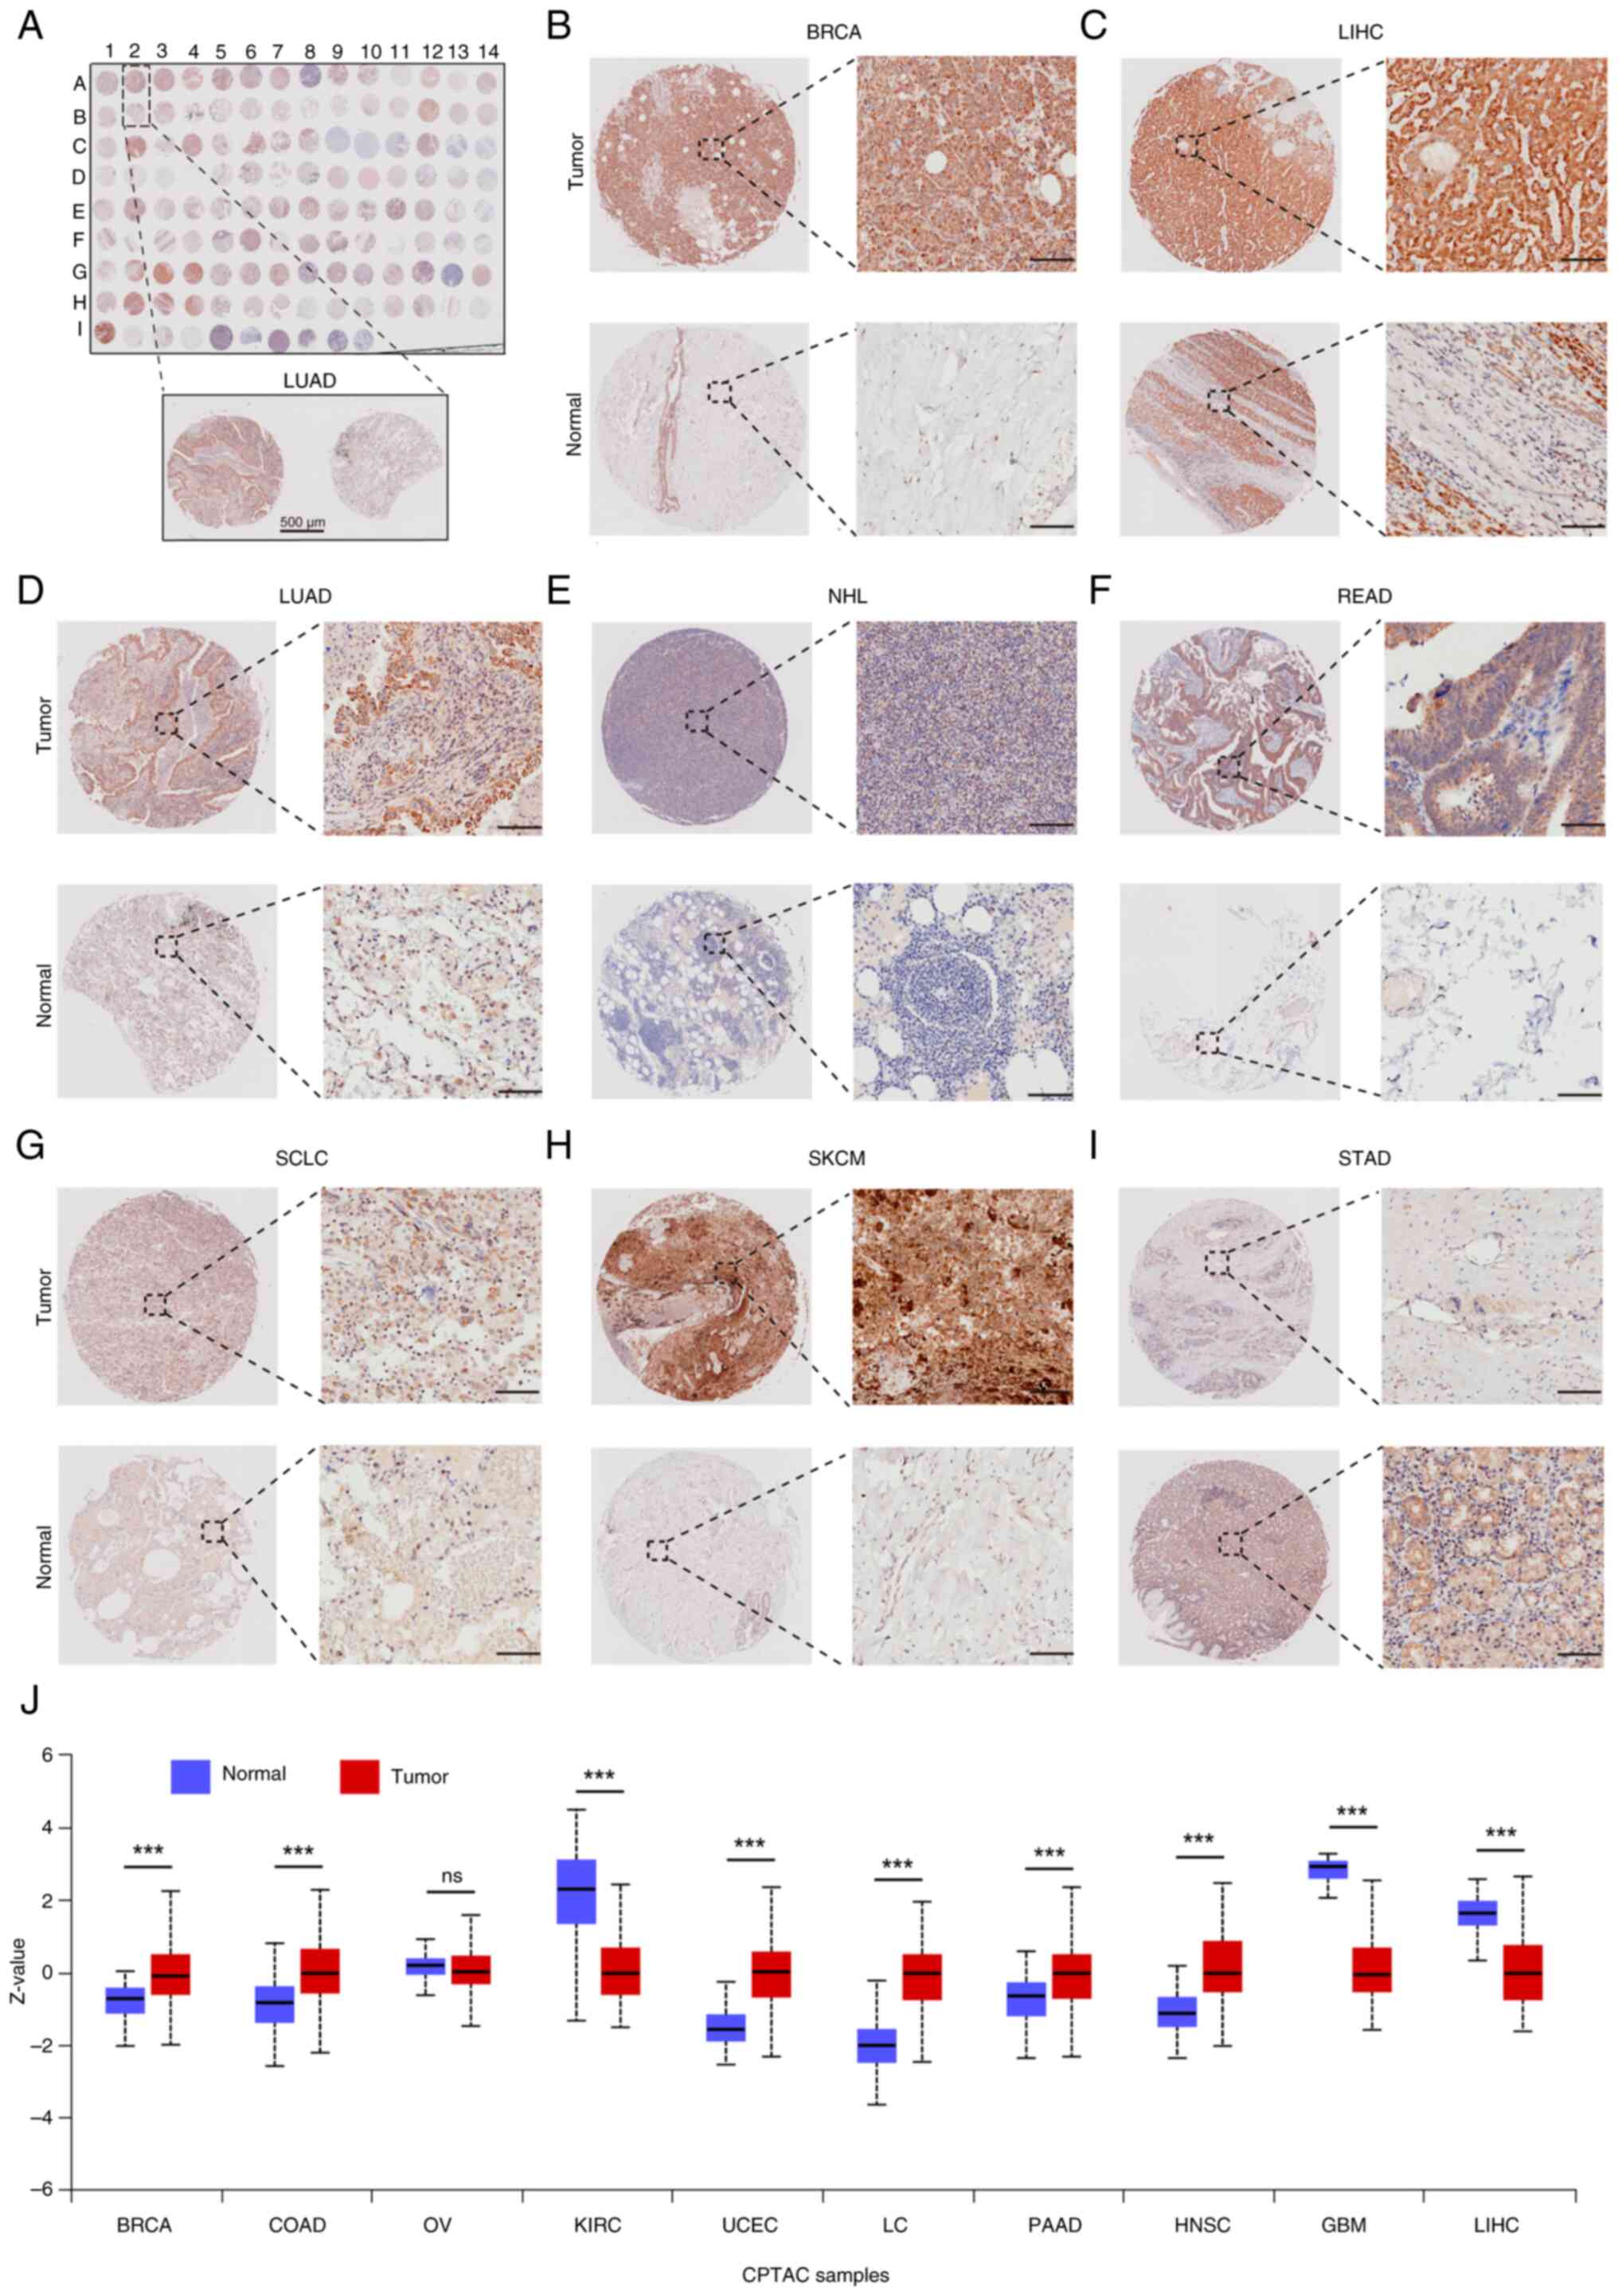 | Figure 2.SFXN1 protein expression in 20 types
of cancer. (A) Tissue microarray (TMA) of SFXN1 protein expression
in 20 types of cancer. Scale bar, 500 µm. SFXN1 protein expression
in (B) BRCA, (C) LIHC, (D) LUAD, (E) NHL, (F) READ, (G) SCLC, (H)
SKCM and (I) STAD. Scale bar, 100 µm. (J) Pan-cancer SFXN1 protein
levels based on the University of Alabama at Birmingham Cancer Data
Analysis Portal database. ***P<0.001. BRCA, breast invasive
carcinoma; CPTAC, Clinical Proteomic Tumor Analysis Consortium;
LIHC, liver hepatocellular carcinoma; LUAD, lung adenocarcinoma;
NHL, non-Hodgkin lymphoma; ns, not significant; PAAD, pancreatic
adenocarcinoma; RCC, renal cell carcinoma; READ, rectum
adenocarcinoma; SCLC, small cell lung cancer; SFXN1, sideroflexin
1; SKCM, skin cutaneous melanoma; STAD, stomach adenocarcinoma;
COAD, colon adenocarcinoma; OV, ovarian serous cystadenocarcinoma;
KIRC, kidney renal clear cell carcinoma; UCEC, uterine corpus
endometrial carcinoma; LC, lung cancer; PAAD, pancreatic
adenocarcinoma; HNSC, head and Neck squamous cell carcinoma; GBM,
glioblastoma multiforme. |
Association between SFXN1 expression
and clinical features in cancer
The present study examined the association between
SFXN1 expression and various pathological characteristics. SFXN1
mRNA expression was observed to be elevated in the advanced T
stages of CESC, KIRP and PRAD, while it was decreased in the T3/T4
stages of KIRC and SKCM (Fig.
3A-E). In CESC and COAD, the mRNA levels of SFXN1 were found to
be reduced in patients in the N1/2 stage compared with in those in
the N0 stage (Fig. 3F and G).
Conversely, in KICH, LUAD and LUSC, SFXN1 expression was increased
in the N1/2/3 stages (Fig. 3H-J).
Furthermore, SFXN1 expression was noted to be lower in stage III/IV
of COAD and KIRC but was higher in stage III/IV in patients with
KIRP, LUAD and UCEC (Fig.
3K-O).
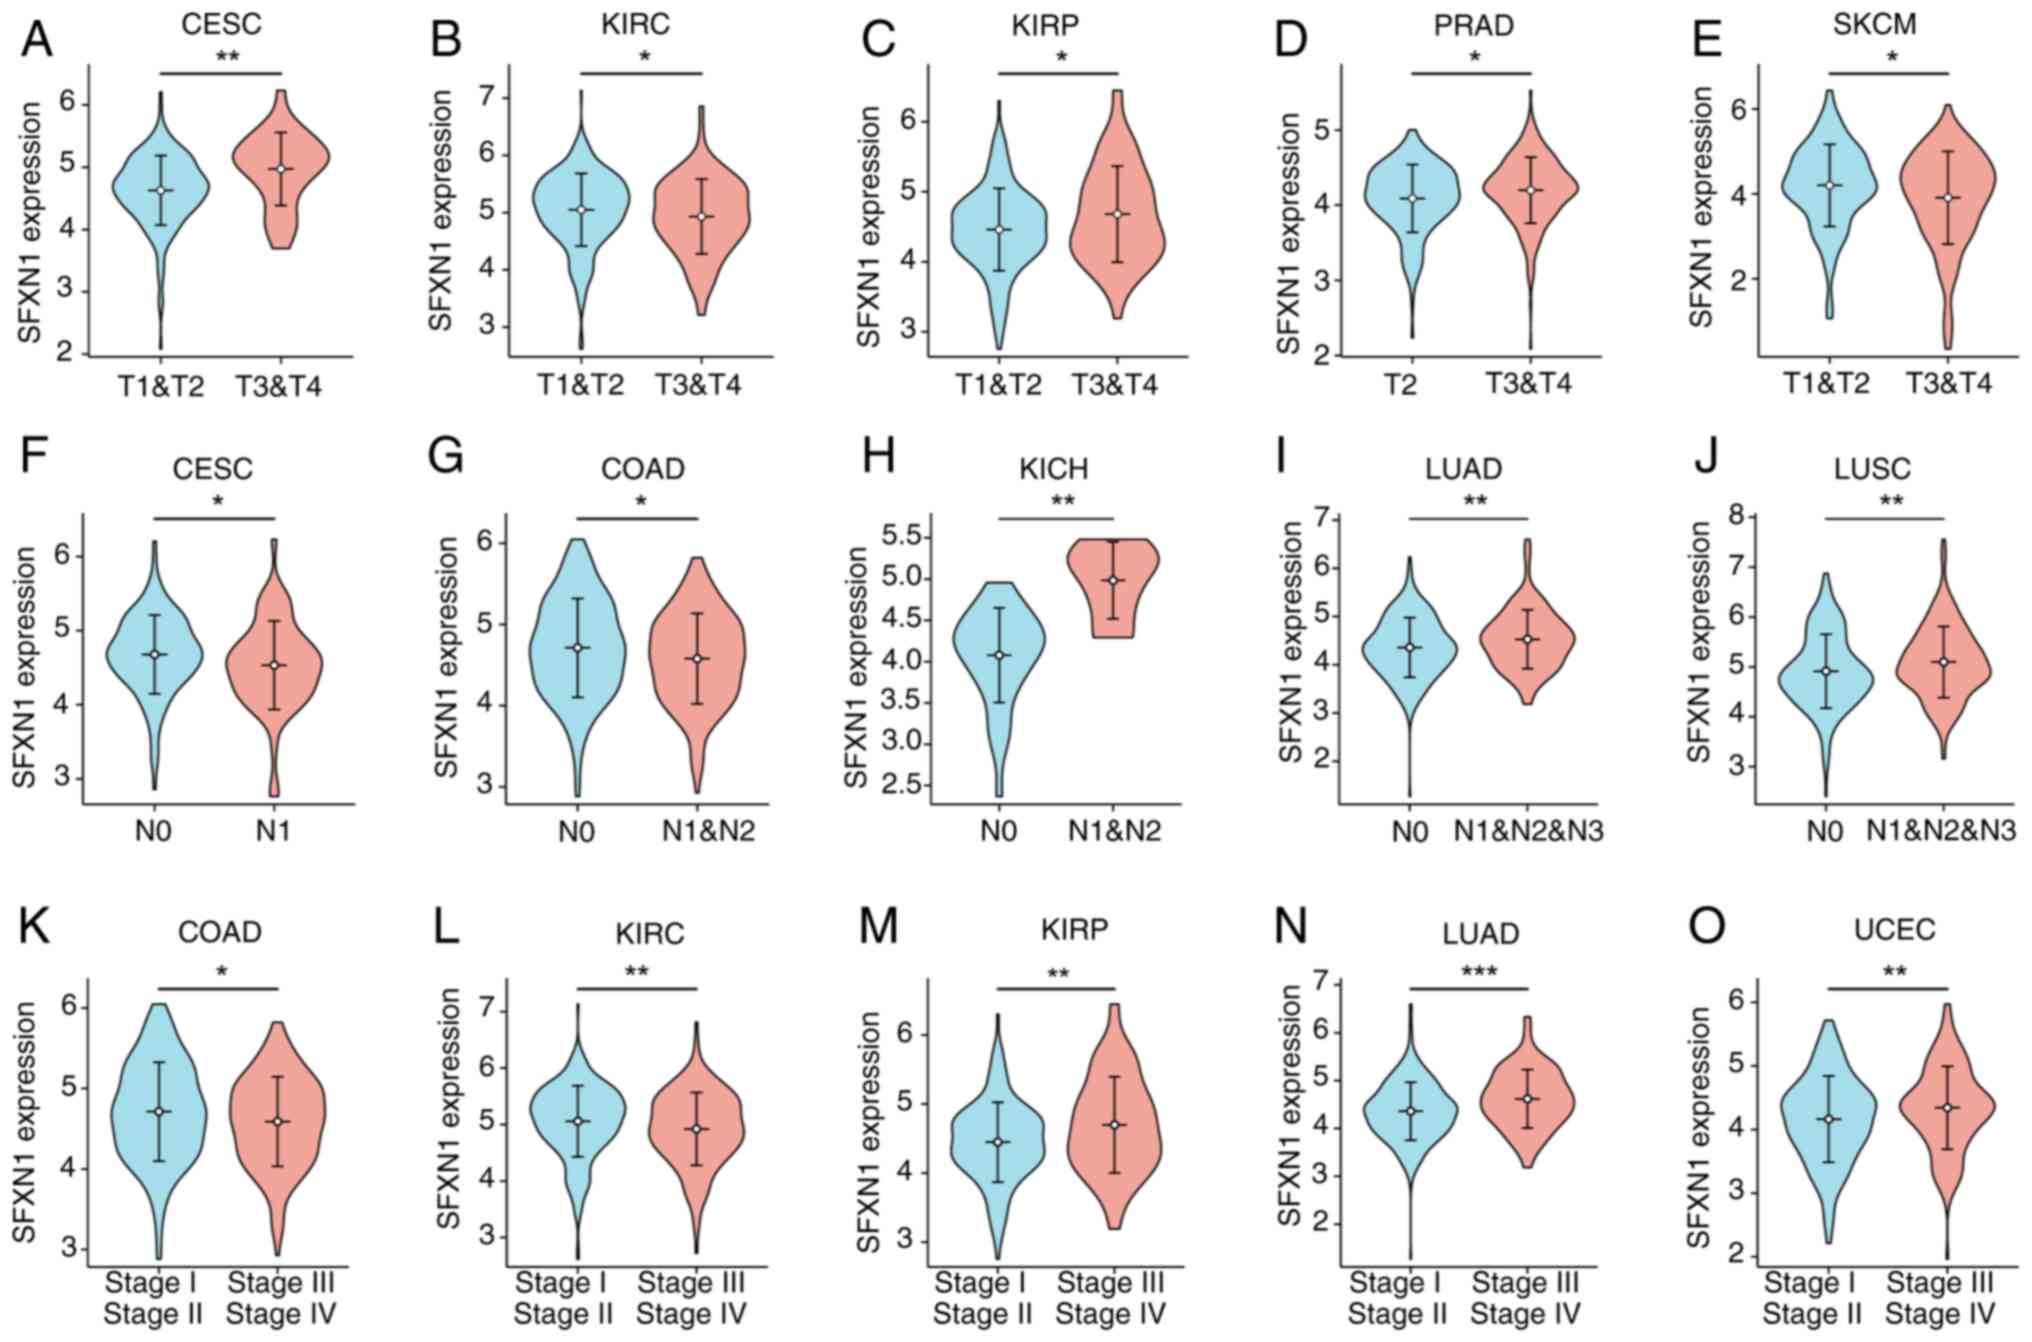 | Figure 3.Relationship between SFXN1 mRNA
expression and clinical features in different cancer types.
Relationship between SFXN1 mRNA expression and T stage in (A) CESC,
(B) KIRC, (C) KIRP, (D) PRAD and (E) SKCM. Relationship between
SFXN1 expression and N stage in (F) CESC, (G) COAD, (H) KICH, (I)
LUAD and (J) LUSC. Relationship between SFXN1 expression and
pathological stage in (K) COAD, (L) KIRC, (M) KIRP, (N) LUAD and
(O) UCEC. *P<0.05, **P<0.01 and ***P<0.001. CESC, cervical
squamous cell carcinoma and endocervical adenocarcinoma; COAD,
colon adenocarcinoma; KICH, kidney chromophobe; KIRC, kidney renal
clear cell carcinoma; KIRP, kidney renal papillary cell carcinoma;
LUAD, lung adenocarcinoma; LUSC, lung squamous cell carcinoma;
PRAD, prostate adenocarcinoma; SFXN1, sideroflexin 1; SKCM, skin
cutaneous melanoma; UCEC, uterine corpus endometrial carcinoma. |
Prognostic evaluation of SFXN1 in
pan-cancer
The GEPIA2.0 database was employed to evaluate the
impact of SFXN1 expression on pan-cancer prognosis, encompassing
both OS and DFS. Elevated SFXN1 expression in adrenocortical
carcinoma (ACC; P=0.024), LUAD (P=0.042), mesothelioma (MESO;
P=0.0046) and acute myeloid leukemia (LAML; P=0.00062) was
associated with adverse OS; however, elevated SFXN1 expression in
KIRC was associated with good prognosis (P=5.5×10⁻⁶)
(Figs. 4A and S2A-C). DFS analysis showed that high
SFXN1 expression was associated with poor prognosis in patients
with MESO (P=0.041) and sarcoma (SARC; P=0.048), and good prognosis
in patients with KIRC (P=0.00043) (Fig.
4B).
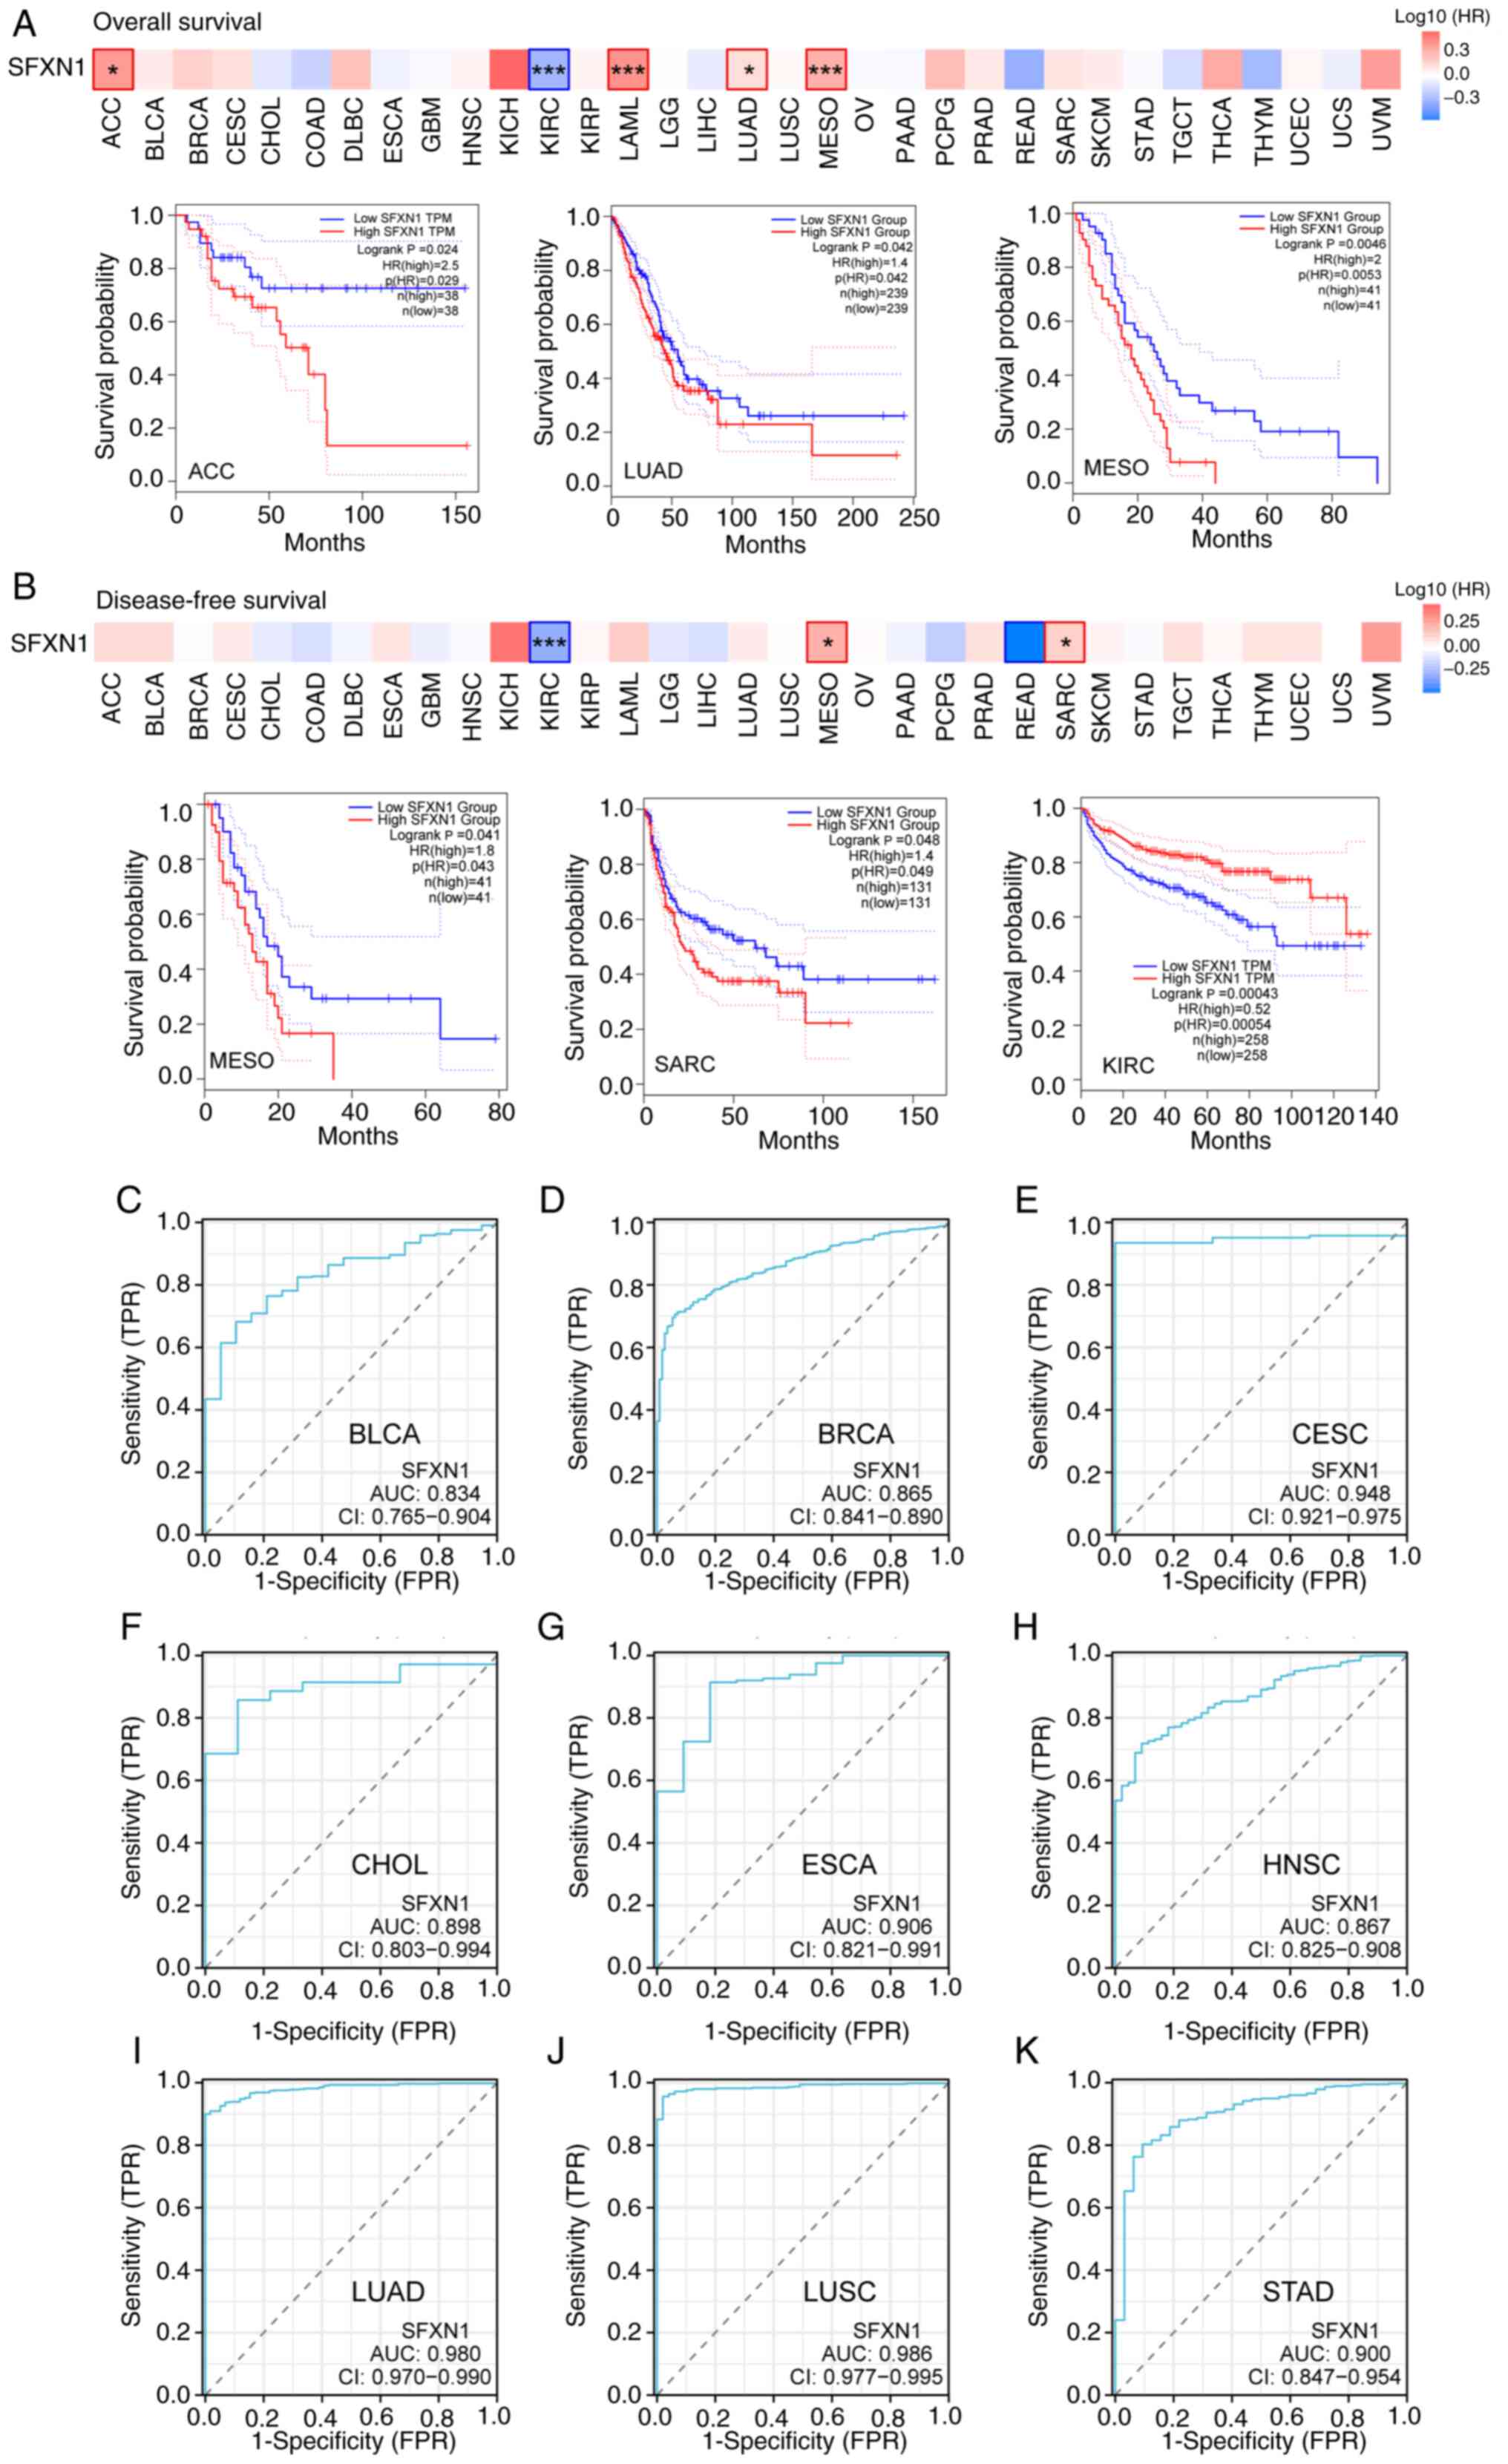 | Figure 4.Prognostic and diagnostic value of
SFXN1 in pan-cancer. Association between SFXN1 expression and (A)
overall survival and (B) disease-free survival in pan-cancer.
Receiver operating characteristic curves of SFXN1 in (C) BLCA, (D)
BRCA, (E) CESC, (F) CHOL, (G) ESCA, (H) HNSC, (I) LUAD, (J) LUSC
and (K) STAD. *P<0.05 and ***P<0.001. AUC, area under the
curve; FPR, false positive rate; HR, hazard ratio; SFXN1,
sideroflexin 1; TPM, transcripts per million; TPR, true positive
rate. |
The Kaplan-Meier plotter was used to validate the
relationship between SFXN1 expression and tumor prognosis. The
present findings demonstrated that high SFXN1 expression was
associated with poor OS in BRCA (P=0.0043), ESCA (P=0.031), HNSC
(P=0.013), LUAD (P=0.00041), THCA (P=0.0085) and UCEC (P=0.031),
and with favorable OS in KIRC (P=6.9×10⁻⁵) and LIHC
(P=0.042) (Fig. S2D-K). Analysis
of the recurrence-free survival (RFS) revealed that patients with
higher SFXN1 expression had a shorter RFS in KIRC (P=0.043), LUAD
(P=0.0084), TGCT (P=0.025) and THCA (P=0.0068) (Fig. S2L-O).
Diagnostic value of SFXN1 in
pan-cancer
The present study subsequently investigated the
potential of SFXN1 to serve as a diagnostic marker in pan-cancer
using ROC curves. The area under the curve (AUC) indicated that
SFXN1 possessed high diagnostic value in BLCA (AUC, 0.834), BRCA
(AUC, 0.865), CESC (AUC, 0.948), CHOL (AUC, 0.898), ESCA (AUC,
0.906), HNSC (AUC, 0.867), LUAD (AUC, 0.980), LUSC (AUC, 0.986) and
STAD (AUC, 0.900) (Fig. 4C-K).
Association between SFXN1 and
pan-cancer immunity
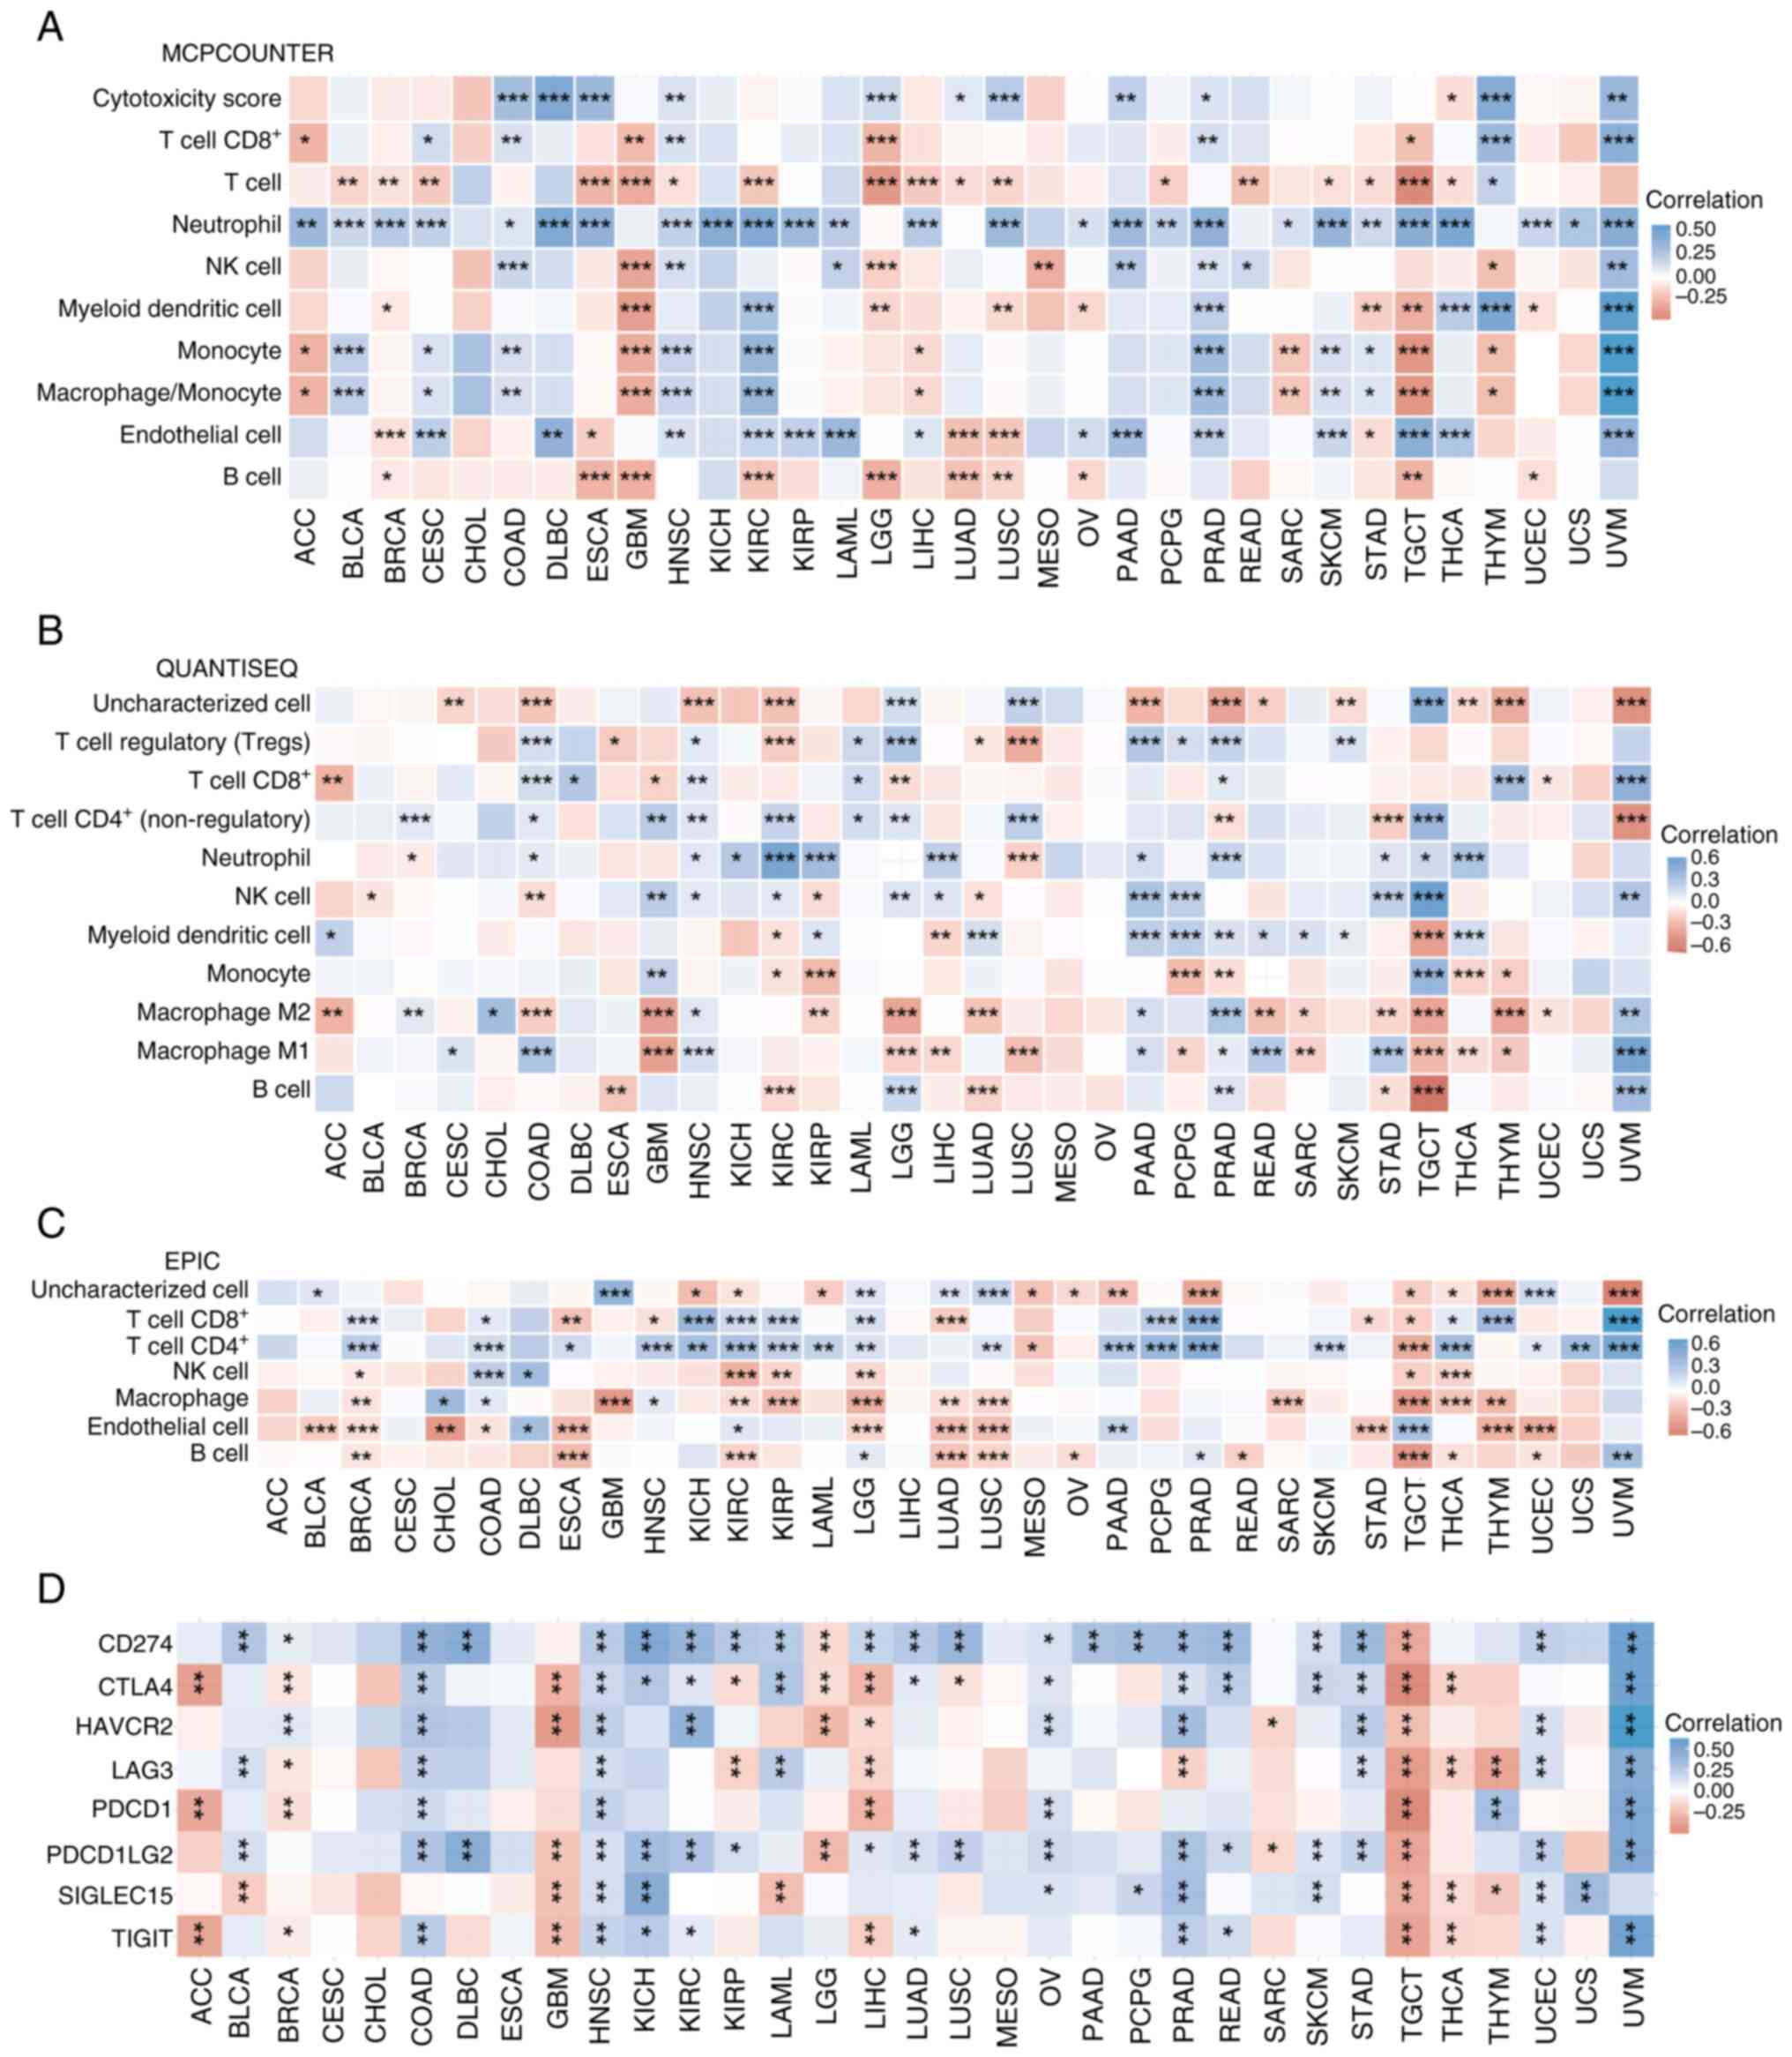
The MCPCOUNTER, QUANTISEQ and EPIC algorithms were
used to assess the association between SFXN1 expression and immune
cell infiltration. Based on the MCPCOUNTER findings, SFXN1
expression was positively associated with CD8+ T cell
infiltration in CESC, COAD, HNSC, PRAD, thymoma (THYM) and uveal
melanoma (UVM), but negatively associated with CD8+ T
cell infiltration in ACC, GBM, brain lower grade glioma (LGG) and
TGCT. SFXN1 expression was positively associated with T cell
infiltration only in THYM, but negatively associated with T cell
infiltration in BLCA, BRCA, CESC, ESCA, GBM, HNSC, KIRC, LGG, LIHC,
LUAD, LUSC, pheochromocytoma and paraganglioma (PCPG), READ, SKCM,
STAD, TGCT and THCA. SFXN1 expression exhibited positive
correlation with neutrophil infiltration in ACC, BLCA, BRCA, CESC,
COAD, lymphoid neoplasm diffuse large B-cell lymphoma (DLBC), ESCA,
HNSC, KICH, KIRC, KIRP, LAML, LIHC, LUSC, ovarian serous
cystadenocarcinoma (OV), PAAD, PCPG, PRAD, SARC, SKCM, STAD, TGCT,
THCA, UCEC, uterine carcinosarcoma (UCS) and UVM. As for natural
killer (NK) cell infiltration, SFXN1 expression exhibited a
negative association with this in GBM, LGG, MESO and THYM, and a
positive association with this in COAD, HNSC, LAML, PAAD, PRAD,
READ and UVM. SFXN1 expression exhibited a negative correlation
with myeloid dendritic cell infiltration in BRCA, GBM, LGG, LUSC,
OV, STAD, TGCT and UCEC, but a positive correlation with myeloid
dendritic cell infiltration in KIRC, PRAD, THCA, THYM and UVM.
SFXN1 expression was negatively associated with monocyte and
macrophage/monocyte infiltration in ACC, GBM, LIHC, SARC, TGCT and
THYM, and positively associated with monocyte and
macrophage/monocyte infiltration in BLCA, CESC, COAD, HNSC, KIRC,
PRAD, SKCM, STAD and UVM. As for endothelial cell infiltration,
SFXN1 expression was negatively associated with this in BRCA, ESCA,
LUAD, LUSC and STAD, but positively associated with this in CESC,
DLBC, HNSC, KIRC, KIRP, LAML, LIHC, OV, PAAD, PRAD, SKCM, TGCT,
THCA and UVM. SFXN1 expression exhibited a significant negative
correlation with B cell infiltration in BRCA, ESCA, GBM, KIRC, LGG,
LUAD, LUSC, OV, TGCT and UCEC (Fig.
5A).
QUANTISEQ findings showed that SFXN1 expression was
negatively associated with regulatory T cells in ESCA, KIRC, LUAD
and LUSC, and positively associated with regulatory T cells in
COAD, HNSC, LAML, LGG, PAAD, PCPG, PRAD and SKCM. As for
CD8+ T cell infiltration, SFXN1 expression was
negatively associated with this in ACC, GBM, LGG and UCEC, but
positively associated with this in COAD, DLBC, HNSC, LAML, PRAD,
THYM and UVM. SFXN1 expression exhibited a negative association
with CD4+ T cells in PRAD, STAD and UVM, and a positive
association with CD4+ T cells in BRCA, COAD, GBM, HNSC,
KIRC, LAML, LGG, LUSC and TGCT. SFXN1 expression was negatively
associated with neutrophil infiltration in BRCA and LUSC, but
positively associated with neutrophil infiltration in COAD, HNSC,
KICH, KIRC, KIRP, LIHC, PAAD, PRAD, STAD, TGCT and THCA. SFXN1
expression exhibited a significant negative correlation with NK
cell infiltration in BLCA, COAD, KIRP and LUAD, and a positive
correlation with NK cell infiltration in GBM, HNSC, KIRC, LGG,
LIHC, PAAD, PGPC, STAD, TGCT and UVM. SFXN1 expression exhibited an
obvious negative association with myeloid dendritic cell
infiltration in KIRC, LIHC and TGCT, whereas it exhibited a
positive association with myeloid dendritic cell infiltration in
ACC, KIRP, LUAD, PAAD, PCPG, PRAD, READ, SARC, SKCM and THCA. SFXN1
expression was negatively associated with monocyte infiltration in
KIRC, KIRP, PCPG, PRAD, THCA and THYM, but positively associated
with monocyte infiltration in GBM and TGCT. As for infiltration of
M2 macrophages, SFXN1 expression exhibited a negative association
with this in ACC, COAD, GBM, KIRP, LGG, LUAD, READ, SARC, STAD,
TGCT and THYM, but a positive association with this in BRCA, CHOL,
HNSC, PAAD, PRAD and UVM. SFXN1 expression exhibited an obvious
negative association with M1 macrophage infiltration in GBM, LGG,
LIHC, LUSC, PCPG, SARC, TGCT, THCA and THYM, while exhibiting a
positive association with M1 macrophage infiltration in CESC, COAD,
HNSC, PAAD, PRAD, READ, STAD and UVM. SFXN1 expression exhibited a
significant negative association with B cell infiltration in ESCA,
KIRC, LUAD, STAD and TGCT, but a positive association with B cell
infiltration in LGG, PRAD and UVM (Fig.
5B).
According to the EPIC results, SFXN1 expression was
negatively associated with CD8+ T cell infiltration in
ESCA, HNSC, LUAD, STAD and TGCT, but positively associated with
CD8+ T cell infiltration in BRCA, COAD, KICH, KIRC,
KIRP, LGG, PCPG, PRAD, THYM and UVM. SFXN1 expression was
negatively associated with CD4+ T cell infiltration in
MESO and TGCT, and positively associated with CD4+ T
cell infiltration in BRCA, COAD, ESCA, HNSC, KICH, KIRC, KIRP,
LAML, LGG, LUSC, PAAD, PCPG, PRAD, SKCM, THCA, UCEC, UCS and UVM.
EPIC showed a negative association between SFXN1 expression and NK
cells in BRCA, KIRC, KIRP, LGG, TGCT and THCA, and a positive
association between SFXN1 expression and NK cells in COAD and DLBC.
SFXN1 expression exhibited a negative association with macrophage
infiltration in BRCA, GBM, KIRC, KIRP, LGG, LUAD, LUSC, SARC, TGCT,
THCA and THYM, but a positive association with macrophage
infiltration in CHOL and HNSC. As for the association between SFXN1
expression and endothelial cell infiltration, it showed a negative
association in BLCA, BRCA, CHOL, COAD, ESCA, LGG, LUAD, LUSC, STAD,
THYM and UCEC, and a positive association in DLBC, KIRC, PAAD and
TGCT. SFXN1 expression was negatively associated with B cell
infiltration in BRCA, ESCA, KIRC, LUAD, LUSC, OV, READ, TGCT, THCA
and UCEC, but positively associated with B cell infiltration in
LGG, PRAD and UVM (Fig. 5C).
To delve deeper into the relationship between SFXN1
and tumor immunity, an analysis of the association between SFXN1
and immune checkpoint molecules in 33 distinct types of cancer
tissues was conducted. A negative association between SFXN1
expression and CTLA4, PDCD1 and TIGIT was shown in ACC. In BLCA,
SFXN1 expression exhibited a positive correlation with CD274, LAG3
and PDCD1LG2, and a negative correlation with SIGLEC15. In BRCA,
SFXN1 expression showed a positive correlation with CD274 and
HAVCR2, but a negative correlation with CTLA4, LAG3, PDCD1 and
TIGIT. In COAD, a positive association was found between SFXN1
expression and CD274, CTLA4, HAVCR2, LAG3, PDCD1, PDCD1LG2 and
TIGIT. A positive correlation was shown in DLBC between SFXN1
expression and CD274 and PDCD1LG2. A negative association between
SFXN1 expression and CTLA4, HAVCR2, PDCD1LG2, SIGLEC15 and TIGIT
was shown in GBM. In HNSC, SFXN1 expression exhibited a positive
correlation with CD274, CTLA4, HAVCR2, LAG3, PDCD1, PDCD1LG2,
SIGLEC15 and TIGIT. A positive correlation was shown between SFXN1
expression and CD274, CTLA4, PDCD1LG2, SIGLEC15 and TIGIT in KICH,
and between SFXN1 expression and CD274, CTLA4, HAVCR2, PDCD1LG2 and
TIGIT in KIRC. However, in KIRP, SFXN1 expression exhibited a
positive correlation with CD274 and PDCD1LG2, and a negative
correlation with CTLA4 and LAG3. In LAML, a positive association
was found between SFXN1 expression and CD274, CTLA4 and LAG3, but a
negative correlation with SIGLEC15 was observed. In LGG, a negative
correlation was shown between SFXN1 expression and CD274, CTLA4,
HAVCR2 and PDCD1LG2. In LIHC, SFXN1 expression exhibited a positive
correlation with CD274 and PDCD1LG2, and a negative correlation
with CTLA4, HAVCR2, LAG3, PDCD1 and TIGIT. SFXN1 expression
exhibited a positive correlation with CD274, CTLA4, PDCD1LG2 and
TIGIT in LUAD. In LUSC, a positive association was found between
SFXN1 expression and CD274 and PDCD1LG2, while a negative
association with CTLA4 was observed. A positive correlation was
shown between SFXN1 expression and CD274, CTLA4, HAVCR2, PDCD1,
PDCD1LG2 and SIGLEC15 in OV. SFXN1 expression exhibited a positive
association with CD274 in PAAD. In PCPG, SFXN1 expression showed a
positive correlation with CD274 and SIGLEC15. In PRAD, a positive
association was found between SFXN1 expression and CD274, CTLA4,
HAVCR2, PDCD1LG2, SIGLEC15 and TIGIT, while a negative association
with LAG3 was observed. In READ, SFXN1 expression exhibited a
positive correlation with CD274, CTLA4, PDCD1LG2 and TIGIT. A
negative association was found between SFXN1 expression and HAVCR2
and PDCD1LG2 in SARC. In SKCM, SFXN1 expression exhibited a
positive association with CD274, CTLA4, PDCD1LG2 and SIGLEC15. In
STAD, SFXN1 expression showed a positive correlation with CD274,
CTLA4, HAVCR2, LAG3 and PDCD1LG2. A negative association was found
between SFXN1 expression and CD274, CTLA4, HAVCR2, LAG3, PDCD1,
PDCD1LG2, SIGLEC15 and TIGIT in TGCT. In THCA, SFXN1 expression
exhibited a negative relationship with CTLA4, LAG3, SIGLEC15 and
TIGIT. In THYM, a positive association was found between SFXN1
expression and PDCD1, whereas a negative association with LAG3 and
SIGLEC15 was observed. A positive correlation was shown between
SFXN1 expression and CD274, HAVCR2, LAG3, PDCD1LG2, SIGLEC15 and
TIGIT in UCEC. In UCS, SFXN1 expression exhibited a positive
association with SIGLEC15. SFXN1 expression exhibited a positive
correlation with CD274, CTLA4, HAVCR2, LAG3, PDCD1, PDCD1LG2 and
TIGIT in UVM. There was no significant correlation between SFXN1
and the expression levels of CD274, CTLA4, HAVCR2, LAG3, PDCD1,
PDCD1LG2, SIGLEC15 and TIGIT in CESC, CHOL, ESCA and MESO (Fig. 5D).
A total of six distinct categories were used to
classify the immune phenotypes of cancers: C1, wound healing; C2,
IFN-dominant; C3, inflammatory; C4, lymphocyte depletion; C5,
immunologically quiet; and C6, TGF-dominant. TISIDB was used to
explore the relationship between SFXN1 expression and pan-cancer
immune subtypes. The findings demonstrated that the immune subtypes
of ACC, BLCA, BRCA, COAD, GBM, KIRC, KIRP, LIHC, LUAD, LUSC, OV,
PAAD, PRAD, READ, SARC, SKCM, STAD, TGCT, THCA and UCEC were all
associated with SFXN1 expression (Fig.
S3).
Mutation of SFXN1 in pan-cancer
To probe the mutational landscape of SFXN1 across
various cancer types, an extensive search was conducted using
cBioPortal. The analysis revealed that KIRC exhibited the highest
frequency of SFXN1 alterations, primarily amplifications, which
were also observed in SARC, ACC, endometrial cancer, ovarian
epithelial tumor, melanoma, NSCLC, pancreatic cancer, bladder
cancer, BRCA, prostate cancer, glioma, esophagogastric cancer,
renal non-clear cell carcinoma, hepatobiliary cancer and thyroid
cancer (Fig. S4A). The overall
mutation rate of SFXN1 in pan-cancer was 1.6%. The most prevalent
types of SFXN1 mutations in pan-cancer included amplification, deep
deletion and missense mutation (Fig.
S4B). In addition, a total of 58 genetic alterations were
identified in SFXN1, comprising 41 missense, 12 truncating and 5
structural variant/fusion alterations (Fig. S4C).
The relationship between SFXN1 expression and TMB
and MSI was also explored. The findings indicated that SFXN1 was
positively associated with TMB in COAD (P<0.001), HNSC
(P<0.001), KIRC (P<0.05), LUAD (P<0.001), PAAD
(P<0.05), PRAD (P<0.05), READ (P<0.05), SKCM (P<0.05),
STAD (P<0.001), TGCT (P<0.05), THCA (P<0.001), UCEC
(P<0.001) and UCS (P<0.05), and negatively correlated with
TMB in THYM (P<0.001) and UVM (P<0.05) (Fig. S4D). SFXN1 was positively associated
with MSI in CESC (P<0.001), COAD (P<0.001), MESO (P<0.01),
SARC (P<0.05), STAD (P<0.001), TGCT (P<0.05) and UCEC
(P<0.001) (Fig. S4E).
DNA methylation analysis of SFXN1 in
pan-cancer
Utilizing the UALCAN database, a comparative
analysis of SFXN1 methylation levels in normal and malignant
tissues was conducted. The results indicated that promoter
methylation of SFXN1 was significantly increased in BRCA
(P<0.001), CESC (P<0.001), CHOL (P<0.001), ESCA
(P<0.01), HNSC (P<0.001), KIRC (P<0.001), KIRP
(P<0.001), LUSC (P<0.05), PAAD (P<0.01), STAD (P<0.001)
and SARC (P<0.001), whereas it was substantially decreased in
PRAD (P<0.05), THCA (P<0.001) and TGCT (P<0.001) (Fig. S5).
SFXN1 expression at the single-cell
level
Single-cell sequencing represents a cutting-edge
technology enabling the comprehensive analysis of the genome,
transcriptome and epigenome at an unprecedented single-cell
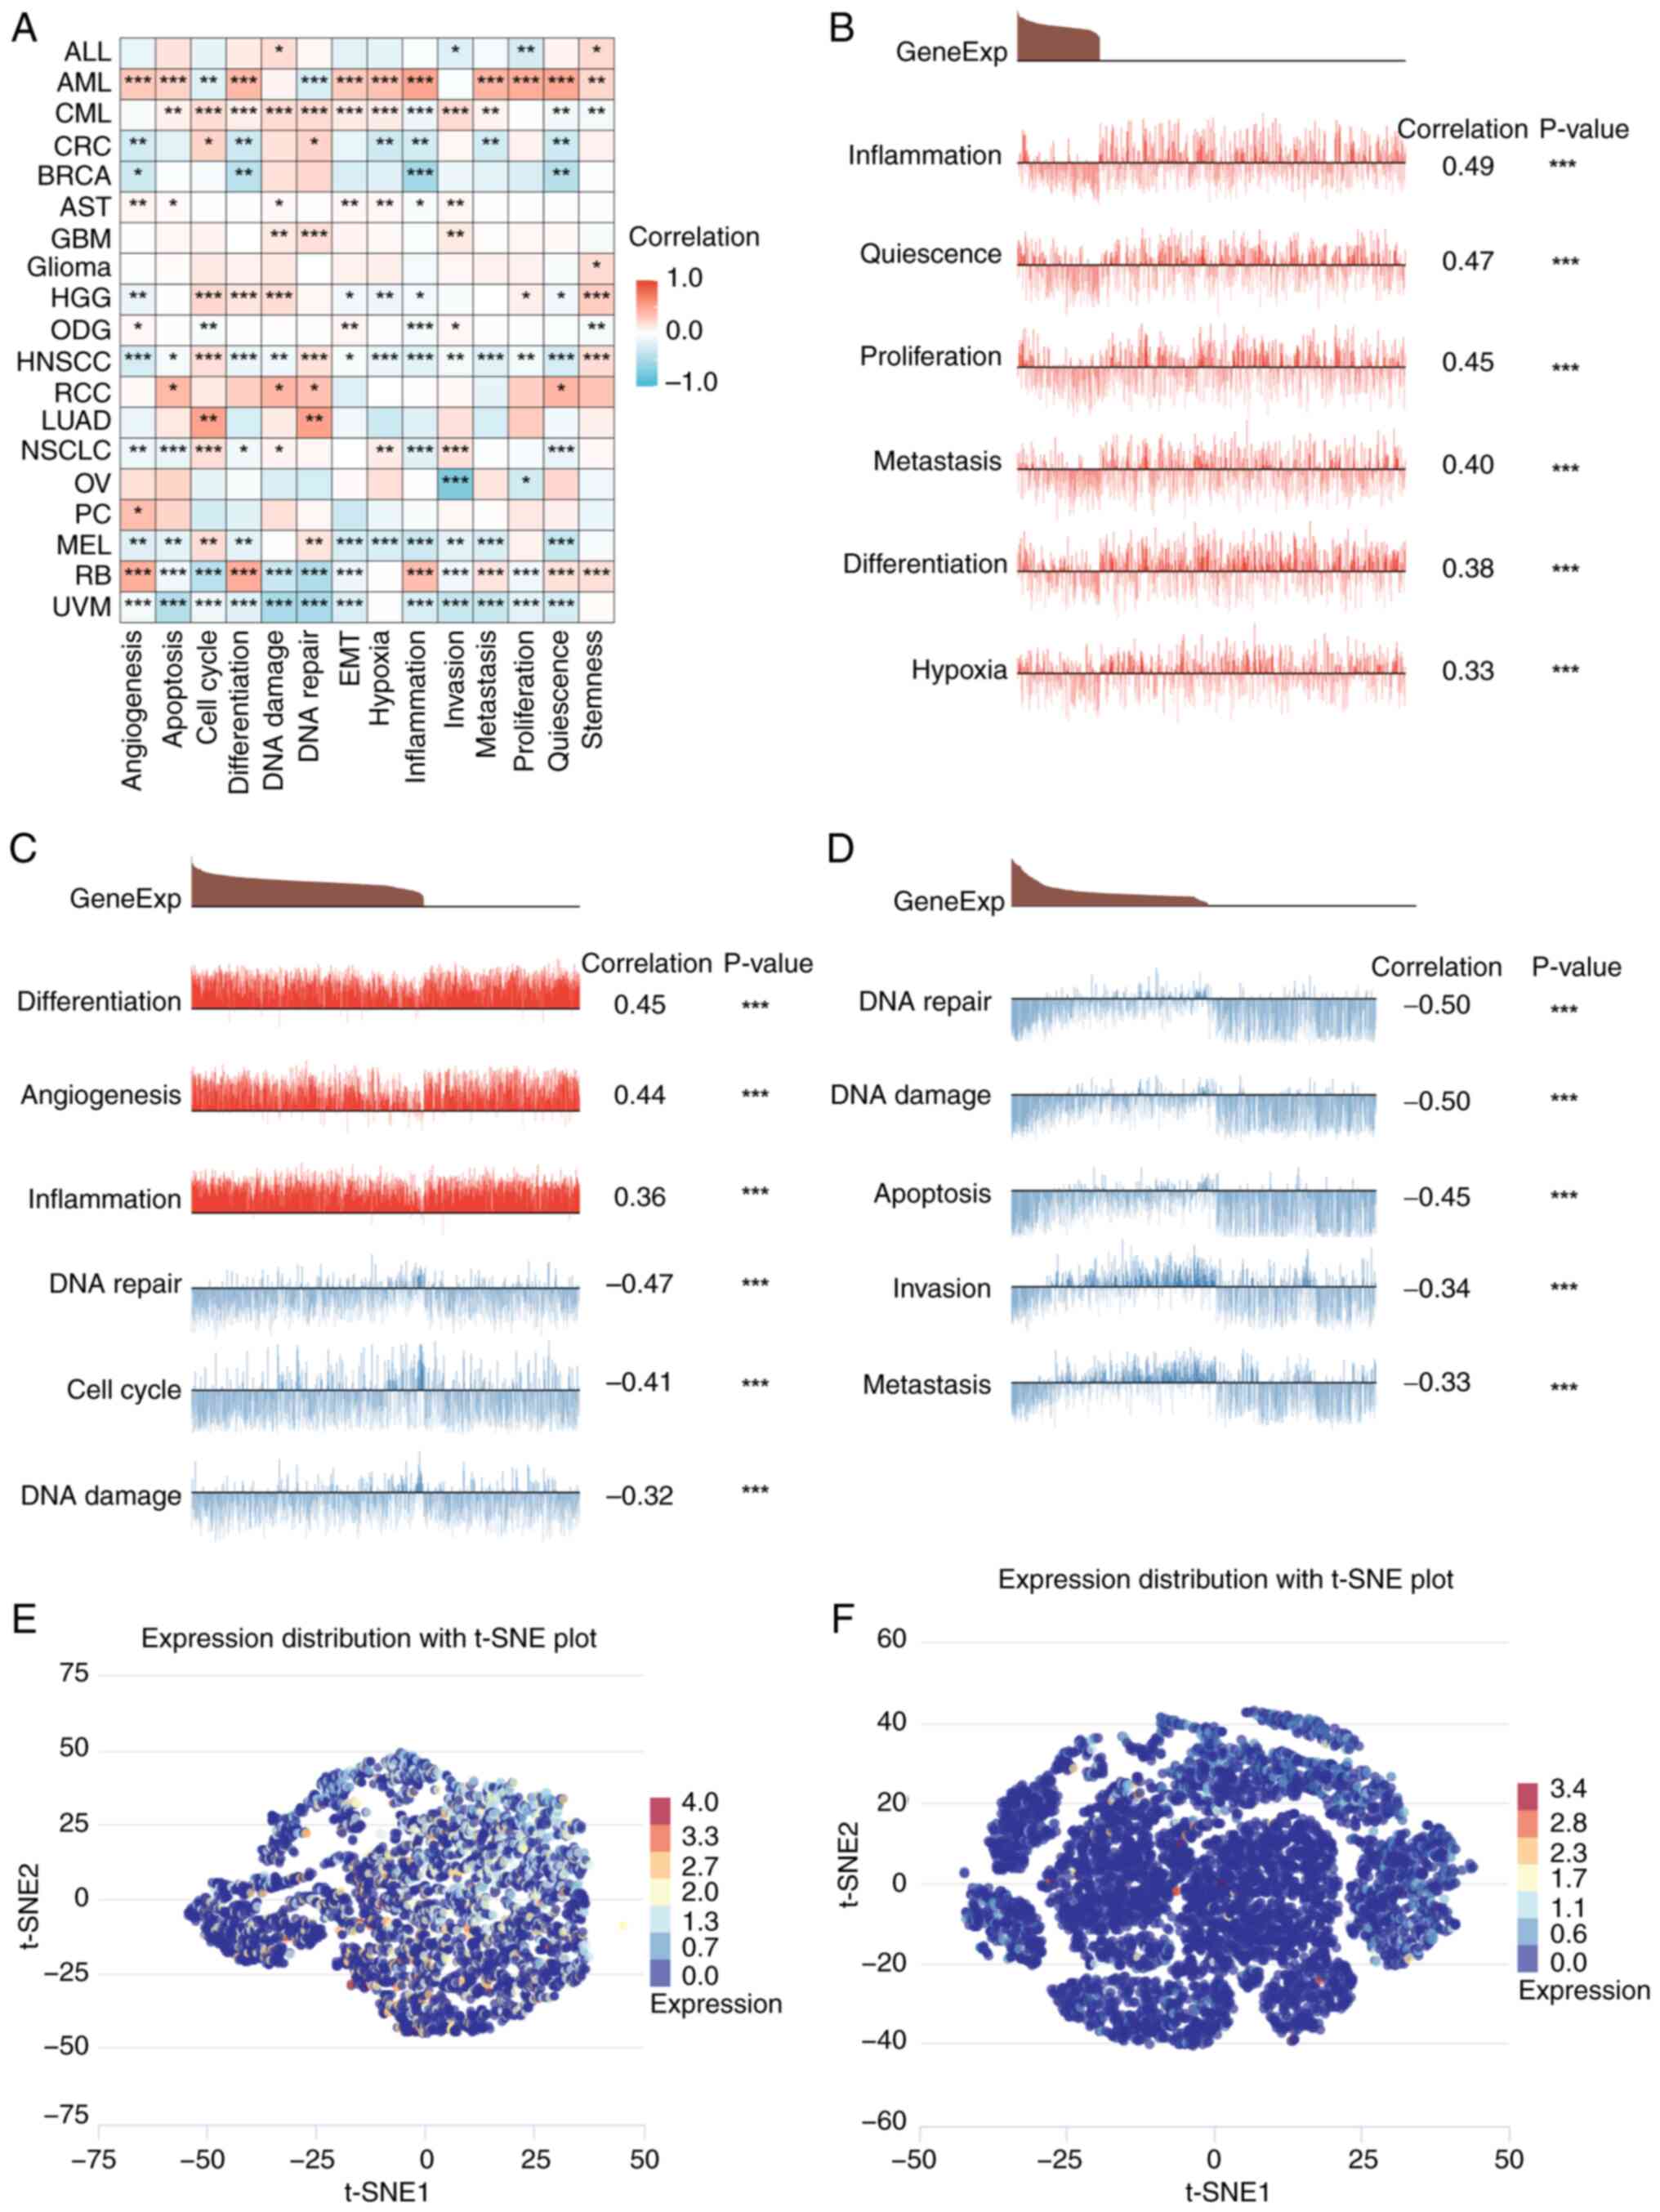
resolution. A comparative analysis of the single-cell sequencing
data of SFXN1 in pan-cancer was conducted using CancerSEA (Fig. 6A). In AML, SFXN1 expression was
positively correlated with inflammation, quiescence, proliferation,
metastasis, differentiation and hypoxia (Fig. 6B). In retinoblastoma (RB), SFXN1
expression was positively correlated with differentiation,
angiogenesis and inflammation, and negatively correlated with DNA
repair, cell cycle and DNA damage (Fig.
6C). In UVM, SFXN1 expression was negatively correlated with
DNA repair, DNA damage, apoptosis, invasion and metastasis
(Fig. 6D). In addition, the
t-distributed stochastic neighbor embedding maps show the
expression profiles of SFXN1 in RB and UVM at the single-cell level
(Fig. 6E and F).
SFXN1 expression was analyzed in various normal
cells and tissues using the HPA database. Notably, SFXN1 was
upregulated in T cells in the bone marrow, lungs, lymph nodes,
peripheral blood mononuclear cells, skin and stomach at the
single-cell level (Fig. S6).
Related genes of SFXN1 in
pan-cancer
The top 200 genes co-expressed with SFXN1 in
pan-cancer were extracted from GEPIA2.0 (Table SII). The PPI network was visualized
using Cytoscape, and the top 20 genes were identified based on
their degree values (Fig. S7).
Ultimately, a heatmap was employed to illustrate the positive
correlation between SFXN1 and the top 20 genes in pan-cancer
(Fig. S8).
Enrichment analysis of SFXN1 in
LUAD
Preliminary analysis indicated that SFXN1 could
serve as a potential biomarker for both diagnosis and prognosis in
a variety of tumor types, with significant dysregulation observed
particularly in LUAD. Consequently, an in-depth exploration of the
role of SFXN1 in LUAD was conducted. Subsequently, the
co-expression genes associated with SFXN1 in LUAD were explored
(Table SIII). The top 50 genes
positively and negatively correlated with SFXN1 were displayed as
heatmaps (Fig. S9A and B). The GO
analysis of SFXN1 co-expression genes showed that the main
physiological functions involved were ‘cell division’, ‘negative
regulation of transcription, DNA-templated’ and ‘intracellular
signal transduction’. The genes related to SFXN1 were mainly
located in the ‘nucleus’, ‘cytosol’, ‘nucleoplasm’ and ‘membrane’,
and they mainly had molecular functions such as ‘protein binding’,
‘ATP binding’, ‘protein kinase binding’ and ‘chromatin binding’
(Fig. S9C-E). The KEGG pathway
analysis revealed that SFXN1-related genes were mainly involved in
the ‘cell cycle’, ‘oocyte meiosis’, ‘glycolysis/gluconeogenesis’
and ‘p53 signaling pathway’ (Fig.
S9F).
The differentially expressed genes were analyzed by
GSEA to explore the possible pathways in which SFXN1 may
participate in LUAD. The KEGG pathways identified included ‘cell
cycle’, ‘PLK1 pathway’, ‘cell cycle checkpoints’, ‘FOXM1 pathway’,
‘G2 M checkpoints’, ‘G1 S specific transcription’, ‘mitotic spindle
checkpoint’, ‘DNA strand elongation’ and ‘DNA replication’
(Fig. S10).
GEO validation and the oncogenic role
of SFXN1 in LUAD
To confirm the mRNA expression levels of SFXN1 in
patients with LUAD, GEO was searched and a marked increase in SFXN1
expression was observed in the GSE10072 (42), GSE31908 (43) and GSE40791 (44) datasets (Fig. 7A-C). Furthermore, 35 pairs of LUAD
and adjacent non-cancerous tissues were collected to detect SFXN1
expression. The results showed that SFXN1 mRNA expression was
markedly upregulated in LUAD tissues compared with normal tissues
(P<0.01; Fig. 7D). Additionally,
the protein levels of SFXN1 in LUAD tissues were found to be higher
than those in the adjacent non-cancerous tissues (Fig. 7E).
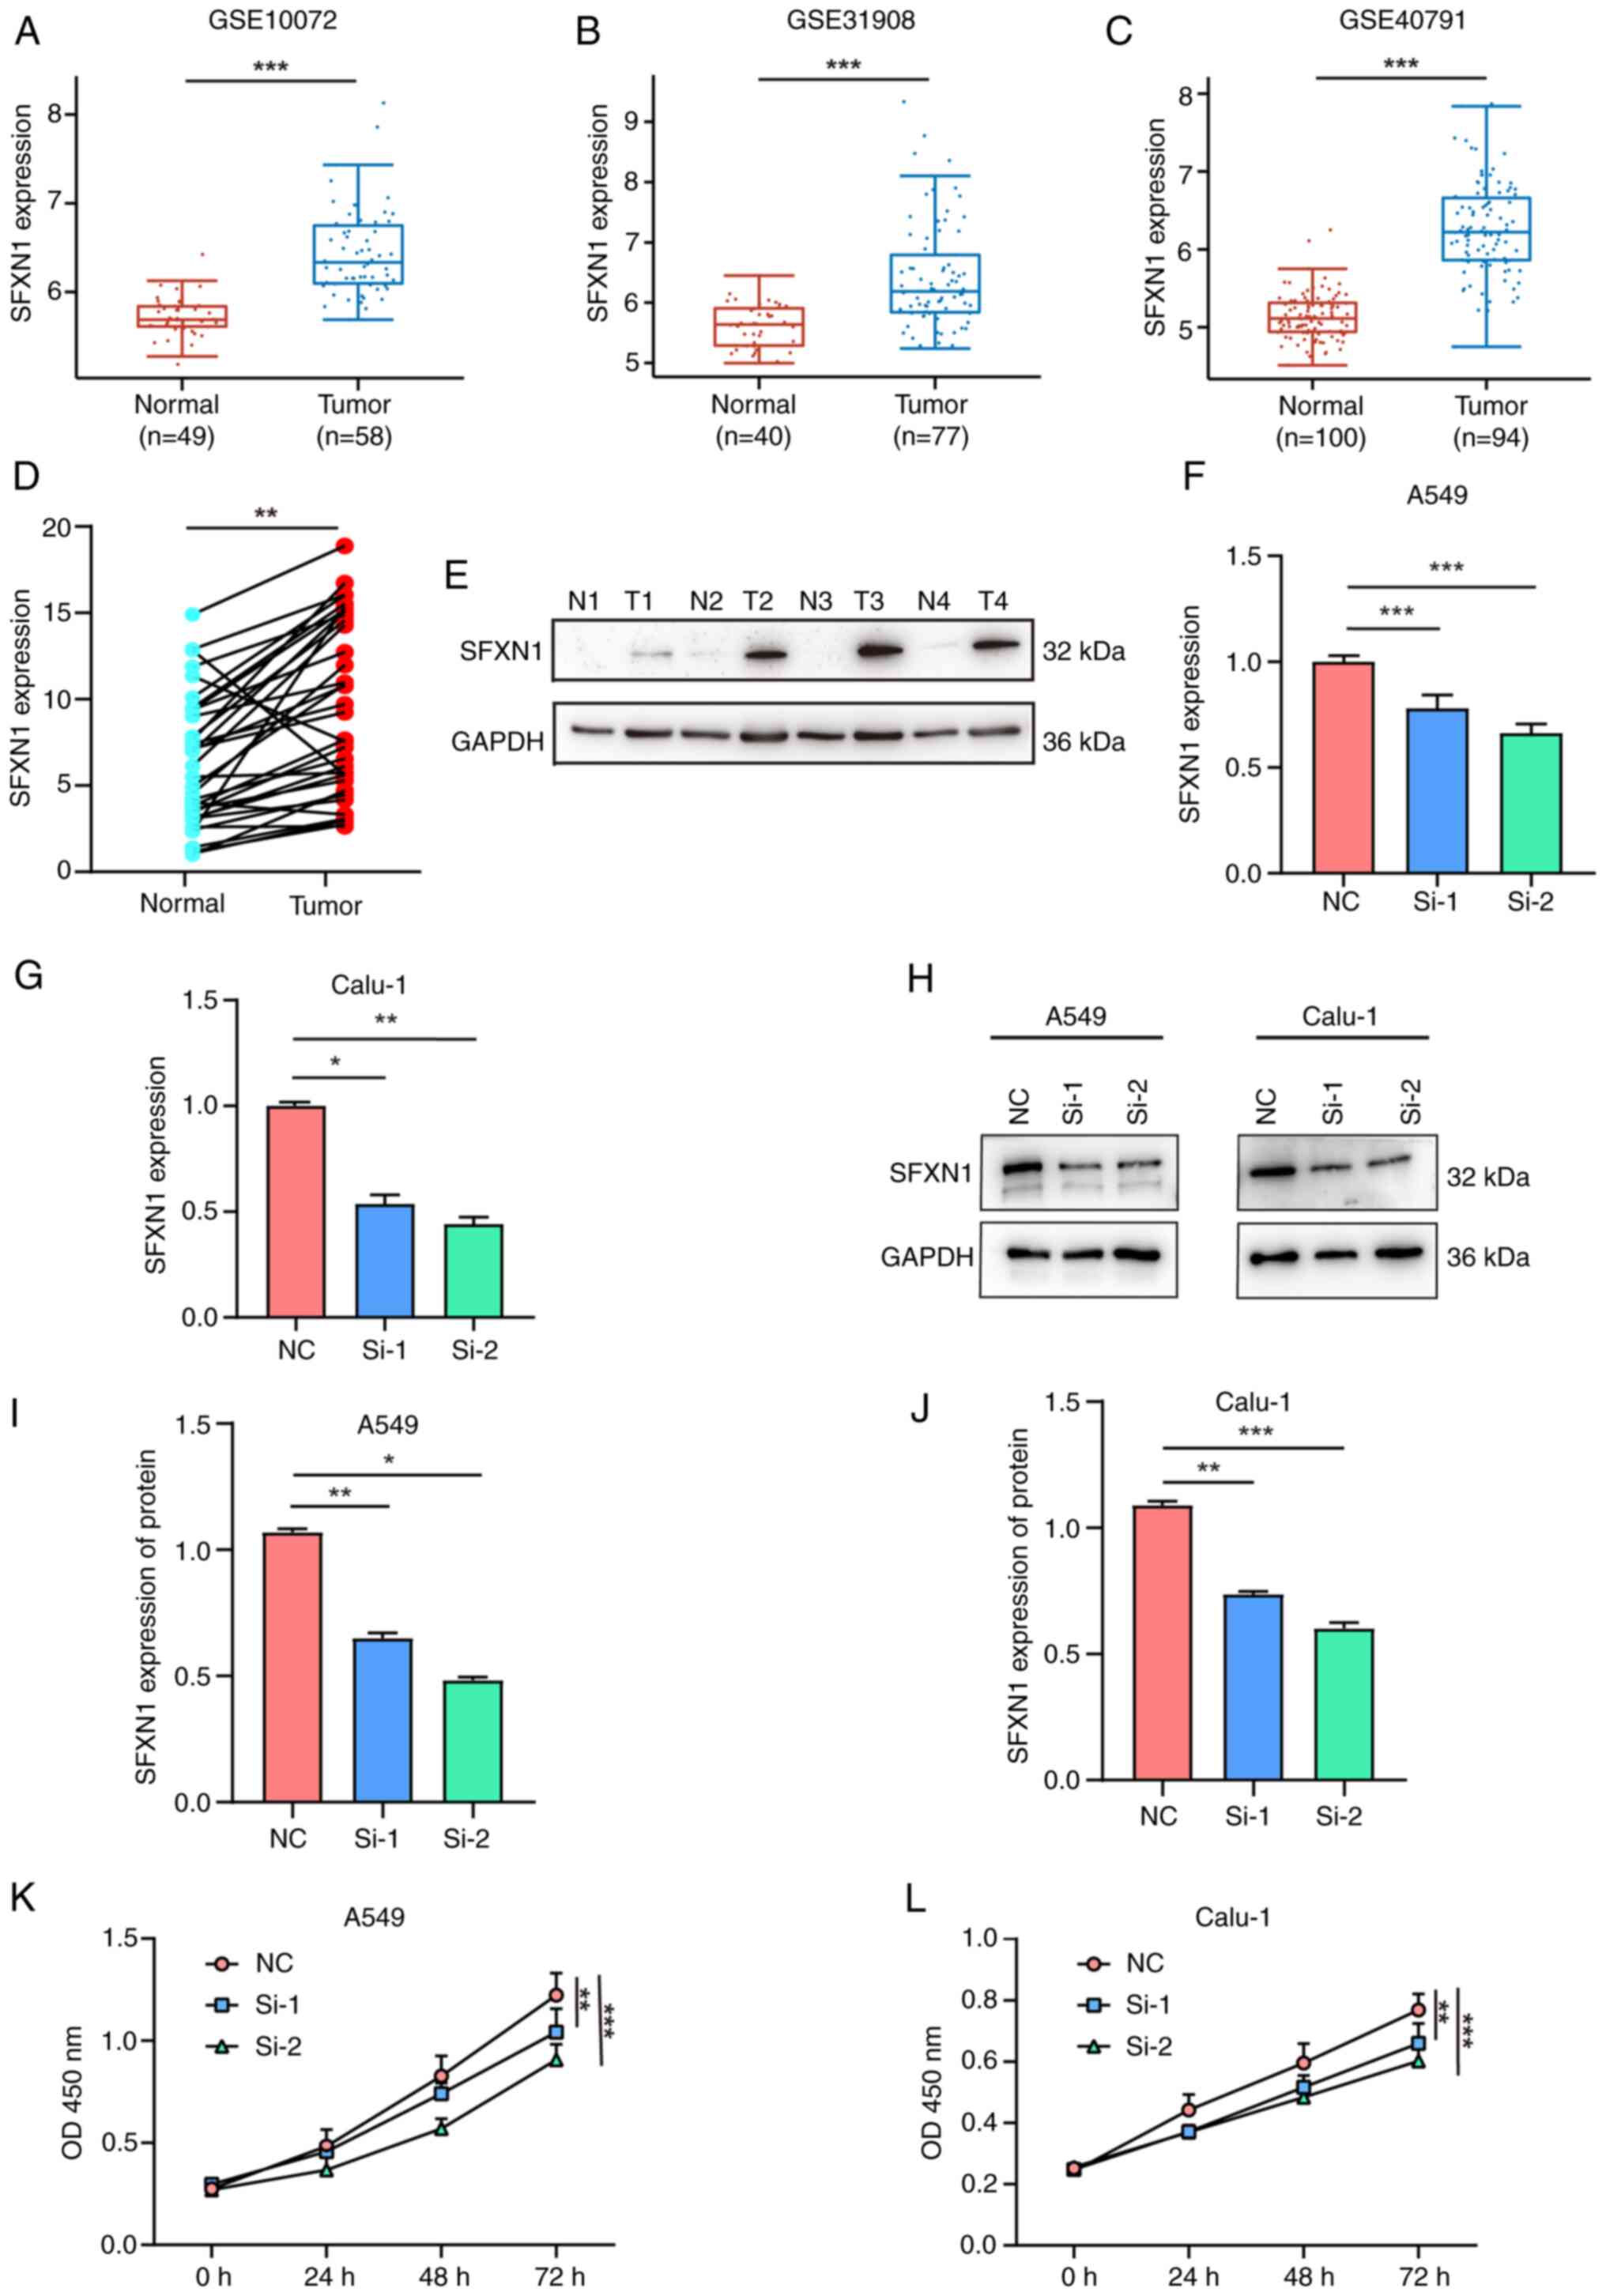 | Figure 7.Gene Expression Omnibus validation
and cell proliferation assay following SFXN1 knockdown in LUAD
cells. External validation of SFXN1 expression in LUAD samples in
(A) GSE10072, (B) GSE31908 and (C) GSE40791. (D) Reverse
transcription-quantitative PCR and (E) western blot analysis of
SFXN1 expression in human LUAD and para-cancerous tissues. (F)
Relative mRNA levels of SFXN1 in A549 cells after silencing by
siRNAs. (G) Relative mRNA levels of SFXN1 in Calu-1 cells after
silencing by siRNAs. (H) Western blot analysis of SFXN1 in A549 and
Calu-1 cells at 48 h post-transfection. (I) Relative protein levels
of SFXN1 in A549 cells. (J) Relative protein levels of SFXN1 in
Calu-1 cells. Cell proliferation following silencing of SFXN1 in
(K) A549 and (L) Calu-1 cells was examined using a Cell Counting
Kit-8 assay after transfection. *P<0.05, **P<0.01 and
***P<0.001. LUAD, lung adenocarcinoma; N, normal; T, tumor; OD,
optical density; NC, negative control; OD, optical density; SFXN1,
sideroflexin 1; siRNA, small interfering RNA; T, tumor. |
siRNAs were utilized to knock down SFXN1 expression
in lung cancer cell lines, and the transfection efficiency was
verified by RT-qPCR and western blotting. siRNA transfection
notably reduced SFXN1 expression at both the mRNA (Fig. 7F and G) and protein levels (Fig. 7H-J). Additionally, the CCK-8 cell
proliferation assay demonstrated that SFXN1 knockdown could
significantly inhibit the proliferation of A549 and Calu-1 cells
(Fig. 7K and L).
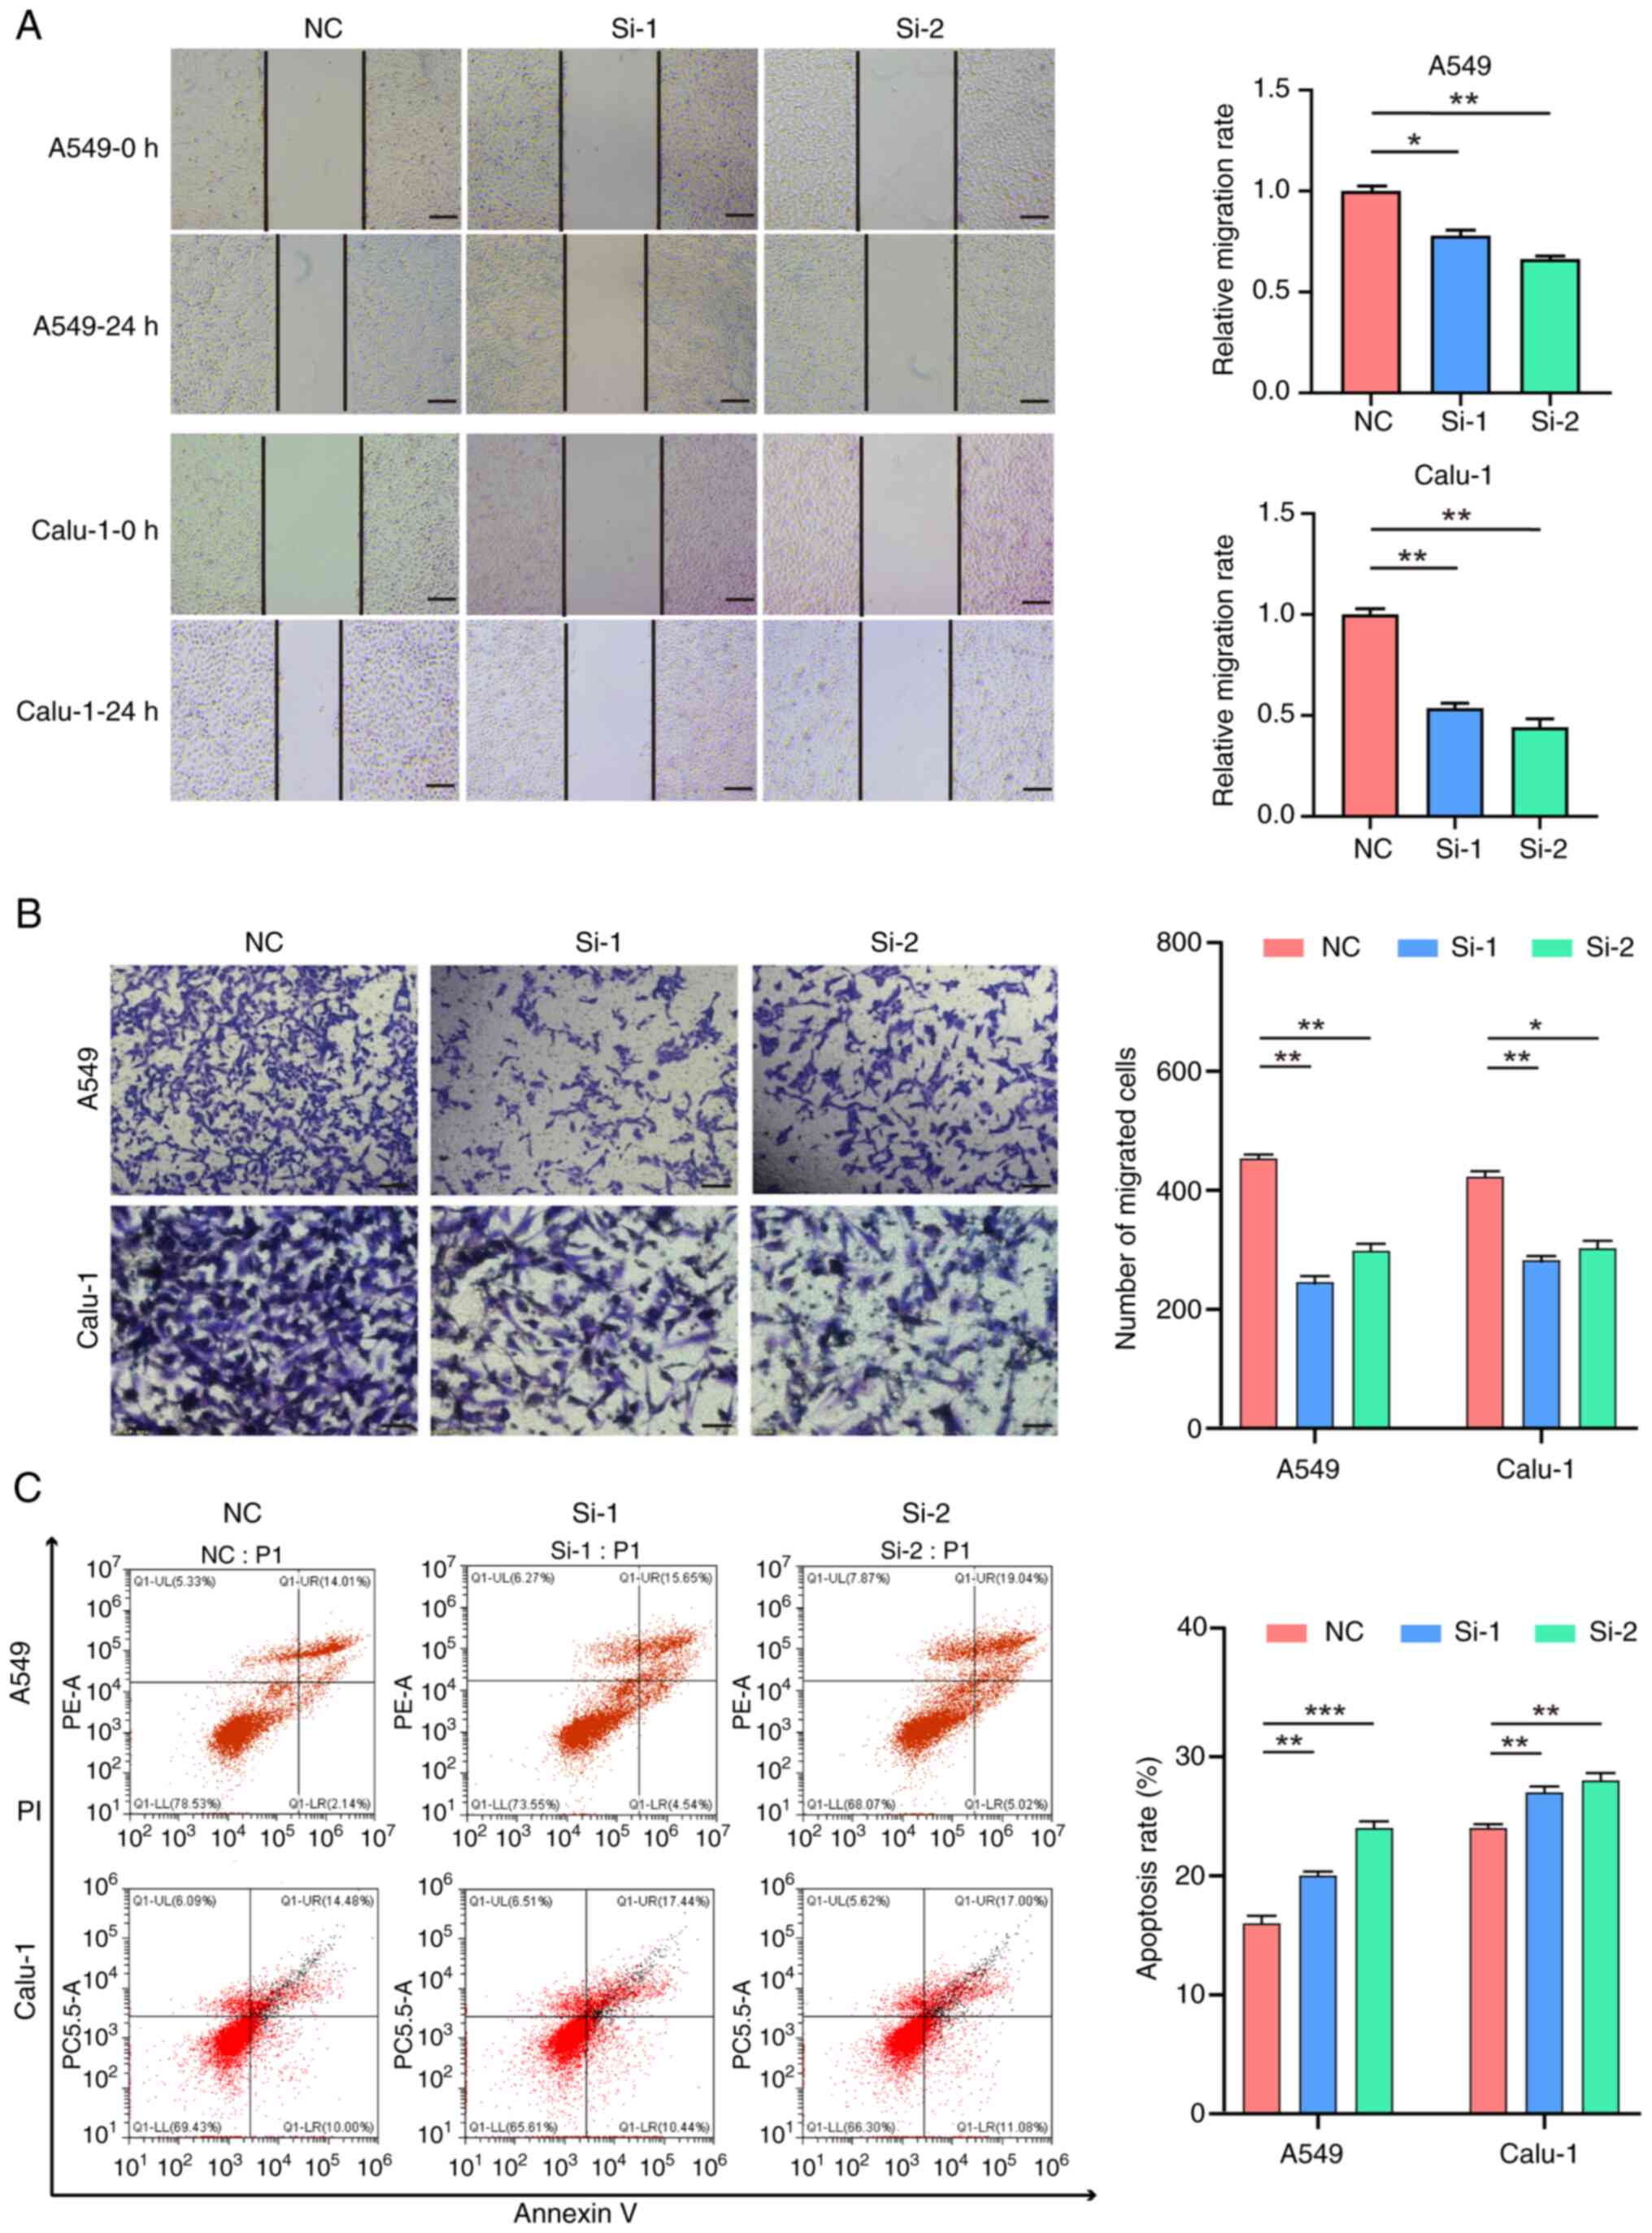
The scratch wound healing assay revealed that the
scratch widths at 48 h of the si-1 and si-2 groups were larger than
those of the control (NC) group, indicating that the knockdown of
SFXN1 diminished the wound healing capacity of A549 and Calu-1
cells (Fig. 8A). Additionally, the
Transwell assay demonstrated that silencing of SFXN1 expression
curtailed the invasion of A549 and Calu-1 cells (Fig. 8B). Finally, flow cytometry was
employed to assess cell apoptosis, and the findings indicated that
knockdown of SFXN1 expression enhanced the apoptotic rate of A549
and Calu-1 cells (Fig. 8C).
Discussion
With the rapid advancement of immunotherapy and
targeted therapy, there is an urgent need to identify novel cancer
biomarkers and explore innovative treatments strategies. SFXN1, a
member of the SFXN family, is a mitochondrial protein inserted into
the inner mitochondrial membrane. Despite its known biological
significance, the molecular functions of SFXN1 remain largely
elusive (45). It has been reported
that SFXN1 functions as a serine transporter in one-carbon
metabolism (11). The role of SFXN1
in transporting pyridoxine (vitamin B6) within the mitochondria is
supported by evidence that animals lacking SFXN1 exhibit phenotypes
resembling those of human disorders such as X-linked iron
granulocyte anemia, which are associated with pyridoxine deficiency
or ALAS2 mutations (46). In
addition, SFXN1 has been implicated in conditions such as
osteoarthritis and heart hypertrophy (47,48).
Ferroptosis, a form of programmed cell death, is dependent on iron
and driven by lipid peroxidation, marked by the accumulation of ROS
and lipid peroxides (49). SFXN1 is
involved in lipopolysaccharide-induced ferroptosis in H9C2
cardiomyocytes, although the underlying molecular mechanisms remain
to be elucidated (15). Emerging
research has indicated that SFXN1 contributes to the initiation,
progression and prognosis of BRCA (50), LUAD (51) and non-viral LIHC (14). Therefore, to gain a deeper
understanding of the role of SFXN1 in tumorigenesis and its
potential regulatory pathways, bioinformatics tools such as TCGA,
UALCAN and cBioPortal were employed to reveal the gene expression
pattern, prognostic implications, gene mutation and DNA methylation
of SFXN1 in 33 tumor types.
The tumor microenvironment (TME) encompasses the
complex milieu in which the tumor, invasive immune cells and
stromal cells coexist and interact. Research has underscored the
pivotal role of immune cell infiltration in tumor progression and
response to immunotherapy (52).
The present findings indicated that SFXN1 expression was associated
with the infiltration of CD4+ T and CD8+ T
cells. Furthermore, high SFXN1 expression in T cells at the
single-cell level indicated that SFXN1 may serve a role in T cell
immune responses. Additionally, the observed positive and negative
correlation between SFXN1 expression and the expression of immune
checkpoints implied that SFXN1 could represent a promising target
for the development of cancer immunotherapies. These insights
highlight the potential of SFXN1 as a biomarker and therapeutic
target, warranting further investigation into its mechanistic role
in modulating the TME and immune response to tumors.
Previous studies have indicated that tumors with
elevated TMB and MSI scores tend to respond more favorably to
immunotherapy (53,54). The present investigation of the
relationship between SFXN1 expression and both TMB and MSI
demonstrated a positive correlation between SFXN1 expression and
TMB and MSI scores in several tumor types. Consequently, we
hypothesized that the heightened SFXN1 expression in malignancies
might confer post-immunotherapy survival advantages to patients.
Given these findings, SFXN1 could emerge as a potential novel
therapeutic target for immunotherapy in the treatment of various
cancer types.
DNA methylation, one of the most prevalent
epigenetic modifications, serves a crucial role in carcinogenesis,
genomic stability and gene expression regulation. It has been
reported that abnormal DNA methylation can accelerate tumor growth
by modulating cell proliferation, apoptosis and senescence
(55). The present analysis using
UALCAN revealed elevated levels of SFXN1 promoter methylation in
certain tumor types, including BRCA, CESC, CHOL, ESCA, HNSC, KIRC,
KIRP, LUSC, PAAD, STAD and SARC. By contrast, a pronounced
reduction in SFXN1 promoter methylation was observed in PRAD, THCA
and TGCT. These findings suggest that the differential methylation
status of the SFXN1 promoter may exert distinct effects on tumor
biology, potentially influencing the progression and behavior of
various cancer types.
The present study identified that SFXN1 was highly
expressed in LUAD and was associated with poor prognosis, which was
one of the primary reasons for the focus on this particular cancer
type. Additionally, our research team has been dedicated to lung
cancer research for several years, bringing a wealth of expertise
and a deep understanding of the field to bear on this
investigation. The broader implications of SFXN1 in other cancer
types and the need for further research are acknowledged. The
present study lays the groundwork for future exploration of the
role of SFXN1 in LUAD and potentially other tumor types. However,
notwithstanding these findings, the present study has certain
limitations. Analyses and verifications were performed using
databases and fundamental cellular experiments, but the present
study lacks a more profound investigation of the underlying
molecular mechanisms, an aspect that should be addressed in future
studies. The confirmation through external datasets and the
examination of freshly collected paired tissues lend credibility
and reliability to the present results. These findings offer a
novel perspective for investigating the mechanisms of
tumorigenesis, progression and therapeutic response.
In conclusion, the present comprehensive pan-cancer
analysis of SFXN1 demonstrated its differential expression across
several cancer types and its significant association with OS and
DFS in patients with KIRC and MESO. These findings underscore the
potential of SFXN1 as a prognostic biomarker, offering valuable
insights for the identification of novel tumor-related therapeutic
targets. The present study not only enhances the understanding of
the role of SFXN1 in cancer but also paves the way for future
investigations aimed at harnessing its predictive capabilities for
improved patient outcomes.
Supplementary Material
Supporting Data
Supporting Data
Supporting Data
Supporting Data
Acknowledgements
Not applicable.
Funding
The present study was supported by the National Natural Science
Foundation of China (grant nos. 81800182 and 81802290).
Availability of data and materials
The data generated in the present study may be
requested from the corresponding author.
Authors' contributions
LZ, SW and LW designed and performed bioinformatics
analysis. LZ conducted cell experiments, analyzed the data and
organized the images. LZ and LW wrote and revised the paper. LZ and
LW confirm the authenticity of all the raw data. All authors read
and approved the final version of the manuscript.
Ethics approval and consent to
participate
Written informed consent was obtained from all
participants prior to the study. The Ethics Committee of the
Affiliated Hospital of Jining Medical University (Jining, China)
evaluated and approved this work (approval no. 2021-11-C009) in
accordance with the principles of The Declaration of Helsinki.
Patient consent for publication
Not applicable.
Competing interests
The authors declare that they have no competing
interests.
References
|
1
|
Sung H, Ferlay J, Siegel RL, Laversanne M,
Soerjomataram I, Jemal A and Bray F: Global cancer statistics 2020:
GLOBOCAN estimates of incidence and mortality worldwide for 36
cancers in 185 countries. CA Cancer J Clin. 71:209–249. 2021.
View Article : Google Scholar : PubMed/NCBI
|
|
2
|
Rajurkar S, Mambetsariev I, Pharaon R,
Leach B, Tan T, Kulkarni P and Salgia R: Non-small cell lung cancer
from genomics to therapeutics: A framework for community practice
integration to arrive at personalized therapy strategies. J Clin
Med. 9:18702020. View Article : Google Scholar : PubMed/NCBI
|
|
3
|
Tifoun N, De Las Heras JM, Guillaume A,
Bouleau S, Mignotte B and Le Floch N: Insights into the roles of
the sideroflexins/SLC56 family in iron homeostasis and iron-sulfur
biogenesis. Biomedicines. 9:1032021. View Article : Google Scholar : PubMed/NCBI
|
|
4
|
Miotto G, Tessaro S, Rotta GA and Bonatto
D: In silico analyses of Fsf1 sequences, a new group of fungal
proteins orthologous to the metazoan sideroblastic anemia-related
sideroflexin family. Fungal Genet Biol. 44:740–753. 2007.
View Article : Google Scholar : PubMed/NCBI
|
|
5
|
Burgos-Barragan G, Wit N, Meiser J,
Dingler FA, Pietzke M, Mulderrig L, Pontel LB, Rosado IV, Brewer
TF, Cordell RL, et al: Mammals divert endogenous genotoxic
formaldehyde into one-carbon metabolism. Nature. 548:549–554. 2017.
View Article : Google Scholar : PubMed/NCBI
|
|
6
|
Ducker GS and Rabinowitz JD: One-carbon
metabolism in health and disease. Cell Metab. 25:27–42. 2017.
View Article : Google Scholar : PubMed/NCBI
|
|
7
|
Fu TF, Rife JP and Schirch V: The role of
serine hydroxymethyltransferase isozymes in one-carbon metabolism
in MCF-7 cells as determined by (13)C NMR. Arch Biochem Biophys.
393:42–50. 2001. View Article : Google Scholar : PubMed/NCBI
|
|
8
|
Rivell A, Petralia RS, Wang YX, Mattson MP
and Yao PJ: Sideroflexin 3 is a mitochondrial protein enriched in
neurons. Neuromolecular Med. 21:314–321. 2019. View Article : Google Scholar : PubMed/NCBI
|
|
9
|
Mon EE, Wei FY, Ahmad RNR, Yamamoto T,
Moroishi T and Tomizawa K: Regulation of mitochondrial iron
homeostasis by sideroflexin 2. J Physiol Sci. 69:359–373. 2019.
View Article : Google Scholar : PubMed/NCBI
|
|
10
|
Fleming MD, Campagna DR, Haslett JN,
Trenor CC III and Andrews NC: A mutation in a mitochondrial
transmembrane protein is responsible for the pleiotropic
hematological and skeletal phenotype of flexed-tail (f/f) mice.
Genes Dev. 15:652–657. 2001. View Article : Google Scholar : PubMed/NCBI
|
|
11
|
Kory N, Wyant GA, Prakash G, Uit de Bos J,
Bottanelli F, Pacold ME, Chan SH, Lewis CA, Wang T, Keys HR, et al:
SFXN1 is a mitochondrial serine transporter required for one-carbon
metabolism. Science. 362:eaat95282018. View Article : Google Scholar : PubMed/NCBI
|
|
12
|
Weston C, Klobusicky J, Weston J, Connor
J, Toms SA and Marko NF: Aberrations in the iron regulatory gene
signature are associated with decreased survival in diffuse
infiltrating gliomas. PLoS One. 11:e01665932016. View Article : Google Scholar : PubMed/NCBI
|
|
13
|
Chen Q, Wang R, Zhang J and Zhou L:
Sideroflexin1 as a novel tumor marker independently predicts
survival in lung adenocarcinoma. Transl Cancer Res. 8:1170–1178.
2019. View Article : Google Scholar : PubMed/NCBI
|
|
14
|
Yagi K, Shimada S, Akiyama Y, Hatano M,
Asano D, Ishikawa Y, Ueda H, Watanabe S, Akahoshi K, Ono H, et al:
Loss of SFXN1 mitigates lipotoxicity and predicts poor outcome in
non-viral hepatocellular carcinoma. Sci Rep. 13:94492023.
View Article : Google Scholar : PubMed/NCBI
|
|
15
|
Li N, Wang W, Zhou H, Wu Q, Duan M, Liu C,
Wu H, Deng W, Shen D and Tang Q: Ferritinophagy-mediated
ferroptosis is involved in sepsis-induced cardiac injury. Free
Radic Biol Med. 160:303–318. 2020. View Article : Google Scholar : PubMed/NCBI
|
|
16
|
Navani S: Manual evaluation of tissue
microarrays in a high-throughput research project: The contribution
of Indian surgical pathology to the human protein atlas (HPA)
project. Proteomics. 16:1266–1270. 2016. View Article : Google Scholar : PubMed/NCBI
|
|
17
|
Tomczak K, Czerwińska P and Wiznerowicz M:
The cancer genome atlas (TCGA): An immeasurable source of
knowledge. Contemp Oncol (Pozn). 19:A68–A77. 2015.PubMed/NCBI
|
|
18
|
Li T, Fan J, Wang B, Traugh N, Chen Q, Liu
JS, Li B and Liu XS: TIMER: A web server for comprehensive analysis
of tumor-infiltrating immune cells. Cancer Res. 77:e108–e110. 2017.
View Article : Google Scholar : PubMed/NCBI
|
|
19
|
Liu RZ, Graham K, Glubrecht DD, Germain
DR, Mackey JR and Godbout R: Association of FABP5 expression with
poor survival in triple-negative breast cancer: Implication for
retinoic acid therapy. Am J Pathol. 178:997–1008. 2011. View Article : Google Scholar : PubMed/NCBI
|
|
20
|
Ryan BM, Zanetti KA, Robles AI, Schetter
AJ, Goodman J, Hayes RB, Huang WY, Gunter MJ, Yeager M, Burdette L,
et al: Germline variation in NCF4, an innate immunity gene, is
associated with an increased risk of colorectal cancer. Int J
Cancer. 134:1399–1407. 2014. View Article : Google Scholar : PubMed/NCBI
|
|
21
|
Nicolau-Neto P, Da Costa NM, de Souza
Santos PT, Gonzaga IM, Ferreira MA, Guaraldi S, Moreira MA, Seuánez
HN, Brewer L, Bergmann A, et al: Esophageal squamous cell carcinoma
transcriptome reveals the effect of FOXM1 on patient outcome
through novel PIK3R3 mediated activation of PI3K signaling pathway.
Oncotarget. 9:16634–16647. 2018. View Article : Google Scholar : PubMed/NCBI
|
|
22
|
Verduci L, Ferraiuolo M, Sacconi A, Ganci
F, Vitale J, Colombo T, Paci P, Strano S, Macino G, Rajewsky N and
Blandino G: The oncogenic role of circPVT1 in head and neck
squamous cell carcinoma is mediated through the mutant p53/YAP/TEAD
transcription-competent complex. Genome Biol. 18:2372017.
View Article : Google Scholar : PubMed/NCBI
|
|
23
|
Nazarov PV, Muller A, Kaoma T, Nicot N,
Maximo C, Birembaut P, Tran NL, Dittmar G and Vallar L: RNA
sequencing and transcriptome arrays analyses show opposing results
for alternative splicing in patient derived samples. BMC Genomics.
18:4432017. View Article : Google Scholar : PubMed/NCBI
|
|
24
|
Selamat SA, Chung BS, Girard L, Zhang W,
Zhang Y, Campan M, Siegmund KD, Koss MN, Hagen JA, Lam WL, et al:
Genome-scale analysis of DNA methylation in lung adenocarcinoma and
integration with mRNA expression. Genome Res. 22:1197–1211. 2012.
View Article : Google Scholar : PubMed/NCBI
|
|
25
|
Pei H, Li L, Fridley BL, Jenkins GD,
Kalari KR, Lingle W, Petersen G, Lou Z and Wang L: FKBP51 affects
cancer cell response to chemotherapy by negatively regulating Akt.
Cancer Cell. 16:259–266. 2009. View Article : Google Scholar : PubMed/NCBI
|
|
26
|
Cui J, Chen Y, Chou WC, Sun L, Chen L, Suo
J, Ni Z, Zhang M, Kong X, Hoffman LL, et al: An integrated
transcriptomic and computational analysis for biomarker
identification in gastric cancer. Nucleic Acids Res. 39:1197–1207.
2011. View Article : Google Scholar : PubMed/NCBI
|
|
27
|
Chandrashekar DS, Karthikeyan SK, Korla
PK, Patel H, Shovon AR, Athar M, Netto GJ, Qin ZS, Kumar S, Manne
U, et al: UALCAN: An update to the integrated cancer data analysis
platform. Neoplasia. 25:18–27. 2022. View Article : Google Scholar : PubMed/NCBI
|
|
28
|
Chandrashekar DS, Bashel B, Balasubramanya
SAH, Creighton CJ, Ponce-Rodriguez I, Chakravarthi BVSK and
Varambally S: UALCAN: A portal for facilitating tumor subgroup gene
expression and survival analyses. Neoplasia. 19:649–658. 2017.
View Article : Google Scholar : PubMed/NCBI
|
|
29
|
Lánczky A and Győrffy B: Web-based
survival analysis tool tailored for medical research (KMplot):
Development and implementation. J Med Internet Res. 23:e276332021.
View Article : Google Scholar : PubMed/NCBI
|
|
30
|
Tang Z, Li C, Kang B, Gao G, Li C and
Zhang Z: GEPIA: A web server for cancer and normal gene expression
profiling and interactive analyses. Nucleic Acids Res. 45((W1)):
W98–W102. 2017. View Article : Google Scholar : PubMed/NCBI
|
|
31
|
Gao J, Aksoy BA, Dogrusoz U, Dresdner G,
Gross B, Sumer SO, Sun Y, Jacobsen A, Sinha R, Larsson E, et al:
Integrative analysis of complex cancer genomics and clinical
profiles using the cBioPortal. Sci Signal. 6:pl12013. View Article : Google Scholar : PubMed/NCBI
|
|
32
|
Cao J, Yang X, Chen S, Wang J, Fan X, Fu S
and Yang L: The predictive efficacy of tumor mutation burden in
immunotherapy across multiple cancer types: A meta-analysis and
bioinformatics analysis. Transl Oncol. 20:1013752022. View Article : Google Scholar : PubMed/NCBI
|
|
33
|
Fumet JD, Truntzer C, Yarchoan M and
Ghiringhelli F: Tumour mutational burden as a biomarker for
immunotherapy: Current data and emerging concepts. Eur J Cancer.
131:40–50. 2020. View Article : Google Scholar : PubMed/NCBI
|
|
34
|
Ansari A, Ray SK, Sharma M, Rawal R and
Singh P: Tumor mutational burden as a biomarker of immunotherapy
response: An immunogram approach in onco-immunology. Curr Mol Med.
24:1461–1469. 2024. View Article : Google Scholar : PubMed/NCBI
|
|
35
|
Strickler JH, Hanks BA and Khasraw M:
Tumor mutational burden as a predictor of immunotherapy response:
Is more always better? Clin Cancer Res. 27:1236–1241. 2021.
View Article : Google Scholar : PubMed/NCBI
|
|
36
|
Steuer CE and Ramalingam SS: Tumor
mutation burden: Leading immunotherapy to the era of precision
medicine? J Clin Oncol. 36:631–632. 2018. View Article : Google Scholar : PubMed/NCBI
|
|
37
|
Yang G, Zheng RY and Jin ZS: Correlations
between microsatellite instability and the biological behaviour of
tumours. J Cancer Res Clin Oncol. 145:2891–2899. 2019. View Article : Google Scholar : PubMed/NCBI
|
|
38
|
Yuan H, Yan M, Zhang G, Liu W, Deng C,
Liao G, Xu L, Luo T, Yan H, Long Z, et al: CancerSEA: A cancer
single-cell state atlas. Nucleic Acids Res. 47(D1): D900–D908.
2019. View Article : Google Scholar : PubMed/NCBI
|
|
39
|
Huang da W, Sherman BT and Lempicki RA:
Systematic and integrative analysis of large gene lists using DAVID
bioinformatics resources. Nat Protoc. 4:44–57. 2009. View Article : Google Scholar : PubMed/NCBI
|
|
40
|
Schag CC, Heinrich RL and Ganz PA:
Karnofsky performance status revisited: Reliability, validity, and
guidelines. J Clin Oncol. 2:187–193. 1984. View Article : Google Scholar : PubMed/NCBI
|
|
41
|
Livak KJ and Schmittgen TD: Analysis of
relative gene expression data using real-time quantitative PCR and
the 2(-Delta Delta C(T)) method. Methods. 25:402–408. 2001.
View Article : Google Scholar : PubMed/NCBI
|
|
42
|
Landi MT, Dracheva T, Rotunno M, Figueroa
JD, Liu H, Dasgupta A, Mann FE, Fukuoka J, Hames M, Bergen AW, et
al: Gene expression signature of cigarette smoking and its role in
lung adenocarcinoma development and survival. PLoS One.
3:e16512008. View Article : Google Scholar : PubMed/NCBI
|
|
43
|
Wu J, Zhou L, Huang L, Gu J, Li S, Liu B,
Feng J and Zhou Y: Nomogram integrating gene expression signatures
with clinicopathological features to predict survival in operable
NSCLC: A pooled analysis of 2164 patients. J Exp Clin Cancer Res.
36:42017. View Article : Google Scholar : PubMed/NCBI
|
|
44
|
Zhang Y, Foreman O, Wigle DA, Kosari F,
Vasmatzis G, Salisbury JL, van Deursen J and Galardy PJ: USP44
regulates centrosome positioning to prevent aneuploidy and suppress
tumorigenesis. J Clin Invest. 122:4362–4374. 2012. View Article : Google Scholar : PubMed/NCBI
|
|
45
|
Acoba MG, Alpergin ESS, Renuse S,
Fernández-Del-Río L, Lu YW, Khalimonchuk O, Clarke CF, Pandey A,
Wolfgang MJ and Claypool SM: The mitochondrial carrier SFXN1 is
critical for complex III integrity and cellular metabolism. Cell
Rep. 34:1088692021. View Article : Google Scholar : PubMed/NCBI
|
|
46
|
Ye X, Xu J, Cheng C, Yin G, Zeng L, Ji C,
Gu S, Xie Y and Mao Y: Isolation and characterization of a novel
human putative anemia-related gene homologous to mouse
sideroflexin. Biochem Genet. 41:119–125. 2003. View Article : Google Scholar : PubMed/NCBI
|
|
47
|
Tang M, Huang Z, Luo X, Liu M, Wang L, Qi
Z, Huang S, Zhong J, Chen JX, Li L, et al: Ferritinophagy
activation and sideroflexin1-dependent mitochondria iron overload
is involved in apelin-13-induced cardiomyocytes hypertrophy. Free
Radic Biol Med. 134:445–457. 2019. View Article : Google Scholar : PubMed/NCBI
|
|
48
|
Huang H, Zheng J, Shen N, Wang G, Zhou G,
Fang Y, Lin J and Zhao J: Identification of pathways and genes
associated with synovitis in osteoarthritis using bioinformatics
analyses. Sci Rep. 8:100502018. View Article : Google Scholar : PubMed/NCBI
|
|
49
|
Dixon SJ, Lemberg KM, Lamprecht MR, Skouta
R, Zaitsev EM, Gleason CE, Patel DN, Bauer AJ, Cantley AM, Yang WS,
et al: Ferroptosis: an iron-dependent form of nonapoptotic cell
death. Cell. 149:1060–1072. 2012. View Article : Google Scholar : PubMed/NCBI
|
|
50
|
Andriani L, Ling YX, Yang SY, Zhao Q, Ma
XY, Huang MY, Zhang YL, Zhang FL, Li DQ and Shao ZM: Sideroflexin-1
promotes progression and sensitivity to lapatinib in
triple-negative breast cancer by inhibiting TOLLIP-mediated
autophagic degradation of CIP2A. Cancer Lett. 597:2170082024.
View Article : Google Scholar : PubMed/NCBI
|
|
51
|
Li Y, Yang W, Liu C, Zhou S, Liu X, Zhang
T, Wu L, Li X, Zhang J and Chang E: SFXN1-mediated immune cell
infiltration and tumorigenesis in lung adenocarcinoma: A potential
therapeutic target. Int Immunopharmacol. 132:1119182024. View Article : Google Scholar : PubMed/NCBI
|
|
52
|
Sadeghi Rad H, Monkman J, Warkiani ME,
Ladwa R, O'Byrne K, Rezaei N and Kulasinghe A: Understanding the
tumor microenvironment for effective immunotherapy. Med Res Rev.
41:1474–1498. 2021. View Article : Google Scholar : PubMed/NCBI
|
|
53
|
Filipovic A, Miller G and Bolen J:
Progress toward identifying exact proxies for predicting response
to immunotherapies. Front Cell Dev Biol. 8:1552020. View Article : Google Scholar : PubMed/NCBI
|
|
54
|
Reck M, Schenker M, Lee KH, Provencio M,
Nishio M, Lesniewski-Kmak K, Sangha R, Ahmed S, Raimbourg J, Feeney
K, et al: Nivolumab plus ipilimumab versus chemotherapy as
first-line treatment in advanced non-small-cell lung cancer with
high tumour mutational burden: Patient-reported outcomes results
from the randomised, open-label, phase III CheckMate 227 trial. Eur
J Cancer. 116:137–147. 2019. View Article : Google Scholar : PubMed/NCBI
|
|
55
|
Pfeifer GP: Defining driver DNA
methylation changes in human cancer. Int J Mol Sci. 19:11662018.
View Article : Google Scholar : PubMed/NCBI
|