Introduction
Nutrition plays a crucial role in the growth of
healthy children and is even more critical for pediatric patients
to help increase response to treatment, reduce morbidity and
mortality, improve quality of life, and reduce treatment costs.
Malnutrition in inpatients is relatively common due to a number of
influencing factors, such as the inflammatory response, reduced
nutrient intake, increased metabolic requirements, malabsorption
and psychosocial issues. These conditions may be related to acute
conditions (trauma, burns, infections) or chronic conditions
(cancer, chronic kidney disease, heart failure, inflammatory bowel
disease, neurological disease (1).
Anthropometric indexes are an integral part of
screening and assessment of the nutritional status (2). The use of appropriate tools, accurate
measurement techniques and appropriate reference data are necessary
for the collection and interpretation of anthropometric indexes.
However, there are a number of challenges associated with the
measurement of anthropometric indexes in inpatients due to disease
severity, associated technical interventions such as respiratory
support, hemodynamics, or clinical situations, such as trauma,
burns and casts. Therefore, anthropometric indexes, such as weight,
or height are sometimes based solely on a doctor's estimation or
information provided by parents/caregivers, and may be affected by
the fluid status of the body. By contrast, mid-upper arm
circumference (MUAC) is a simple, low-cost and objective method of
assessing nutritional status that has been widely used in the
community to detect malnutrition. A recent consensus statement by
the Academy of Nutrition and Dietetics/American Society for
Parenteral and Enteral Nutrition (AND/ASPEN) on the indicators
recommended for the detection of childhood undernutrition admits
that ‘MUAC is the predicted mortality with a higher sensitivity
than the weight for height in malnourished pediatric patients’
(3,4). Nonetheless, the detection of
malnutrition in the hospital by anthropometric indexes is still
limited; thus, MUAC can be considered as an index for the screening
and monitoring of the nutritional status. Therefore, the present
study was conducted with the aim of investigating the correlation
between the MUAC z-score and the anthropometric indexes, weight and
height, in assessing the nutritional status of pediatric
inpatients.
Patients and methods
Subjects
The present study was conducted on 500 pediatric
inpatients from 2 to 60 months of age who were treated at the
Vietnam National Hospital of Pediatrics (Hanoi, Vietnam) between
August, 2021 and August, 2022. The exclusion criteria include
patients with physical restrictions that precluded the determine of
standing height or recumbent length. All guardians/parents of the
children were explained about the purpose of the study and were
required to sign the consent forms. Children information was kept
completely confidential and used for research purposes only. The
present study was conducted after the research protocol was
approved by the Vietnam National Hospital of Pediatrics (Decision
no. 646/BVNTW-HDDD).
Data collection
The nutritional status of the children was assessed
through data collection using measurement methods based on the WHO
2006 guidelines. The nutritional status was then classified based
on the z-score according to the WHO 2006 guidelines (5) as follows: i) Weight was measured
using the UNICEF SECA floor scale to measure the weight of the
pediatric inpatients (weighing accuracy, 100 g); ii) recumbent
length was obtained in infants up to 24 months of age (6); iii) standing height was determined in
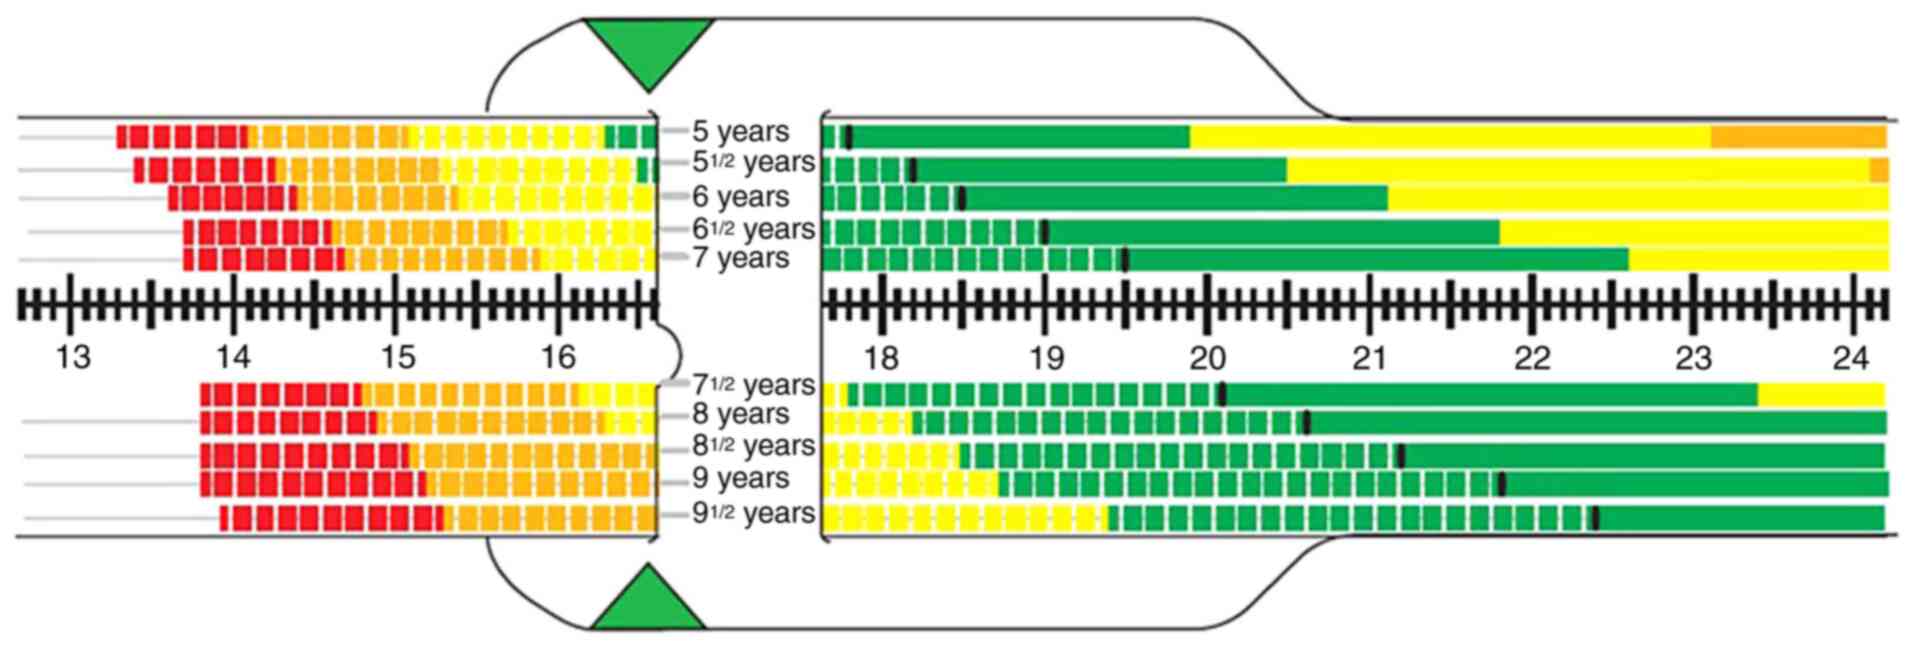
children >24 months of age; iv) MUAC was measured using tape
provided by the Clinical Nutrition Center of the Vietnam National
Hospital of Pediatrics; this was used to measure the MUAC in cm and
the z-score (MUAC accuracy, 1 mm). The midpoint of the arm was
deemed as the midpoint of the segment from the sacral process to
the superior process of the humerus; the midpoint was marked, and
the tension of the ruler was then adjusted, not too tight or too
loose. The color range corresponding to the age of the patient was
determined. The MUAC and z-score results were then read.
Anthropometric data (z-core results) were processed using WHO 2006
Anthro software (version 3.2, a web link for Anthro version 3.2
software: https://who-anthro.software.informer.com/3.2/#google_vignette).
The MUAC measurements are illustrated in Fig. 1.
Statistical analysis
Statistical analysis was performed using SPSS 20.0
software (IBM Corp.). Descriptive statistics of frequencies and
percentages were used to describe qualitative variables.
Quantitative variables are presented as the mean ± standard
deviation. The Kappa coefficient and Pearson's correlation
coefficient (r) were used to determine the correlation between the
MUAC z-score and other anthropometric indexes. With the coefficient
r, r#x003C;0.25 was considered to indicate a weak correlation,
r=0.25-0.5 a moderate correlation, r=0.5-0.75 a strong correlation,
and r≥0.75 to indicate a very strong correlation. With the Kappa
coefficient, ≤0.2 was considered to indicate a slight consensus;
0.21-0.40 a fair consensus, 0.41-0.60 a moderate consensus,
0.61-0.80 a substantial consensus, and 0.81-1.00 to indicate a
perfect consensus. Receiver operating characteristic (ROC) curve
analysis for the MUAC z-score was performed based on weight/height
≥-2SD. Non-malnourished children were defined as having positive
results. The area under the ROC curve (AUC) was calculated to
compare the classification ability of the new index. The optimal
MUAC z-score cut-off score was determined based on the highest
sensitivity and specificity. An AUC from 0.5-0.6 was considered
unsatisfactory, an AUC from 0.6-0.7 was considered satisfactory, an
AUC from 0.7-0.8 was considered good, an AUC from 0.8-0.9 was
considered very good, and an AUC of >0.9 was considered
excellent. In all analytical results, a value of P#x003C;0.05 was
considered to indicate a statistically significant difference.
Results
The general characteristics of the 500 pediatric
inpatients participating in the study are presented in Table I. In terms of sex, the percentage
of boys was greater than that of girls (at 59.6 and 40.4%,
respectively). The median age of the study subjects was 17 months.
The mean age of the children in the study group was 21.4±16.6
months. The age group of #x003C;12 months accounted for the highest
rate, at 40.4% (Table I).
 | Table IGeneral characteristics of the study
subjects (n=500). |
Table I
General characteristics of the study
subjects (n=500).
| General
characteristics | No. of patients | % |
|---|
| Sex | | |
|
Male | 298 | 59.6 |
|
Female | 202 | 40.4 |
| Age group | | |
|
1-#x003C;12
months | 202 | 40.4 |
|
12-24
months | 113 | 22.6 |
|
25-60
months | 185 | 37 |
| Mean ± SD | 21,4±16.6 |
|
(minimum-maximum) | (2-59) |
The nutritional status of the pediatric inpatients
according to anthropometric indexes is presented in Table II. Of note, as regards weight for
age, 20.8% of the patients were underweight, and 1.8% of the
patients were overweight and obese. As regards weight for height,
14% of the patients were classified as wasting, and 5.4% of the
patients were classified as overweight and obese. For height for
age, 24% of the patients were classified as stunting; in 10.2% of
these patients, this was considered as severe. As regards the MUAC
z-score, 27.2% of the patients were classified as having
malnutrition; in 14.4% of these patients, this was considered as
severe malnutrition. Of note, 1% of the patients were classified as
being overweight (Table II).
| Table IINutritional status of the pediatric
inpatients according to anthropometric indexes (n=500). |
Table II
Nutritional status of the pediatric
inpatients according to anthropometric indexes (n=500).
| | Weight for age | Height for age | Weight for
height | MUAC |
|---|
| Nutritional
status | No. of patients | % | No. of patients | % | No. of patients | % | No. of patients | % |
|---|
| Severe
malnutrition | 52 | 10.4 | 51 | 10.2 | 26 | 5.2 | 64 | 12.8 |
| Moderate
malnutrition | 52 | 10.4 | 69 | 13.8 | 44 | 8.8 | 72 | 14.4 |
| Normal | 387 | 77.4 | 380 | 76 | 403 | 80.6 | 359 | 71.8 |
| Overweight | 7 | 1.4 | | | 18 | 3.6 | 5 | 1 |
| Obese | 2 | 0.4 | | | 9 | 1.8 | | |
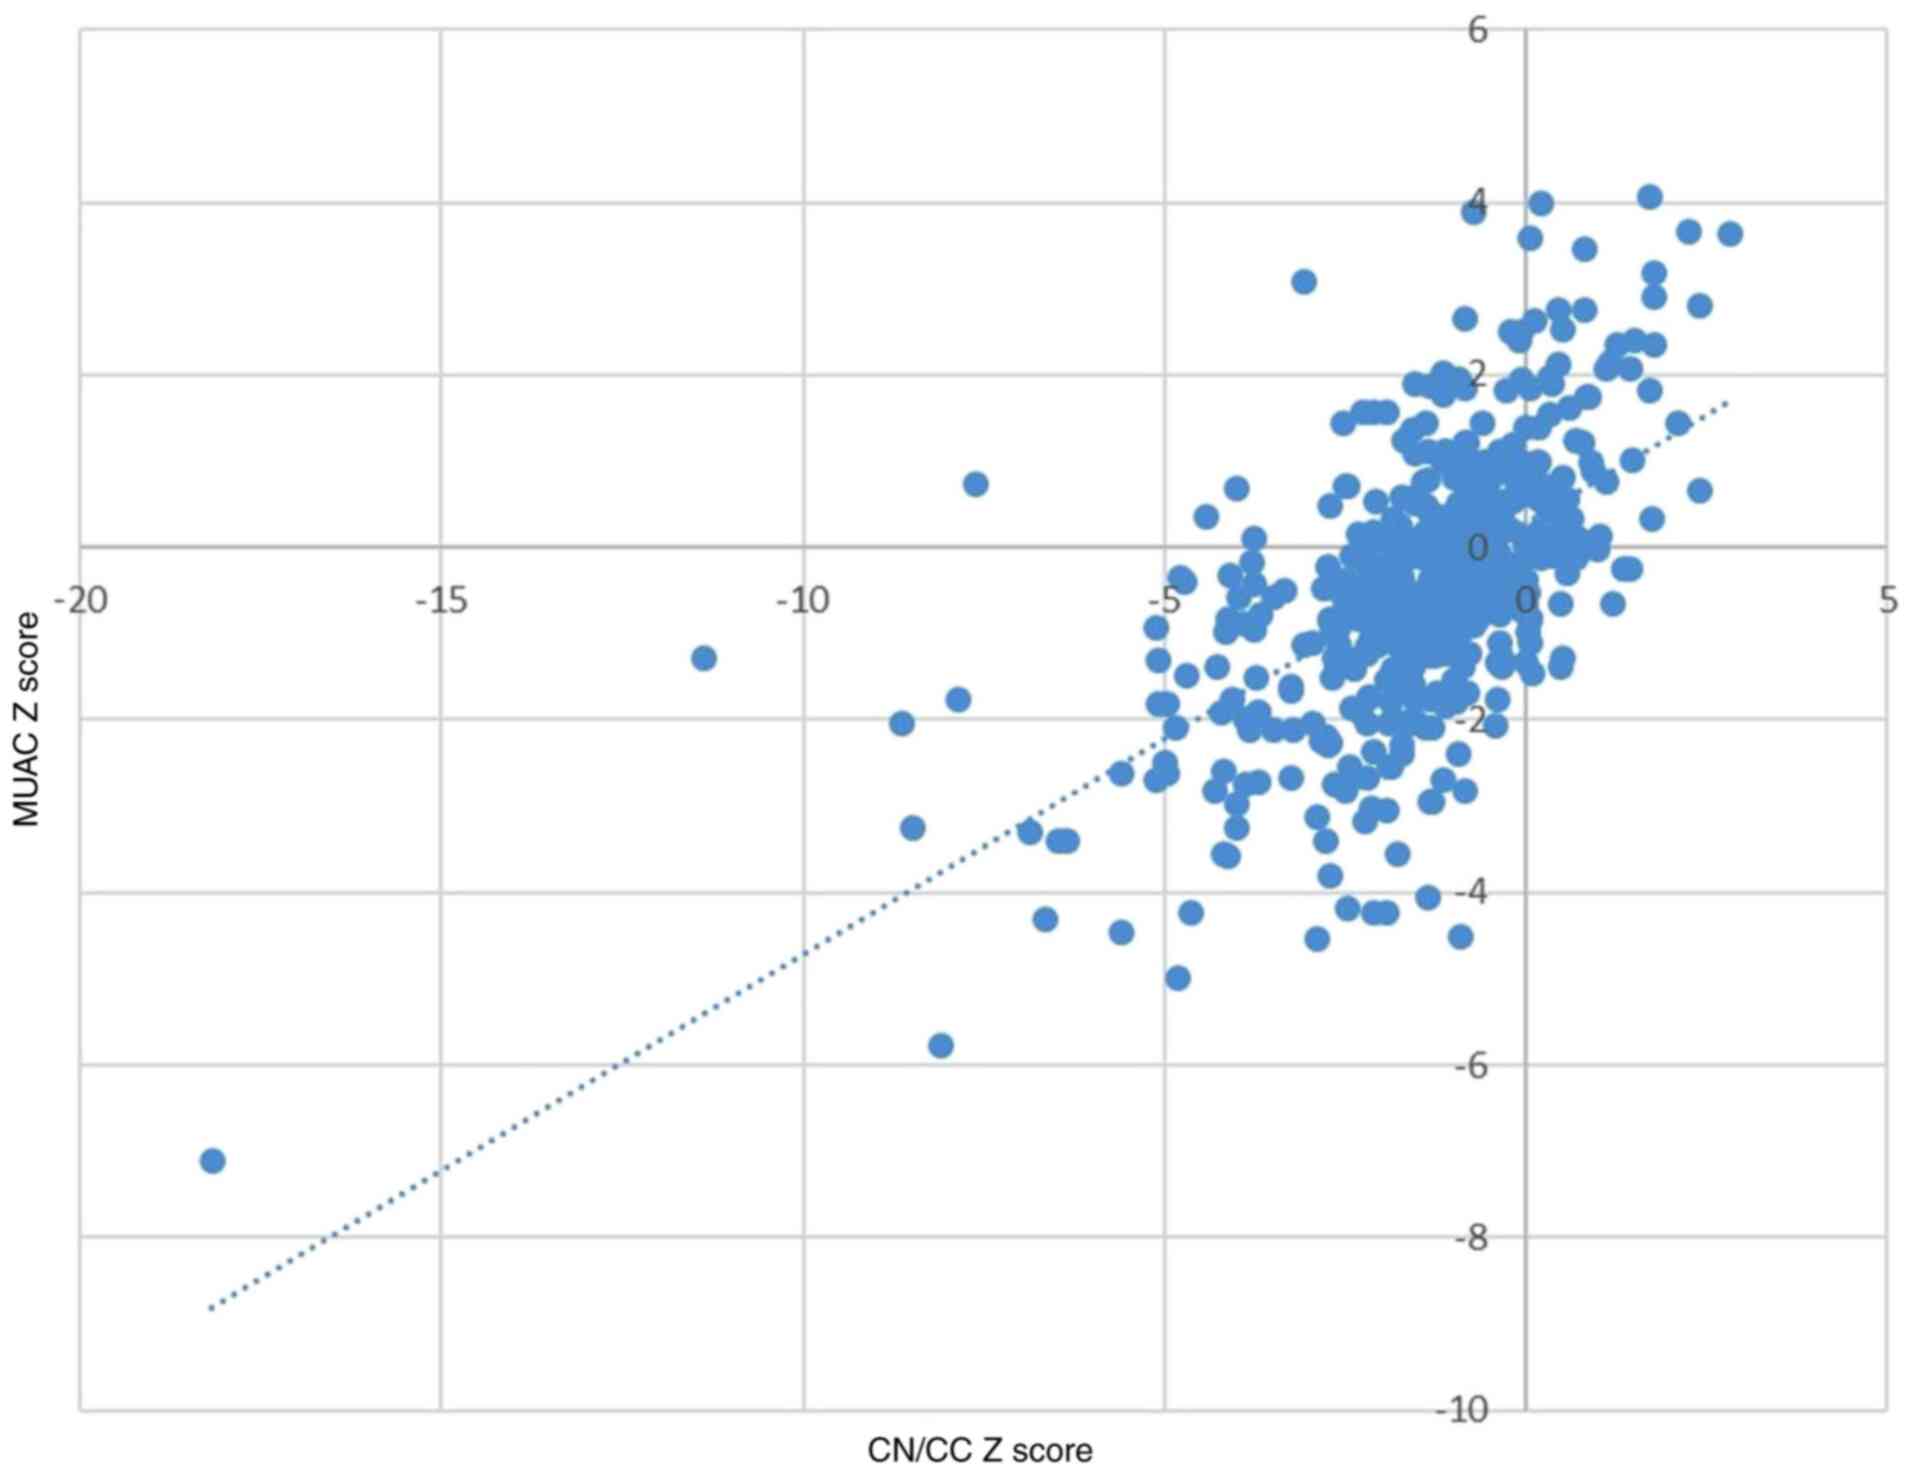
The MUAC z-score was found to have a strong
correlation with the weight/height z-score (r=0.608; P#x003C;0.001)
(Fig. 2). The MUAC z-score was
also found to have a moderate consensus with the WHO absolute value
MUAC classification (k=0.458, P#x003C;0.001) (Table III).
| Table IIIConsistency (consensus) between the
MUAC z-score and the WHO MUAC cut-off (n=500). |
Table III
Consistency (consensus) between the
MUAC z-score and the WHO MUAC cut-off (n=500).
| | MUAC z-score | |
|---|
| | Severe
malnutrition | Moderate
malnutrition | Normal | Overweight | Total (n) | κ | P-value |
|---|
| MUAC | | | | | | 0.458 | 0.001 |
|
Severe
malnutrition | 39 | 6 | 0 | 0 | 45 | | |
|
Moderate
malnutrition | 12 | 13 | 14 | 0 | 39 | | |
|
Normal | 13 | 53 | 345 | 5 | 416 | | |
| Total (n) | 64 | 72 | 359 | 5 | 500 | | |
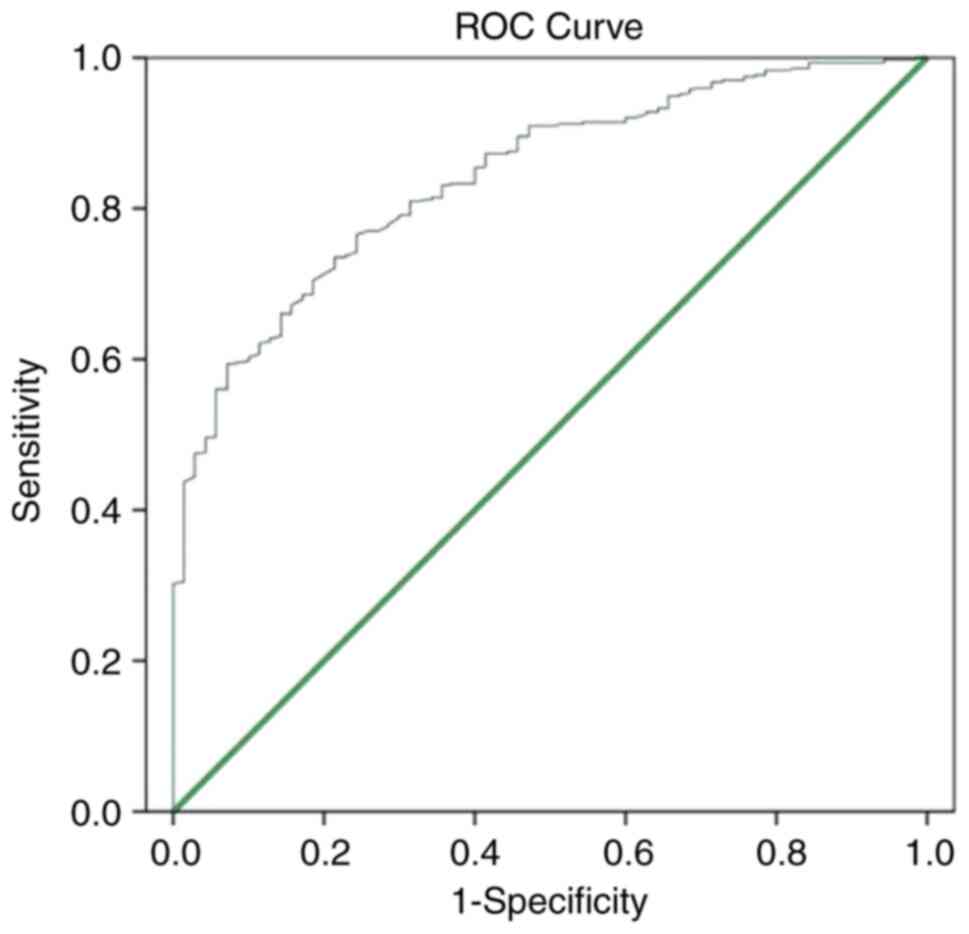
Furthermore, ROC curve analysis with weight/height
≥-2SD is the standard index and children without malnutrition
exhibited positive results; the optimal cut-off point for MUAC
z-score was -1.88. The AUC was 0.84 (95% confidence interval),
indicating that this cut-off has an 84% ability to distinguish
between malnourished and non-malnourished children (Fig. 3).
Discussion
Nutritional status affects the response of each
pediatric patient to disease. A poor nutritional status in
inpatients is associated with the duration of treatment, morbidity
and mortality. Therefore, nutritional assessment is an integral
part of the overall treatment of all pediatric inpatients. To date,
anthropometric indexes (weight, height and MUAC) have been
considered essential and are the preferred methods used to assess
the nutritional status and for the monitoring of nutritional
interventions in the community. However, these anthropometric
indexes when used in hospitals still have limitations due to
disease status and the distribution of body fluids (1).
The choice of which instrument is appropriate in the
hospital should be considered based on resources, implementation
and accuracy. Therefore, in the present study, in order to provide
data for the selection of anthropometric indexes in the early
identification of the nutritional status of patients upon
admission, from August, 2021 to August, 2022, a total of 500
pediatric inpatients at Vietnam National Hospital of Pediatrics
participated in the study.
In terms of sex, the percentage of boys was higher
than that of girls (at 59.6 and 40.4%, respectively). The mean age
of the study group was 21±16 months old (the lowest was 2 months
and the highest was 60 months) with a median age of 17 months
(Table I). The group of children
#x003C;12 months of age accounted for the highest percentage
(40.4%), followed by the groups of 12-24 months (22.6%) and 25-60
months (37%). In the study by Huong et al (7) on 337 inpatients aged between 6 months
and 15 years, the children #x003C;2 years of age accounted for the
highest rate (59.3%), followed by those aged 24 to 59 months (22%),
5 to 9 years (13.1%) and >9 years (5.6%).
The results of the present study are based on the
reference population of the WHO (2006). The rate of underweight
malnutrition (weight/age) was 20.8%, that of chronic malnutrition
(stunting) was 24% and that of acute prevalence (wasting) was 14%
(Table II). Currently,
malnutrition is one of the key child health concerns in Vietnam.
According to data from the Ministry of Health in 2021(8), in the community, the rate of acute
malnutrition (weight/height) in children was 5.2%, that of
underweight malnutrition was 11.5%, and that of stunting
(height/age) was 19.6%; this rate has decreased significantly
compared to 2000 (8.6, 33.8 and 36.5%, respectively). However, the
prevalence of malnutrition in the present study was higher than
that reported in the community in the healthy group of children
(14, 20.8 and 24%, respectively). The reason for this is that the
causes of malnutrition in the community and hospitalized children
are different. In the community, malnutrition is often caused by a
lack of food resources, socio-economic and psychological factors,
and a lack of medical care, so as the country develops, the rate of
malnutrition in the community will increase. Malnutrition in
pediatric inpatients due to nutritional imbalances includes
decreased nutrient intake (fluid restriction, heart failure,
anorexia), increased nutrient loss (chronic diarrhea toxicity,
burns, proteinuria), or increased nutritional requirements
(increased metabolism) (burns) disproportionate to intake, and
failure to absorb or utilize nutrients (malabsorption phase).
In the MUAC classification (Table III), there were 27.2%
malnourished children, of which 12.8% were classified as having
severe acute malnutrition and 14.4% were moderately acute
malnourished children. The study results revealed that the use of
the MUAC z-score significantly increased the ability to detect
acute malnutrition in inpatients compared with weight/height and
weight/age indexes. By contrast, the study by Lan et al
(9) revealed a lower prevalence of
malnutrition according to arm circumference (10.8%); the reason for
this was that Lan et al (9)
used the MUAC cut-off value to assess malnutrition and this was not
based on the z-score. Similarly, the study by Hop et al
(10) also demonstrated that when
using a cut-off point of MUAC to assess nutritional status, the
sensitivity and specificity were only high in groups 6-12 months,
while in the group of 37-60 months, the sensitivity decreased to
only 4% in boys and 10% in girls. In addition, the study by Hossain
et al (11) in Bangladesh
also demonstrated that MUAC thresholds varied by age group and that
the use of the MUAC z-score will address these differences when
assessing undernutrition. Therefore, in 2014, the American Dietetic
Association recommended the use of the MUAC z-score for the
assessment of the nutritional status in pediatric clinical practice
(12). When compared with the
study using the MUAC z-score at the hospital, the research results
were lower than those of the study by Linh et al (13) with the prevalence of malnutrition
according to the arm circumference of 41.7%. The present study was
on patients with both acute and chronic disease, while the study by
Pham Thao Linh was only on chronic liver disease with a high
percentage of muscle wasting.
The present study on 500 inpatients (Fig. 2) revealed a strong correlation
between the MUAC z-score and weight/height z-score (r=0.608); this
result was similar to that of the study by Roberfroid et al
(14) with a strong correlation
(r=0.638). The MUAC z-score is quite similar to the WHO absolute
MUAC classification of nutritional status (with k=0.458 and
P#x003C;0.001) (Table III).
Previously, there were some studies demonstrating that there was no
consensus. There is a clear agreement between anthropometric
indices to determine nutritional status, with body mass index
(BMI), weight/height and MUAC tending to determine the prevalence
of undernutrition differently (14,15).
This is likely due to the majority of studies comparing
age/sex-specific criteria (weight/height z-score or BMI z-score)
and absolute value-based criteria (MUAC in cm), and it has also
been demonstrated that classification based on z-score has a higher
sensitivity and less bias than the absolute cut-off (16). For example, in the study by
Roberfroid et al (14), the
sensitivity to detect malnourished children using MUAC 125 cm was
31%, and weight/height was 70.6%. The study by Laillou et al
(16) demonstrated that when using
the current WHO cut-off point of 115 mm to screen for malnutrition,
>90% of children with weight/height #x003C;-3SD were missed.
In the present study, the AUC was 84.1%, indicating
that this cut-off value was a good index of malnutrition. Based on
the ROC curve analysis, the present study demonstrated that the
MUACZ #x003C;-1.88 was a useful and simple nutritional index to
assess malnutrition in children.
In conclusion, assessing nutritional status in
inpatients is essential. It is necessary to use a combination of
all three anthropometric indexes: Weight, height and MUAC to detect
early clinical malnutrition. Particularly for patients whose weight
is affected by fluid status, MUAC is an important tool for
assessing the nutritional status.
Acknowledgements
Not applicable.
Funding
Funding: No funding was received.
Availability of data and materials
The datasets used and/or analyzed during the current
study are available from the corresponding author on reasonable
request.
Authors' contributions
TMTL and LTT conceptualized the study. TMTL and HNV
were involved in the study methodology. ATTV and HNV provided the
software and were involved in the formal analysis. LTT was involved
in the investigative aspects of the study. LTT and TMYL were
involved in data collection. ATTV, HNV and LTT were involved in the
writing and preparation of the original draft of the manuscript.
HNV and LTT were involved in the writing, reviewing and editing of
the manuscript. TMTL supervised the study. TMTL and HNV was
involved in project administration. TMTL and LTT confirm the
authenticity of all the raw data. All authors have read and agreed
to the published version of the manuscript.
Ethics approval and consent to
participate
All guardians/parents of the children were explained
about the purpose of the study and were required to sign the
consent forms. Children information was kept completely
confidential and used for research purposes only. The present study
was conducted after the research protocol was approved by the
Vietnam National Hospital of Pediatrics (Decision no.
646/BVNTW-HDDD).
Patient consent for publication
Not applicable.
Competing interests
The authors declare that they have no competing
interests.
References
|
1
|
Abdelhadi RA, Bouma S, Bairdain S, Wolff
J, Legro A, Plogsted S, Guenter P, Resnick H, Slaughter-Acey JC and
Corkins MR: ASPEN Malnutrition Committee. Characteristics of
hospitalized children with a diagnosis of malnutrition: United
States, 2010. JPEN J Parenter Enteral Nutr. 40:623–635.
2016.PubMed/NCBI View Article : Google Scholar
|
|
2
|
Vermilyea S, Slicker J, El-Chammas K,
Sultan M, Dasgupta M, Hoffmann RG, Wakeham M and Goday PS:
Subjective global nutritional assessment in critically ill
children. JPEN J Parenter Enteral Nutr. 37:659–666. 2013.PubMed/NCBI View Article : Google Scholar
|
|
3
|
Briend A, Maire B, Fontaine O and Garenne
M: Mid-upper arm circumference and weight-for-height to identify
high-risk malnourished under-five children. Matern Child Nutr.
8:130–133. 2012.PubMed/NCBI View Article : Google Scholar
|
|
4
|
Garenne M, Maire B, Fontaine O and Briend
A: Adequacy of child anthropometric indicators for measuring
nutritional stress at population level: A study from Niakhar,
Senegal. Public Health Nutrition. 16:1533–1539. 2012.PubMed/NCBI View Article : Google Scholar
|
|
5
|
World Health Organization: WHO Child
Growth Standards, 2006.
|
|
6
|
Mehta NM, Corkins MR, Lyman B, Malone A,
Goday PS, Carney LN, Monczka JL, Plogsted SW and Schwenk WF:
American Society for Parenteral and Enteral Nutrition Board of
Directors. Defining pediatric malnutrition: A paradigm shift toward
etiology-related definitions. JPEN J Parenter Enteral Nutr.
37:460–481. 2013.PubMed/NCBI View Article : Google Scholar
|
|
7
|
Hương PTT, Lâm NT, Thu NN, Quyen TC, Lien
DT, Anh NQ, Henry EG, Oliver L, Apovian CM, Ziegler TR and Lenders
C: Prevalence of malnutrition in patients admitted to a major urban
tertiary care hospital in Hanoi, Vietnam. Asia Pac J Clin Nutr.
23:437–444. 2014.PubMed/NCBI View Article : Google Scholar
|
|
8
|
Ministry of Health (2021). Nutrition
census 2019-2020. https://moh.gov.vn/tin-noi-bat/-/asset_publisher/3Yst7YhbkA5j/content/bo-y-te-cong-bo-ket-qua-tong-ieu-tra-dinh-duong-nam-2019-2020.
|
|
9
|
Lan BN, Ha TT, Linh VT, Thanh DC and Dung
LTT: Some factors related to malnutrition in pediatric cancer
patients under 5 years old at the National Children's Hospital.
Journal of Pediatrics Research and Practice. 5:31–37. 2021.(In
Vietnamese).
|
|
10
|
Hop T, Gross R, Sastroamidjojo S, Giay T
and Schultink W: Mid-upper-arm circumference development and its
validity in assessment of undernutrition. Asia Pac J Clin Nutr.
7:65–69. 1998.PubMed/NCBI
|
|
11
|
Hossain MI, Ahmed T, Arifeen SE, Billah
SM, Faruque A, Islam MM and Jackson AA: Comparison of midupper arm
circumference and weight-for-height z score for assessing acute
malnutrition in Bangladeshi children aged 6-60 mo: An analytical
study. Am J Clin Nutr. 106:1232–1237. 2017.PubMed/NCBI View Article : Google Scholar
|
|
12
|
Hartman C, Shamir R, Hecht C and Koletzko
B: Malnutrition screening tools for hospitalized children. Curr
Opin Clin Nutr Metab Care. 15:303–309. 2012.PubMed/NCBI View Article : Google Scholar
|
|
13
|
Linh PT, Hoa NPA, Thi N and Hong TT:
Micronutrient deficiencies status in children with chronic liver
disease at the national children's hospital. J Med Res.
160:116–126. 2022.
|
|
14
|
Roberfroid D, Huybregts L, Lachat C,
Vrijens F, Kolsteren P and Guesdon B: Inconsistent diagnosis of
acute malnutrition by weight-for-height and mid-upper arm
circumference: Contributors in 16 cross-sectional surveys from
South Sudan, the Philippines, Chad, and Bangladesh. Nutr J.
14(86)2015.PubMed/NCBI View Article : Google Scholar
|
|
15
|
Grellety E and Golden MH: Severely
malnourished children with a low weight-for-height have a higher
mortality than those with a low mid-upper-arm-circumference: I.
Empirical data demonstrates Simpson's paradox. Nutr J.
17(79)2018.PubMed/NCBI View Article : Google Scholar
|
|
16
|
Laillou A, Prak S, de Groot R, Whitney S,
Conkle J, Horton L, Un SO, Dijkhuizen MA and Wieringa FT: Optimal
screening of children with acute malnutrition requires a change in
current WHO guidelines as MUAC and WHZ identify different patient
groups. PLoS One. 9(e101159)2014.PubMed/NCBI View Article : Google Scholar
|