Introduction
Cytotoxic drugs continue to serve a critical role in
the treatment of advanced non-small cell lung cancer (NSCLC).
However, the results of chemotherapy remain unsatisfactory. One
possible way to improve the efficacy of cytotoxic chemotherapy
would be to optimize it according to the target molecules.
Thymidylate synthase (TS) is one of the target molecules in
chemotherapy. Pemetrexed and S-1 are available in Japan, and TS is
one of their main targets. A large body of clinical data is
available on these two drugs in combination with platinum as a
front-line treatment or monotherapy; however, the response rates
are ~10–30%, and the efficacy of these drugs remains limited
(1–6). It is well established that these two
drugs have different profiles of antitumor activity, as revealed
most characteristically by the fact that S-1 has cytotoxic activity
for squamous cell carcinoma (Sq), whereas pemetrexed does not. Due
to the presence of a well-characterized target molecule, TS
inhibitors are good candidates for optimization in lung cancer.
Although TS activity regulates the antitumor effect of these drugs
in vitro, the prediction of clinical efficacy of these drugs
by measuring TS has not yet been proven to be successful. One
reason for this failure is that the activities of these drugs are
also modified by folic acid-associated enzymes, such as
dihydropyrimidine dehydrogenase (DPD), folylpolyglutamate
synthetase (FPGS), γ-glutamyl hydrolase (GGH) and dihydrofolate
reductase (DHFR) (7–10).
In the majority of the studies reported thus far,
the activities of the folic acid-associated enzymes were measured
either by their protein expression or by mRNA expression. However,
it has yet to be elucidated whether these two factors correlate
well in lung cancer. In addition, though the Dannenberg tumor
profile method is frequently used for the semi-quantitation of mRNA
expression, its sensitivity is insufficient to measure mRNA
expression in low-volume tumor materials. It is also problematic to
adopt the clinical effect of folic acid-associated enzymes on the
cytotoxicity of a chemotherapeutic agent, since the clinical effect
of a drug is determined not only by the direct sensitivity of the
tumor to the drug, but also by the drug concentration at the target
lesions. The latter clearly depends on multiple factors, including
serum concentration, drug metabolism, the vasculature of tumors,
and the activity of transporting the drug to tumor cells.
In the present study, a single-institutional
prospective analysis was performed in which the mRNA and protein
expression levels of folic acid-associated enzymes were evaluated
with surgical specimens of NSCLC. To attain a highly sensitive
measurement of mRNA, the TaqMan array method was adopted, which
enables the measurement of more diverse gene expression than
reverse transcription-polymerase chain reaction (RT-PCR). Drug
sensitivity was evaluated using a collagen gel droplet-embedded
culture drug sensitivity test (CD-DST) in vitro, which
enables the evaluation of drug sensitivity in primary cultured
tumor cells. The main purpose of the present study was to determine
the parameters to optimize the usage of pemetrexed and S-1 in the
treatment of non-Sq NSCLC, paying particular attention to folic
acid-associated enzymes.
Materials and methods
Patients and surgical samples
The representative eligibility criteria for the
present study were as follows: i) that sufficient surgical tumor
specimens for the analysis of mRNA and immunohistochemical (IHC)
staining were available; ii) that the results of the CD-DST for
both pemetrexed and S-1 were available; and iii) that written
informed consent had been given. Patients who had received
chemotherapy and/or radiation therapy prior to surgical resection
were excluded. The in-house institutional review board of the Osaka
Medical Center for Cancer and Cardiovascular Diseases approved the
present study. In our hospital, surgical samples were collected
from the patients on their providing consent, and the CD-DST was
performed for surgical specimens from the patients who had
consented to the test. Surgical samples and clinical data were
collected from consecutive patients with non-Sq NSCLC who had
undergone surgical resection at Osaka Medical Center for Cancer and
Cardiovascular Diseases between 2009 and 2012, and who met the
eligibility criteria.
Analysis of mRNA
Representative hematoxylin and eosin-stained slides
from formalin-fixed, paraffin-embedded (FFPE) specimens were
reviewed by a pathologist for a manual macrodissection of tumor
tissue. Tumor tissue was selected and dissected using a scalpel.
RNA was isolated from tumor tissue using an RNeasy FFPE kit
(Qiagen, Chatsworth, CA, USA). cDNA was prepared using a High
Capacity Reverse Transcription kit (Life Technologies; Thermo
Fisher Scientific, Inc., Waltham, MA, USA) according to the
manufacturer's protocol.
The expression levels of five genes were determined
using TaqMan quantitative RT-PCR (RT-qPCR; TaqMan array card; Life
Technologies; Thermo Fisher Scientific, Inc.) following TaqMan
assay-based pre-amplification. Briefly, cDNA (2.5 µl) was
pre-amplified using TaqMan 2X PreAmp Master mix (Life Technologies;
Thermo Fisher Scientific, Inc.) and a pool of TaqMan Gene
Expression assays (0.2X) in a 10 µl PCR reaction. The
pre-amplification cycling conditions were as follows: 95°C for 10
min, followed by 14 cycles of 95°C for 15 sec, and 60°C for 4 min.
An amplified cDNA sample was diluted 20 times in Tris-EDTA (TE)
buffer (Sigma-Aldrich Co., LLC., Tokyo, Japan). Amplified cDNA (25
µl) was added to 25 µl ribonuclease (RNase)-free water and 50 µl 2X
TaqMan Gene Expression Master mix (Life Technologies; Thermo Fisher
Scientific, Inc.). The mixture was subsequently transferred to a
loading port for the TaqMan array card (LDA). The array card was
centrifuged twice (both times, 331 × g for 2 min at room
temperature), sealed, and PCR amplification was performed using the
ABI Prism 7900HT Sequence Detection System (Applied Biosystems;
Thermo Fisher Scientific, Inc.) under the following thermal cycling
conditions: 50°C for 2 min and 94.5°C for 10 min, followed by 40
cycles of 97°C for 30 sec and 59.7°C for 1 min. The array card
included β-actin (ACTB) as the reference, based on its proven role
as a housekeeping gene (11,12). The cycle threshold (Cq) value, which
is inversely proportional to the quantity of cDNA, was calculated
(13). The gene expression (relative
mRNA) levels were expressed as the ratios (the differences between
the Cq values) between the gene of interest and the reference
gene.
Analysis of protein expression
Another set of FFPE specimens was sent to the SRL
laboratory (Tokyo, Japan) for IHC analysis. The expression of the
TS, DPD, DHFR, FPGS, and GGH proteins in tumor cells was
semi-quantitatively evaluated using a histological score (IHC
score) by two independent pathologists. The staining intensity was
graded by four steps as 0, 1, 2, and 3 for no, weak, moderate, and
strong staining, respectively. This score was multiplied by the
percentage of positive tumor cells (possible range, 0-300) to
produce the IHC score.
CD-DST
The CD-DSTs for pemetrexed and S-1 were performed as
described previously (14–16). Our previous studies have revealed how
CD-DST data are useful for predicting the clinical effect of
cytotoxic drugs for NSCLC and gastric cancer, at least in part
(14,16).
Statistical analysis
Categorized data were analyzed using the t-test,
Tukey's honest significant difference test, Fisher's exact test, or
the chi-square test, depending on the number of groups to be
analyzed. The Wilcoxon test was used to assess correlations between
the baseline groups, and P<0.05 was considered to be
statistically significant. Correlation coefficients (r) between the
mRNA expression and IHC scores for the five enzymes were calculated
using the Pearson product-moment correlation coefficient, and |r|
values >0.6 were considered to be statistically significant.
Statistical analysis was performed using JMP software for Windows,
version 9.0 (SAS Institute Inc., Cary, NC, USA).
Results
A total of 50 patients with non-Sq NSCLC met the
criteria, and their clinical data were collected (Table I). Of the 50 patients, 28 patients
were women and 22 patients were men with a median age of 65.5 years
(range, 40–78 years). All patients exhibited an adenocarcinoma-type
histology, with the subtypes of a papillary pattern in 25 patients,
an acinar pattern in 18 patients, a solid pattern in 3 patients, a
lepidic pattern in 2 patients, and a lepidic plus papillary pattern
in 1 patient; the subtype could not be determined in 1 patient due
to poor differentiation. The differentiation grade (G) in 2, 27,
and 18 tumors was classified as well differentiated (G1),
moderately differentiated (G2), and poorly differentiated (G3),
respectively, according to the histological criteria of the Japan
Lung Cancer Society (17). The
differentiation data for 3 of the patients were not available.
Levels of mRNA expression and IHC scores for folic acid-associated
enzymes were assessable in 47 and 46 patients (Table IA and B).
 | Table I.Association between patient
characteristics and the enzymes. |
Table I.
Association between patient
characteristics and the enzymes.
| A, Association by
mRNA expression |
|---|
|
|---|
| Feature (n) | TS | DPD | FPGS | GGH | DHFR |
|---|
| Total (47) | 2.2±2.1 | 11.3±6.2 | 1.2±0.5 | 0.3±0.3 | 2.2±1.1 |
| Gender |
|
|
|
|
|
| Female
(26) | 2.1±2.2 | 11.4±6.9 | 1.1±0.5 | 0.3±0.4 | 2.2±1.2 |
| Male
(21) | 2.4±2.1 | 11.2±5.4 | 1.3±0.5 | 0.3±0.3 | 2.2±1.0 |
| Age, years |
|
|
|
|
|
| <70
(33) | 2.3±2.2 | 12.0±7.0 | 1.2±0.6 | 0.3±0.4 | 2.4±1.2 |
| ≥70
(14) | 2.1±1.9 |
9.6±3.1 | 1.1±0.5 | 0.2±0.2 | 1.8±0.8 |
| Histology
subtype |
|
|
|
|
|
| Papillary
(23) | 1.8±1.6 | 11.0±5.7 | 1.2±0.6 | 0.2±0.2 | 2.0±0.9 |
| Acinar
(17) | 2.6±2.4 | 11.2±5.2 | 1.3±0.4 | 0.3±0.2 | 2.5±1.4 |
| Solid
(3) | 2.1±1.2 | 11.3±8.0 | 1.00±0.5 | 0.3±0.1 | 2.0±1.5 |
| Lepidic
(2) | 2.1±1.3 |
20.0±16.4 | 1.3±0.5 | 0.6±0.5 | 2.0±0.9 |
| Lepidic +
papillary (1) | 0.7 | 6.2 | 1.0 | 0.3 | 1.4 |
| Other
(1) | 8.5 | 6.7 | 0.5 | 2.0 | 3.2 |
| Grade of
differentiation | a |
|
|
|
|
| 1
(2) | 0.9±0.3 |
18.9±17.9 | 1.3±0.5 | 0.3±0.0 | 2.0±0.9 |
| 2
(27) | 1.7±1.7 | 10.4±4.7 | 1.2±0.5 | 0.3±0.2 | 2.0±1.1 |
| 3
(18) | 3.1±2.6 | 11.9±6.5 | 1.1±0.6 | 0.4±0.4 | 2.5±1.1 |
| Pleural
invasion |
|
|
|
|
|
| 0
(27) | 1.7±1.7 | 11.0±5.8 | 1.2±0.5 | 0.3±0.4 | 2.1±1.2 |
| 1
(14) | 2.8±2.3 | 11.5±6.8 | 1.3±0.6 | 0.3±0.2 | 2.3±0.8 |
| 2
(3) | 2.9±2.4 |
9.1±3.1 | 0.9±0.3 | 0.3±0.2 | 2.3±1.9 |
| 3
(3) | 3.5±3.9 |
15.6±10.0 | 1.0±0.2 |
0.2±0.2 | 2.5±1.3 |
| Blood vessel
invasion |
|
|
|
|
|
| 0
(29) | 2.2±2.3 | 11.6±6.1 | 1.2±0.5 | 0.3±0.4 | 2.1±1.1 |
| 1
(18) | 2.3±1.9 | 10.8±6.4 | 1.1±0.5 | 0.3±0.2 | 2.3±1.1 |
| Lymph vessel
invasion |
|
|
|
|
|
| 0
(29) | 1.8±1.9 | 12.1±7.3 | 1.2±0.6 | 0.3±0.2 | 2.2±1.2 |
| 1
(17) | 2.9±2.4 | 10.0±3.7 | 1.1±0.5 | 0.4±0.5 | 2.2±0.9 |
| 2
(1) | 1.5 |
9.0 | 1.2 | 0.2 | 1.0 |
|
| B, Association by
immunohistochemical analysis |
|
| Feature (n) | TS | DPD | FPGS | GGH | DHFR |
|
| Total (46) | 27.2±36.6 | 94.0±63.6 | 225.8±36.5 | 120.5±57.8 | 90.2±50.4 |
| Gender |
|
|
|
|
|
| Female
(25) | 19.5±32.0 | 11.3±6.2 | 226.6±35.3 |
125.8±62.8 | 80.4±47.9 |
| Male
(21) | 36.2±40.4 | 79.3±61.7 | 224.8±38.8 |
114.3±52.0 | 101.9±52.0 |
| Age, years |
|
|
|
|
|
| <70
(32) | 27.0±34.0 | 91.6±64.5 | 227.3±38.0 |
126.7±52.0 | 93.0±44.4 |
| ≥70
(14) | 27.5±43.4 | 77.5±58.5 | 222.1±34.0 | 106.4±69.5 | 83.9±63.5 |
| Histology
subtype |
|
|
|
|
|
|
Papillary (23) | 22.3±36.2 | 94.1±67.3 | 222.2±36.8 | 126.5±65.3 | 87.4±55.1 |
| Acinar
(16) | 34.9±40.6 | 85.6±54.5 | 234.4±33.7 |
111.3±56.2 | 96.9±43.8 |
| Solid
(3) | 30.0±31.2 | 100.0±100.0 | 228.3±50.6 | 106.7±15.3 | 100.0±39.1 |
| Lepidic
(2) | 7.0±7.1 | 60.0±28.3 | 230.0±56.6 | 105.0±35.4 | 30.0±14.1 |
| Lepidic
+ papillary (1) | 3 | 10 | 210 | 145 | 60 |
| Other
(1) | 70 | 50 | 170 | 180 | 170 |
| Grade of
differentiation |
|
|
|
|
|
| 1
(2) | 2.5±0.7 | 45.0±49.5 | 240.0±42.4 | 112.5±46.0 | 40.0±28.3 |
| 2
(26) | 22.7±35.6 |
88.7±59.0 | 222.7±32.7 | 131.2±61.9 | 76.2±51.5 |
| 3
(18) | 36.3±38.6 | 90.0±69.5 | 228.6±42.5 | 106.1±51.9 | 116.1±38.4 |
| Pleural
invasion | a |
|
|
|
|
| 0
(26) | 18.5±28.4 | 93.1±65.9 | 219.0±34.8 | 116.3±48.7 | 82.5±53.5 |
| 1
(14) | 46.6±49.2 | 76.1±52.3 | 238.6±38.6 | 120.0±64.3 | 101.8±53.2 |
| 2
(3) | 13.0±10.4 | 70.0±62.5 | 250.0±30.0 | 200.0±80.0 | 91.7±27.5 |
| 3
(3) | 26.0±16.4 | 106.7±97.1 | 200.0±26.5 | 80.0±10.0 | 101.7±17.6 |
| Blood vessel
invasion |
|
|
|
|
|
| 0
(28) | 21.5±32.6 |
88.0±63.6 | 221.4±34.4 | 125.5±66.0 | 87.7±53.0 |
| 1
(18) | 35.9±41.6 | 86.1±62.4 | 232.5±39.6 | 112.8±42.8 | 94.2±47.3 |
| Lymph vessel
invasion | a |
|
|
| a |
| 0
(29) | 17.6±27.3 | 88.1±68.4 | 221.4±38.9 | 122.6±57.7 | 76.4±43.2 |
| 1
(16) | 42.1±46.1 | 85.0±54.4 | 231.6±32.0 | 116.9±61.5 | 113.4±56.0 |
| 2
(1) | 65 | 100 | 260 | 120 | 120 |
mRNA expression of folic
acid-associated enzymes and baseline clinical factors
The mRNA expression levels of each enzyme are shown
in Table IA. Significantly higher
levels of TS mRNA were observed in G3 compared with G2 tumors
(P=0.0399), whereas the difference in the IHC score of TS was not
significant with respect to clinical factors (Table IB). Analysis of the other four
enzymes did not reveal any trend with respect to the baseline
clinical factors.
Protein expression of folic
acid-associated enzymes and baseline clinical factors
The IHC scores for each enzyme are shown in Table IB. TS was significantly higher in the
patients with pleural invasion (P1) compared with in the patients
that lacked it (P0; P=0.027). TS and DHFR levels were significantly
higher in the patients with lymphatic invasion (Ly1) compared with
the patients that lacked it (Ly0; P=0.030 and 0.0173,
respectively). DHFR levels were significantly higher in poorly
differentiated cancer (P=0.0137). The DPD, FPGS, and GGH enzymes
did not exhibit any trend with respect to the baseline clinical
factors. Scattered, but moderate or strong, staining for FPGS, GGH,
and DHFR were observed in bronchial epithelial cells, together with
DHFR staining in alveolar epithelial cells and various intensities
of immunoreactivity in alveolar macrophages for all five
enzymes.
Correlation between mRNA and protein
expression
The correlation between mRNA expression and IHC
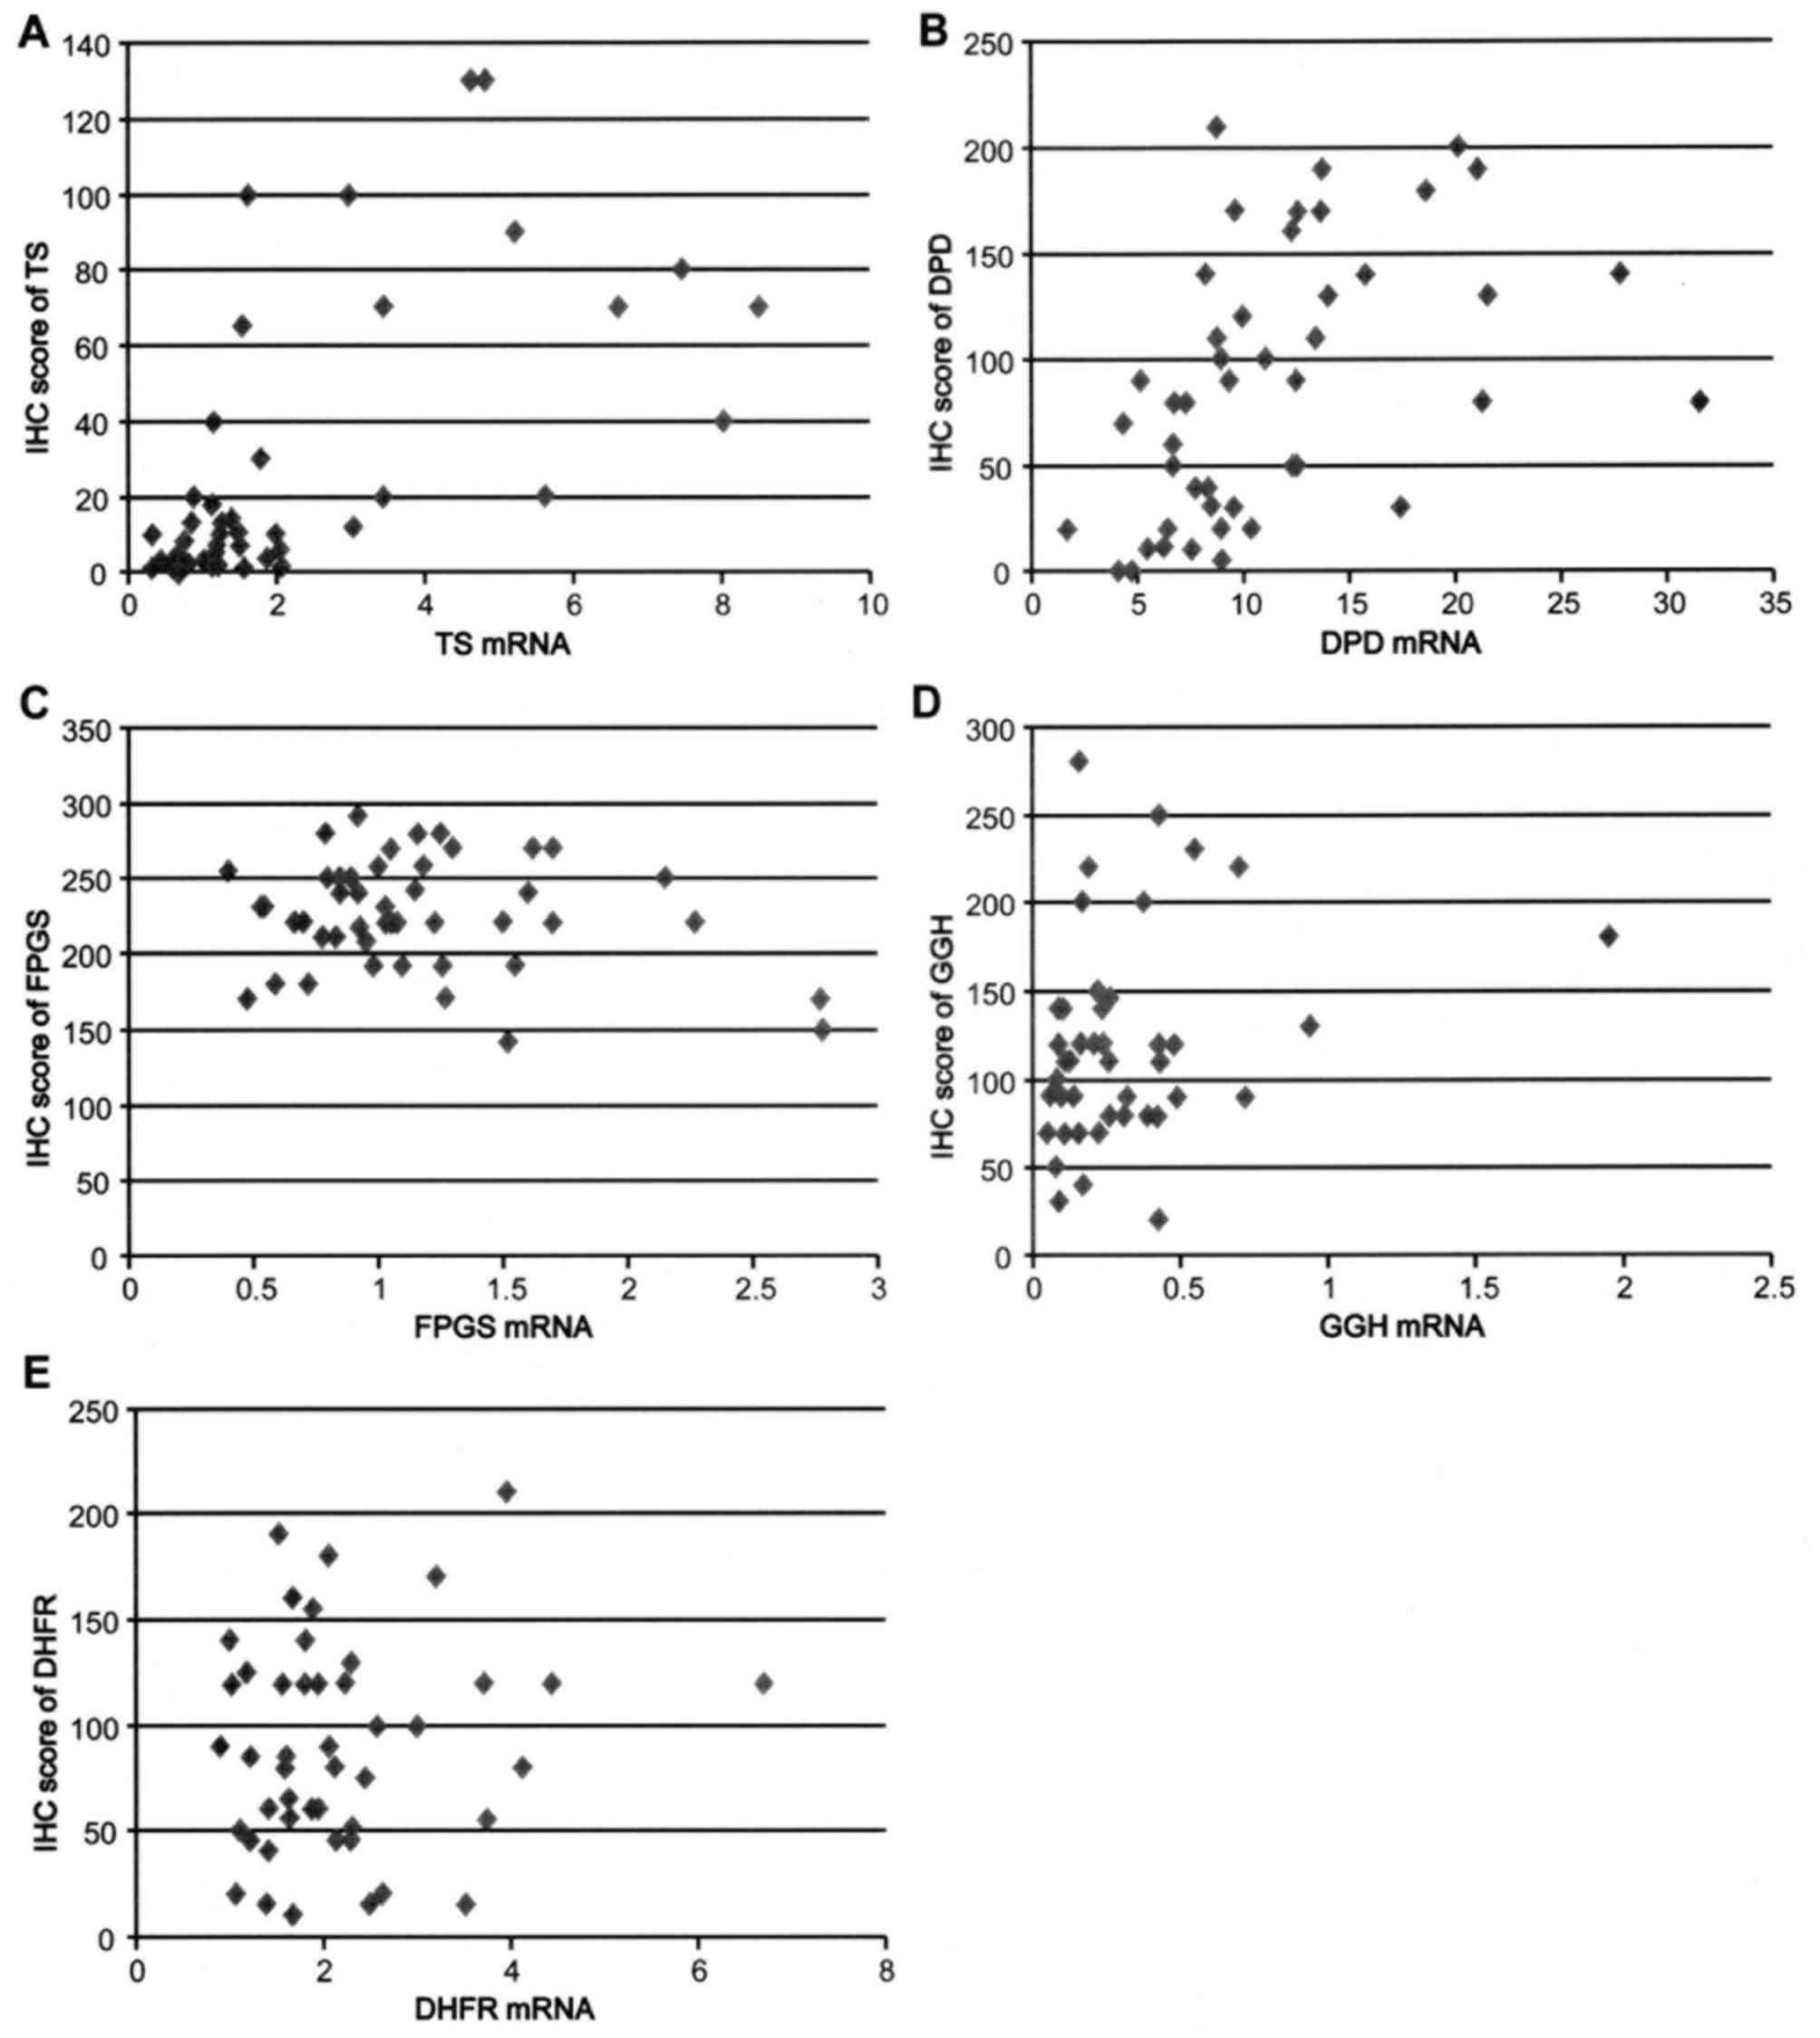
score in the five enzymes is shown in Table II and Fig. 1A-E. There was a significant
association between mRNA expression and the IHC score in TS
(r=0.627), whereas no distinct correlation was identified between
them with the other four enzymes. TS mRNA showed a significant
association with GGH mRNA (r=0.601).
| Table II.Correlations of expression in five
enzymes between (A) each mRNA, (B) each IHC score, and (C) each
mRNA and the IHC score. |
Table II.
Correlations of expression in five
enzymes between (A) each mRNA, (B) each IHC score, and (C) each
mRNA and the IHC score.
| A, Correlation of
expression of the five enzymes between each mRNA |
|---|
|
|---|
|
| TS mRNA | DPD mRNA | FPGS mRNA | GGH mRNA | DHFR mRNA |
|---|
| TS mRNA |
1.000 |
0.036 | −0.171 |
0.601 | 0.408 |
| DPD mRNA | – |
1.000 |
0.540 | −0.174 | 0.320 |
| FPGS mRNA | – | – |
1.000 |
−0.144 | 0.353 |
| GGH mRNA | – | – | – |
1.000 | 0.127 |
| DHFR mRNA | – | – | – | – | 1.000 |
|
| B, Correlation of
expression of the five enzymes between each IHC score |
|
|
| TS mRNA | DPD mRNA | FPGS mRNA | GGH mRNA | DHFR mRNA |
|
| TS IHC |
1.000 | −0.024 |
0.115 |
0.185 | 0.586 |
| DPD IHC | – |
1.000 |
−0.063 |
−0.215 | 0.044 |
| FPGS IHC | – | – |
1.000 |
0.005 | 0.023 |
| GGH IHC | – | – | – |
1.000 | 0.081 |
| DHFR IHC | – | – | – | – | 1.000 |
|
| C, Correlation of
expression of the five enzymes between each mRNA and the IHC
score |
|
|
| TS mRNA | DPD mRNA | FPGS mRNA | GGH mRNA | DHFR mRNA |
|
| TS mRNA |
0.627 |
−0.166 |
0.037 |
0.207 | 0.506 |
| DPD mRNA | −0.085 |
0.478 |
−0.042 |
−0.340 | −0.157 |
| FPGS mRNA | −0.111 |
0.153 |
−0.205 |
−0.361 | −0.212 |
| GGH mRNA |
0.322 | −0.290 |
−0.246 |
0.260 | 0.227 |
| DHFR mRNA |
0.301 |
0.191 | −0.118 |
−0.059 | 0.156 |
Drug sensitivity and folic
acid-associated enzymes
The CD-DST revealed that 23 tumors were sensitive to
pemetrexed, and 22 tumors were sensitive to S-1. No significant
correlation was identified between the drug sensitivity determined
by CD-DST and the expression of each enzyme quantified by mRNA or
IHC (Table III). Although TS mRNA
expression and the IHC score appeared to be higher in the tumors
sensitive to pemetrexed compared with those that were resistant to
it, this result was not revealed to be statistically significant. A
total of 12 tumors were sensitive to pemetrexed, but not to S-1
(group P), and 11 tumors were sensitive to S-1, but not to
pemetrexed (group S). Between these two groups, no significant
differences were identified in the expression of each enzyme,
quantified either by mRNA or by IHC (Table IV). However, these two groups
revealed distinct differences in the grade of tumor differentiation
(P=0.0008) and blood vessel invasion (P=0.0069) (Table V). Group S contained no G3 tumors,
whereas group P contained no G1 tumors (Table VI).
| Table III.Associations between in vitro
tumor sensitivity to drugs assayed using CD-DST and enzyme
expression. |
Table III.
Associations between in vitro
tumor sensitivity to drugs assayed using CD-DST and enzyme
expression.
|
| TS | DPD | FPGS | GGH | DHFR |
|---|
|
|
|
|
|
|
|
|---|
| CD-DST | mRNA | IHC score | mRNA | IHC score | mRNA | IHC score | mRNA | IHC score | mRNA | IHC score |
|---|
| Pemetrexed
(n/n) |
|
|
|
|
|
|
|
|
|
|
|
Sensitive (23/23) | 2.4±2.0 | 33.9±42.9 | 11.5±6.2 | 80.9±60.4 | 1.2±0.6 | 220.2±41.4 | 0.3±0.2 | 118.7±61.3 | 2.2±1.0 | 96.3±51.3 |
|
Resistant (24/23) | 2.1±2.3 | 20.4±28.4 | 11.2±6.3 | 93.7±65.1 | 1.2±0.5 | 231.3±30.8 | 0.3±0.4 | 122.4±55.4 | 2.2±1.2 | 84.1±49.9 |
| S-1 (n/n) |
|
|
|
|
|
|
|
|
|
|
|
Sensitive (21/21) | 2.5±2.4 | 29.3±40.0 | 11.9±6.8 | 91.7±58.6 | 1.2±0.6 | 222.4±35.8 | 0.3±0.2 | 126.7±62.2 | 2.3±1.2 | 86.2±52.9 |
|
Resistant (26/25) | 2.0±1.9 | 25.4±34.2 | 10.8±5.7 | 83.6±66.5 | 1.1±0.5 | 228.6±37.7 | 0.3±0.4 | 115.4±54.7 | 2.1±1.0 | 93.6±49.1 |
| Table IV.Enzyme expression among two groups
(designated P and S) featuring different sensitivity to drugs. |
Table IV.
Enzyme expression among two groups
(designated P and S) featuring different sensitivity to drugs.
|
| TS | DPD | FPGS | GGH | DHFR |
|---|
|
|
|
|
|
|
|
|---|
| CD-DST | mRNA | IHC score | mRNA | IHC score | mRNA | IHC score | mRNA | IHC score | mRNA | IHC score |
|---|
| Group P (n=12) | 2.0±1.3 | 33.9±42.9 | 11.1±6.8 | 80.8±68.0 | 1.1±0.6 | 222.9±44.0 | 0.3±0.2 | 110.0±46.9 | 2.1±1.0 | 95.4±51.6 |
| Group Sa
(n=10) | 2.1±2.4 | 24.3±34.1 | 11.9±8.2 | 103.5±63.8 | 1.2±0.5 | 228.0±31.2 | 0.3±0.2 | 125.0±47.9 | 2.4±1.6 | 74.0±52.3 |
| Table V.Clinical factors and drug
sensitivity. |
Table V.
Clinical factors and drug
sensitivity.
| Variables | Group P (n) | Group S
(n)a | P-value |
|---|
| Total | 12 | 11 |
|
| Gender
(female/male) | 5/7 | 8/3 | 0.140 |
| Age |
|
|
|
|
(<70/≥70 years) | 9/3 | 5/6 | 0.144 |
| Histology
subtype |
|
|
|
|
(papillary/acinar/other) | 7/2/3 | 7/3/1 | 0.548 |
| Grade of
differentiation |
|
|
|
|
(1/2/3) | 0/4/8 | 1/9/0 |
0.0008 |
| Pleural
invasion |
|
|
|
|
(0/1/2/3) | 5/4/1/2 | 6/5/0/0 | 0.229 |
| Blood vessels
invasion |
|
|
|
|
(0/1) | 4/8 | 10/1 | 0.0069 |
| Lymph vessels
invasion |
|
|
|
|
(0/1/2) | 9/2/1 | 9/2/0 | 0.511 |
Discussion
To the best of our knowledge, this is the first
study that has compared the mRNA and protein expression of five
folic acid-associated enzymes, and determined their sensitivity to
pemetrexed and S-1 using resected NSCLC tumors. The correlation
between folic acid-associated enzymes and the activity of TS
inhibitors in lung cancer has previously been summarized in several
reports of meta-analysis (7,18). However, TS was assessed either by
mRNA expression using RT-PCR or by protein content using IHC, and
comparison of the two methods has rarely occurred in the studies in
these meta-analyses. Typically, all studies included in a
meta-analysis have featured TS measurement by mRNA or IHC (19). It is important to determine the
correlation between TS mRNA and TS protein expression in lung
cancer in order to gain an improved understanding of the results
reported in these studies; an appreciable volume of data on the
correlation between these in gastric cancer already exists. The
present study has shown that mRNA and protein expression of TS
revealed a significant correlation, as identified in the previous
reports (20–22), whereas there was a marked discrepancy
between mRNA expression levels and IHC scores in FPGS, GGH, and
DHFR. A similar discrepancy between the mRNA and IHC of TS in
large-cell carcinoma of lung cancer, and DPD in gastric cancer, has
already been reported in several studies (21,23).
These discrepancies may be due to a limited quantification of IHC,
for example, in cases where a random selection of areas in the
slides are to be evaluated. However, any contribution resulting
from this type of selection bias was unlikely in the present study,
since the total area in a tumor section was evaluated by IHC
quantification. Various intensities of IHC staining of enzymes in
the normal surrounding structure of a tumor, as observed in the
present study, may have hampered the results. A weak correlation
was observed between TS and DHFR in terms of mRNA expression and
the results from IHC. This is consistent with the report by Sowers
et al (24), which revealed
that mRNA levels of E2F-1, a transcription factor for the two
enzymes, were co-associated with the mRNA expression of DHFR and TS
in osteosarcoma.
TS is an important target in cancer chemotherapy.
Experimentally, low TS levels generally lead to improved effects of
TS inhibitors. Certain previous studies revealed no association
between TS expression and the response to pemetrexed, whereas other
studies revealed that low TS expression was associated with a high
sensitivity to pemetrexed-based chemotherapy (25–27); a
meta-analysis favored the latter in NSCLC (7,18). It
has also been reported that IHC more accurately predicts the
response rate of pemetrexed compared with RT-qPCR, probably because
TS protein, but not TS mRNA, exerts activity on DNA synthesis
(28). In the present study, the
tumors that were sensitive to pemetrexed on performing the CD-DST
analysis revealed a slightly higher IHC score for TS compared with
those without the sensitivity (P=0.217).
TS expression is also regulated by cell
proliferation and tumor differentiation, and the reaction catalyzed
by TS is affected by the activity of the other folic
acid-associated enzymes. In the present study, TS mRNA expression
increased, along with lowering tumor differentiation, as identified
in the previous report (29), and
the TS IHC score exhibited a similar tendency. The TS IHC score
increased with an increased tendency of pleural invasion and
lymphatic invasion, which is consistent with poor differentiation
of the tumors. Although the DHFR IHC score increased markedly along
with the decreasing grade of tumor differentiation and lymphatic
invasion, the expression of the other enzymes did not exhibit a
meaningful correlation with tumor differentiation and lymphatic
invasion.
No predictive factors to select pemetrexed or S-1
preferentially by mRNA measurement or IHC were identified in the
present study. Instead, the results suggested that these drugs
should be selectively used depending on the pathological features
of the tumors. Pemetrexed is more useful than S-1 for poorly
differentiated adenocarcinoma or those with a high tendency of
blood vessel invasion, regardless of histological subtype, whereas
S-1 may be more useful than pemetrexed for well-differentiated
adenocarcinoma.
In conclusion, the mRNA and protein expression
levels of five folic acid-associated enzymes with resected NSCLC
tumor specimens were measured to determine biomarkers for targeting
TS inhibitors. The results demonstrated a poor correlation between
mRNA and IHC in the expression of these enzymes, with the exception
of TS. The expression levels of TS, determined either by mRNA
analysis or by IHC, failed to reveal any clear association with
sensitivity to pemetrexed or S-1 when cytotoxicity was analyzed in
an ex vivo model. The only factors that demonstrated any
potential to discriminate between the cytotoxicity of pemetrexed
and S-1 were the grade of tumor differentiation and vascular
invasion: Tumors showing G3 differentiation or advanced vascular
invasion appeared to be more sensitive to pemetrexed, whereas those
with G1 or G2 differentiation were more sensitive to S-1.
Acknowledgements
The present study was funded by Taiho Pharmaceutical
Co., Ltd. (Tokyo, Japan). The present study was also partly
supported by grants from the Osaka Foundation for the Prevention of
Cancer and Cardiovascular Diseases. We thank the patients and their
families for their co-operation.
References
|
1
|
Hanna N, Shepherd FA, Fossella FV, Pereira
JR, De Marinis F, von Pawel J, Gatzemeier U, Tsao TC, Pless M,
Muller T, et al: Randomized phase III trial of pemetrexed versus
docetaxel in patients with non-small-cell lung cancer previously
treated with chemotherapy. J Clin Oncol. 22:1589–1597. 2004.
View Article : Google Scholar : PubMed/NCBI
|
|
2
|
Scagliotti GV, Parikh P, von Pawel J,
Biesma B, Vansteenkiste J, Manegold C, Serwatowski P, Gatzemeier U,
Digumarti R, Zukin M, et al: Phase III study comparing cisplatin
plus gemcitabine with cisplatin plus pemetrexed in
chemotherapy-naive patients with advanced-stage non-small-cell lung
cancer. J Clin Oncol. 26:3543–3551. 2008. View Article : Google Scholar : PubMed/NCBI
|
|
3
|
Ciuleanu T, Brodowicz T, Zielinski C, Kim
JH, Krzakowski M, Laack E, Wu YL, Bover I, Begbie S, Tzekova V, et
al: Maintenance pemetrexed plus best supportive care versus placebo
plus best supportive care for non-small-cell lung cancer: A
randomised, double-blind, phase 3 study. Lancet. 374:1432–1440.
2009. View Article : Google Scholar : PubMed/NCBI
|
|
4
|
Okamoto I, Yoshioka H, Morita S, Ando M,
Takeda K, Seto T, Yamamoto N, Saka H, Asami K, Hirashima T, et al:
Phase III trial comparing oral S-1 plus carboplatin with paclitaxel
plus carboplatin in chemotherapy-naïve patients with advanced
non-small-cell lung cancer: Results of a west Japan oncology group
study. J Clin Oncol. 28:5240–5246. 2010. View Article : Google Scholar : PubMed/NCBI
|
|
5
|
Kawahara M, Furuse K, Segawa Y, Yoshimori
K, Matsui K, Kudoh S, Hasegawa K and Niitani H: Phase II study of
S-1, a novel oral fluorouracil, in advanced non-small-cell lung
cancer. Br J Cancer. 85:939–943. 2001. View Article : Google Scholar : PubMed/NCBI
|
|
6
|
Urata Y, Okamoto I, Takeda M, Hattori Y,
Okuno K, Shimada T, Kurata T, Kaneda H, Miyazaki M, Terashima M, et
al: Phase 2 study of S-1 and carboplatin plus bevacizumab followed
by maintenance S-1 and bevacizumab for chemotherapy-naive patients
with advanced nonsquamous non-small cell lung cancer. Cancer.
119:2275–2281. 2013. View Article : Google Scholar : PubMed/NCBI
|
|
7
|
Wang L, Wang R, Pan Y, Sun Y, Zhang J and
Chen H: The pemetrexed-containing treatments in the non-small cell
lung cancer is -/low thymidylate synthase expression better than +/
high thymidylate synthase expression: A meta-analysis. BMC Cancer.
14:2052014. View Article : Google Scholar : PubMed/NCBI
|
|
8
|
Salonga D, Danenberg KD, Johnson M,
Metzger R, Groshen S, Tsao-Wei DD, Lenz HJ, Leichman CG, Leichman
L, Diasio RB, et al: Colorectal tumors responding to 5-fluorouracil
have low gene expression levels of dihydropyrimidine dehydrogenase,
thymidylate synthase, and thymidine phosphorylase. Clin Cancer Res.
6:1322–1327. 2000.PubMed/NCBI
|
|
9
|
Metzger R, Danenberg K, Leichman CG,
Salonga D, Schwartz EL, Wadler S, Lenz HJ, Groshen S, Leichman L
and Danenberg PV: High basal level gene expression of thymidine
phosphorylase (platelet-derived endothelial cell growth factor) in
colorectal tumors is associated with nonresponse to 5-fluorouracil.
Clin Cancer Res. 4:2371–2376. 1998.PubMed/NCBI
|
|
10
|
Saito S, Tsuno N, Nagawa H, Sunami E,
Zhengxi J, Osada T, Kitayama J, Shibata Y, Tsuruo T and Muto T:
Expression of platelet-derived endothelial cell growth factor
correlates with good prognosis in patients with colorectal
carcinoma. Cancer. 88:42–49. 2000. View Article : Google Scholar : PubMed/NCBI
|
|
11
|
Bonanomi A, Kojic D, Giger B, Rickenbach
Z, Jean-Richard-Dit-Bressel L, Berger C, Niggli FK and Nadal D:
Quantitative cytokine gene expression in human tonsils at excision
and during histoculture assessed by standardized and calibrated
real-time PCR and novel data processing. J Immunol Methods.
283:27–43. 2003. View Article : Google Scholar : PubMed/NCBI
|
|
12
|
Pérez S, Royo LJ, Astudillo A, Escudero D,
Alvarez F, Rodríguez A, Gómez E and Otero J: Identifying the most
suitable endogenous control for determining gene expression in
hearts from organ donors. BMC Mol Biol. 8:1142007. View Article : Google Scholar : PubMed/NCBI
|
|
13
|
Livak KJ and Schmittgen TD: Analysis of
relative gene expression data using real-time quantitative PCR and
the 2(−Delta Delta C(T))method. Methods. 25:402–408. 2001.
View Article : Google Scholar : PubMed/NCBI
|
|
14
|
Kobayashi H, Tanisaka K, Doi O, Kodama K,
Higashiyama M, Nakagawa H, Miyake M, Taki T, Hara S, Yasutomi M, et
al: An in vitro chemosensitivity test for solid human tumors using
collagen gel droplet embedded cultures. Int J Oncol. 11:449–455.
1997.PubMed/NCBI
|
|
15
|
Kobayashi H, Higashiyama M, Minamigawa K,
Tanisaka K, Takano T, Yokouchi H, Kodama K and Hata T: Examination
of in vitro chemosensitivity test using collagen gel droplet
culture method with colorimetric endpoint quantification. Jpn J
Cancer Res. 92:203–210. 2001. View Article : Google Scholar : PubMed/NCBI
|
|
16
|
Higashiyama M, Kodama K, Yokouchi H,
Takami K, Nakagawa H, Imamura F, Minamigawa K and Kobayashi H:
Cisplatin-based chemotherapy for postoperative recurrence in
non-small cell lung cancer patients: Relation of the in vitro
chemosensitive test to clinical response. Oncol Rep. 8:279–283.
2001.PubMed/NCBI
|
|
17
|
The Japan Lung Cancer Society, . General
rule for clinical and pathological record of lung cancer. 7th.
Kanehara & Co., Ltd.; Tokyo: 2010
|
|
18
|
Liu Q, Yu Z, Xiang Y, Wu N, Wu L, Xu B,
Wang L, Yang P, Li Y and Bai L: Prognostic and predictive
significance of thymidylate synthase protein expression in
non-small cell lung cancer: A systematic review and meta-analysis.
Cancer Biomark. 15:65–78. 2015. View Article : Google Scholar : PubMed/NCBI
|
|
19
|
Wang T, Pan C Chuan, Rui Yu J, Long Y, Cai
X Hong, De Yin X, Hao L Qiong and Li Luo L: Association between
TYMS expression and efficacy of pemetrexed-based chemotherapy in
advanced non-small cell lung cancer: A meta-analysis. PLoS One.
8:e742842013. View Article : Google Scholar : PubMed/NCBI
|
|
20
|
Ibe T, Shimizu K, Nakano T, Kakegawa S,
Kamiyoshihara M, Nakajima T, Kaira K and Takeyoshi I: High-grade
neuroendocrine carcinoma of the lung shows increased thymidylate
synthase expression compared to other histotypes. J Surg Oncol.
102:11–17. 2010. View Article : Google Scholar : PubMed/NCBI
|
|
21
|
Sasako M, Terashima M, Ichikawa W, Ochiai
A, Kitada K, Kurahashi I, Sakuramoto S, Katai H, Sano T and Imamura
H: Impact of the expression of thymidylate synthase and
dihydropyrimidine dehydrogenase genes on survival in stage II/III
gastric cancer. Gastric Cancer. 18:538–548. 2015. View Article : Google Scholar : PubMed/NCBI
|
|
22
|
Hou J, Lambers M, den Hamer B, den Bakker
MA, Hoogsteden HC, Grosveld F, Hegmans J, Aerts J and Philipsen S:
Expression profiling-based subtyping identifies novel non-small
cell lung cancer subgroups and implicates putative resistance to
pemetrexed therapy. J Thorac Oncol. 7:105–114. 2012. View Article : Google Scholar : PubMed/NCBI
|
|
23
|
Monica V, Scagliotti GV, Ceppi P, Righi L,
Cambieri A, Lo Iacono M, Saviozzi S, Volante M, Novello S and
Papotti M: Differential thymidylate synthase expression in
different variants of large-cell carcinoma of the lung. Clin Cancer
Res. 15:7547–7552. 2009. View Article : Google Scholar : PubMed/NCBI
|
|
24
|
Sowers R, Toguchida J, Qin J, Meyers PA,
Healey JH, Huvos A, Banerjee D, Bertino JR and Gorlick R: mRNA
expression levels of E2F transcription factors correlate with
dihydrofolate reductase, reduced folate carrier, and thymidylate
synthase mRNA expression in osteosarcoma. Mol Cancer Ther.
2:535–541. 2003.PubMed/NCBI
|
|
25
|
Igawa S, Ryuge S, Wada M, Otani S, Maki S,
Takakura A, Katono K, Sasaki J, Sato Y and Masuda N: Pemetrexed for
previously treated patients with non-small cell lung cancer and
differences in efficacy according to thymidylate synthase
expression. Chemotherapy. 58:313–320. 2012. View Article : Google Scholar : PubMed/NCBI
|
|
26
|
Takezawa K, Okamoto I, Okamoto W, Takeda
M, Sakai K, Tsukioka S, Kuwata K, Yamaguchi H, Nishio K and
Nakagawa K: Thymidylate synthase as a determinant of pemetrexed
sensitivity in non-small cell lung cancer. Br J Cancer.
104:1594–1601. 2011. View Article : Google Scholar : PubMed/NCBI
|
|
27
|
Nicolson MC, Fennell DA, Ferry D, O'Byrne
K, Shah R, Potter V, Skailes G, Upadhyay S, Taylor P, André V, et
al: Thymidylate synthase expression and outcome of patients
receiving pemetrexed for advanced nonsquamous non-small-cell lung
cancer in a prospective blinded assessment phase II clinical trial.
J Thorac Oncol. 8:930–939. 2013. View Article : Google Scholar : PubMed/NCBI
|
|
28
|
Ren DN, Kim IY, Koh SB, Chang SJ, Eom M,
Yi SY, Seong SH, Kim MD, Bronner MP and Cho MY: Comparative
analysis of thymidylate synthase at the protein, mRNA, and DNA
levels as prognostic markers in colorectal adenocarcinoma. J Surg
Oncol. 100:546–552. 2009. View Article : Google Scholar : PubMed/NCBI
|
|
29
|
Tanaka F, Wada H, Fukui Y and Fukushima M:
Thymidylate synthase (TS) gene expression in primary lung cancer
patients: A large-scale study in Japanese population. Ann Oncol.
22:1791–1797. 2011. View Article : Google Scholar : PubMed/NCBI
|