Introduction
Tissue fibrosis alters the tissue architecture and
leads to organ dysfunction, which is major contributor to morbidity
and mortality rates worldwide (1).
The progression of fibrosis is similar in different organs, which
is characterized by the activation and abnormal proliferation of
fibroblasts/myofibroblasts and extracellular matrix remodeling
(2). However, the mechanism
underlying fibrogenesis is complex. Infection with pathogenic
organisms, epigenetic alterations, B cells, transforming growth
factor (TGF)-β signaling and TGFβ/small mothers against
decapentaplegic (SMAD) 33-independent mechanisms have been reported
to be involved in the activation of myofibroblasts (3–7).
Several exogenous factors are also involved in fibrogenesis,
including leptin and hypoxia (8–10).
Previous studies have shown that leptin stimulates the production
of tissue inhibitor of metalloproteinase 1 via the Janus kinase
(JAK)/signal transducer and activator of transcription (STAT)
pathway to directly promote fibrogenesis in hepatic stellate cells
(11). Liver fibrosis is decreased
in leptin- or leptin receptor-deficient mice (12). The in vitro administration
of leptin to primary cardiofibroblasts has been found to result in
the significant stimulation of pro-collagen Iα and also leads to a
decrease in the gene expression of pro-matrix metalloproteinase-8,
-9 and -13 at 24 h, which results in heart fibrosis (13). In addition, leptin is involved in
renal fibrosis (14). Hypoxia is
also an established profibrotic factor (9,15,16).
In hepatic fibrosis, hypoxia acts as a major inducer of
angiogenesis together with inflammation, and hepatic angiogenesis
and fibrosis have been found to be closely associated in clinical
and experimental conditions (8).
Hypoxia was found to induce cardiac fibrosis by upregulating focal
adhesion kinase in cardiac fibroblasts or in a mouse model of
post-myocardial infarction (17).
Hypoxia-induced deoxycytidine kinase contributes to epithelial
proliferation in pulmonary fibrosis (18). Hypoxia is also involved in hepatic
fibrosis through potentiating the activity of hypoxia inducible
factor-1α, either directly or through the epidermal growth factor
(EGF)/mitogen-activated protein kinase (MAPK) and vascular
endothelial growth factor (VEGF)/AKT pathway (8). However, the effects of leptin and
hypoxia on fibrosis remain to be fully elucidated. The aim of the
present study was to investigate the gene expression profiles of
leptin and hypoxia in mouse fibroblast cell line L929 and analyze
their possible biological functions in fibrosis processes. The
present study showed that leptin and hypoxia altered the profiles
of gene expression in L929 cells. The pro-fibrotic roles of leptin
may be through promoting L929 cell proliferation; whereas hypoxia
affected L929 cell function primarily through the chemokine
signaling pathway.
Materials and methods
Cell culture and treatment
The L929 mouse fibroblast cells, purchased from the
Kunming Cell Bank (Kunming, China) were cultured in Dulbecco's
modified Eagle's medium with 5% fetal bovine serum (Gibco; Thermo
Fisher Scientific, Inc., Waltham, MA, USA) in a humidified 5%
CO2 incubator at 37°C. The L929 cells were used for all
the following experiments. For leptin treatment, mouse recombinant
leptin (200 ng/ml; Sigma-Aldrich; Merck Millipore, Darmstadt,
Germany) was added to the cells. For hypoxic treatment, the L929
cells were transferred to a hypoxia chamber (MIC101;
Billups-Rothenberg, Inc., Del Mar, CA, USA) where the total oxygen
concentration was reduced to <1%.
cDNA expression array
The cells were cultured in 10 cm plates with
2.5×10⁶ cells and divided into the following four
groups: Group I, cells cultured in normoxia; Group II, cells
treated with leptin in normoxia; Group III, cells cultured in
hypoxia; Groups IV, cells treated with leptin in hypoxia. Every
group included three parallel samples and the treatment temperature
was 37°C. After 24 h, the cells were collected and placed in TRIzol
reagent (Invitrogen; Thermo Fisher Scientific, Inc.),
respectively.
Total RNA was extracted using TRIzol reagent
according to the manufacturer's protocol. The RNA was purified
using the mirVana miRNA isolation kit (Ambion; Thermo Fisher
Scientific, Inc.). The RNA quality from each sample was assessed by
visualization of the 28S/18S ribosomal RNA ratio using 1%
formaldehyde denaturing gel electrophoresis. The Agilent mouse mRNA
array was designed with eight identical arrays per slide (8×60K
format), with each array containing probes interrogating ~39,430
Entrez Gene RNAs. The array also contained 1,280 Agilent control
probes. The arrays were hybridized in an Agilent hybridization oven
overnight at a rotation speed of 40 g at 42°C and washed with two
consecutive solutions (0.2% SDS, 2X SSC at 42°C for 5 min and 0.2X
SSC for 5 min at room temperature).
The array data were analyzed for data summarization,
normalization and quality control using GeneSpring software V12
(Agilent; Thermo Fisher Scientific, Inc.) (19). To select the differentially
expressed genes (DEGs), threshold values of ≥2 and ≤-2-fold change
(FC) and a P-value of 0.05 were used. The data was
Log2-transformed and median centered by genes using the
Adjust Data function of Cluster 3.0 software (www.falw.vu/~huik/cluster.htm), and then
further analyzed by hierarchical clustering with average linkage
(20). Finally, tree visualization
was performed using Treeview (Stanford University School of
Medicine, Stanford, CA, USA) (21).
Reverse transcription-quantitative
polymerase chain reaction (RT-qPCR) analysis
The DEGs regulated by leptin and hypoxia identified
by the microarray, were verified using RT-qPCR analysis. In total,
five genes [Arrestin β1 (Arrb1), C-C motif ligand (Ccl)1, G
protein-coupled receptor kinase 4 (Grk)4, Ccl17 and C-C motif
chemokine receptor 2 (Ccr2)] were selected. Total RNA was extracted
and the quality was assessed, as described above. The first-strand
cDNA was synthesized using 500 ng total RNA in a 20.0 µl final
volume by reverse transcription utilizing PrimeScript™ RT Master
mix (Perfect Real Time; Takara Bio, Inc., Otsu, Japan).
Subsequently, the cDNA was diluted in five volumes sterile water.
The qPCR was performed in a volume of 20.0 µl using 2.0 µl cDNA,
0.8 µl specific forward primer, 0.8 µl specific reverse primer,
10.0 µl SYBR® Select Master mix (Thermo Fisher
Scientific, USA) and 6.4 µl deionized water. The amplification was
performed using a Roche LightCycler® detection system
(Roche Diagnostics, Indianapolis, IN, USA). The primers (Sangon
Biotech Co, Ltd., Shanghai, China) were as follows: Arrb1, forward
5′-AGGCATCACTGGATAAGGAG-3′ and reverse 5′-GTCTTGTTGGTGTTGTTGGTG-3′;
Ccl1, forward 5′-TTCCCCTGAAGTTTATCCAG-3′ and reverse
5′-GATTTTGAACCCACGTTTTG-3′; Grk4, forward
5′-ATGGAGGGGATTTGAAGTAC-3′ and reverse 5′-CTGGCTTTAGGTCTCTGTAT-3′;
Ccl17, forward 5′-GCTGCCTGGATTACTTCAAAG-3′ and reverse
5′-TTTGTCTTTGGGGTCTGCAC-3′; Ccr2, forward
5′-TGTAGTCACTTGGGTGGTGG-3′ and reverse 5′-TAAGGGCCACAGGTGTAATG-3′.
For all RT-qPCR experiments, negative controls comprised a
non-reverse transcription reaction and a non-sample reaction (data
not shown). Actin was amplified as an internal standard. The
2−∆∆Cq method was applied for data analysis (22).
Functional enrichment analysis
The Database for Annotation, Visualization, and
Integrated Discovery (DAVID) is widely used in functional
enrichment analysis of DEGs (23).
In the present study, DAVID (david.abcc.ncifcrf.gov) was used to perform functional
enrichment analysis for the DEGs regulated by leptin, hypoxia and
the two combined, respectively. The genes were mapped to Gene
Ontology (GO) terms for this purpose. The GO annotation (www.geneontology.org) provides a descriptive framework
and functional annotation of DEGs, and is comprised of biological
processes, cellular components and molecular functions. In
addition, Kyoto Encyclopedia of Genes and Genomes (KEGG; http://www.genome.jp/kegg/) pathway enrichment
analysis was performed to map the potential pathways of the DEGs
(24). The P-value cut-off
associated with this analysis was set at P<0.05 in order to
identify significantly enriched functional terms and pathways.
Cell cycle analysis using flow
cytometry (FCM)
The cells were seeded at a density of
10×104 per well in six-well plates in triplicate and
allowed to adhere for 24 h. Following starvation, the cells were
treated with or without leptin (200 ng/ml) in normoxic conditions
at 37°C. Following culture for 24 h, the cells were harvested and
fixed in 70% cold ethanol at −20°C overnight. The cells were
stained with propidium iodide (Sigma-Aldrich; Merck Millipore) at
50 µg/ml with 20 µg/ml RNase A at room temperature in the dark for
1 h prior to analysis. The cell population fraction in each phase
of the cell cycle was determined as a function of the DNA content
using FCM (FACSCalibur; BD Biosciences, Franklin Lakes, NJ, USA).
Data analysis was performed using FlowJo v10 software (Tree Star,
Inc., Ashland, OR, USA) (25).
This experiment was repeated three times.
Statistical analysis
Values are presented as the mean ± standard
deviation unless otherwise indicated using SPSS version 13.0 (SPSS,
Inc., Chicago, IL, USA). Statistical analysis was performed using
Student's t-test. P<0.05 was considered to indicate a
statistically significant difference.
Results
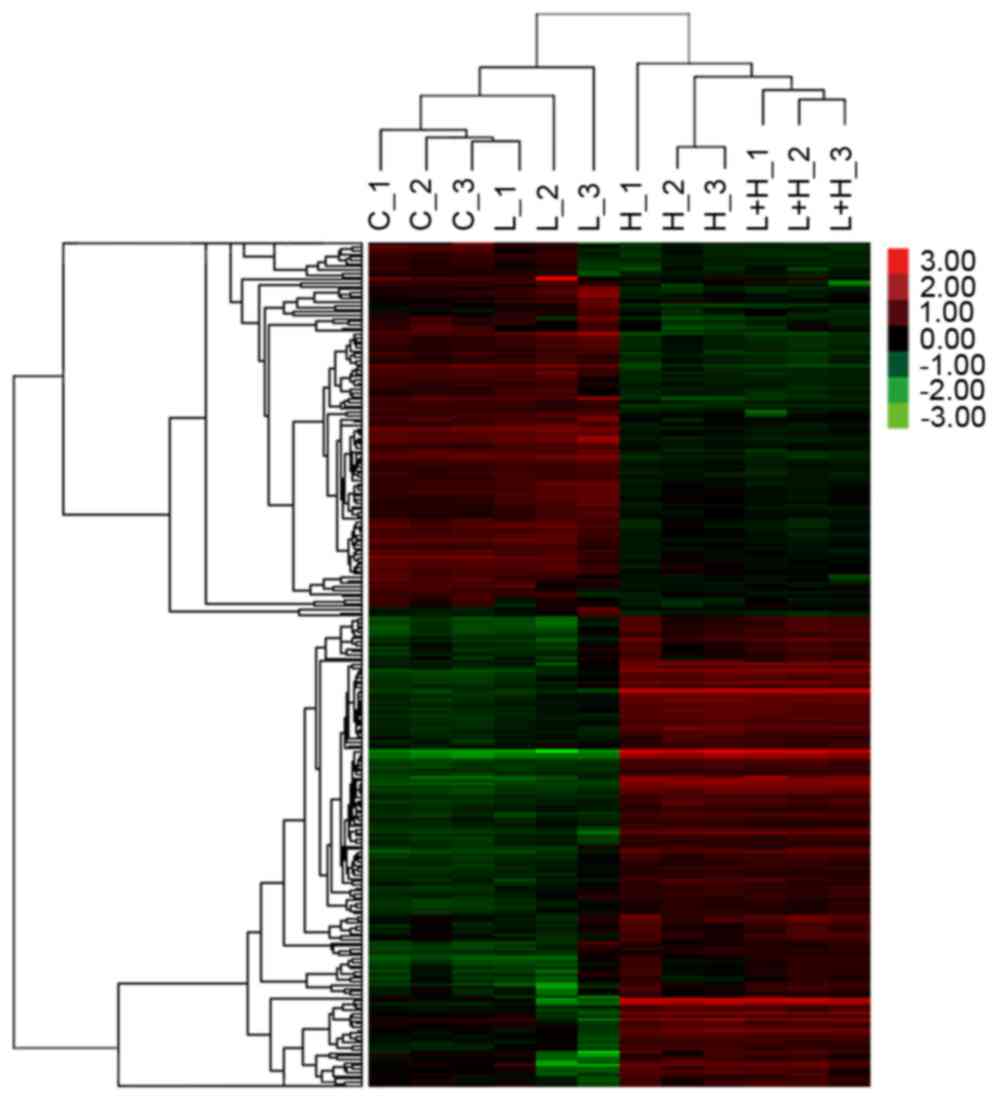
Microarray analysis and hierarchical
clustering
The genes induced in the cultured L929 cells by
leptin, hypoxia and the two combined were analyzed using a cDNA
array. The array included four groups containing 12 samples. The
cluster results of the four sets of microarray data are shown in
Fig. 1. The two primary gene
clusters were identified visually based on the heat map signal
intensity in groups I and II, vs. groups III and IV. The expression
of genes in cluster 1 were higher in groups I and II, compared with
that in groups III and IV, suggesting that those genes may be
suppressed by hypoxia. By contrast, cluster 2 consisted of genes
activated by hypoxia. It appeared that leptin was a weak factor
affecting gene profiling in normoxia and hypoxia.
The genes with FC values >2.0 and P<0.05 were
considered to be a DEG. In the present study, 54 DEGs were found in
the leptin-treated group, of which 52 (96.30%) were downregulated.
A total of 1,507 DEGs were found under hypoxia treatment, of which
467 (30.99%) were downregulated. In the group treated with leptin
and hypoxia, 1,502 DEGs were found, among which 495 (32.96%) were
downregulated. However, compared with the hypoxia group, there were
only 11 genes altered in the leptin and hypoxia treatment group,
comprising three (27.27%) downregulated and eight (72.73%)
upregulated genes.
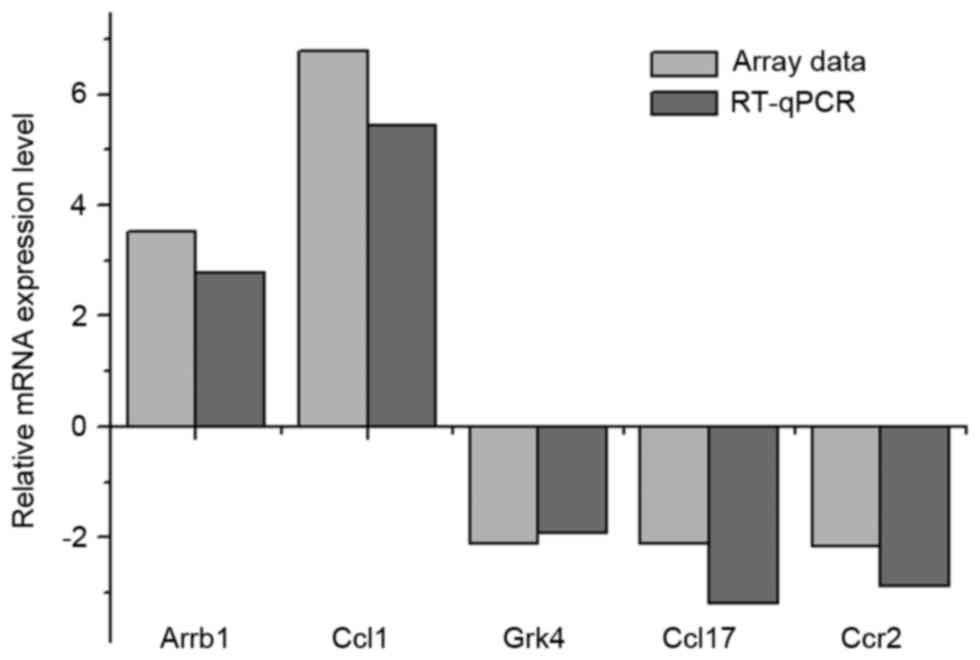
Verification of array data using
RT-qPCR analysis
To assess the reliability of the array data, five
genes (Arrb1, Ccl1, Grk4, Ccl17 and Ccr2) were selected for
amplification, with normoxia and hypoxia samples as a template,
using RT-qPCR analysis. The 2-∆∆Cq method was used for the
determination of target mRNA following normalizing of target mRNA
Cq values with those for actin (ΔCq). In the array data, two genes
(Arrb1 and Ccl1) were upregulated in the hypoxia samples by 3.51-
and 6.78-fold, respectively. In the RT-qPCR experiments, the
upregulated FC values were 2.78- and 5.44-fold, respectively
(Fig. 2). The other three genes
(Grk4, Ccl17 and Ccr2) were downregulated in the hypoxia samples,
by 2.11-, 2.11- and 2.15-fold, respectively, and the FC values in
the RT-qPCR experiments were 1.92-, 3.19- and 2.87-fold,
respectively (Fig. 2). These
results suggested that the array data was in correspondence with
the RT-qPCR experiments.
Functional enrichment analysis
To investigate the biological roles of the DEGs
regulated by leptin, hypoxia and the two combined in L929 cells, a
categorized GO enrichment analysis was performed, comprising 54,
1,507 and 1,502 genes, respectively (Tables I–III). For the DEGs response to leptin,
meiosis I (P=0.004) and synaptonemal complex (P=0.001) were the
most significantly enriched functional terms for biological
processes and cellular components, respectively. For the DEGs
response to hypoxia, glucose metabolic process (P=0.0008), cell
projection part (P=0.003) and ion binding (P=7.8621E-05) were the
most significantly enriched functional terms for biological
processes, cellular components and molecular functions,
respectively. For the DEGs regulated by leptin and hypoxia
combined, phosphate metabolic process (P=0.0007) and extracellular
region (P=0.0022) were the most significantly enriched functional
terms for biological processes and cellular components,
respectively.
 | Table I.GO analysis for the differentially
expressed genes regulated by leptin. |
Table I.
GO analysis for the differentially
expressed genes regulated by leptin.
| Term | Genes (n) | P-value |
|---|
| Molecular
function | – | – |
| Biological
process |
|
GO:0007127 meiosis I | 3 | 0.004056677 |
|
GO:0022402 cell cycle
process | 5 | 0.021448529 |
|
GO:0051327 M phase of meiotic
cell cycle | 3 | 0.023847468 |
|
GO:0007126 meiosis | 3 | 0.023847468 |
|
GO:0007049 cell cycle | 6 | 0.023981901 |
|
GO:0051321 meiotic cell
cycle | 3 | 0.024865727 |
|
GO:0007129 synapsis | 2 | 0.045322159 |
|
GO:0070192 chromosome
organization involved in meiosis | 2 | 0.045322159 |
| Cell component |
|
GO:0000795 synaptonemal
complex | 3 | 0.001322361 |
|
GO:0044454 nuclear chromosome
part | 4 | 0.002698438 |
|
GO:0000793 condensed
chromosome | 4 | 0.003006214 |
|
GO:0000228 nuclear
chromosome | 4 | 0.004250276 |
|
GO:0000794 condensed nuclear
chromosome | 3 | 0.005772372 |
|
GO:0044427 chromosomal
part | 5 | 0.010435104 |
|
GO:0005694 chromosome | 5 | 0.018637296 |
|
GO:0000800 lateral
element | 2 | 0.018883838 |
| Table III.GO analysis for the differentially
expressed genes regulated by leptin and hypoxia. |
Table III.
GO analysis for the differentially
expressed genes regulated by leptin and hypoxia.
| Term | Genes (n) | P-value |
|---|
| Molecular
function | – | – |
| Biological
process |
|
GO:0006796 phosphate metabolic
process | 87 | 0.00069201 |
|
GO:0006793 phosphorus
metabolic process | 87 | 0.00069201 |
|
GO:0016265 death | 57 | 0.000914867 |
|
GO:0006468 protein amino acid
phosphorylation | 67 | 0.001122958 |
|
GO:0017157 regulation of
exocytosis | 9 | 0.001368273 |
|
GO:0008219 cell death | 55 | 0.001517519 |
|
GO:0055114 oxidation
reduction | 68 | 0.002418208 |
|
GO:0012501 programmed cell
death | 51 | 0.002614104 |
|
GO:0044271 nitrogen compound
biosynthetic process | 35 | 0.004597316 |
|
GO:0006915 apoptosis | 49 | 0.004983028 |
|
GO:0016310
phosphorylation | 70 | 0.005034959 |
|
GO:0003016 respiratory system
process | 4 | 0.005961782 |
|
GO:0009743 response to
carbohydrate stimulus | 7 | 0.008246776 |
|
GO:0006006 glucose metabolic
process | 19 | 0.009614291 |
|
GO:0051241 negative regulation
of multicellular organismal process | 15 | 0.010348645 |
|
GO:0007601 visual
perception | 15 | 0.011259001 |
|
GO:0032940 secretion by
cell | 23 | 0.011798862 |
|
GO:0050953 sensory perception
of light stimulus | 15 | 0.012230633 |
|
GO:0046903 secretion | 26 | 0.013035463 |
|
GO:0001666 response to
hypoxia | 11 | 0.013616099 |
|
GO:0070482 response to oxygen
levels | 11 | 0.015106629 |
|
GO:0009746 response to hexose
stimulus | 6 | 0.016635896 |
|
GO:0001974 blood vessel
remodeling | 6 | 0.016635896 |
|
GO:0009749 response to glucose
stimulus | 6 | 0.016635896 |
|
GO:0034284 response to
monosaccharide stimulus | 6 | 0.016635896 |
|
GO:0006730 one-carbon
metabolic process | 16 | 0.01753354 |
|
GO:0009719 response to
endogenous stimulus | 22 | 0.019740633 |
|
GO:0048608 reproductive
structure development | 17 | 0.020659779 |
|
GO:0048545 response to steroid
hormone stimulus | 10 | 0.023972008 |
|
GO:0003013 circulatory system
process | 15 | 0.024166653 |
|
GO:0008015 blood
circulation | 15 | 0.024166653 |
|
GO:0001775 cell
activation | 27 | 0.025299039 |
|
GO:0007242 intracellular
signaling cascade | 81 | 0.02535934 |
|
GO:0006865 amino acid
transport | 11 | 0.026707116 |
|
GO:0006681 galactosylceramide
metabolic process | 3 | 0.027127455 |
|
GO:0019374 galactolipid
metabolic process | 3 | 0.027127455 |
|
GO:0005996 monosaccharide
metabolic process | 22 | 0.028503233 |
|
GO:0019318 hexose metabolic
process | 20 | 0.029456322 |
|
GO:0006470 protein amino acid
dephosphorylation | 15 | 0.029624933 |
|
GO:0045944 positive regulation
of transcription from RNA polymerase II promoter | 36 | 0.030944318 |
|
GO:0006778 porphyrin metabolic
process | 6 | 0.032936937 |
|
GO:0033013 tetrapyrrole
metabolic process | 6 | 0.032936937 |
|
GO:0003006 reproductive
developmental process | 28 | 0.033137813 |
|
GO:0003001 generation of a
signal involved in cell-cell signaling | 12 | 0.033562678 |
|
GO:0009967 positive regulation
of signal transduction | 20 | 0.034460687 |
|
GO:0046324 regulation of
glucose import | 5 | 0.040773001 |
|
GO:0006357 regulation of
transcription from RNA polymerase II promoter | 56 | 0.041404785 |
|
GO:0045893 positive regulation
of transcription, DNA-dependent | 40 | 0.041795439 |
|
GO:0006979 response to
oxidative stress | 12 | 0.041889132 |
|
GO:0051254 positive regulation
of RNA metabolic process | 40 | 0.045730238 |
|
GO:0009220 pyrimidine
ribonucleotide biosynthetic process | 4 | 0.047696549 |
|
GO:0009218 pyrimidine
ribonucleotide metabolic process | 4 | 0.047696549 |
|
GO:0010827 regulation of
glucose transport | 5 | 0.048213767 |
|
GO:0042398 cellular amino acid
derivative biosynthetic process | 8 | 0.049928789 |
| Cell component |
|
GO:0005576 extracellular
region | 145 | 0.002250808 |
|
GO:0044463 cell projection
part | 23 | 0.003001467 |
|
GO:0005777 peroxisome | 16 | 0.00482117 |
|
GO:0042579 microbody | 16 | 0.00482117 |
|
GO:0042995 cell
projection | 55 | 0.011330557 |
|
GO:0045121 membrane raft | 13 | 0.013007776 |
|
GO:0031225 anchored to
membrane | 24 | 0.015194373 |
|
GO:0005886 plasma
membrane | 227 | 0.016114278 |
|
GO:0008021 synaptic
vesicle | 11 | 0.017112432 |
|
GO:0044456 synapse part | 24 | 0.019656437 |
|
GO:0033267 axon part | 6 | 0.025413 |
|
GO:0044421 extracellular
region part | 68 | 0.028509841 |
|
GO:0019898 extrinsic to
membrane | 44 | 0.035509102 |
|
GO:0005730 nucleolus | 31 | 0.035643165 |
|
GO:0043232 intracellular
non-membrane-bounded organelle | 152 | 0.036036538 |
|
GO:0043228
non-membrane-bounded organelle | 152 | 0.036036538 |
Pathway enrichment analysis
KEGG pathway enrichment analysis was performed to
assess the biological roles of the DEGs (Table IV). Axon guidance was the only
significant pathway in response to leptin (P=0.0294). There were 12
significant pathways in response to hypoxia, among which the
chemokine signaling pathway (P=0.00014) was the most significant,
which suggested inflammatory factors were crucial in the response
to hypoxia in L929 cells. For the combined treatment group, nine
pathways were significant, of which eight were identical to the
responses to hypoxia: Nitrogen metabolism, focal adhesion,
chemokine signaling pathway, arginine and proline metabolism,
starch and sucrose metabolism, pyruvate metabolism, VEGF signaling
pathway and MAPK signaling pathway.
| Table IV.Pathway analysis of the
differentially expressed genes regulated by leptin, hypoxia and the
two in combination. |
Table IV.
Pathway analysis of the
differentially expressed genes regulated by leptin, hypoxia and the
two in combination.
| KEGG ID | Term | n | P-value |
|---|
| Leptin-treated |
|
mmu04360 | Axon guidance | 3 | 0.029392665 |
|
Hypoxia-treated |
|
mmu04062 | Chemokine signaling
pathway | 28 | 0.00014053 |
|
mmu00500 | Starch and sucrose
metabolism | 10 | 0.000638251 |
|
mmu00910 | Nitrogen
metabolism | 7 | 0.004127542 |
|
mmu00052 | Galactose
metabolism | 7 | 0.009539235 |
|
mmu04510 | Focal adhesion | 24 | 0.010772098 |
|
mmu00380 | Tryptophan
metabolism | 8 | 0.019533919 |
|
mmu04360 | Axon guidance | 17 | 0.020000767 |
|
mmu00620 | Pyruvate
metabolism | 8 | 0.022185656 |
|
mmu00330 | Arginine and
proline metabolism | 9 | 0.0297123 |
|
mmu04010 | MAPK signaling
pathway | 28 | 0.029963278 |
|
mmu04370 | VEGF signaling
pathway | 11 | 0.03808443 |
|
mmu00010 |
Glycolysis/gluconeogenesis | 10 | 0.046234215 |
| Leptin and
hypoxia-treated |
|
mmu00910 | Nitrogen
metabolism | 7 | 0.004076684 |
|
mmu04510 | Focal adhesion | 25 | 0.005345589 |
|
mmu04062 | Chemokine signaling
pathway | 23 | 0.007744979 |
|
mmu00330 | Arginine and
proline metabolism | 10 | 0.010268331 |
|
mmu00500 | Starch and sucrose
metabolism | 8 | 0.010980612 |
|
mmu00620 | Pyruvate
metabolism | 8 | 0.021915205 |
|
mmu04630 | JAK-STAT signaling
pathway | 18 | 0.035405855 |
|
mmu04370 | VEGF signaling
pathway | 11 | 0.037534097 |
|
mmu04010 | MAPK signaling
pathway | 27 | 0.047450835 |
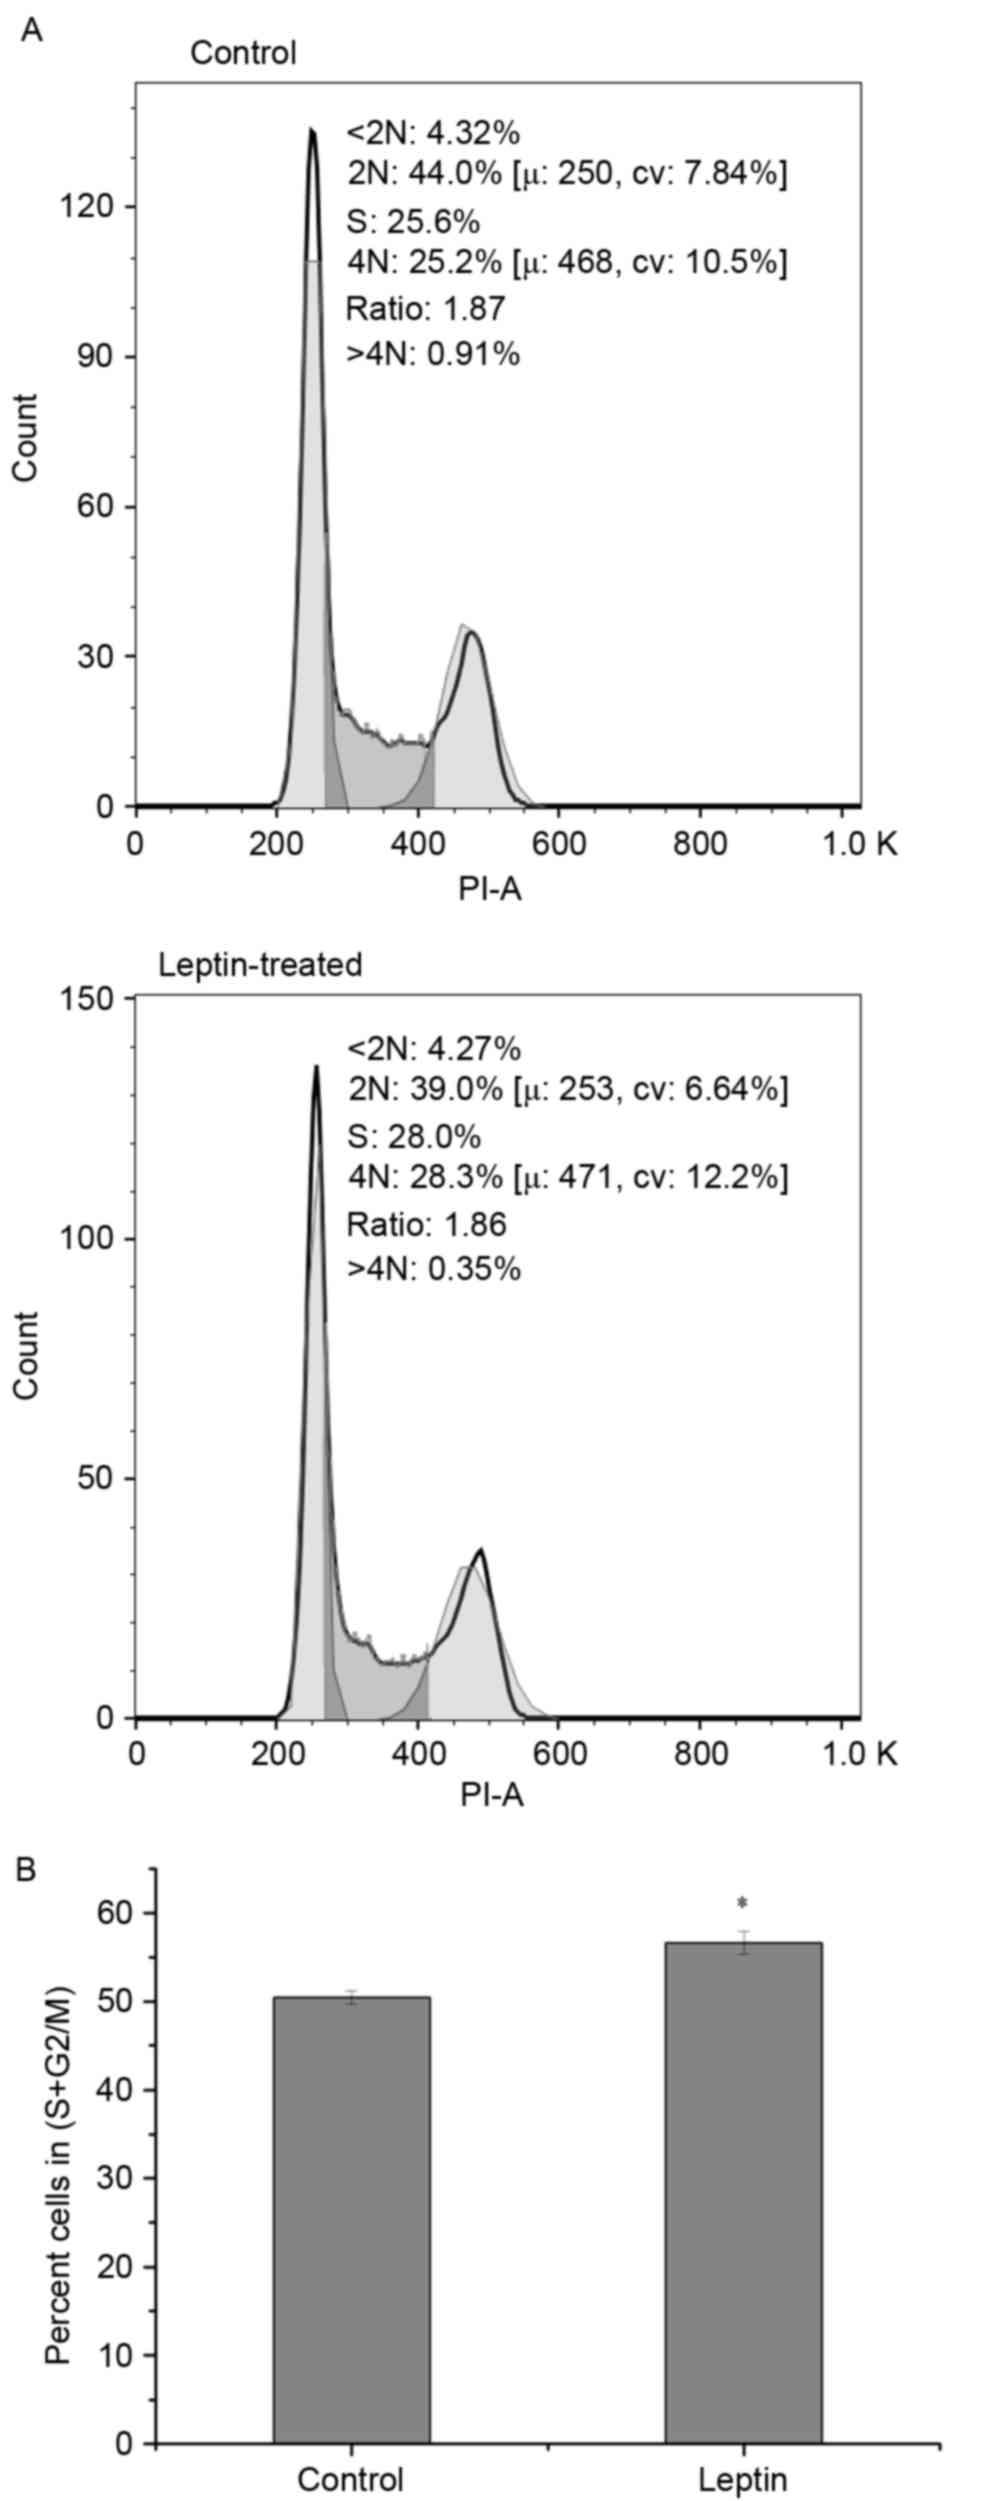
Leptin promotes the proliferation of
L929 cells
The results of the functional enrichment analysis
suggested that leptin affected the cell cycle progression of L929
cells under hypoxia. To confirm this, the numbers of cells in
different cell cycle phases were detected using FCM. Exposing the
L929 cells to leptin resulted in a high percentage of cells in the
S+G2/M phases, which indicated that leptin promoted L929 cell
proliferation (Fig. 3A and B).
Discussion
Investigations have increasingly focused on the
pro-fibrotic microenvironment of organs. Leptin and hypoxia are
pro-fibrotic factors, which are involved in fibrogenesis. In the
present study, a high-throughput microarray method was applied to
detect the expression profile response to leptin, hypoxia and the
two combined in L929 cells. It was found that leptin promoted mouse
fibroblast cell proliferation, whereas hypoxia affected L929 cell
function, primarily through the chemokine signaling pathway.
The present study identified 54 leptin-responsive
genes, 52 of which were downregulated >2-fold. Among these,
nephronophthisis 3, also known as pcy, showed a marked reduction by
3.3-fold. It has been reported that pcy mice undergoing
cystogenesis present with progressive increasingly severe renal
fibrosis (26). Another gene, E2f
transcription factor 4 (E2f4), showed a marked reduction by
3.0-fold. E2f4 is important in the suppression of
proliferation-associated genes and is involved in the G1/S phase of
the mitotic cell cycle (27–30).
This may account for the percentage of cells in the G1/S phase
being decreased and that in the S+G2/M being increased in response
to leptin. Leptin-stimulated cell proliferation had been reported
previously, including in vascular smooth muscle cell proliferation
(31), hepatic stellate cells
(32) and cancer cells (33).
Pathway analysis revealed the significant pathway
regulated by leptin was axon guidance, of which three genes, Eph
receptor A5, Rho-associated coiled-coil containing protein kinase 1
(Rock1) and semaphoring 6D, were significantly affected. These
results were concordant with previous studies. A study by Simerly
(34) found that leptin may direct
the development of hypothalamic pathways by promoting axonal
projections. A study by Harrold (35) indicated novel regulatory roles for
leptin in synaptic plasticity and axon guidance.
Several genes varied in response to hypoxia. The
most significant pathway response to hypoxia was the chemokine
signaling pathway, and the expression of 28 genes (Ccl1, adenylate
cyclase 4, protein kinase C, G protein subunit α1, Cxcl9, G protein
subunit γ (Gng)13, Cxcl10, dedicator of cytokinesis 2, son of
sevenless homolog 1, Gng2, phosphoinositide-3-kinase regulatory
subunit 3, phospholipase Cβ2, SHC adaptor protein 2, AKT
serine/threonine kinase 2, Gng7, mitogen-activated protein kinase
kinase 1, Rock1, vav guanine nucleotide exchange factor 1, Ccl17,
engulfment and cell motility 1, Arrb1, glycogen synthase kinase 3β,
Ccr2, G protein subunit β5, RAP1A, member of RAS oncogene family,
Grk4, Jak3 and Crk) were altered in this pathway. Among these, Ccr2
and CC chemokine ligand 2 (Ccl2) receptor were previously reported
to be altered in oxygen shortage (36). In addition, Cxcl9, Cxcl10 and Ccl17
have been reported to be involved in the pathogenesis of lung
fibrosis (37). This result
further suggested that inflammation was important in L929 function,
particularly in pathological states. Therefore, it was hypothesized
that the hypoxic microenvironment facilitates L929 cell
proliferation through the chemokine signaling pathway, and the
uncontrolled inflammation further promotes fibrosis. Further
understanding of the mechanisms involved in chemokine-mediated cell
proliferation may lead to improved therapeutic strategies in
fibrosis.
Several other pathways were involved in the response
to hypoxia, including starch and sucrose metabolism, nitrogen
metabolism and galactose metabolism. These pathways associated to
metabolism were in accordance with expectations, as cell adaptation
to low oxygen concentrations involves repression of mitochondrial
respiration and induction of glycolysis to sustain cell function in
hypoxic conditions (38). Axon
guidance was also a significant pathway response to hypoxia and to
leptin, which was coincident with a previous study (39). Therefore, under hypoxia, several
pathways may function in concert to restore oxygen supply to cells
and modulate cell function to adapt the hypoxic conditions.
In conclusion, the present study showed that leptin
and hypoxia altered gene expression profiles in L929 cells. The
results suggested that the pro-fibrotic effects of leptin may be
through promoting mouse fibroblast cell proliferation; whereas
hypoxia affected mouse fibroblast cell function predominantly
through the chemokine signaling pathway. These findings improve
understanding of leptin and hypoxia in fibroblast cells. Axon
guidance and the chemokine signaling pathway may represent novel
therapeutic targets for leptin and hypoxia injury in fibrogenesis,
and require further investigation.
Acknowledgements
This study was supported by grants from the National
Natural Science Foundation of China (grant nos. 81200082, 81302244
and 81502899), the Medical Science and Technology Research Fund of
Guangdong province (grant no. B2012272) and the PhD Start-up Fund
of Guangdong Medical College (grant no. B2011019).
References
|
1
|
Sziksz E, Pap D, Lippai R, Béres NJ,
Fekete A, Szabó AJ and Vannay Á: Fibrosis related inflammatory
mediators: Role of the IL-10 cytokine family. Mediators Inflamm.
2015:7646412015. View Article : Google Scholar : PubMed/NCBI
|
|
2
|
Tacke F and Trautwein C: Mechanisms of
liver fibrosis resolution. J Hepatol. 63:1038–1039. 2015.
View Article : Google Scholar : PubMed/NCBI
|
|
3
|
Wynn TA: Cellular and molecular mechanisms
of fibrosis. J Pathol. 214:199–210. 2008. View Article : Google Scholar : PubMed/NCBI
|
|
4
|
Peters S: Cystic fibrosis: A review of
pathophysiology and current treatment recommendations. S D Med.
67:148–151, 153. 2014.PubMed/NCBI
|
|
5
|
Tao H, Shi KH, Yang JJ, Huang C, Liu LP
and Li J: Epigenetic regulation of cardiac fibrosis. Cell Signal.
25:1932–1938. 2013. View Article : Google Scholar : PubMed/NCBI
|
|
6
|
Uhal BD: Epithelial apoptosis in the
initiation of lung fibrosis. Eur Respir J Suppl. 44:S7–S9. 2003.
View Article : Google Scholar
|
|
7
|
Friedman SL: Hepatic fibrosis-overview.
Toxicology. 254:120–129. 2008. View Article : Google Scholar : PubMed/NCBI
|
|
8
|
Zhan L, Huang C, Meng XM, Song Y, Wu XQ,
Yang Y and Li J: Hypoxia-inducible factor-1alpha in hepatic
fibrosis: A promising therapeutic target. Biochimie. 108:1–7. 2015.
View Article : Google Scholar : PubMed/NCBI
|
|
9
|
Lokmic Z, Musyoka J, Hewitson TD and Darby
IA: Hypoxia and hypoxia signaling in tissue repair and fibrosis.
Int Rev Cell Mol Biol. 296:139–185. 2012. View Article : Google Scholar : PubMed/NCBI
|
|
10
|
Martínez-Martínez E, Jurado-López R,
Valero-Muñoz M, Bartolomé MV, Ballesteros S, Luaces M, Briones AM,
López-Andrés N, Miana M and Cachofeiro V: Leptin induces cardiac
fibrosis through galectin-3, mTOR and oxidative stress: Potential
role in obesity. J Hypertens. 32:1104–1114. 2014. View Article : Google Scholar : PubMed/NCBI
|
|
11
|
Handy JA, Fu PP, Kumar P, Mells JE, Sharma
S, Saxena NK and Anania FA: Adiponectin inhibits leptin signalling
via multiple mechanisms to exert protective effects against hepatic
fibrosis. Biochem J. 440:385–395. 2011. View Article : Google Scholar : PubMed/NCBI
|
|
12
|
Chuang JH, Wang PW and Tai MH: An
adipocentric view of liver fibrosis and cirrhosis. Chang Gung Med
J. 27:855–868. 2004.PubMed/NCBI
|
|
13
|
Zibadi S, Cordova F, Slack EH, Watson RR
and Larson DF: Leptin's regulation of obesity-induced cardiac
extracellular matrix remodeling. Cardiovasc Toxicol. 11:325–333.
2011. View Article : Google Scholar : PubMed/NCBI
|
|
14
|
Koyama Y and Brenner DA: New therapies for
hepatic fibrosis. Clin Res Hepatol Gastroenterol. 39:(Suppl 1).
S75–S79. 2015. View Article : Google Scholar : PubMed/NCBI
|
|
15
|
Xie S, Chen H, Li F, Wang S and Guo J:
Hypoxia-induced microRNA-155 promotes fibrosis in proximal tubule
cells. Mol Med Rep. 11:4555–4560. 2015.PubMed/NCBI
|
|
16
|
Tang J, Jiang X, Zhou Y and Dai Y: Effects
of A2BR on the biological behavior of mouse renal fibroblasts
during hypoxia. Mol Med Rep. 11:4397–4402. 2015.PubMed/NCBI
|
|
17
|
Fan GP, Wang W, Zhao H, Cai L, Zhang PD,
Yang ZH, Zhang J and Wang X: Pharmacological inhibition of focal
adhesion kinase attenuates cardiac fibrosis in mice cardiac
fibroblast and post-myocardial-infarction models. Cell Physiol
Biochem. 37:515–526. 2015. View Article : Google Scholar : PubMed/NCBI
|
|
18
|
Melo NC, Amorim FF and Santana AN:
Connecting the dots: Hypoxia, pulmonary fibrosis, obstructive sleep
apnea, and aging. Am J Respir Crit Care Med. 191:9662015.
View Article : Google Scholar : PubMed/NCBI
|
|
19
|
Koyama D, Maruoka S, Gon Y, Shintani Y,
Sekiyama T, Hiranuma H, Shikano S, Kuroda K, Takeshita I, Tsuboi E,
et al: Myeloid differentiation-2 is a potential biomarker for the
amplification process of allergic airway sensitization in mice.
Allergol Int. 64:(Suppl). S37–S45. 2015. View Article : Google Scholar : PubMed/NCBI
|
|
20
|
Wang WM, Zhao ZL, Zhang WF, Zhao YF, Zhang
L and Sun ZJ: Role of hypoxia-inducible factor-1α and CD146 in
epidermal growth factor receptor-mediated angiogenesis in salivary
gland adenoid cystic carcinoma. Mol Med Rep. 12:3432–3438.
2015.PubMed/NCBI
|
|
21
|
Kulsum U, Singh V, Sharma S, Srinivasan A,
Singh TP and Kaur P: RASOnD-a comprehensive resource and search
tool for RAS superfamily oncogenes from various species. BMC
Genomics. 12:3412011. View Article : Google Scholar : PubMed/NCBI
|
|
22
|
Bouchard L, Thibault S, Guay SP, Santure
M, Monpetit A, St-Pierre J, Perron P and Brisson D: Leptin gene
epigenetic adaptation to impaired glucose metabolism during
pregnancy. Diabetes Care. 33:2436–2441. 2010. View Article : Google Scholar : PubMed/NCBI
|
|
23
|
da Huang W, Sherman BT and Lempicki RA:
Systematic and integrative analysis of large gene lists using DAVID
bioinformatics resources. Nat Protoc. 4:44–57. 2009. View Article : Google Scholar : PubMed/NCBI
|
|
24
|
Baba SA, Mohiuddin T, Basu S, Swarnkar MK,
Malik AH, Wani ZA, Abbas N, Singh AK and Ashraf N: Comprehensive
transcriptome analysis of Crocus sativus for discovery and
expression of genes involved in apocarotenoid biosynthesis. BMC
Genomics. 16:6982015. View Article : Google Scholar : PubMed/NCBI
|
|
25
|
Munson ME: An improved technique for
calculating relative response in cellular proliferation
experiments. Cytometry A. 77:909–910. 2010. View Article : Google Scholar : PubMed/NCBI
|
|
26
|
Okada H, Ban S, Nagao S, Takahashi H,
Suzuki H and Neilson EG: Progressive renal fibrosis in murine
polycystic kidney disease: An immunohistochemical observation.
Kidney Int. 58:587–597. 2000. View Article : Google Scholar : PubMed/NCBI
|
|
27
|
Zhao X, Harashima H, Dissmeyer N, Pusch S,
Weimer AK, Bramsiepe J, Bouyer D, Rademacher S, Nowack MK, Novak B,
et al: A general G1/S-phase cell-cycle control module in the
flowering plant Arabidopsis thaliana. PLoS Genet. 8:e10028472012.
View Article : Google Scholar : PubMed/NCBI
|
|
28
|
Chang CN, Feng MJ, Chen YL, Yuan RH and
Jeng YM: p15(PAF) is an Rb/E2F-regulated S-phase protein essential
for DNA synthesis and cell cycle progression. PLoS One.
8:e611962013. View Article : Google Scholar : PubMed/NCBI
|
|
29
|
Paquin MC, Cagnol S, Carrier JC, Leblanc C
and Rivard N: ERK-associated changes in E2F4 phosphorylation,
localization and transcriptional activity during mitogenic
stimulation in human intestinal epithelial crypt cells. BMC Cell
Biol. 14:332013. View Article : Google Scholar : PubMed/NCBI
|
|
30
|
Garneau H, Paquin MC, Carrier JC and
Rivard N: E2F4 expression is required for cell cycle progression of
normal intestinal crypt cells and colorectal cancer cells. J Cell
Physiol. 221:350–358. 2009. View Article : Google Scholar : PubMed/NCBI
|
|
31
|
Oda A, Taniguchi T and Yokoyama M: Leptin
stimulates rat aortic smooth muscle cell proliferation and
migration. Kobe J Med Sci. 47:141–150. 2001.PubMed/NCBI
|
|
32
|
Si HF, Li J, Lü XW and Jin Y: Suppressive
effects of leflunomide on leptin-induced collagen I production
involved in hepatic stellate cell proliferation. Exp Biol Med
(Maywood). 232:427–436. 2007.PubMed/NCBI
|
|
33
|
Garofalo C, Koda M, Cascio S, Sulkowska M,
Kanczuga-Koda L, Golaszewska J, Russo A, Sulkowski S and Surmacz E:
Increased expression of leptin and the leptin receptor as a marker
of breast cancer progression: Possible role of obesity-related
stimuli. Clin Cancer Res. 12:1447–1453. 2006. View Article : Google Scholar : PubMed/NCBI
|
|
34
|
Simerly RB: Wired on hormones: Endocrine
regulation of hypothalamic development. Curr Opin Neurobiol.
15:81–85. 2005. View Article : Google Scholar : PubMed/NCBI
|
|
35
|
Harrold JA: Leptin leads hypothalamic
feeding circuits in a new direction. Bioessays. 26:1043–1045. 2004.
View Article : Google Scholar : PubMed/NCBI
|
|
36
|
Kitase Y, Yokozeki M, Fujihara S, Izawa T,
Kuroda S, Tanimoto K, Moriyama K and Tanaka E: Analysis of gene
expression profiles in human periodontal ligament cells under
hypoxia: The protective effect of CC chemokine ligand 2 to oxygen
shortage. Arch Oral Biol. 54:618–624. 2009. View Article : Google Scholar : PubMed/NCBI
|
|
37
|
Agostini C and Gurrieri C:
Chemokine/cytokine cocktail in idiopathic pulmonary fibrosis. Proc
Am Thorac Soc. 3:357–363. 2006. View Article : Google Scholar : PubMed/NCBI
|
|
38
|
Kim JW, Tchernyshyov I, Semenza GL and
Dang CV: HIF-1-mediated expression of pyruvate dehydrogenase
kinase: A metabolic switch required for cellular adaptation to
hypoxia. Cell Metab. 3:177–185. 2006. View Article : Google Scholar : PubMed/NCBI
|
|
39
|
Xu J and Kisseleva T: Bone marrow-derived
fibrocytes contribute to liver fibrosis. Exp Biol Med (Maywood).
240:691–700. 2015. View Article : Google Scholar : PubMed/NCBI
|