Introduction
Liver cancer is the fifth most common malignant
tumor worldwide and ranks third in terms of mortality, with
∼500,000 new cases annually. The incidence of liver cancer is high
in develo ping countries, which account for 81% of all liver cancer
cases, with liver cancer patients in China accounting for 54% of
the total. Liver cancer is the second most common cause of
cancer-related mortality (1,2) and is
characterized by late diagnosis, poor prognosis, metastatic
tendency and insensitivity to chemotherapy or radiotherapy. A
previous study indicated that the occurrence of liver cancer is a
slow process of gradual changes that develop mainly as a
consequence of chronic hepatitis and hepatic fibrosis. Those
pathological processes include alterations in gene and protein
expression (3).
With the advent of the post-genomic era, the study
focus of bioscience has shifted from genomics to proteomics. The
research areas of proteomics mainly cover three aspects:
differential protein expressions during disease generation and
progress, polypeptide or protein identification, and their
post-translational modification and interactions between proteins
(4). Quantitative proteomics have
been a study focus over the last few years and they involve the
quantitative description of protein expression levels and their
alterations according to variations in time and space or under
various physiological or pathological conditions. This has become
an important novel approach to studying proteomics. Quantitative
proteomics may promote proteomics research, provide a new method of
identifying new potential tumor labeling (5), provide a new methodological basis for
the research on novel chemotherapeutic drugs and facilitate
improvement of comprehensive cancer treatment.
At present, two-dimensional (2D) gel electrophoresis
is mainly employed in the research protocol of biomass
spectrometry-based quantitative proteomics. 2D gel electrophoresis
separates proteins according to their two physicochemical
properties, isoelectric point (IEP) and varying molecular weight,
in order to isolate the proteins of complex biological samples on a
2D plane. Through silver staining or fluorescent dye imaging, the
2D map is scanned by the computer and PDQuest (Bio-Rad Hercules,
CA, USA) or Image Master (Imatest LLC, Boulder, CO, USA) software
is used to analyze results and identify differential proteins.
Subsequently, the proteins are extracted from the gel for
enzymolysis and biomass spectrometry detection (6,7). 2D
gel electrophoresis is based on the traditional separation approach
of biomass spectrometry proteomics and it is not able to isolate
proteins that are overly acidic or alkaline or proteins and
membrane proteins of very high or low molecular weight. This method
has certain disadvantages, such as poor repeatability, low
accuracy, difficulty in automation and failure to meet high-flux
analysis requirements.
In this study, human liver cancer cells and normal
liver cells were isolated, cultured and used as control models.
Stable isotope labeling was introduced chemically and LTQ ObiTrap
biomass spectrometry detection was performed. Differential proteins
were screened for biological identification. This study may enrich
the available biological data on liver cancer and provide a
methodological basis for further elucidation of generation, drug
resistance, metastasis and recurrence following resection or other
pathological process.
Materials and methods
Materials
Human liver cancer and normal liver tissues were
obtained by surgery and provided by the Hepatopancreatobiliary
Surgery Department of the Affiliated Hospital of Guilin Medical
University, with the approval of the local Ethics Committee. The
cocktail of protease inhibitors was purchased from Roche
Diagnostics (Mannhaim, Germany). CH2O, CD2O, pancreatin and cyano
sodium borohydride were purchased from Sigma (St. Louis, MO, USA).
The Finnigan liquid chromatograph, cell culture chamber and LTQ
ObiTrap mass spectrometer were purchased from Thermo Fisher
Scientific, Inc. (Waltham, MA, USA). All the antibodies were
purchased from Santa Cruz Biotechnology (Santa Cruz, CA, USA).
Separation and culture of human liver
cancer and normal liver cells
Human liver cancer and normal liver tissues were
retrieved from 40 adult male patients who underwent liver cancer
resection and 30 adult male patients who underwent partial liver
resection. The study was approved by the Ethics Committee of the
Affiliated Hospital of Guilin Medical University. Cell isolation
was conducted as previously described (8). The viability of isolated hepatocytes
was determined by trypan blue exclusion. Cell suspensions with
viabilities >85% were plated and cultured for subsequent
experiments. After the cells were homogenized by pipetting lightly
until uniform, they were transferred in a culture bottle with a
bottom area of 25 cm2 at a density of 1×10⁶
cells/ml and placed into the hatch chamber under 5% CO2
and 95% O2 for culture. The culture medium comprised 15%
heat-inactivated fetal calf serum (Gibco, Carlsbad, CA, USA), 84%
Dulbecco’s modified Eagle’s medium (Sigma) and 1% penicillin and
streptomycin.
Sample preparation
The cells were collected when they reached ∼80%
confluence. A total of 1×10⁷ cells were added to 3 ml of
cell lysis solution [200 mM NaCl, 50 mM Tris-HCl (pH 8.0), 65 mM
dithiothreitol (DTT)] with 1 mM of the protease inhibitor
phenylmethylsulfonyl fluoride (PMSF) and 60 μl of the
protease inhibitor cocktail. Ultrasonication was performed under
the following conditions: 3 sec/cycle with 3-sec intervals between
the cycles and the cells were cooled on ice for 60 min after 180
cycles. A protein precipitation solution was then added, consisting
of acetone:ethanol:acetic acid (50:50:1) and precipitation was
allowed to occur for 24 h at −20°C. Centrifugation at 25,000 × g
was performed for 30 min at 4°C and the supernatant was discarded.
The precipitate was washed with acetone and ethanol precooled at
4°C. Centrifugation at 25,000 × g was again performed for 15 min at
4°C and the supernatant was discarded. The samples were
freeze-dried and dissolved again in 8 M urea and 100 mM
NH4HCO3. The protein concentration was
determined with Coomassie Brilliant Blue (Sigma). A total of 100
μg protein was added to 10 mM DTT in a water bath at 60°C
for 60 min. Indole-3 acetic acid (IAA, 20 mM) was then added for a
light-tight reaction of 30 min. NH4HCO3 (100
mM) was used to dilute the urea to a concentration of 1 M. Trypsin
(1:25) was then added in a water bath at 37°C for 24 h. The samples
were desalted, eluted and freeze-dried.
Stable isotope dimethyl labeling
Stable isotope dimethyl labeling was performed
according to the Boersema method (9) with the appropriate improvements. The
freeze-dried samples were redissolved in 100 μl of 100 mM
tetraethylammonium bromide (TEAB, pH 8.0). CH2O [4
μl 4% (v/v)] and CD2O [4 μl 4% (v/v)] were
used for marking and redissolution of 25 μg TEAB for liver
and normal cancer cells, respectively, in enzymolysis peptides. The
samples were lightly oscillated for even blending. A total of 4
μl 0.6 M NaBH3CN was added for the labeling
reaction at room temperature for 60 min (Fig. 1). Sixty minutes after the labeling
reaction, 16 μl of 1% ammonia water was added and the
samples were oscillated lightly for even blending to terminate the
reaction. Subsequently, 10% (v/v) trifluoroacetic acid (TFA) was
added to further terminate the labeling reaction and acidize the
solution. The two were then blended for desalination, elution and
freezing-drying, followed by redissolution in 30 μl 0.1% TFA
for LTQ OrbiTrap mass spectrometric detection.
Preparation of monolithic column
Two types of monolithic columns were prepared,
according to the method previously described (10,11).
The polymerization solution was prepared via ultrasonic blending of
80 μl ethylene glycol methacrylate phosphate (EGMP), 60 mg
methylenebisacrylamide, 270 μl dimethyl sulfoxide, 200
μl dodecanol, 50 μl dimethylformamide and 2 mg
azobisisobutyronitrile (AIBN) for 15 min. The prepared
polymerization solution entered the capillary of inner diameter
(ID) 150 μm via siphoning. Both ends of the capillary were
sealed with silicon rubber, followed by immersion in a water bath
at 60°C for 12 h. Methanol was used to remove unreacted monomer and
porogen to complete the preparation of a strong cationic exchange
capillary monolithic column. The preparation process of the
inverted capillary monolithic column was similar to that of the
strong cationic exchange capillary monolithic column. The only
difference was the composition of the polymerization solution [100
μl low melting point agarose (LMA), 100 μl
3,4-ethylenedioxy-N-methylamphetamine, 170 μl normal
propanol, 130 μl 1,4-butanediol, 20 μl water and 2 mg
AIBN prepared with ultrasonic blending], which entered a capillary
of ID 75 μm via siphoning. Furthermore, the outlet of the
prepared inverted capillary monolithic column was bent into an
electric spray needle of ID 5 μm with a butane torch and
filled with C18 nanoparticles.
Establishment of 2D nano LC-MS/MS and
sample analysis
The 2D nano HPLC-MS/MS was performed with a Finnigan
Surveyor liquid chromatography pump and an LTQ ObiTrap mass
spectrometer with a flow rate of ∼120 nl/min via split-flow. The
flowing phase was solution A (0.1% formic acid solution), solution
B was 0.1% formic acid in acetonitrile solution and solution C was
1,000 mM NH4Ac (pH 2.7) and 0.1% formic acid solution.
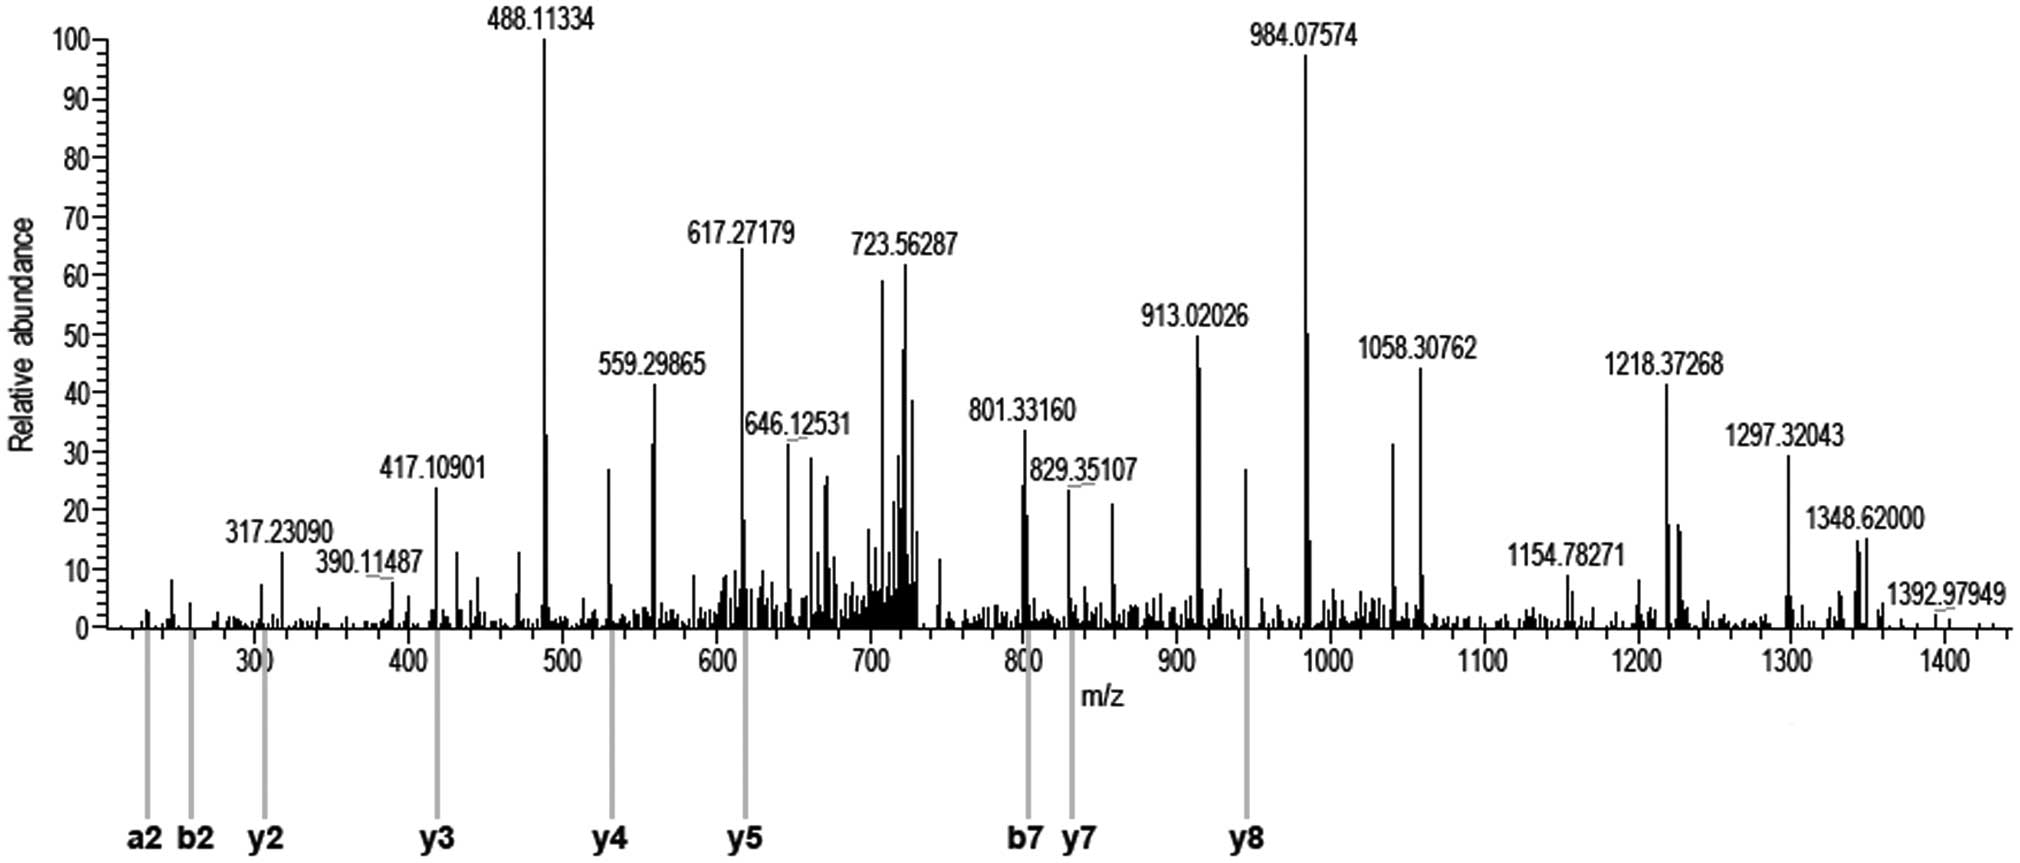
Mass spectra were detected using an LTQ OrbiTrap spectrometer in
cationic mode by applying a voltage of 1.8 kV. The mass
spectrometric (MS) scanning was used to achieve full scan (range,
400–1,800 m/z) followed by MS/MS scan of 6 peaks of full scan. The
basic process was as follows: First, the Finnigan automatic loading
pump was loaded with 25 μl of redissolved labeling sample at
the speed of 10 μl/min onto the phosphate integral material
enriching column (150 μm × 7 cm ID). NH4Ac brine
solution was loaded at 10 different concentrations resulting from
the blending of the flowing phases A and B at the flow rate of 200
nl/min in order to classify and elute the peptides enriched on the
strong cation-exchange monolithic column to C18 (75 μm × 10
cm ID) invert isolation column. The 10 concentrations of the
NH4Ac brine solution were 50, 100, 150, 200, 250, 300,
350, 400, 500 and 1,000 mM NH4Ac. The elution time for
each saline concentration was 10 min. Rebalancing was performed for
10 min with 0.1% of formic acid solution. After each balancing, 2D
nano HPLC-MS/MS had a gradient elution of 155 min with 5 min for
0–5% flowing phase B, 120 min for 5 to 35% flowing phase B, 10 min
for 35 to 80% flowing phase B, 10 min for maintaining 80% flowing
phase B, 2 min of 80 to 0% flowing phase B and 8 min for 100% phase
A balance.
Protein identification and
quantification
The original data were consolidated via DTA Super
Charge (v2.0a7; http://www.xentrik.net/software/mass_spectrometry_-_dta_supercharge.html)
in Mascot generic format and the Mascot search engine (http://www.matrix-science.com) was used to search for
consolidated data at International Protein index (IPI) human
protein database (http://www.ebi.ac.uk), with carbamidomethylation +
57,0215 selected as the fixed modification and oxidation of
methionine (Met) + 15,9949, light-marked dimethylation + 28,0313
(C- and N-terminal) and heavy-marked dimethylation + 32,0564 (C-
and N-terminal) set as the variable modifications. The peptide mass
tolerance was set at 20 ppm and MS/MS tolerance was set at 0.8 Da.
The trypsin enzymolysis maximum leakage cut-off value was set as 2
and the important threshold value was set as 0.01 to ensure a false
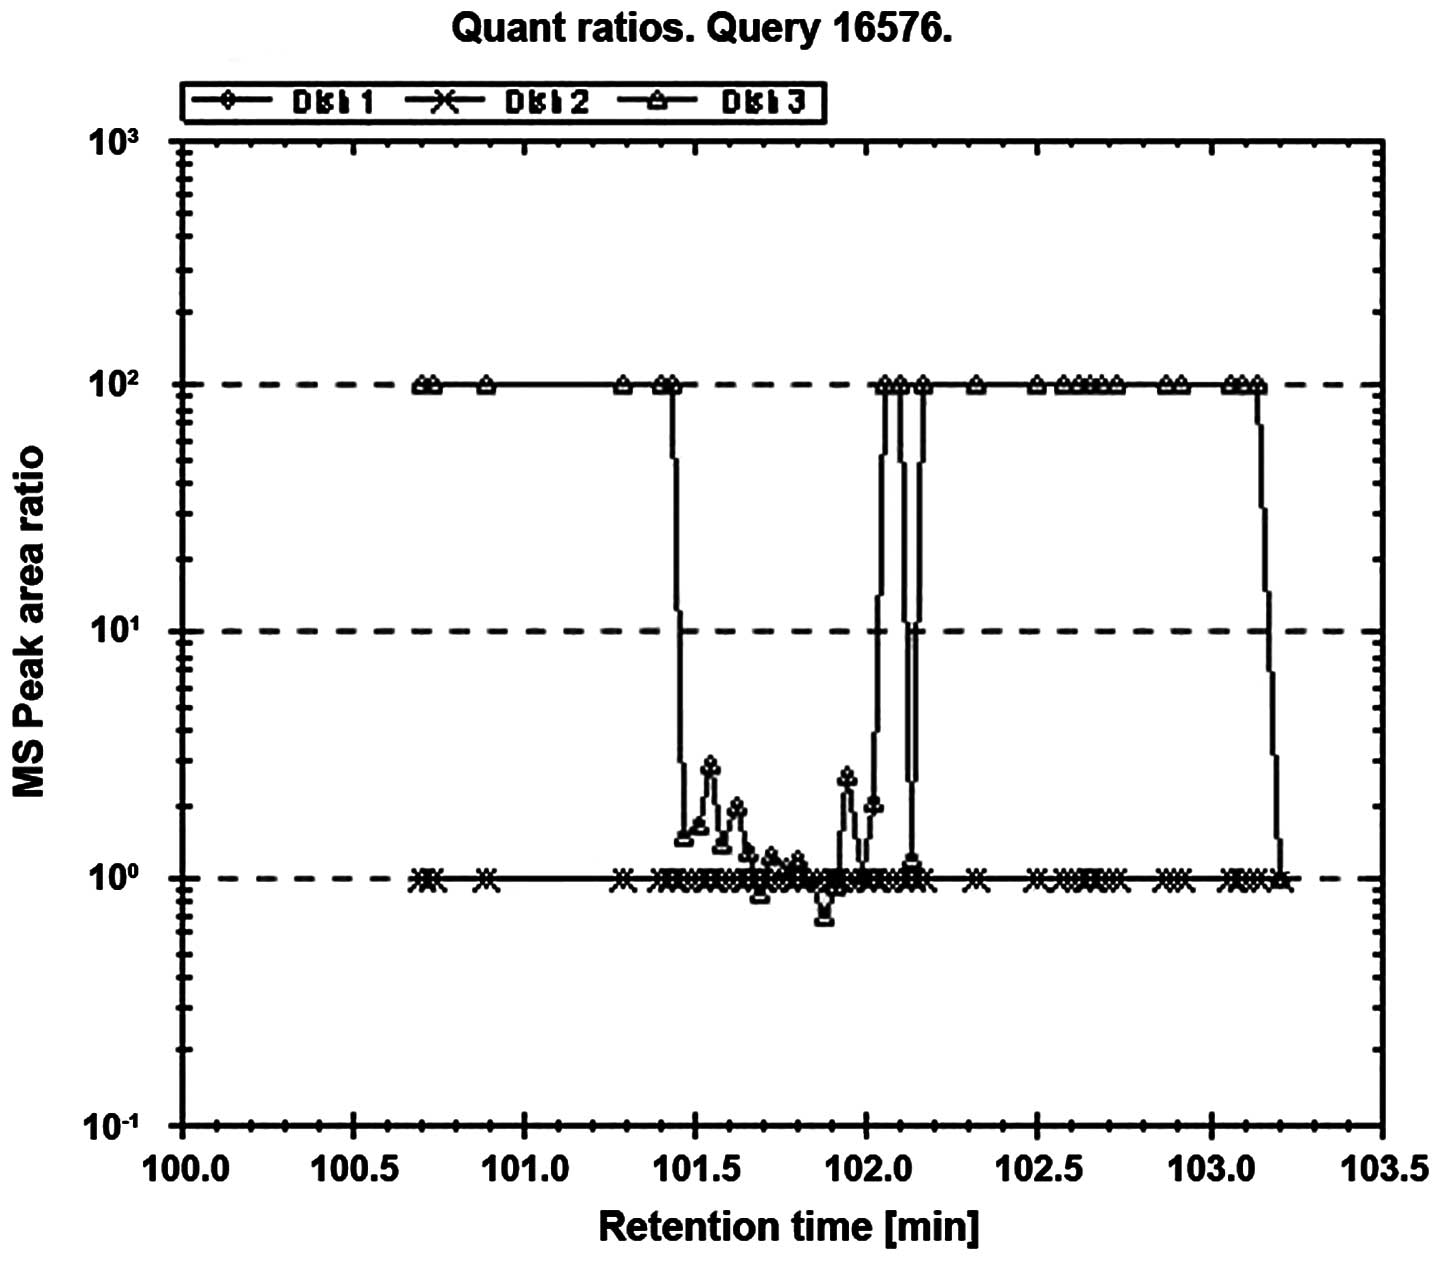
discovery rate of <1%. The protein quantification was obtained
via dimethylation-based MSQuant (http://msquant.sourceforge.net) and a protein
identified by at least three peptides was considered as credible to
investigate the standard deviation of the identified protein. The
protein was selected with peptide MSQuant ≥25 (Grade 1, P≤0.05) as
the ratio and proportion of peptides were obtained from the
calculation of extracted ion chromatograms of the peptide of the
hydrogen and weight scale from the isotopic peak, the proportion of
proteins was the average value of all the peptide proportions with
standardization by StatQuant software (https://trac.nbic.nl/statquant) (12–14).
Western blot analysis
Cells were collected and added to the lysis solution
(50 mM Tris-HCl, 137 mM sodium chloride, 10% glycerin, 100 mM
sodium vanadate, 1 mM PMSF, 10 mg/ml aprotinin, 10 mg/ml leupeptin,
1% NP-40, 5 mM cocktail; pH 7.4) to extract proteins. The protein
concentration was determined with the bicinchoninic acid method and
proteins were dyed with bromophenol blue. The same amount of
protein was added to each well and isolated with 10% sodium dodecyl
sulfate polyacrylamide gel electrophoresis. The proteins were
transferred to a polyvinylidene fluoride membrane with the semi-dry
method and sealed with 5% skimmed milk powder. After washing with
Tris-buffered saline with Tween-20 (TBST), primary antibody was
added for incubation for 1 h, followed by the addition of secondary
antibody for incubation for 1 h. Chemiluminescence was used for
X-ray film exposure. The stripe was scanned for grey-scale
analysis.
Results and Discussion
Liver cancer is one of the most common malignancies
worldwide, causing ∼10,000 deaths annually. The identification of
the early molecular events of tumorigenesis may facilitate and
improve diagnostic efficiency and lead to the development of more
effective treatment strategies. In this study, a 2D nano
LC-MS/MS-based quantitative proteomics analysis of the human liver
cancer cells and normal liver cells was conducted using stable
isotope labeling technology to provide a new method for the
research on quantitative proteomics.
Currently, the main research method of biomass
spectrometric quantitative proteomics is 2D gel electrophoresis. In
a study conducted by Xu et al (15), 2D gel electrophoresis was used to
analyze the glycoproteomics of Chang liver cells and MHCC97-H cells
in order to select 63 differential proteins, including 7
glycoproteins with significant upregulation. Zhang et al
(16) used 2D gel electrophoresis
to analyze the proteomics of G1 phase hepatitis B-relevant liver
cancer and normal liver tissue in order to select 15 differential
proteins and proved the significance of the downregulating protein
proteasome activator subunit 1 in the early diagnosis of liver
cancer. In addition, a study by Suo et al (17) combined 2D gel electrophoresis with
mass spectrum analysis to investigate the proteomics of the HepG2
liver cell strain with sorafenib therapy to identify 19
differential proteins, including 6 upregulating and 13
downregulating proteins. We identified 188 differential proteins in
human liver cancer cells, including 122 upregulating and 66
downregulating proteins, via stable isotope labeling technology
combined with LTQ OrbiTrap mass spectrometric detection. These
differential proteins may play important roles in the occurrence,
drug resistance, metastasis and recurrence of the liver cancer or
other pathological processes.
In the present study the 14-3-3 proteins and TCP1
were screened. The 14-3-3 proteins specifically bind to
serine-phosphorylated proteins and interact with Raf-1, PI-3K,
ASK-1, PKC or other protein kinases, regulating signalling pathways
(18–21). Previous studies demonstrated that
the expression of 14-3-3 proteins β, γ, δ and θ is high in lung
cancer tissue and are associated with malignant potential (22). The expression of 14-3-3 proteins β
and η are high in nerve astrocytoma and are associated with
malignant potential (23).
Furthermore, 14-3-3 protein β has been found to promote the
proliferation of the K2 rat liver cancer cell line (24). Through mass spectrum detection, we
demonstrated that the expression of 14-3-3 proteins α, β, δ, ε, ζ,
η and θ in human liver cancer cells was higher compared to that in
normal liver cells (Table I). Among
these, the expression of 14-3-3 proteins ζ and δ was the most
pronounced (Figs. 2 and 3), suggesting that the ζ and δ subtypes of
the 14-3-3 protein may be involved in the development of human
liver cancer. However, we noted that the expression level of 14-3-3
protein γ in human liver cancer cells was not significantly
different from that in normal liver cells, which was different from
the results reported by Lee et al (25). Western blot analysis was then used
to assess 14-3-3 proteins ζ and δ and our results were identical to
those obtained from the mass spectrum detection (Fig. 4).
 | Table I.Screened differential proteins. |
Table I.
Screened differential proteins.
| IPI | Peptides | D/H | Protein name |
|---|
| IPI00018146 | 3 | 1.535149217 | 14-3-3 protein θ |
| IPI00013122 | 3 | 1.722638965 | Hsp90 co-chaperone
Cdc37 |
| IPI00018465 | 9 | 2.432924271 | T-complex protein 1
subunit η |
| IPI00217223 | 3 | 2.724430084 | Multifunctional
protein ADE2 |
| IPI00216318 | 7 | 2.994079351 | 14-3-3 protein
β/α |
| IPI00009342 | 4 | 3.14406848 | Ras
GTPase-activating-like protein |
| IPI00000816 | 15 | 3.976726055 | 14-3-3 protein ε |
| IPI00021263 | 4 | 16.9955101 | 14-3-3 protein
ζ/δ |
| IPI00013890 | 4 | 17.93141747 | 14-3-3 protein σ |
| IPI00215911 | 4 | 0.304679751 | DNA-(apurinic or
apyrimidinic site) lyase |
| IPI00007750 | 5 | 0.323970616 | Tubulin α-1
chain |
| IPI00003362 | 16 | 0.371136308 | Hypothetical
protein |
| IPI00008274 | 4 | 0.428145468 | Adenylyl
cyclase-associated protein 1 |
| IPI00302925 | 9 | 0.461544245 | T-complex protein 1
subunit θ |
| IPI00465430 | 7 | 0.510590911 | 70-kDa protein |
TCP1 is a molecular chaperone protein and its
subtypes are involved in numerous pathways, including the assembly
and folding of various intracellular proteins. Coghlin et al
(26) reported a high expression of
TCP1β and TCP1ε in colon cancer and suggested that TCP1β may be
associated with the clinical outcome of colon cancer patients via
the use of 2D gel electrophoresis based on biomass spectrum. Iijima
et al (27) demonstrated
that TCP1α is able to prompt cell proliferation. We identified the
differences in the expression of TCP1η and TCP1θ between human
liver cancer cells and normal liver cells and we obtained identical
results via western blot analysis (Fig.
5). This suggested that TCP1η and TCP1θ may also participate in
the progression of human liver cancer. In this study, we screened
for differential 14-3-3 and TCP1 protein families and also observed
that the expression of P70, hypothetical protein or other proteins
in human liver cancer cells were different from those in normal
liver cells. The differential proteins, including 14-3-3 and TCP1
protein families, may be a potential target in the treatment of
liver cancer and a tumor labeling index associated with liver
cancer, playing a critical role in the occurrence, drug resistance,
metastasis and recurrence of liver cancer or other pathological
processes.
In summary, we observed that stable isotope labeling
may overcome the limitations of 2D gel electrophoresis and it has
such advantages as high repeatability, stability, sensitivity and
precise quantification. This chemical reaction is highly stable
with high labeling efficiency. High-flux LTQ OrbiTrap mass
spectrometer is able to effectively measure the molecular weight
difference of 4 Da generated after labeling reaction. This labeling
method may label two or three samples simultaneously and is
suitable for various biological samples. The required sample
quantity ranges from a microgram to a milligram, which is a wide
mass range. The type of MSQuant software applicable to
dimethylation may be used to automatically process data in batch
conveniently and easily. This study has provided extensive
biological data for the research on liver cancer, as well as a
methodological basis for further elucidation of the generation,
drug resistance, metastasis and recurrence following resection or
other pathological process.
Acknowledgements
The authors would like to thank
Professor Ye (Dalian Institute of Chemical Physics, Chinese Academy
of Sciences) for providing valuable assistance and critical
comments on this manuscript. This study was supported by the
National High Technology Research and Development Program (863
Program).
References
|
1
|
Shariff MI, Cox IJ, Gomaa AI, Khan SA,
Gedroyc W and Taylor-Robinson SD: Hepatocellular carcinoma: current
trends in worldwide epidemiology, risk factors, diagnosis and
therapeutics. Expert Rev Gastroenterol Hepatol. 3:353–367. 2009.
View Article : Google Scholar : PubMed/NCBI
|
|
2
|
He J, Gu D, Wu X, Reynolds K, Duan X, Yao
C, Wang J, Chen CS, Chen J, Wildman RP, Klag MJ and Whelton PK:
Major causes of death among men and women in China. N Engl J Med.
353:1124–1134. 2005. View Article : Google Scholar : PubMed/NCBI
|
|
3
|
Thorgeirsson SS and Grisham JW: Molecular
pathogenesis of human hepatocellular carcinoma. Nat Genet.
31:339–346. 2002. View Article : Google Scholar : PubMed/NCBI
|
|
4
|
Pandey A and Mann M: Proteomics to study
genes and genomes. Nature. 405:837–846. 2000. View Article : Google Scholar : PubMed/NCBI
|
|
5
|
Bruix J and Sherman M: Management of
hepatocellular carcinoma. Hepatology. 42:1208–1236. 2005.
View Article : Google Scholar
|
|
6
|
Abdallah C, Dumas-Gaudot E, Renaut J and
Sergeant K: Gel-based and gel-free quantitative proteomics
approaches at a glance. Int J Plant Genomics. 2012:4945722012.
View Article : Google Scholar : PubMed/NCBI
|
|
7
|
Fisher A, Sekera E, Payne J and Craig P:
Simulation of two dimensional electrophoresis and tandem mass
spectrometry for teaching proteomics. Biochem Mol Biol Educ.
40:393–399. 2012. View Article : Google Scholar : PubMed/NCBI
|
|
8
|
Tang B, Zhang Y, Liang R, Yuan P, Du J,
Wang H and Wang L: Activation of the δ-opioid receptor inhibits
serum deprivation-induced apoptosis of human liver cells via the
activation of PKC and the mitochondrial pathway. Int J Mol Med.
28:1077–1085. 2011.
|
|
9
|
Boersema PJ, Raijmakers R, Lemeer S,
Mohammed S and Heck AJ: Multiplex peptide stable isotope dimethyl
labeling for quantitative proteomics. Nat Protoc. 4:484–494. 2009.
View Article : Google Scholar : PubMed/NCBI
|
|
10
|
Wang F, Dong J, Jiang X, Ye M and Zou H:
Capillary trap column with strong cation-exchange monolith for
automated shotgun proteome analysis. Anal Chem. 79:6599–6606. 2007.
View Article : Google Scholar : PubMed/NCBI
|
|
11
|
Wang F, Dong J, Ye M, Jiang X, Wu R and
Zou H: Online multidimensional separation with biphasic monolithic
capillary column for shotgun proteome analysis. J Proteome Res.
7:306–310. 2008. View Article : Google Scholar : PubMed/NCBI
|
|
12
|
Mortensen P, Gouw JW, Olsen JV, Ong SE,
Rigbolt KT, Bunkenborg J, Cox J, Foster LJ, Heck AJ, Blagoev B,
Andersen JS and Mann M: MSQuant, an open source platform for mass
spectrometry-based quantitative proteomics. J Proteome Res.
9:393–403. 2010.PubMed/NCBI
|
|
13
|
Wang F, Chen R, Zhu J, Sun D, Song C, Wu
Y, Ye M, Wang L and Zou H: A fully automated system with online
sample loading, isotope dimethyl labeling and multidimensional
separation for high-throughput quantitative proteome analysis. Anal
Chem. 82:3007–3015. 2010. View Article : Google Scholar
|
|
14
|
Lemeer S, Jopling C, Gouw J, Mohammed S,
Heck AJ, Slijper M and den Hertog J: Comparative phosphoproteomics
of zebrafish Fyn/Yes morpholino knockdown embryos. Mol Cell
Proteomics. 7:2176–2187. 2008. View Article : Google Scholar : PubMed/NCBI
|
|
15
|
Xu Z, Zhou X, Lu H, Wu N, Zhao H, Zhang L,
Zhang W, Liang YL, Wang L, Liu Y, Yang P and Zha X: Comparative
glycoproteomics based on lectins affinity capture of N-linked
glycoproteins from human Chang liver cells and MHCC97-H cells.
Proteomics. 7:2358–2370. 2007. View Article : Google Scholar : PubMed/NCBI
|
|
16
|
Zhang D, Lim SG and Koay ES: Proteomic
identification of down-regulation of oncoprotein DJ-1 and
proteasome activator subunit 1 in hepatitis B virus-infected
well-differentiated hepatocellular carcinoma. Int J Oncol.
31:577–584. 2007.
|
|
17
|
Suo A, Zhang M, Yao Y, Zhang L, Huang C,
Nan K and Zhang W: Proteome analysis of the effects of sorafenib on
human hepatocellular carcinoma cell line HepG2. Med Oncol.
29:1827–1836. 2012. View Article : Google Scholar : PubMed/NCBI
|
|
18
|
Muslin AJ, Tanner JW, Allen PM and Shaw
AS: Interaction of 14-3-3 with signaling proteins is mediated by
the recognition of phosphoserine. Cell. 84:889–897. 1996.
View Article : Google Scholar : PubMed/NCBI
|
|
19
|
Chong ZZ and Maiese K: Erythropoietin
involves the phosphatidylinositol 3-kinase pathway, 14-3-3 protein
and FOXO3a nuclear trafficking to preserve endothelial cell
integrity. Br J Pharmacol. 150:839–850. 2007. View Article : Google Scholar : PubMed/NCBI
|
|
20
|
Cockrell LM, Puckett MC, Goldman EH, Khuri
FR and Fu H: Dual engagement of 14-3-3 proteins controls signal
relay from ASK2 to the ASK1 signalosome. Oncogene. 29:822–830.
2010. View Article : Google Scholar : PubMed/NCBI
|
|
21
|
Gurusamy N, Watanabe K, Ma M, Zhang S,
Muslin AJ, Kodama M and Aizawa Y: Inactivation of 14-3-3 protein
exacerbates cardiac hypertrophy and fibrosis through enhanced
expression of protein kinase C beta 2 in experimental diabetes.
Biol Pharm Bull. 28:957–962. 2005. View Article : Google Scholar
|
|
22
|
Qi W, Liu X, Qiao D and Martinez JD:
Isoform-specific expression of 14-3-3 proteins in human lung cancer
tissues. Int J Cancer. 113:359–363. 2005. View Article : Google Scholar : PubMed/NCBI
|
|
23
|
Yang X, Cao W, Lin H, Zhang W, Lin W, Cao
L, Zhen H, Huo J and Zhang X: Isoform-specific expression of 14-3-3
proteins in human astrocytoma. J Neurol Sci. 276:54–59. 2009.
View Article : Google Scholar : PubMed/NCBI
|
|
24
|
Sugiyama A, Miyagi Y, Komiya Y, Kurabe N,
Kitanaka C, Kato N, Nagashima Y, Kuchino Y and Tashiro F: Forced
expression of antisense 14-3-3beta RNA suppresses tumor cell growth
in vitro and in vivo. Carcinogenesis. 24:1549–1559. 2003.
View Article : Google Scholar : PubMed/NCBI
|
|
25
|
Lee IN, Chen CH, Sheu JC, Lee HS, Huang
GT, Yu CY, Lu FJ and Chow LP: Identification of human
hepatocellular carcinoma-related biomarkers by two-dimensional
difference gel electrophoresis and mass spectrometry. J Proteome
Res. 4:2062–2069. 2005. View Article : Google Scholar : PubMed/NCBI
|
|
26
|
Coghlin C, Carpenter B, Dundas SR, Lawrie
LC, Telfer C and Murray GI: Characterization and over-expression of
chaperonin t-complex proteins in colorectal cancer. J Pathol.
210:351–357. 2006. View Article : Google Scholar : PubMed/NCBI
|
|
27
|
Iijima M, Shimizu H, Tanaka Y and
Urushihara H: A Dictyostelium discoideum homologue to Tcp-1
is essential for growth and development. Gene. 213:101–106.
1998.
|