Introduction
Cisplatin (CDDP) is one of the most potent
anticancer therapeutic agents in clinical use. It is applied in the
treatment of various common types of solid tumor found in tissues,
such as the esophagus and the lungs. However, CDDP is frequently
associated with renal tubular dysfunction and cumulative impairment
in renal function is a dose-limiting factor in the administration
of this anticancer agent (1,2). The mechanism of CDDP-induced
nephrotoxicity is not completely understood. However, the primary
cause of dysfunction is considered to be the high concentration of
CDDP uptake into renal cells, particularly renal proximal tubular
cells, relative to other tissues (3,4).
Moreno-Gordaliza et al (5)
performed fertility laser ablation inductively coupled plasma mass
spectrometry bioimaging analysis, which demonstrated that platinum
(Pt) displaced zinc (Zn) and copper (Cu) within renal cells of
CDDP-treated rats. This result indicates the possibility of limited
tissue distribution of these types of metal and consequent changes
in their blood levels in the early phase of CDDP-based
chemotherapy. Additionally, there is the possibility that CDDP
administration influences the concentrations of other metals in
body fluids. However, there is little information regarding
time-concentration profiles of trace metals during CDDP-based
chemotherapy.
The aim of the present study was to determined the
plasma levels of trace metals, including manganese (Mn), iron (Fe),
cobalt (Co), Cu, Zn, and lead (Pb) in Japanese esophageal and lung
cancer patients receiving CDDP-based chemotherapy.
Materials and methods
Patients and blood samples
The protocol for the current study was approved by
Ethics Committee of Kobe University Hospital (Kobe, Japan). Written
informed consent was obtained from all patients before the start of
the study. Eight patients received neoadjuvant or adjuvant
CDDP-based chemotherapy for esophageal squamous cell carcinoma and
lung adenocarcinoma at Kobe University Hospital (February 2011 to
July 2011). The clinical characteristics of the patients in the
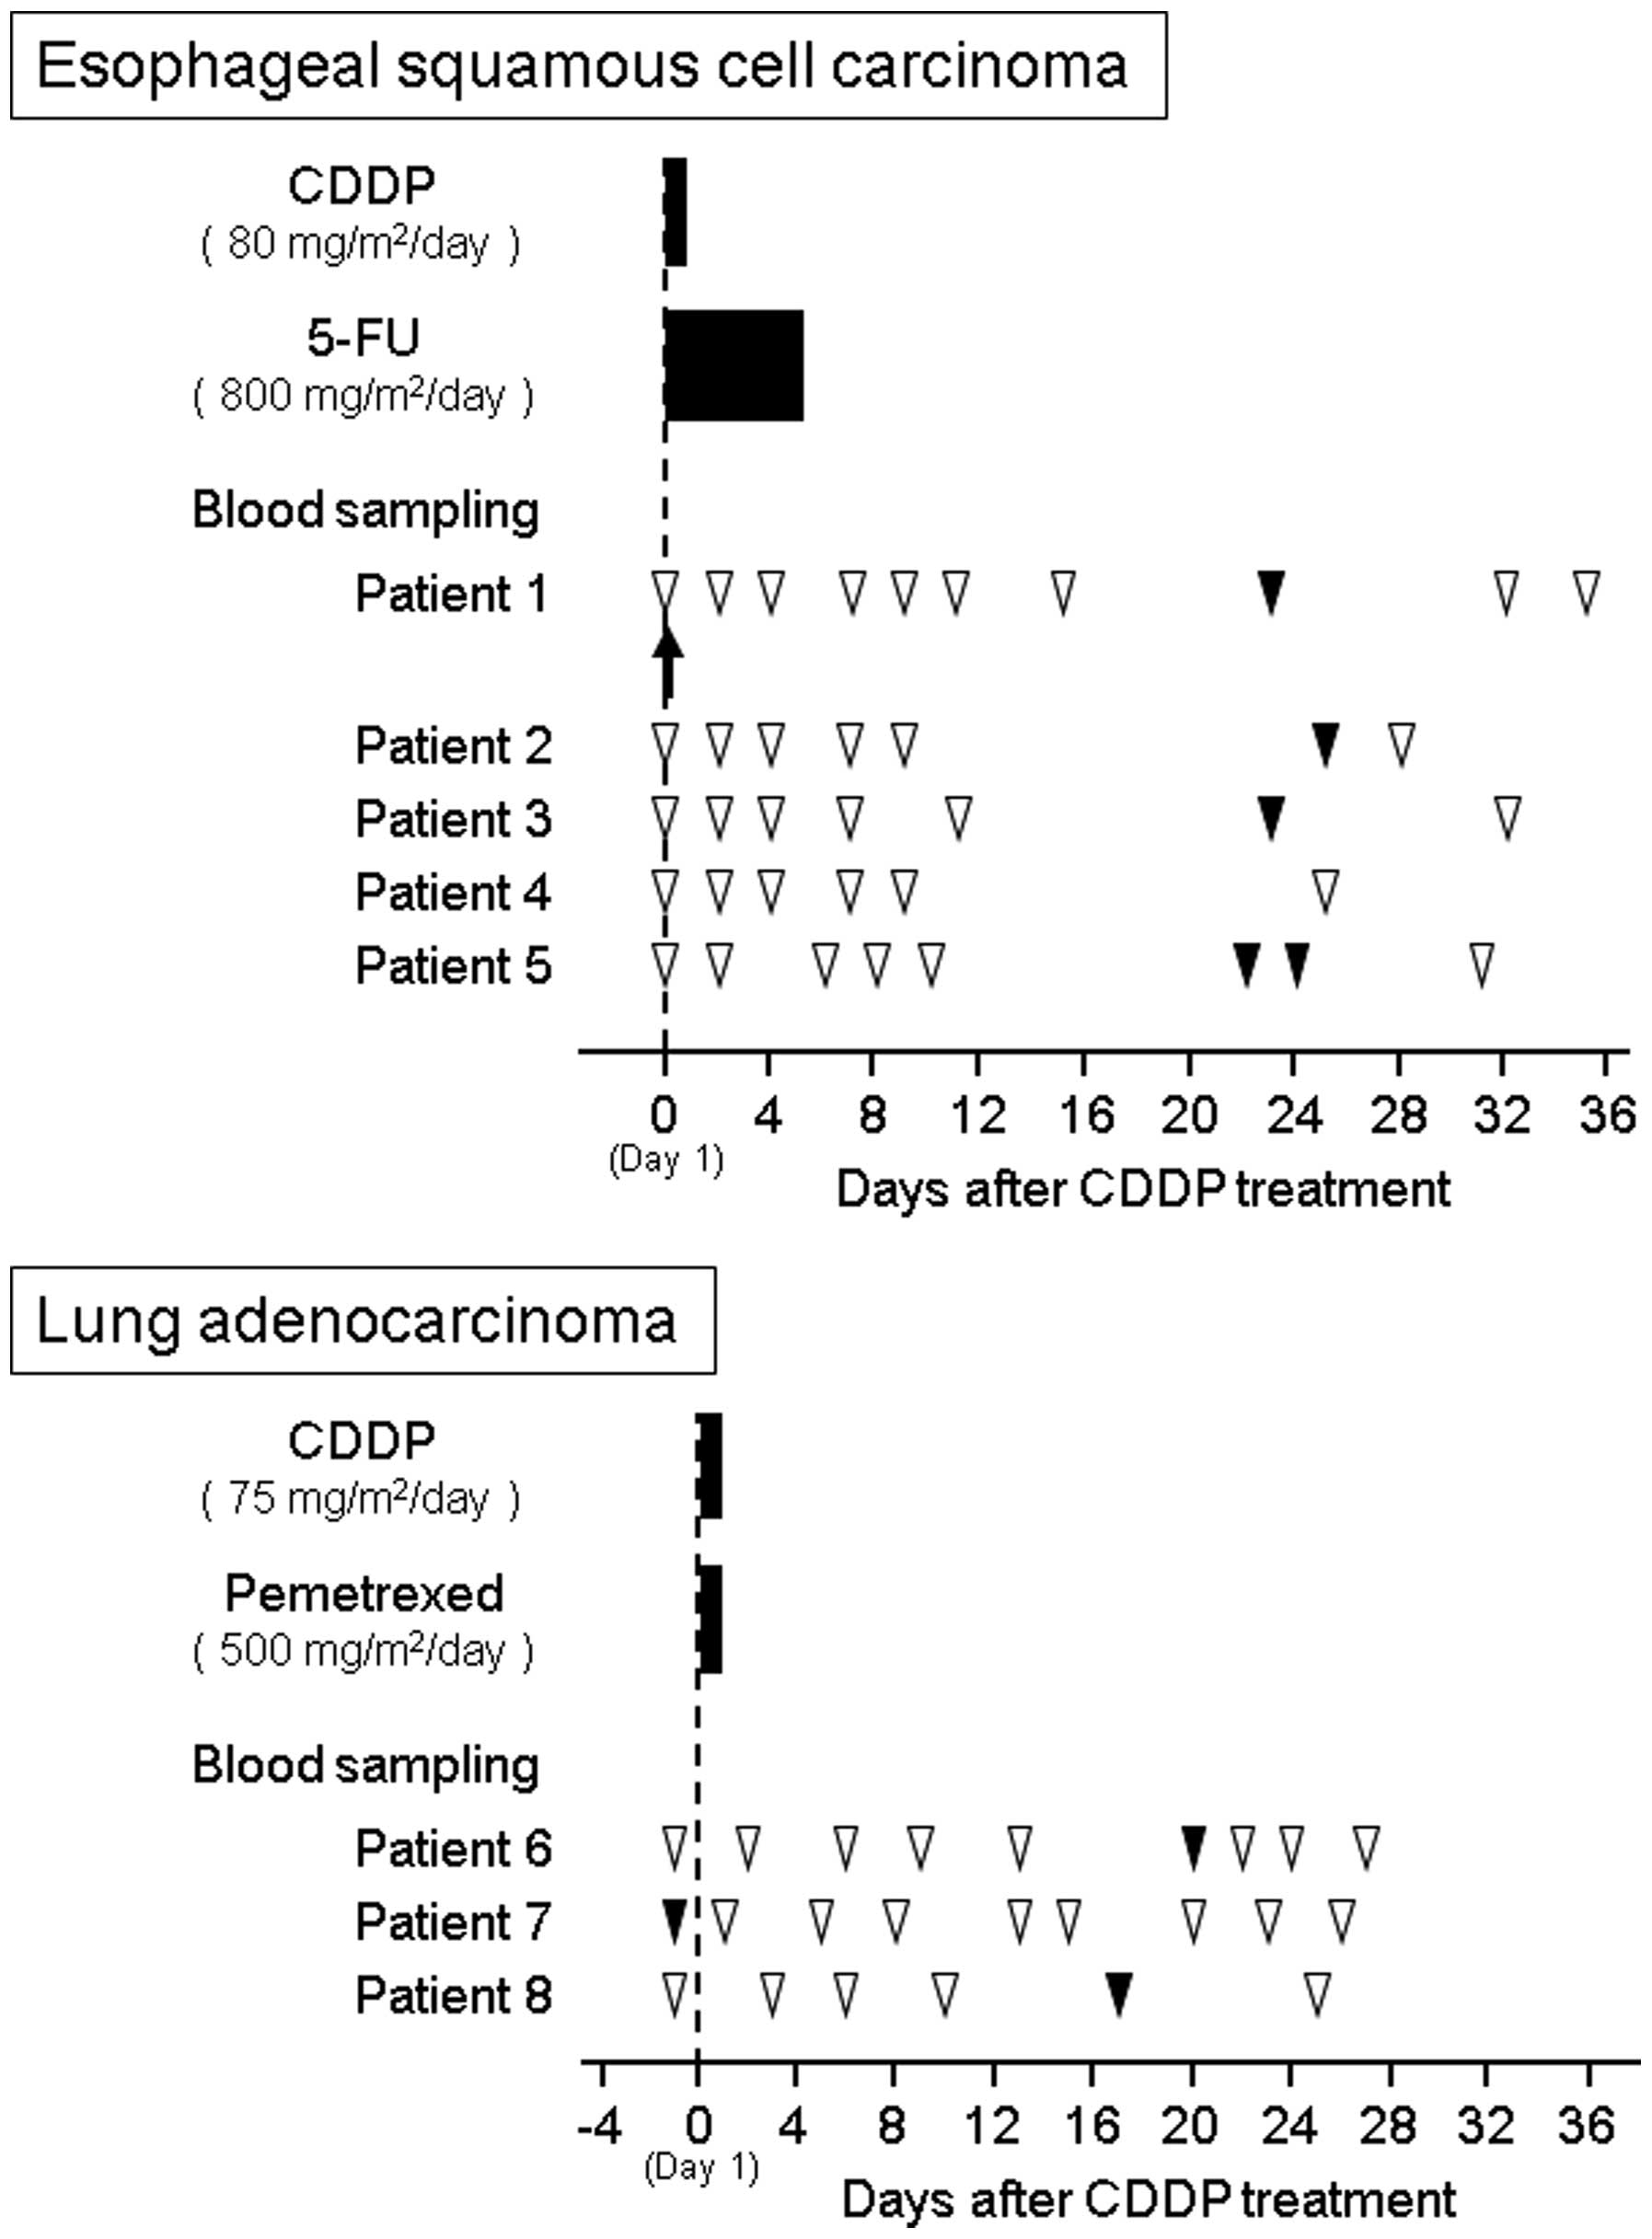
current study are presented in Table
I. The study protocols of CDDP-based chemotherapy and blood
sampling for esophageal cancer patients (patients 1–5) and lung
cancer patients (patients 6–8) are presented in Fig. 1. The CDDP-based chemotherapy for
esophageal squamous cell carcinoma consisted of a 2-h drip infusion
of 80 mg/m2 CDDP (Maruko cisplatin for i.v. infusion;
Yakult, Tokyo, Japan) on day 1 and a 5-day protracted venous
infusion of 800 mg/m2 per day fluorouracil on days 1–5.
For lung adenocarcinoma, treatment consisted of a 2-h drip infusion
of 75 mg/m2 CDDP and 500 mg/m2 pemetrexed
(Alimta® Injection; Eli Lilly and Co., Indianapolis, IN,
USA) on day 1. The patients received appropriate hydration and
antiemetic premedication consisting of 1 mg granisetron
(Granisetron intravenous solution; Meiji Seika Pharma Co., Tokyo,
Japan) on day 1, 6.6 mg dexamethasone (DEXART®
injection; Fuji Pharma Co., Toyama, Japan) on day 1 and 3.3 mg
dexamethasone on days 2 and 3), and 125 mg aprepitant
(EMEND® Capsule; Ono Pharmaceutical Co., Osaka, Japan)
on day 1 and 80 mg aprepitant on days 2 and 3. One esophageal
cancer patient (patient 1) received 0.75 mg palonosetron
(Aloxi® i.v. injection; Taiho Pharmaceutical Co., Tokyo,
Japan) on day 1 rather than granisetron. This patient had anemia
and required a single red blood cell transfusion on day 1.
Subsequently, the patient took oral iron pills every day during the
observation period.
 | Table I.Patient characteristics and baseline
values of laboratory tests and plasma trace metals in patients with
esophageal and lung cancer. |
Table I.
Patient characteristics and baseline
values of laboratory tests and plasma trace metals in patients with
esophageal and lung cancer.
| Primary site of
disease (histology) | Esophagus (squamous
cell carcinoma)a | Lung
(adenocarcinoma) | P-value |
|---|
| Age, years |
64.6±11.4 |
66.0±7.0 | 0.837 |
|
| 70 (55–72) | 66 (59–73) |
|
| Gender, m/f | 4/1 | 1/2 | 0.464 |
| Surgical history,
yes/no | 0/5 | 2/1 | 0.107 |
| Serum creatinine,
mg/100 ml |
0.86±0.21 |
0.66±0.05 | 0.094 |
|
| 0.95
(0.86–0.99) | 0.65
(0.64–0.68) |
|
| Plasma cystatin C,
mg/100 ml |
0.76±0.14 |
0.68±0.16 | 0.517 |
|
| 0.79
(0.64–0.80) | 0.59
(0.59–0.72) |
|
| eGFR, ml
min−1 1.73 m−2 |
68.6±16.6 |
75.6±8.0 | 0.456 |
|
| 65.0
(57.5–66.0) | 71.3
(71.0–78.1) |
|
| Serum aspartate
transaminase, IU/ml | 20±6 |
17±3 | 0.385 |
|
| 18 (16–19) | 18 (16–19) |
|
| Serum alanine
aminotransferase, IU/ml |
20±12 |
14±2 | 0.397 |
|
| 15 (12–21) | 15 (14–16) |
|
| Total bilirubin,
mg/100 ml |
0.5±0.2 |
0.5±0.2 | 0.713 |
|
| 0.5 (0.4–0.7) | 0.5 (0.4–0.6) |
|
| Serum albumin,
g/100 ml |
3.5±0.4 |
4.0±0.2 |
0.042b |
|
| 3.7 (3.2–3.7) | 4.0 (3.9–4.1) |
|
| Red blood cells,
×104 cells/µl | 410±32 |
422±29 | 0.629 |
|
| 394 (394–434) | 415 (406–434) |
|
| Hemoglobin, g/100
ml | 12.0±2.8 |
11.8±1.2 | 0.902 |
|
| 13.0
(11.7–13.6) | 11.5
(11.2–12.4) |
|
| White blood cells,
×102 cells/µl |
84±34 |
97±96 | 0.843 |
|
| 84 (51–118) | 47 (42–128) |
|
| Platelet,
×104 cells/µl | 20.4±9.5 |
32.4±23.9 | 0.493 |
|
| 21.4
(19.5–22.9) | 19.3
(18.7–39.7) |
|
| C-reactive protein,
>1.0 mg/100 ml | 2 (40%) | 1 (33%) | 1.000 |
| 55Mn,
ng/ml |
7.3±3.2 |
16.3±5.1 | 0.072 |
|
| 6.4 (4.8–8.1) | 17.0
(13.9–19.0) |
|
| 56Fe,
ng/ml | 1,719±369 | 2,419±118 |
0.011b |
|
| 1,671
(1,454–1,822) | 2,360
(2,351–2,458) |
|
| 63Cu,
ng/ml |
746±321 | 824±36 | 0.617 |
|
| 667 (636–851) | 845 (814–845) |
|
| 66Zn,
ng/ml | 1,928±584 |
8,581±4,866 | 0.142 |
|
| 1,873
(1,677–2,090) | 8,212
(6,061–10,917) |
|
| 208Pb,
ng/ml | 54.6±7.7 |
88.7±35.6 | 0.243 |
|
| 54.7
(49.2–55.9) | 89.4
(71.1–106.7) |
|
Peripheral venous blood (5 ml) was drawn at 6–10
time-points from each patient into duplicate tubes, either
containing or not containing ethylenediaminetetraacetic acid
(EDTA). The first blood sample was taken 1–3 days after the start
of the CDDP infusion, and samples were taken at 2- to 16-day
intervals thereafter. Baseline measurements were taken one day
before or at the start of CDDP administration. Blood samples
containing EDTA were immediately centrifuged at room temperature
(18–25°C) for 10 min at 1,900 × g to provide a plasma sample for
the determination of plasma concentrations of trace metals, and
samples without EDTA were used for routine and additional
laboratory tests. The time-blood concentration profiles of Pt in
the five patients with esophageal cancer were assessed during
chemotherapy in our previous study (6), and the plasma samples of the study were
reanalyzed during the present study for trace metal analysis. The
variability in plasma concentrations of trace metals during the
observation period were assessed as fold-increases relative to the
baseline level. To minimize confounding influences from circadian
variations in trace metal concentrations and clinical laboratory
tests, the serum sampling was performed in the fasted state, and
always at 5:30 a.m., to obtain samples for the additional clinical
laboratory tests. Serum Fe, magnesium, ferritin, and transferrin
were analyzed in accordance with standard biochemical methods at
LSI Medience Corp. (Tokyo, Japan). The plasma and serum samples
were stored at −40°C prior to testing.
Determination of plasma concentrations
of trace metals
The concentrations of trace metals in plasma were
determined as described previously (6). Briefly, each sample (50 µl) was reduced
to ash by repeated treatment with nitric acid [for poisonous metal
determination; Wako Pure Chemical Industries (Osaka, Japan)],
hydrogen peroxide (for atomic absorption spectrochemical analysis;
Wako) and perchloric acid (for poisonous metal determination; Wako)
at 200°C. Sample ash was dissolved in 5 ml of 5% nitric acid and
analyzed by inductively coupled plasma mass spectrometry (ICP-MS)
using Agilent 7700x ICP-MS (Agilent Technologies, Inc., Santa
Clara, CA, USA). The levels of Mn, Fe, Co, Cu, Zn, Pt and Pb
(m/z=55, 56, 59, 63, 66, 195 and 208, respectively) were determined
in two or three replicates per sample. Contamination from tubes and
other sources was avoided. The trace metal concentrations in each
sample were calculated using linear regression of the standard
curves prepared using standard solutions of the respective trace
metals. The standard curves exhibited linear regression in the
range of 1–500 ng/ml (r=0.999) and the limit of quantification was
0.1 ng/ml.
Measurement of serum levels of Fe,
magnesium, ferritin and transferrin
Serum levels of Fe, magnesium and transferrin were
measured using a colorimetric assay (Quick Auto Neo Fe; Shino-Test
Corp., Tokyo, Japan) according to the manufacturers' instructions,
an emzymatic assay (IATRO LQ Mg rate II; LSI Medience Corp.) and a
turbidimetric immunoassay (N-Assay TIA Tf-H Nittobo; Nitto Boseki
Co., Ltd., Tokyo, Japan), respectively, with an automated clinical
chemistry analyzer (System H7700; Hitachi High-Tequnologies Corp.,
Tokyo, Japan). The serum ferritin level was measured using a
chemiluminiscent immunoassay (Chemilumi ACS-Ferritin II; Siemens
Healthcare Diagnostics, Tokyo, Japan) with a Chemilumi ADVIA
Centaur (Siemens Healthcare diagnostics). The results were
routinely validated to confirm acceptable precision and
accuracy.
Statistical analysis
The pharmacokinetic parameters were calculated from
the individual plasma Pt concentration-time curve as described
previously (6). Data are expressed as
the mean ± standard deviation (SD) or median and quartile range.
Fisher's exact test and Welch's test were used for statistical
analysis of the two groups. The differences in rates of change, for
raw or mean values from individual laboratory tests, between
baseline and treatment days after initiation of chemotherapy were
evaluated using Steel-Dwass multiple comparison test. Two-tailed
P<0.05 was considered to indicate a statistically significant
difference.
Results
Patient characteristics and baseline
values of the laboratory tests and plasma trace metals
Serum albumin levels in patients with esophageal
cancer were identified to be significantly lower than those of the
lung cancer patients (P=0.042), whereas no significant difference
in renal and hepatic function indices were identified between the
two groups (Table I). In addition, no
significant difference was identified between the groups in red and
white blood cell counts, platelet counts or in the hemoglobin and
C-reactive protein levels in the blood. The mean ± SD baseline
plasma concentration of 56Fe in patients with esophageal
cancer was 1,719±369 ng/ml, and the value was significantly lower
than that in lung cancer patients (2,419±118 ng/ml; P=0.011). No
significant differences in the mean values of other trace metals
were identified between the esophageal and lung cancer patients.
The baseline plasma concentrations of 195Pt and those of
59Co at almost all sampling points were below the limit
of quantification.
Time-plasma concentrations of trace
metals
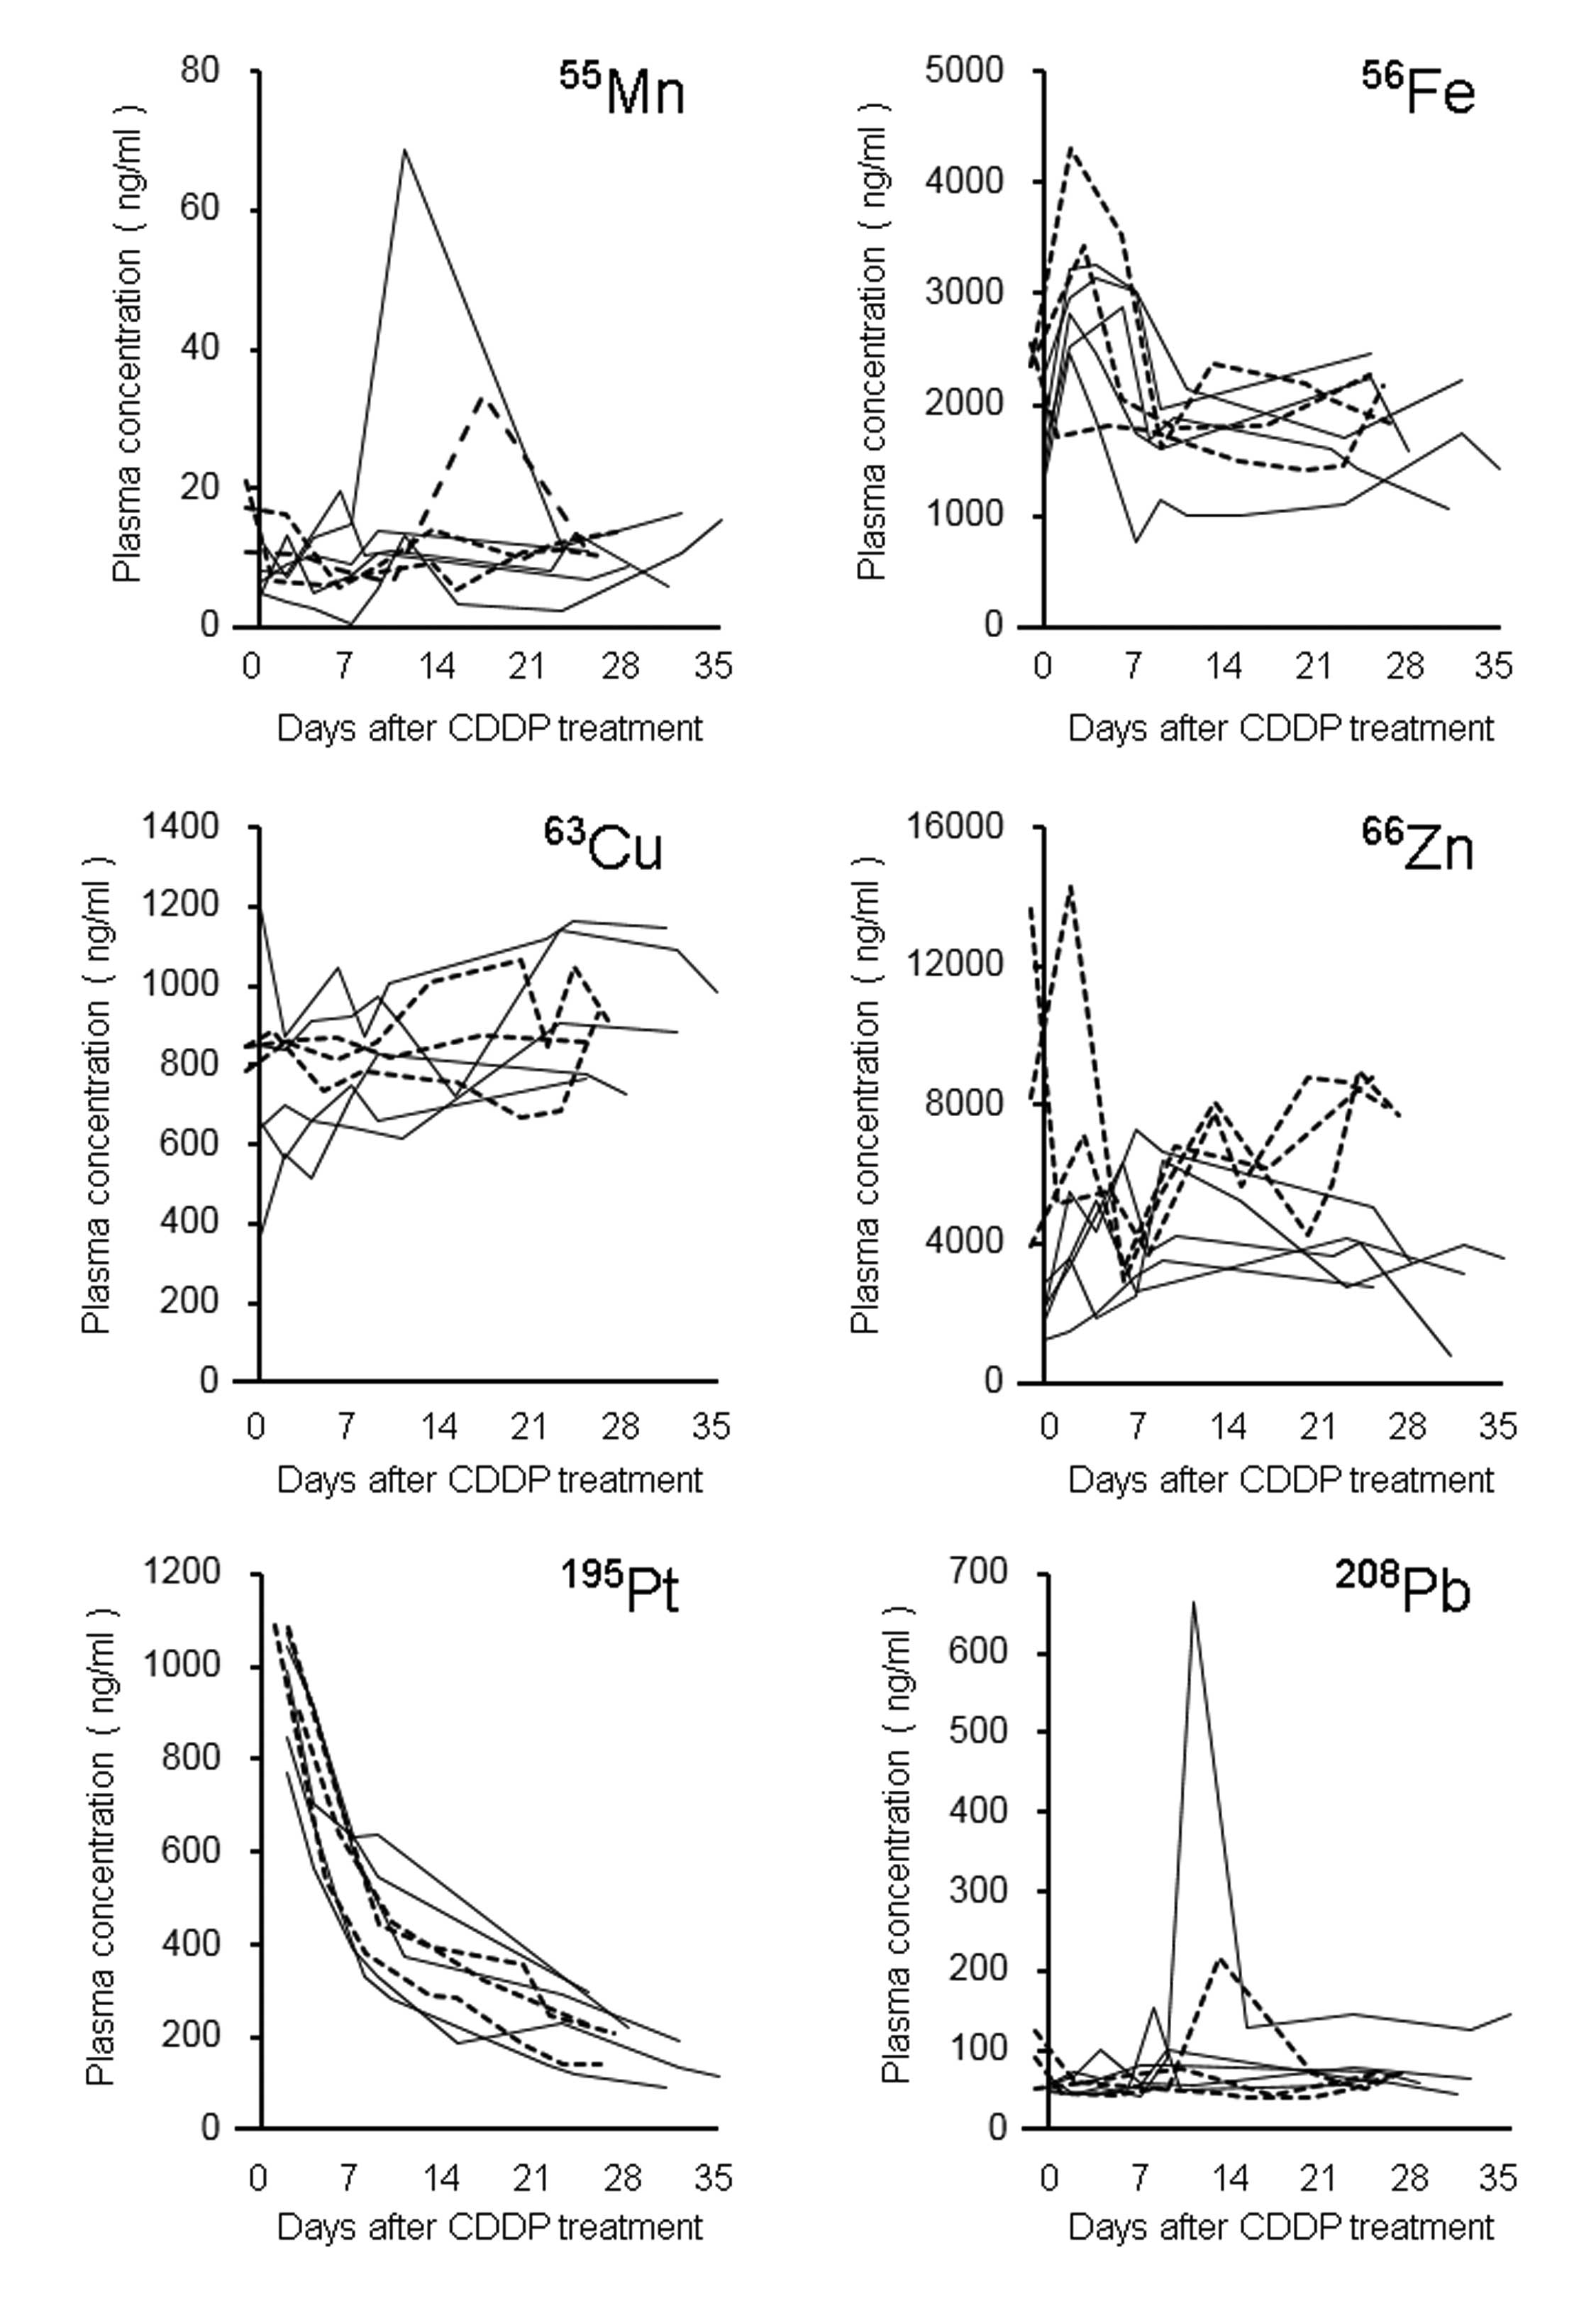
Fig. 2 demonstrated the
time-plasma concentrations of trace metals in eight patients
receiving CDDP-based chemotherapy. The fold-change values of the
plasma concentrations from baseline were in the range 0.1–5.5 for
55Mn, 0.6–1.9 for 56Fe, 0.7–2.3 for
63Cu, 0.3–3.9 for 66Zn, and 0.4–10.0 for
208Pb during the observation period. When the plasma Pt
concentrations were calculated by adjusting for the CDDP dose at
the start of the treatment in patients with esophageal and lung
cancer (6) there was a statistically
significant difference between their mean ± SD values [6.8±0.8 and
8.7±0.9 ng ml−1 (mg CDDP)−1, respectively;
P=0.044]. No significant difference in the elimination rate
constant and half-life was identified between the esophageal and
lung cancer patients.
Variability of plasma trace metal
concentrations
Fig. 3 shows the
variability of plasma trace metal concentrations during the
observation period. To minimize confounding influences of circadian
variation and supplemental treatment on trace metal levels, two
patients were excluded from the analysis: One lung cancer patient
had consumed food prior to baseline blood sampling, and another
patient with esophageal cancer required a single red blood cell
transfusion and had taken oral iron pills. For the six patients
included, the variability of plasma concentrations of trace metals
during the observation period was assessed (Fig. 3). In these patients, the plasma
concentrations of 56Fe and 66Zn increased
during the 1–3 days following the start of CDDP treatment.
Subsequently, the plasma concentrations of 56Fe declined
to baseline levels by around the tenth day for all patients,
whereas 66Zn plasma concentrations changed gradually
during the observation period. Plasma concentrations of other trace
metals (55Mn, 63Cu and 208Pb) did
not exhibit any characteristic changes.
 | Figure 3.Variability in plasma concentrations
of trace metals following CDDP treatment in six patients with
esophageal (n=4) and lung (n=2) cancer. The data were processed
individually for each patient as fold-change vs. baseline levels
for 55Mn, 56Fe, 63Cu,
66Zn and 208Pb, or as fold-change vs. data
from 1–3 days following treatment for 195Pt levels. The
baseline data (Pre.) was obtained one day before or on the day of
the CDDP treatment. The data for the patients who received a blood
transfusion or had blood drawn while in non-fasting state were
excluded from the analysis. *P<0.05 vs. baseline. n.d., not
detectable; CDDP, cisplatin; Mn, manganese; Fe, iron; Cu, copper;
Zn, zinc; Pb, lead; Pt, platinum. |
Variability of laboratory test
values
In the six patients, the median (interquartile
range) baseline serum levels of Fe, magnesium, ferritin and
transferrin were 67.0 (61.0–93.3) µg/100 ml, 2.4 (2.3–2.5) mg/100
ml, 104.9 (73.8–151.5) ng/ml, and 208.0 (191.0–237.8) mg/100 ml,
respectively. When serum Fe levels were determined by the
colorimetric method, its transient elevation, similar to that of
56Fe determined by the ICP-MS method, was observed more
clearly (Fig. 4A). Serum magnesium
levels were also determined enzymatically and had a tendency to
decrease during the observation period, although this was not
statistically significant (Fig. 4B).
The serum levels of ferritin significantly increased on days 1–3
(P=0.018), and this increase was sustained until at least 10 days
after CDDP treatment (Fig. 4C). Serum
transferrin levels tended to be below the baseline levels at days
1–11 and on days 1–3 exhibited a significant difference (Fig. 4D; P=0.018). The median (interquartile
range) baseline values of red blood cells and hemoglobin were 406
(395–429) × 104 cells/µl and 13.1 (12.0–13.5) g/100 ml,
respectively. These values showed a similar pattern of change
during the observation period, exhibiting a marginal decrease on
days 1–3 and a significant decrease approximately one month after
CDDP treatment (Fig. 4E and F;
P<0.05).
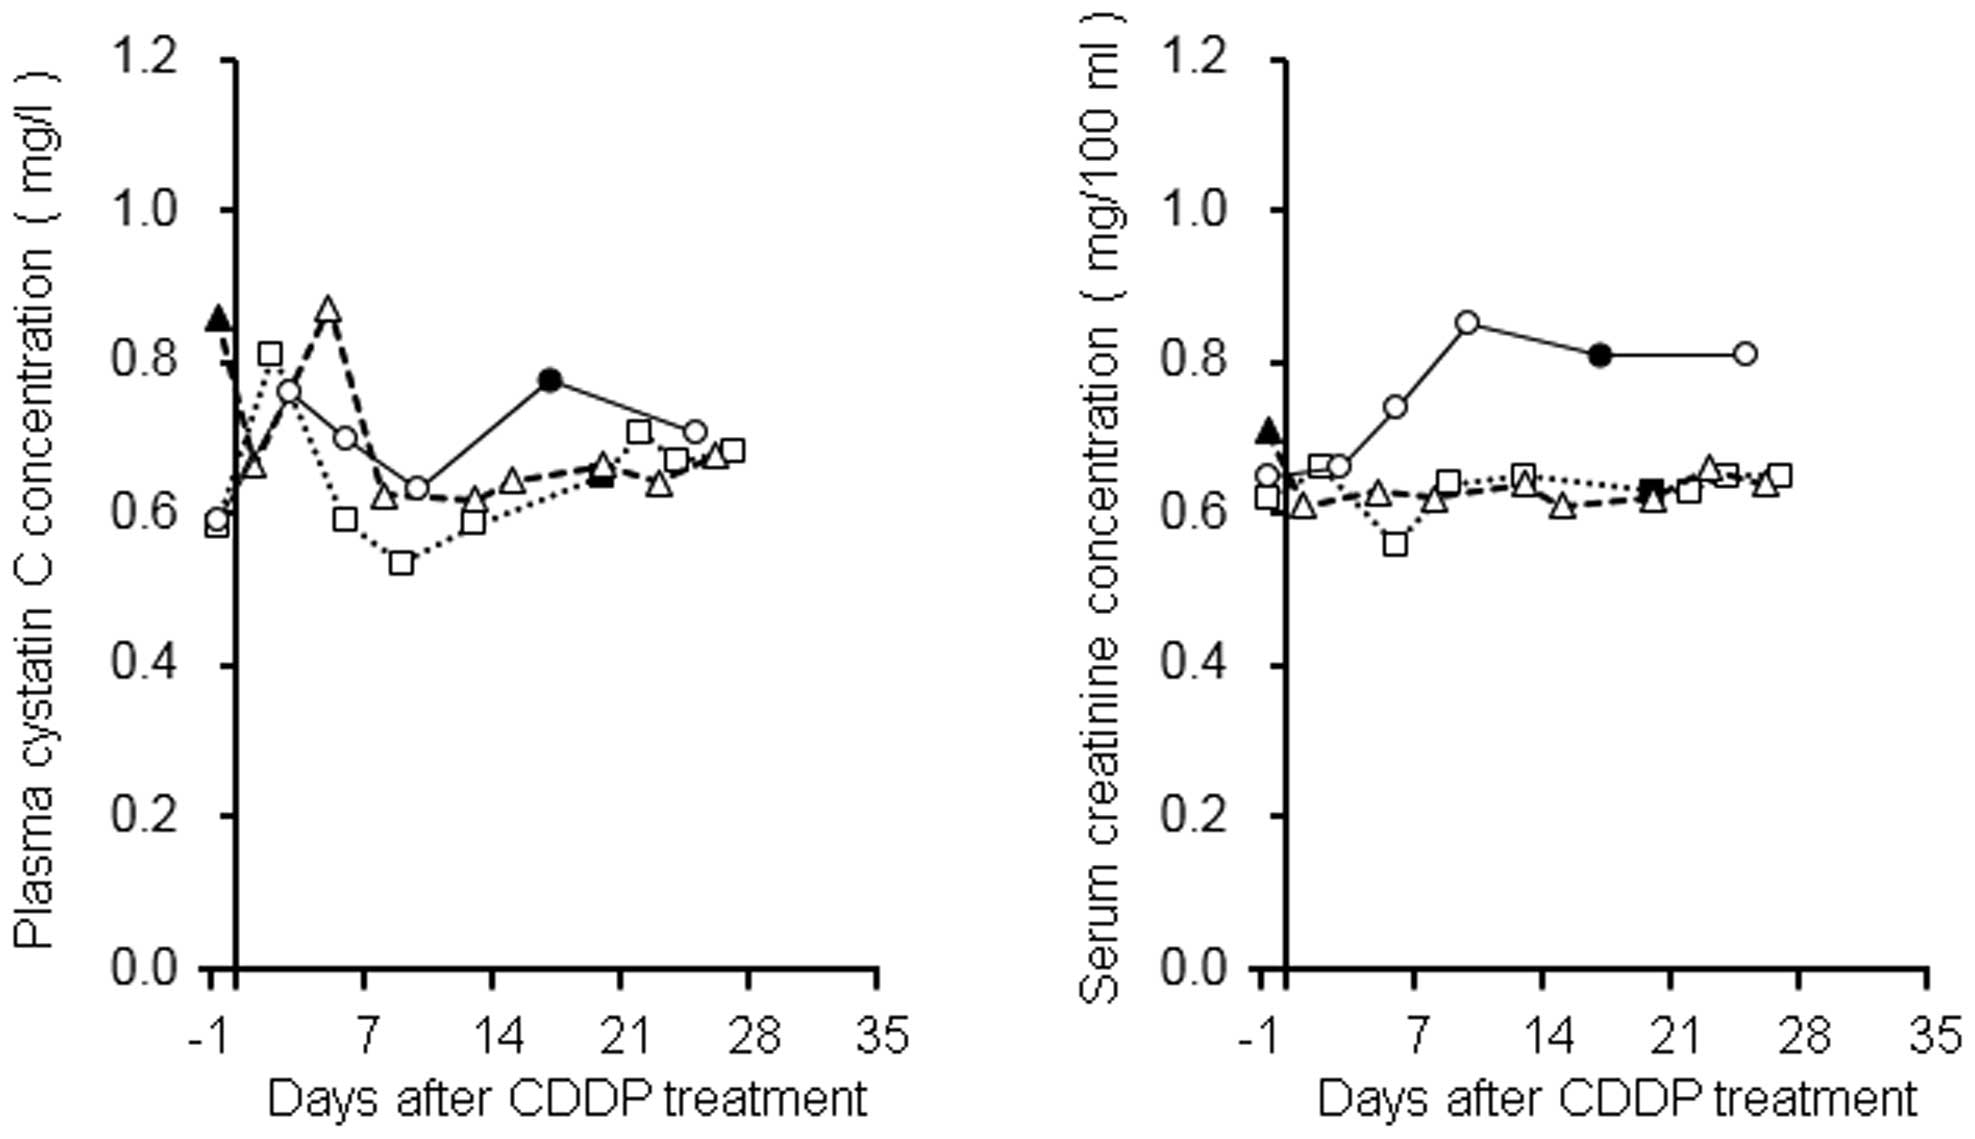
Time-concentration profiles of plasma
cystatin C and serum creatinine levels
In our previous study, the transient elevation of
the plasma concentration of cystatin C following CDDP treatment was
observed in patients with esophageal cancer (6). In the present study, the plasma
concentration profiles were evaluated in three patients with lung
cancer in addition to patients with esophageal cancer (Fig. 5). Two lung cancer patients exhibited
1.29- and 1.39-fold increases in plasma cystatin C levels on days
1–3, compared with their baseline levels, and these levels
subsequently returned to baseline within approximately one week.
The other patient also demonstrated a similar tendency, exhibiting
a 1.3-fold increase in plasma cystatin C levels after CDDP
treatment (0.66 and 0.87 mg/l on days 1 and 5, respectively),
although in this patient, baseline blood sampling was performed in
the non-fasted state and, therefore, the level was 0.86 mg/l. The
change rates of serum creatinine levels in two patients were
between 0.86 and 1.06 during the present observation period, based
on their baseline levels, whereas the value in the other patient
increased gradually by ~1.3.
Discussion
Trace metals including Fe, Zn, and Cu exist widely
in the body and are important in the maintenance of physiological
homeostasis. Fe is required for adequate erythropoietic function
(oxygen transport and storage), oxidative metabolism, and cellular
immune response (7). Zn is required
for general metabolism, and catalytic, structural and regulatory
functions (8), and Cu is required for
Fe metabolism, antioxidant defense, neuropeptide synthesis, and
immune function (9). In the present
study, serum concentrations of 55Mn, 56Fe,
63Cu, 66Zn, 59Co and
208Pb were determined in esophageal and lung cancer
patients (Table I). In lung cancer
patients who had not undergone cancer chemotherapy, the results
demonstrated that serum levels of 55Mn, 56Fe,
63Cu and 208Pb were in approximately the same
range, whereas 66Zn levels were beyond the range of
values reported previously (10–14). The
differences in trace metal concentrations may be partly explained
by the different measurement methods that were used; atomic
absorption spectrophotometry and ICP-MS. In the esophageal cancer
patients of the present study, the baseline serum levels of
56Fe and 66Zn were apparently in the same
range as that which was reported in a previous study on
preoperative esophageal cancer patients (15). The levels of 55Mn,
59Co, 63Cu, 66Zn and
208Pb were comparable with values in the lung cancer
patients while the 56Fe levels were significantly lower.
This may have been due to the anemia-associated lowering of values
of serum ferritin and hemoglobin, as well as of serum Fe levels in
one esophageal cancer patient, although it was unclear whether the
other patients exhibited gastrointestinal tract bleeding.
Pt is a heavy metal and a constituent atom of CDDP,
and there is a possibility that the administration of CDDP
influences the trace metal concentrations in body fluids. Among the
metals evaluated in the present study, the time-concentration
profile of 56Fe indicated that its plasma concentration
was increased subsequent to CDDP treatment and returned to the
baseline level within ~10 days. The current study, however,
included two patients who had anemia or were in a non-fasted
condition and, therefore, the blood transfusion, and consumption of
iron tablets and a meal were considered as confounding factors. In
order to eliminate these, the plasma levels of 56Fe and
other metals from data of all but these two patients were
evaluated. The analysis yielded results that indicated a
significant increase in plasma 56Fe and 66Zn
levels in the 1–3 days following CDDP treatment (Fig. 3). In addition, the serum Fe levels were
evaluated using a colorimetric method, which more clearly confirmed
the same tendency (Fig. 4A). This may
be due to the difference in ability to remove the Fe from the serum
proteins between chelating and ashing. Fe in the body is largely
stored in erythrocyte hemoglobin, and the liver and spleen are also
Fe-rich tissues (16). As shown in
Fig. 4E and F, red blood cell counts
and hemoglobin levels have a tendency to decrease, which may
contribute to the elevation of serum Fe levels, although the
difference was not statistically significant. Ferritin is one of
the proteins that stores Fe in the tissues. In the current study,
its serum level increases gradually after CDDP treatment and
continues to increase even after the serum Fe levels pass their
peak. In addition, transferrin is important to Fe homeostasis, as
it is involved in the transportation of Fe between the bloodstream
and tissues. A significant decline in transferrin levels
accompanied the increase in serum Fe and ferritin, although the
capacity of transferrin to store Fe is markedly lower than that of
ferritin from a stoichiometric viewpoint. These findings indicate
that the change in serum ferritin and transferrin levels was a
secondary reaction against excessive Fe in the bloodstream. In
esophageal patients undergoing CDDP-based chemotherapy, Akutsu
et al (17) demonstrated the
decreased serum Cu and Mn levels and the marginal change in serum
Fe and Zn levels, although the methodology used to measure the
trace metals was not clear. The variations detected were markedly
different when compared with those of the present study, which may
be due to the differing nutritional status of the patients; in the
former study, patients received total parenteral nutrition, but not
in the present study. Overall, although the present pilot study was
limited by its small sample size in each type of cancer and
combined chemotherapeutic agent, it was concluded that the
transient elevation in serum Fe levels after CDDP treatment is not
completely explained by destruction of red blood cells and/or
ferritin, and further studies are required to address this
issue.
As shown in Fig. 3, the
plasma concentration of 66Zn in esophageal and lung
cancer patients without blood transfusion or meal intake was
increased on days 1–3 after the CDDP treatment and, subsequently,
varied without a certain tendency. By contrast, Sweeney et
al (14) reported that a decrease
in plasma Zn following CDDP administration, which was accompanied
by an increase in urinary Zn excretion, and diurnal variation in
plasma Zn level were observed in the head and neck, and lung cancer
patients. The authors also discussed the possibility of the release
of intracellular Zn by tumor lysis following CDDP administration,
which would lead to an increase in plasma Zn concentration
(14). Additionally, it was reported
that, in CDDP-treated rat kidneys, Zn that was bound to proteins
within cells could be displaced by Pt, although the serum Zn levels
were not clearly known (5). In the
present study, Zn possibly derived from the kidneys may be involved
in the increase in plasma Zn levels immediately following CDDP
treatment. However, the extent to which that contributes to the
change in plasma Zn levels remains obscure, and therefore, further
studies are warranted to appropriately investigate this
possibility.
Cystatin C is one of the endogenous markers of the
glomerular filtration rate (18–20), but the
efficacy of blood cystatin C level for detection of renal
dysfunction during CDDP-based chemotherapy remains controversial
(21–23). In our previous study, a transient
elevation of serum cystatin C concentration, perhaps independently
of renal function, was observed in esophageal cancer patients
receiving CDDP-based chemotherapy (6).
In the present study, two lung cancer patients exhibited an
increase in the plasma cystatin C concentration within a week after
the CDDP treatment, followed by a subsequent return to baseline
levels (Fig. 5). Another lung cancer
patient also appeared to exhibit a similar tendency, although this
patient did not fast for the baseline blood sampling (Fig. 5). These findings were in close
agreement with our previous results, and indicated a possible
underestimation of renal function based on plasma cystatin C levels
during the early CDDP treatment period, regardless of whether the
cancer was of the lung or the esophagus (6). Prospective and larger clinical studies
are required to confirm these findings.
As mentioned above, a transient elevation was
observed in serum Fe levels, and this change appeared to be
parallel to that of plasma cystatin C levels (Figs. 2, 3,
4A and 5). In patients receiving CDDP-based
chemotherapy, antiemetic therapeutic agents, including
dexamethasone are administered to prevent treatment-associated
nausea and vomiting (24), while
dexamethasone has the potential to induce the secretion of cystatin
C from cancer cell lines (25,26). It was reported that an increase in
serum Fe levels and a decrease in total Fe binding capacity
calculated based on serum transferrin levels were observed only
during an anti-inflammatory period induced by the administration of
prednisolone in an experimental dog study (27). If dexamethasone exerted an effect
similar to that of prednisolone immediately after initiating
CDDP-based chemotherapy, the increase in serum Fe levels may
reflect the phenomenon of anti-inflammation induced by
dexamethasone. Although it remains unclear whether the
extracellular release of Fe is correlated with that of cystatin C
and whether Fe influences the measurement system of cystatin C, the
evaluation of renal function based on serum levels of not only
cystatin C, but also Fe, would be more reliable during the early
CDDP treatment period.
The progressive decline in magnesium levels with
each successive cycle of chemotherapy has been reported in patients
receiving CDDP-based chemotherapy (28). In the present study, serum magnesium
levels tended to decrease after the start of chemotherapy and its
median level at the end of the observation period was 0.92
(quartile range, 0.87–0.99) of the baseline level (Fig. 4B). The value was comparable with those
in previous reports (28,29). Furthermore, the protective effect of
magnesium supplementation and the preventive effect of magnesium
preloading on nephrotoxicity in cancer patients receiving
CDDP-based chemotherapy have been reported (30,31);
therefore, the underlying mechanisms may become clearer through
examination of the effect of Fe, released by CDDP treatment, on
serum and tissue magnesium levels.
In conclusion, these findings suggest that serum Fe,
Zn and magnesium levels may be useful in understanding the
physiological responses in the early stages of CDDP-based
chemotherapy, which may be associated with systemic inflammation
and/or tissue distribution of CDDP.
Acknowledgements
The present study was supported in part by a
Grant-in-Aid for Scientific Research (C) from the Japan Society for
the Promotion of Science (grant nos. 26460245 and 16K08908). In
addition, it was supported in part by a grant from the Ministry of
Education, Culture, Sports, Science and Technology of
Japan-Supported Program for the Strategic Research Foundation at
Private Universities, 2012-2016 (grant no. S1201008).
References
|
1
|
Madias NE and Harrington JT: Platinum
nephrotoxicity. Am J Med. 65:307–314. 1978. View Article : Google Scholar : PubMed/NCBI
|
|
2
|
Kintzel PE and Dorr RT: Anticancer drug
renal toxicity and elimination: Dosing guidelines for altered renal
function. Cancer Treat Rev. 21:33–64. 1995. View Article : Google Scholar : PubMed/NCBI
|
|
3
|
Filipski KK, Mathijssen RH, Mikkelsen TS,
Schinkel AH and Sparreboom A: Contribution of organic cation
transporter 2 (OCT2) to cisplatin-induced nephrotoxicity. Clin
Pharmacol Ther. 86:396–402. 2009. View Article : Google Scholar : PubMed/NCBI
|
|
4
|
Nakamura T, Yonezawa A, Hashimoto S,
Katsura T and Inui K: Disruption of multidrug and toxin extrusion
MATE1 potentiates cisplatin-induced nephrotoxicity. Biochem
Pharmacol. 80:1762–1767. 2010. View Article : Google Scholar : PubMed/NCBI
|
|
5
|
Moreno-Gordaliza E, Giesen C, Lázaro A,
Esteban-Fernández D, Humanes B, Cañas B, Panne U, Tejedor A,
Jakubowski N and Gómez-Gómez MM: Elemental bioimaging in kidney by
LA-ICP-MS as a tool to study nephrotoxicity and renal protective
strategies in cisplatin therapies. Anal Chem. 83:7933–7940. 2011.
View Article : Google Scholar : PubMed/NCBI
|
|
6
|
Kume M, Yasui H, Yoshikawa Y, Horinouchi
M, Higashiguchi K, Kobayashi Y, Kuroda D, Hirano T, Hirai M and
Nakamura T: Transient elevation of serum cystatin C concentrations
during perioperative cisplatin-based chemotherapy in esophageal
cancer patients. Cancer Chemother Pharmacol. 69:1537–1544. 2012.
View Article : Google Scholar : PubMed/NCBI
|
|
7
|
Muñoz M, García-Erce JA and Remacha AF:
Disorders of iron metabolism. Part 1: Molecular basis of iron
homoeostasis. J Clin Pathol. 64:281–286. 2011. View Article : Google Scholar : PubMed/NCBI
|
|
8
|
Chasapis CT, Loutsidou AC, Spiliopoulou CA
and Stefanidou ME: Zinc and human health: An update. Arch Toxicol.
86:521–534. 2012. View Article : Google Scholar : PubMed/NCBI
|
|
9
|
Bost M, Houdart S, Oberli M, Kalonji E,
Huneau JF and Margaritis I: Dietary copper and human health:
Current evidence and unresolved issues. J Trace Elem Med Biol.
35:107–115. 2016. View Article : Google Scholar : PubMed/NCBI
|
|
10
|
Cobanoglu U, Demir H, Sayir F, Duran M and
Mergan D: Some mineral, trace element and heavy metal
concentrations in lung cancer. Asian Pac J Cancer Prev.
11:1383–1388. 2010.PubMed/NCBI
|
|
11
|
Zowczak M, Iskra M, Torliński L and Cofta
S: Analysis of serum copper and zinc concentrations in cancer
patients. Biol Trace Elem Res. 82:1–8. 2001. View Article : Google Scholar : PubMed/NCBI
|
|
12
|
Díez M, Arroyo M, Cerdàn FJ, Muñoz M,
Martin MA and Balibrea JL: Serum and tissue trace metal levels in
lung cancer. Oncology. 46:230–234. 1989. View Article : Google Scholar : PubMed/NCBI
|
|
13
|
Issell BF, MacFadyen BV, Gum ET,
Valdivieso M, Dudrick SJ and Bodey GP: Serum zinc levels in lung
cancer patients. Cancer. 47:1845–1848. 1981. View Article : Google Scholar : PubMed/NCBI
|
|
14
|
Sweeney JD, Ziegler P, Pruet C and
Spaulding MB: Hyperzincuria and hypozincemia in patients treated
with cisplatin. Cancer. 63:2093–2095. 1989. View Article : Google Scholar : PubMed/NCBI
|
|
15
|
Wang LS, Lin HY, Chang CJ, Fahn HJ, Huang
MH and Lin CF: Effects of en bloc esophagectomy on nutritional and
immune status in patients with esophageal carcinoma. J Surg Oncol.
67:90–98. 1998. View Article : Google Scholar : PubMed/NCBI
|
|
16
|
Ganz T: Systemic iron homeostasis. Physiol
Rev. 93:1721–1741. 2013. View Article : Google Scholar : PubMed/NCBI
|
|
17
|
Akutsu Y, Kono T, Uesato M, Hoshino I,
Murakami K, Fujishiro T, Imanishi S, Endo S, Toyozumi T and
Matsubara H: Are additional trace elements necessary in total
parenteral nutrition for patients with esophageal cancer receiving
cisplatin-based chemotherapy? Biol Trace Elem Res. 150:109–115.
2012. View Article : Google Scholar : PubMed/NCBI
|
|
18
|
Filler G, Bökenkamp A, Hofmann W, Le
Bricon T, Martínez-Brú C and Grubb A: Cystatin C as a marker of
GFR-history, indications, and future research. Clin Biochem.
38:1–8. 2005. View Article : Google Scholar : PubMed/NCBI
|
|
19
|
Newman DJ: Cystatin C. Ann Clin Biochem.
39:89–104. 2002. View Article : Google Scholar : PubMed/NCBI
|
|
20
|
Chew JS, Saleem M, Florkowski CM and
George PM: Cystatin C - a paradigm of evidence based laboratory
medicine. Clin Biochem Rev. 29:47–62. 2008.PubMed/NCBI
|
|
21
|
Oc MA, Demir H, Cekmen MB, Isgoren S,
Gorur GD and Bilgili U: Correlation of Cystatin-C and radionuclidic
measurement method of glomerular filtration rate in patients with
lung cancer receiving cisplatin treatment. Ren Fail. 36:1043–1050.
2014. View Article : Google Scholar : PubMed/NCBI
|
|
22
|
Kos FT, Sendur MA, Aksoy S, Sezer S,
Civelek B, Yazici O, Yaman S, Eren T and Zengin N: Evaluation of
the renal function using cystatin C level in the patients receiving
cisplatin-based chemotherapy. Ren Fail. 35:705–710. 2013.
View Article : Google Scholar : PubMed/NCBI
|
|
23
|
Bodnar L, Wcislo GB, Smoter M,
Gasowska-Bodnar A, Stec R, Synowiec A and Szczylik C: Cystatin C as
a parameter of glomerular filtration rate in patients with ovarian
cancer. Kidney Blood Press Res. 33:360–367. 2010. View Article : Google Scholar : PubMed/NCBI
|
|
24
|
Kris MG, Hesketh PJ, Somerfield MR, Feyer
P, Clark-Snow R, Koeller JM, Morrow GR, Chinnery LW, Chesney MJ,
Gralla RJ, et al: American Society of Clinical Oncology: American
Society of Clinical Oncology guideline for antiemetics in oncology:
Update 2006. J Clin Oncol. 24:2932–2947. 2006. View Article : Google Scholar : PubMed/NCBI
|
|
25
|
Bjarnadóttir M, Grubb A and Olafsson I:
Promoter-mediated, dexamethasone-induced increase in cystatin C
production by HeLa cells. Scand J Clin Lab Invest. 55:617–623.
1995. View Article : Google Scholar : PubMed/NCBI
|
|
26
|
Yamawaki C, Takahashi M, Takara K, Kume M,
Hirai M, Yasui H and Nakamura T: Effect of dexamethasone on
extracellular secretion of cystatin C in cancer cell lines. Biomed
Rep. 1:115–118. 2013.PubMed/NCBI
|
|
27
|
Adamama-Moraitou KK, Saridomichelakis MN,
Polizopoulou Z, Kritsepi M, Tsompanakou A and Koutinas AF:
Short-term exogenous glucocorticosteroidal effect on iron and
copper status in canine leishmaniasis (Leishmania infantum). Can J
Vet Res. 69:287–292. 2005.PubMed/NCBI
|
|
28
|
Hodgkinson E, Neville-Webbe HL and Coleman
RE: Magnesium depletion in patients receiving cisplatin-based
chemotherapy. Clin Oncol (R Coll Radiol). 18:710–718. 2006.
View Article : Google Scholar : PubMed/NCBI
|
|
29
|
Abbasciano V, Mazzotta D, Vecchiatti G,
Tassinari D, Nielsen I and Sartori S: Changes in serum,
erythrocyte, and urinary magnesium after a single dose of cisplatin
combination chemotherapy. Magnes Res. 4:123–125. 1991.PubMed/NCBI
|
|
30
|
Bodnar L, Wcislo G, Gasowska-Bodnar A,
Synowiec A, Szarlej-Wcisło K and Szczylik C: Renal protection with
magnesium subcarbonate and magnesium sulphate in patients with
epithelial ovarian cancer after cisplatin and paclitaxel
chemotherapy: A randomised phase II study. Eur J Cancer.
44:2608–2614. 2008. View Article : Google Scholar : PubMed/NCBI
|
|
31
|
Yoshida T, Niho S, Toda M, Goto K, Yoh K,
Umemura S, Matsumoto S, Ohmatsu H and Ohe Y: Protective effect of
magnesium preloading on cisplatin-induced nephrotoxicity: A
retrospective study. Jpn J Clin Oncol. 44:346–354. 2014. View Article : Google Scholar : PubMed/NCBI
|