Introduction
Hypoxic-ischemic encephalopathy (HIE) secondary to
perinatal asphyxia remains a major cause of neonatal mortality and
morbidity worldwide (1,2). The incidence of HIE ranges from 1 to 3
per 1,000 full-term infants and is present in almost 60% of
premature newborns (3–5). Approximately 15–20% of affected newborns
succumb within the postnatal period, and an additional 25% develop
severe and permanent neuropsychological handicaps, including
cerebral palsy, seizures, visual impairment, mental retardation,
learning disabilities and epilepsy (5).
Neuron-specific enolase (NSE) belongs to the family
of enolase enzymes present in all tissues and organisms capable of
glycolysis (6). Enolases consist of
three subunits (α, β, and γ) encoded by separate genes. These
subunits may combine to form five different isoenzymes: αα, αβ, αγ,
ββ and γγ (6). NSE, comprised of γγ
homodimers and αγ heterodimers, is widely distributed in central
nervous system neurons and amine precursor uptake and
decarboxylation cells (7). As a
marker of neuronal cell death, the serum concentration of NSE is
associated with the degree of HIE and may be used to evaluate the
severity and outcome of HIE (8–11).
According to receiver operating characteristic curves, serum
concentrations of NSE above 40 mg/l obtained between 4 and 48 h
after birth may distinguish infants with no or mild HIE from
infants with moderate or severe HIE; additionally, serum
concentrations of NSE at a cut-off value of 45.4 mg/l may
distinguish infants with poor outcomes from infants with normal
outcomes (11).
NSE is present in substantial levels in the brain
and at lower levels in platelets, red blood cells (RBCs) and the
kidney, and may be differentiated from non-neuronal enolase (NNE),
which is present in substantial levels in the brain, liver, lung,
muscle, testis and platelets and at lower levels in RBCs, through
the use of targeted immunoassays (12). As platelets and RBCs contain NSE,
hemolyzed samples cannot be tested for NSE. However, neonatal blood
specimen collection is prone to hemolysis due to the relatively
small size of blood vessels in newborns, and repeated blood
sampling is difficult to perform. Therefore, the present study
investigated the effect of neonatal serum hemolysis on the
detection of NSE and whether the use of a correction formula may
aid to reduce these effects.
Materials and methods
Study subjects
A total of 86 serum samples were collected from
newborns, including 54 males and 32 females, within 24 h of birth
at the Affiliated Hospital of North Sichuan Medical College
(Nanchong, China) between March 2015 and October 2015. Total
bilirubin results of 588 newborns (375 males and 213 females)
within 120 h of birth, and the time of phlebotomy time after the
birth of 530 newborns (328 males and 202 females) for NSE
detection, were collected retrospectively at the Affiliated
Hospital of North Sichuan Medical College between March 2015 and
July 2015. The hemoglobin (Hb) content of blood samples from 280
newborns (163 males and 117 females), recruited from the Affiliated
Hospital of North Sichuan Medical College between March 2015 and
May 2015, were measured within 24 h of birth and classified into
different levels to understand the distribution characteristics of
total bilirubin, phlebotomy time following birth for NSE detection
and Hb content in neonatal serum samples. All samples were tested
for corresponding assays within 2 h of collection.
Hb standard curve for hemolyzed
neonatal serum samples
Absorbance values at 540 nm of a standard solution
of Hb (Tianjin Institute of Modern High-Tech Research Center,
Tianjin, China) at concentrations of 50, 100, 150 and 200 g/l were
measured in a UV-Vis spectrophotometer (Beijing Purkinje General
Instrument Co., Ltd., Beijing, China). A standard curve for whole
blood was established by plotting the absorbance values versus the
Hb content. The whole-blood samples of 10 randomly selected
newborns (n=280 group) were mixed; 20 µl of this mixed blood sample
was added to 5 ml Van Kampen and Zijlstra solution (Tianjin
Institute of Modern High-Tech Research Center), and the absorbance
value of the mixture was measured at 540 nm within 5–15 min at room
temperature. The Hb content of the mixed whole-blood samples was
obtained using the standard curve for whole blood. Concentrations
of Hb of 2, 4, 6 and 8 g/l were diluted in physiological saline;
100 µl of this diluted sample was added to 2.5 ml Van Kampen and
Zijlstra solution, and the absorbance values of the mixture were
also measured at 540 nm within 5–15 min. A standard curve for the
hemolyzed neonatal serum samples was established by plotting the
absorbance values versus the Hb concentration, and the standard
curve was used to calculate the Hb concentration in the neonatal
serum samples (n=86).
Hemolyzed neonatal serum NSE
quantitation
Whole-blood samples were collected from newborns
(n=86)within 24 h of birth, and the sera were isolated by
centrifugation at 2,583 × g and 25°C for 5 min. The NSE values were
measured in serum samples by LIAISONXL chemiluminescence analyzer
(DiaSorin S.p.A., Saluggia, Italy) with LIAISON® NSE kit
(314561; DiaSorin S.p.A.). For each sample, 200 µl RBCs were drawn
into a tube, stored frozen at −80°C for 5 min, and thawed
completely at room temperature; the freeze-thaw cycle was repeated
three times. From each sample tested, 300 µl serum was drawn into
another tube and mixed with 10 µl treated RBCs. Serum was isolated
by centrifugation at 2,583 × g and 25°C for 5 min after mixing, and
the NSE results of hemolyzed neonatal serum samples were measured
by chemiluminescence.
Hemolyzed neonatal serum Hb
quantitation
Samples of 100 µl hemolyzed neonatal serum for which
NSE concentrations had been determined prior to and following
addition of freeze-thawed RBCs were added to 2.5 ml Van Kampen and
Zijlstra solution. Absorbance values of the mixtures were measured
at 540 nm within 5–15 min, and Hb concentrations were calculated
according to the Hb standard curve for hemolyzed neonatal serum
samples.
Correlation of hemoglobin cyanide
(HiCN) and instrument tests
As described in the National Committee for Clinical
Laboratory Standards EP9-A2 document (13), the Hb concentrations of 40 randomly
selected hemolyzed neonatal serum samples (n=530 group) within 24 h
of birth with different degrees of hemolysis (Hb: 0.50 g-12.00 g/l)
were measured with the HiCN method and a Hb analyzer. The
correlation was evaluated between the test results of these two
methods.
Statistical analysis
SPSS version 18.0 (SPSS, Inc., Chicago, IL, USA) was
used to establish the result database and perform the statistical
analyses. Measurement data were expressed as the mean ± standard
deviation. The normality of the individual constant between
neonatal serum NSE levels relative to the Hb concentration was
evaluated by P-P plot and D'Agostino's test. The Mann-Whitney U
test was adopted to compare corrected NSE levels between the
individual constant group (n=86) and the group following correction
formula application (n=86), and total bilirubin levels between a
‘within 24 h of birth group’ (n=181) and ‘within 25–120 h of birth
group’ (n=407). The Pearson test was utilized for correlation
analysis between the adjusted values of the two groups. The Pearson
test and linear regression analysis were used to compare the
correlation between the levels determined by the HiCN and
instrumental methods. P<0.01 was considered to indicate
statistical significance.
Results
Laboratory and clinical features of
neonatal serum samples
As presented in Table
I, the content of serum total bilirubin in newborns within
25–120 h of birth was significantly higher compared with that in
newborns within 24 h of birth (P<0.01). When NSE was detected,
the birth time of the newborn was mainly distributed within 24 h.
However, the serum samples of newborns within 24 h of birth
appeared to be hemolyzed, and the concentration of Hb in most sera
was >2 g/l.
 | Table I.Laboratory and clinical features of
hemolyzed neonatal serum samples. |
Table I.
Laboratory and clinical features of
hemolyzed neonatal serum samples.
| Feature | Value |
|---|
| Serum total
bilirubin, µmol/l, mean ± SD |
|
| ≤24 h
(n=181) |
45.9±13.3 |
| 25–120 h
(n=407) | 164.7±74.6 |
| Phlebotomy time after
birth, no. (%) |
|
| ≤24
h | 486 (91.70) |
| 25–120
h | 44 (8.30) |
| Serum hemoglobin g/l
(≤24 h), no. (%) |
|
| ≤1 | 38
(13.57) |
| 1–2 | 69
(24.64) |
|
>2 | 173 (61.79) |
Standard curves of Hb
The standard curve of the Hb concentration in whole
blood was Hbblood=371.6900×A540nm+1.7835
(r=0.9991) according to the colorimetric analysis of a standard
solution. In hemolyzed neonatal serum samples, the standard curve
was Hbserum=34.7690×A540nm+0.2492
(r=0.9996).
Correlation between the changes in
concentrations of Hb and NSE
The individual constant of NSE for hemolyzed
neonatal serum samples was the ratio between the change of NSE to
the Hb content in hemolyzed neonatal serum samples prior to and
following addition of individually frozen-thawed RBCs of newborns.
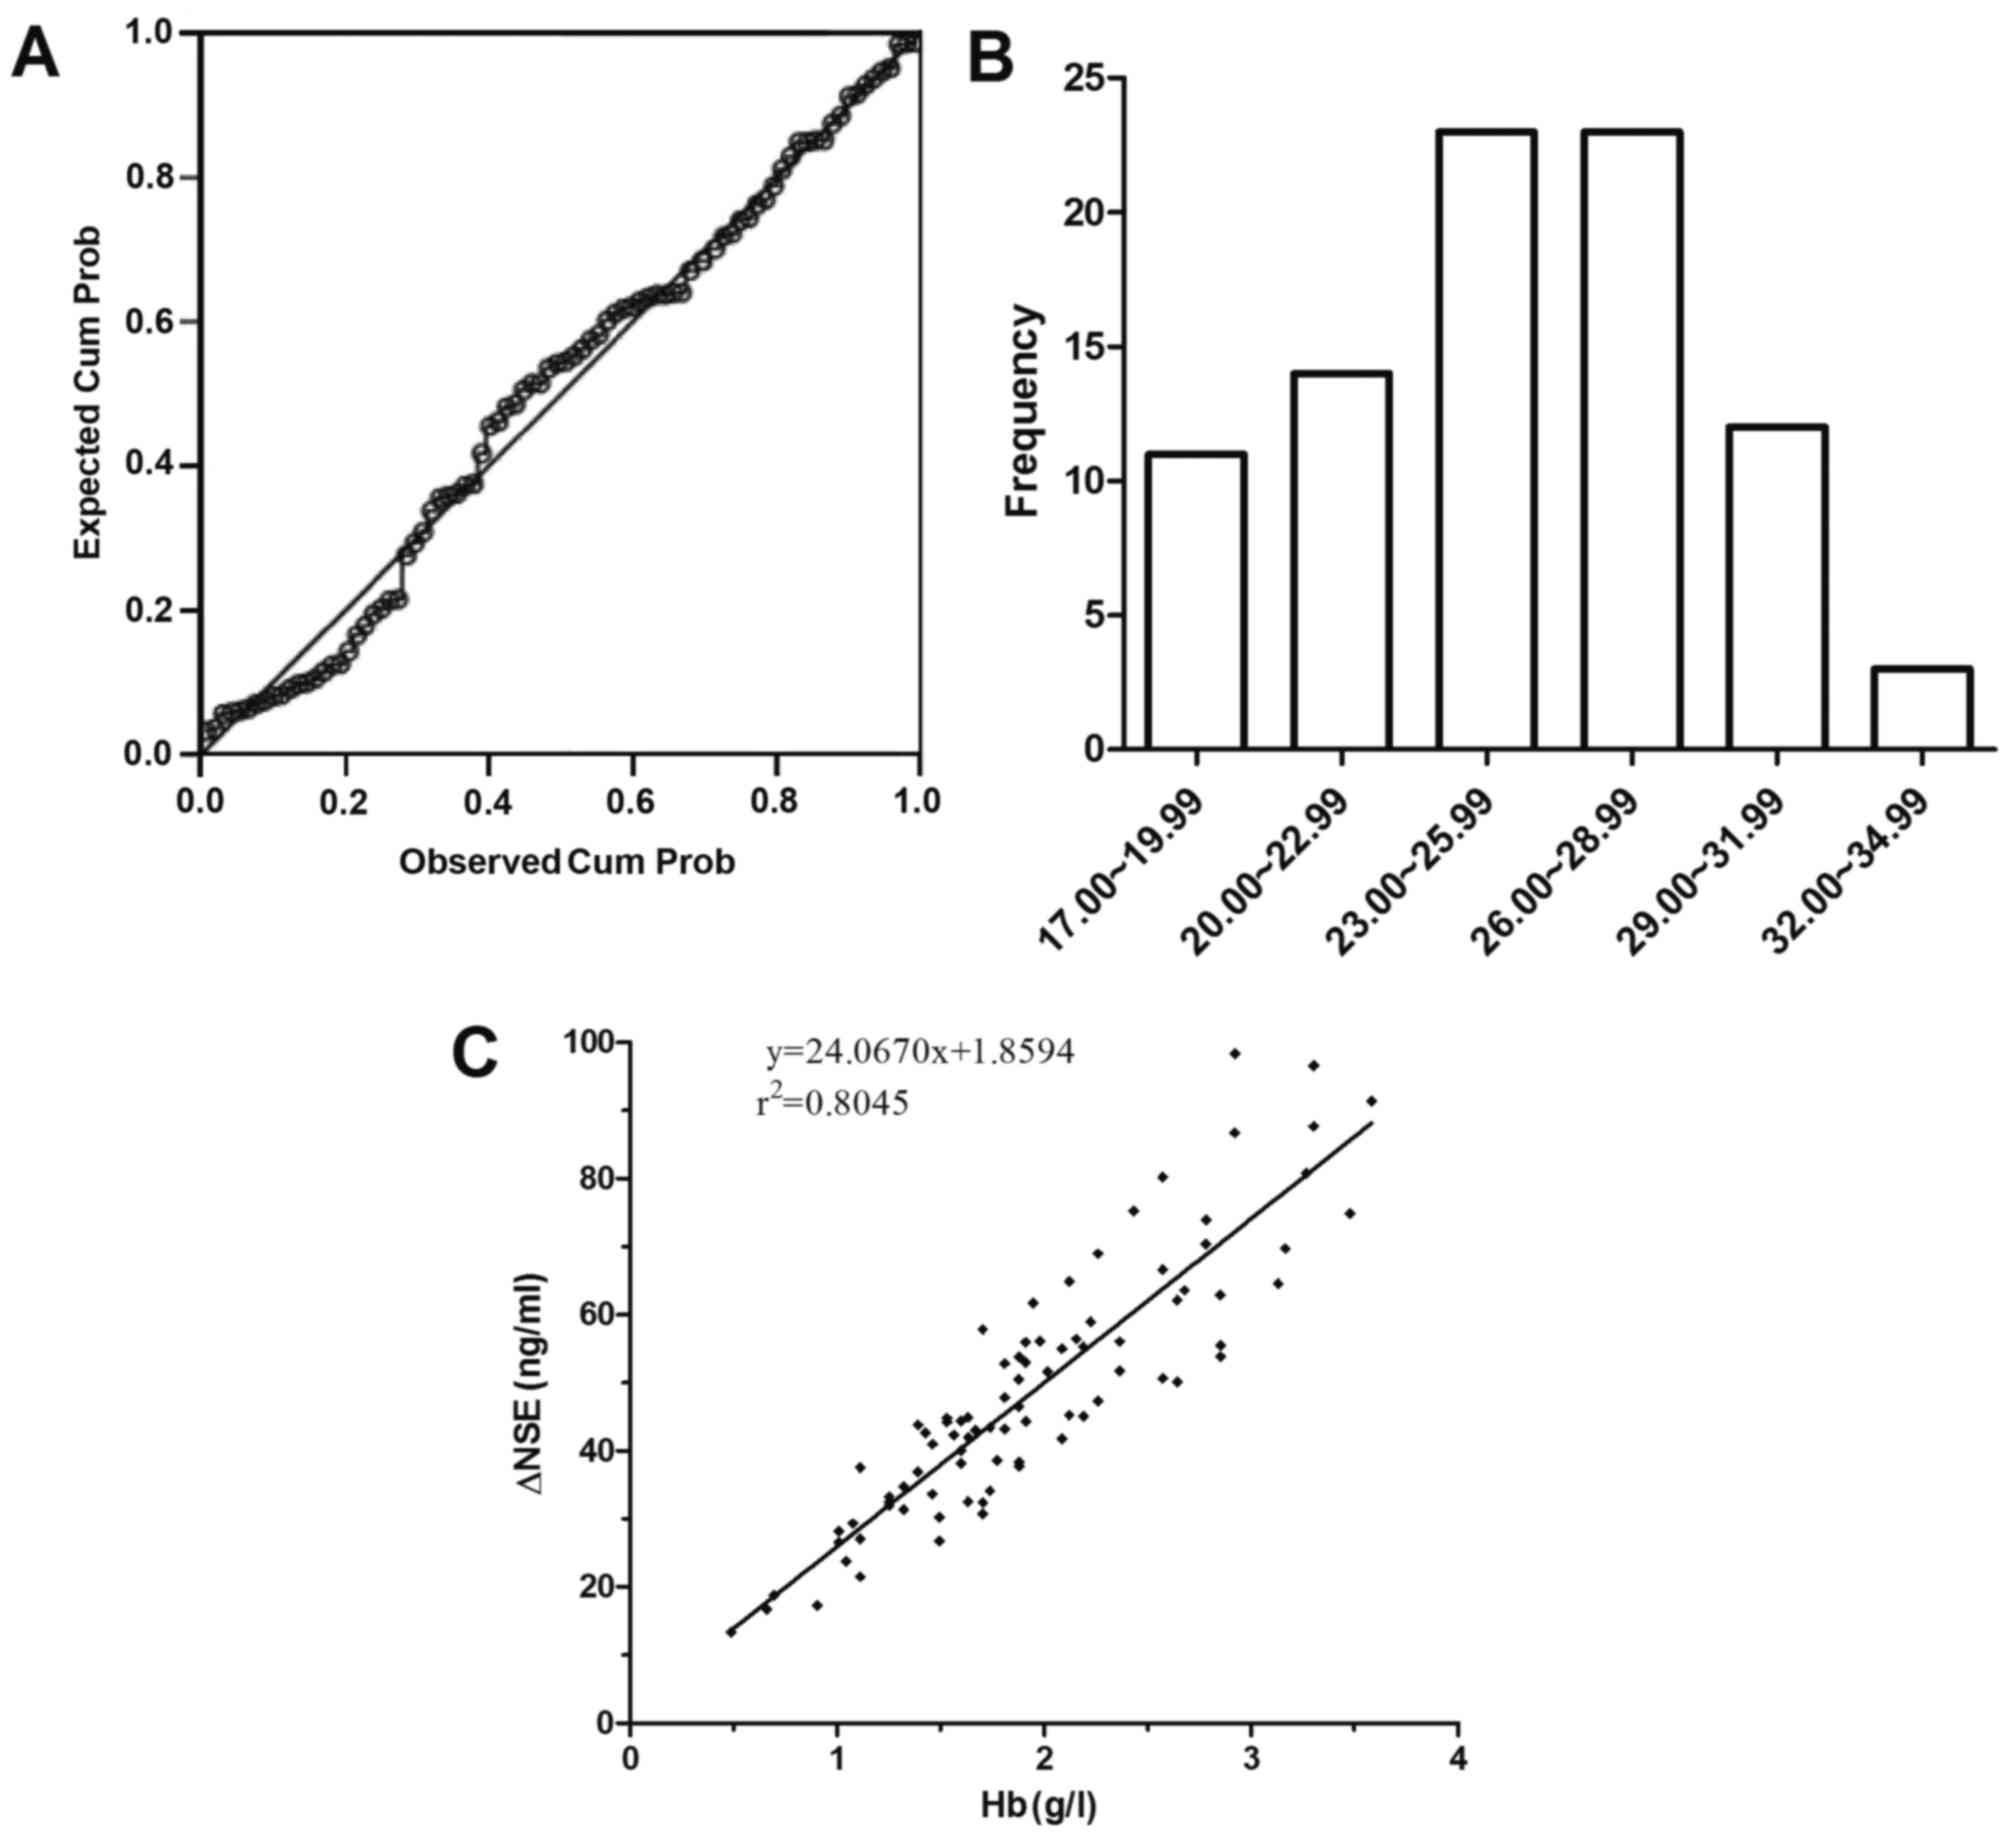
The individual constants of NSE in the 86 hemolyzed neonatal serum
samples were 25.15±3.94 mg/g Hb. Based upon the P-P plot analysis,
the individual constants of NSE were normally distributed (Fig. 1A and B); the same result was obtained
with D'Agostino's test (P=0.314; data not shown). The changes in
the concentration of NSE in sera prior to and following addition of
individually frozen-thawed RBCs were significantly correlated with
the changes in the concentration of Hb (Fig. 1C); the correlation of concentration
variation between NSE and Hb in hemolyzed neonatal sera was
ΔNSEserum=1.8594+24.0670×HbHiCN
(r2=0.8045, P<0.001).
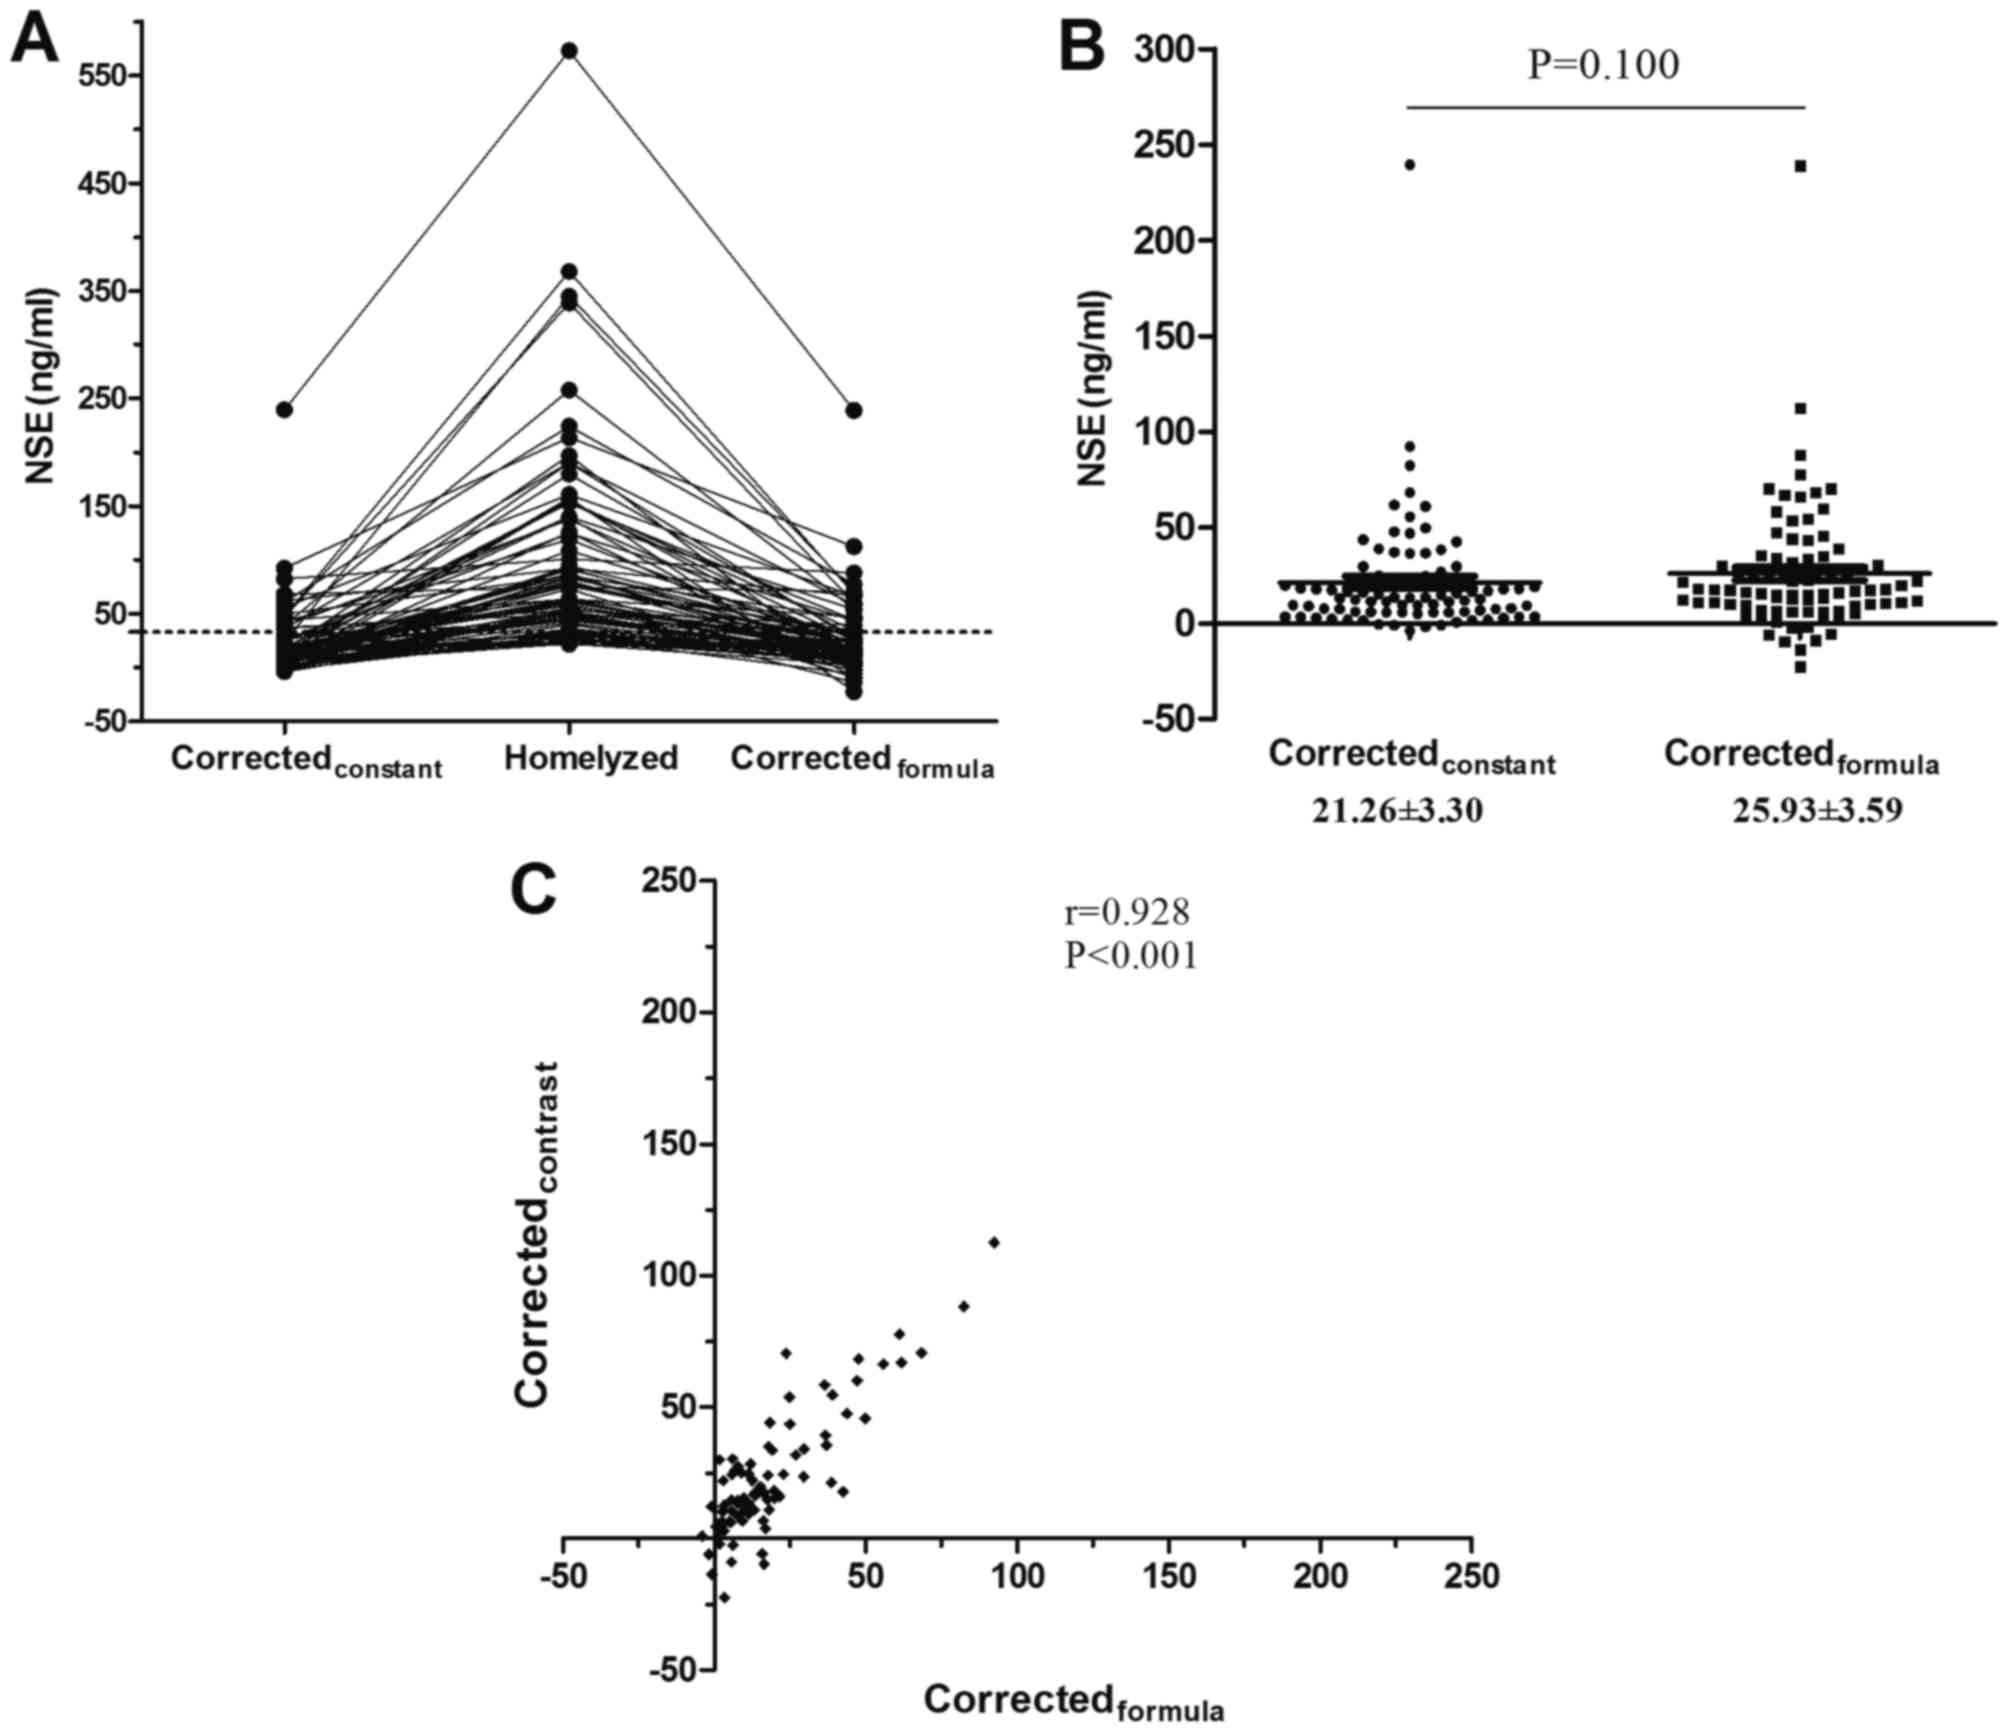
Comparison of the NSE results
corrected by two different correction methods
The corrected NSE results from the individual
constant group and correction formula group were compared with
hemolyzed serum NSE results (Fig.
2A). There was no statistically significant difference in
corrected NSE results between the individual constant and
correction formula groups (Z=−1.645, P=0.100; Fig. 2B). Additionally, the results
demonstrated that the corrected NSE results from the individual
constant group were significantly correlated with those of the
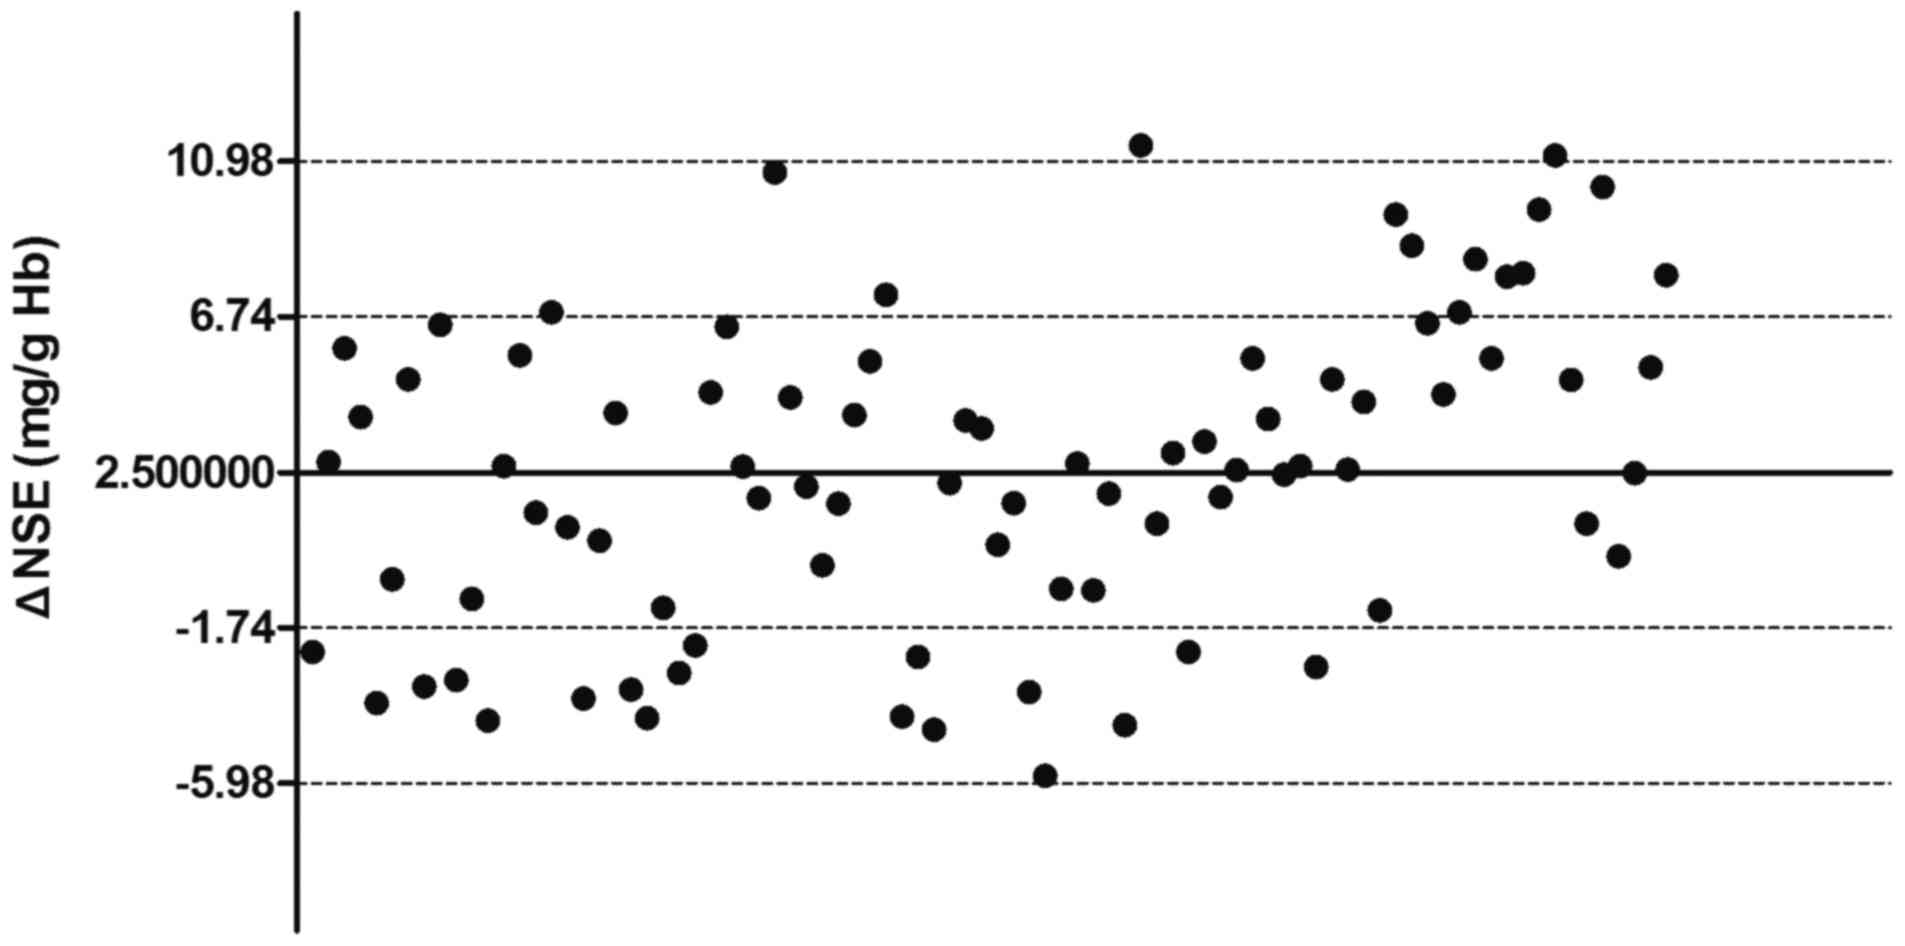
correction formula group (r=0.928, P<0.001; Fig. 2C). The 95% confidence interval results
for NSE corrected with the formula were in the range of −5.98–10.98
mg/g Hb, which were comparable with the results of NSE corrected by
individual constants (Fig. 3).
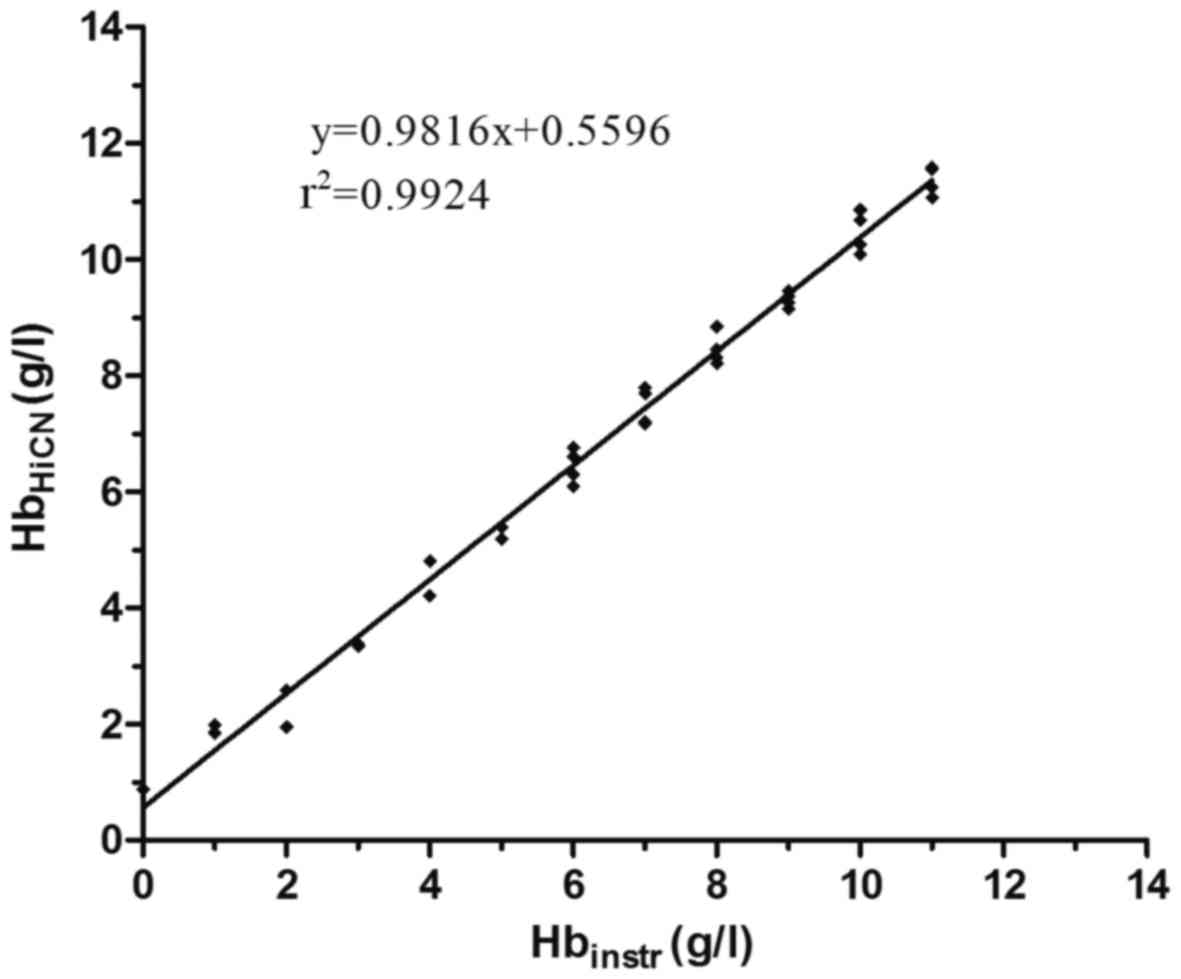
Correlation between HiCN and
instrument tests
The concentration of Hb in hemolyzed serum samples
was measured by the HiCN and instrumental methods. The content of
Hb measured by the HiCN method was significantly correlated with
that measured by the instrumental method (Fig. 4); the linear regression formula of Hb
measured by the instrumental method compared with HiCN was
Hbinstr=0.9816×HbHiCN+0.5596
(r2=0.9924, P<0.001).
Correction formulas
According to the association between the changes in
NSE and Hb content in neonatal serum, as well as the correlation
between the two methods for the determination of Hb, the correction
formulas for the determination of NSE in hemolyzed neonatal serum
were
NSEcorr=NSEmeas-24.0670×HbHiCN-1.8594
and
NSEcorr=NSEmeas-24.5181×Hbinstr+11.8609.
Discussion
The present study described the effect of hemolysis
on the quantitative results of NSE in hemolyzed neonatal serum and
proposed a correction formula for the quantitative results of NSE
in hemolyzed neonatal serum. The correction formula cannot be
applied to all newborns, particularly those with serum samples
collected more than 24 h after birth, and cannot achieve true NSE
results in hemolyzed neonatal sera. However, compared with the
quantitative results of NSE or the estimated results of NSE based
upon the pediatrician's experience with hemolyzed neonatal sera,
the corrected NSE results were closer to the true value, and thus
have potential in aiding pediatricians to evaluate the presence,
severity and prognosis of HIE, particularly for newborns within 24
h of birth.
Due to differences in metabolism and half-life,
investigating the association between the changes of NSE and Hb
in vivo and the occurrence of physiological hemolysis in
newborns is difficult, particularly during the period of
large-scale metabolic conversion of Hb to bilirubin in the
reticuloendothelial system of the liver, spleen and marrow
(14,15). Not only the association between the
changes of NSE and Hb needs to be considered, but also the
association between the changes of Hb and bilirubin. The corrected
NSE results may be far from the true results. The degree of
hemolysis of erythrocytes and the concentration of bilirubin in the
serum of newborns exhibits a sharp increase on the third day and a
slight decrease on the fifth day of birth (16). Accordingly, in the current study, the
quantitation of total bilirubin in the serum of newborns within 24
h was higher compared with that in newborns aged 2 to 5 days old.
This finding demonstrates that neonatal physiological hemolysis may
occur or that Hb metabolic conversion may occur after 24 h. In
addition, more than 90% of clinical orders to measure NSE in serum
were made within 24 h of the neonate's birth; and for more than 80%
of newborns born within 24 h, their degree of hemolysis of sera was
greater than 1 g/l Hb. These investigations demonstrate that i)
establishing a correction formula for NSE in serum of newborns born
within 24 h may account for most neonates; ii) establishing a
correction formula for NSE in serum for newborns is critical; and
iii) in most cases, a new blood sample from newborns obtained
within 24 h of birth may improve the situation of hemolysis.
Perinatal HIE involves two distinct phases: Immediate primary
neuronal death associated with cellular hypoxia and depletion of
energy stores; and a secondary phase of delayed neuronal death (at
approximately 6 h) associated with reperfusion injury (17). Establishing correct judgment and
treatment is critical for the prognosis of newborns with HIE before
6 h of life (18). Overall, the
present study established a correction formula for NSE in serum
obtained from newborns within 24 h of birth.
Photometric determination of HiCN is recommended as
the standard method for the quantitative determination of Hb in
blood. If any other method is used, it should be compared with the
HiCN method (19). In addition, when
a spectrophotometer is used, the blood should be appropriately
diluted (for example, 1:251, 20 µl blood in 5 ml reagent) (19). In the current study, because of the
low level of Hb in neonatal sera, the dilution ratio was reduced
(1:26, 100 µl serum in 2.5 ml reagent) to increase the sensitivity
of HiCN in quantitating Hb in neonatal serum samples, and a best
fit line of the concentration of Hb was obtained with the optical
density at λ=540 nm and an r2=0.9996.
The reference range of NSE in neonatal serum in our
laboratory is 0.00–18.00 mg/l, determined from NSE data when NSE
testing was performed at our laboratory, and the range of
inter-individual variability of NSE with Hb is 25.15±3.94 mg/g Hb.
This observation indicates that more than 80% of newborns may have
different degrees of misinterpretation of their NSE results,
particularly when the pediatrician does not consider the effect of
hemolysis on the results of NSE. When verifying the performance of
the correction formula, the concentration of NSE in all 86
hemolyzed neonatal serum samples exceeded the upper limit of the
normal range prior to correction; in comparison, the ratios for
exceeding the upper limit of the normal range were 34.88 and 44.19%
for corrections by individual constants and the correction formula,
respectively. There was no significant difference between those two
groups of correction results, and thus the correction formula may
be used to correct the concentration of NSE in hemolyzed neonatal
sera. However, it should be highlighted that approximately 64, 31
and 5% of corrected results for NSE may exhibit a maximum
difference of 6.74, 10.98 and greater than 10.99 mg/g Hb,
respectively, although these results were comparable with the
results of NSE corrected by individual constants.
Due to the complexity of the HiCN method for
detecting Hb in the serum of newborns, correlation analysis was
used to evaluate the degree of consistency of the HiCN with an
instrumental method, and the results indicated a high degree of
correlation (r2=0.9924) between the methods. The
instrument method could be used to quantify Hb in the serum of
newborns, followed by the concentration of NSE with the correction
formula. However, there was a maximum difference of 1 g/l Hb
between the two methods, equivalent to an approximately 25.86 mg/l
NSE difference, regardless of the degree of hemolysis in the serum
of newborns.
In conclusion, the use of a correction formula aided
to reduce the effects of hemolysis on NSE results. The present data
suggested that the corrected NSE results were closer to the true
value and may aid pediatricians evaluate the presence, severity and
prognosis of HIE, particularly for newborns within 24 h of
birth.
Acknowledgements
The authors are thankful to Professor Xiaobing Tian
from North Sichuan Medical College (Nanchong, China) for his
assistance with the data analysis.
Funding
The current study was supported by grants from the
Department of Science and Technology of Sichuan Province (grant no.
2016JY0171), and the International Science and Technology
Cooperation Program of China (grant no. 2015DFA30420).
Availability of data and materials
The datasets used and/or analyzed during the current
study are available from the corresponding author on reasonable
request.
Author's contributions
QW and GW collected subjects, performed the
experiments of Hb quantitation, neonatal serum NSE quantitation and
correlation tests for the 86 neonatal serum samples, and prepared
and wrote the first draft of this paper. XL performed statistical
analyses and edited the manuscript. XG, QD and FL reviewed total
bilirubin resultsand clinical order time and edited the manuscript.
QF and GZ performed the Hb quantitation of the 280 neonatal serum
samples. DW planned and designed the study. All authors read and
approved the final manuscript.
Ethical approval and consent to
participate
This research programme was approved by the Ethics
Committee of the Affiliated Hospital of North Sichuan Medical
University and was consented by the parents or guardians of
participants enrolled for the purposes of the current study.
Consent for publication
Consent for publication of relevant data was
obtained from the parents or guardians of enrolled participants on
the basis of anonymization of all personal data.
Competing interests
The authors declare that they have no competing
interests.
Glossary
Abbreviations
Abbreviations:
|
HIE
|
hypoxic-ischemic encephalopathy
|
|
NSE
|
neuron-specific enolase
|
|
Hb
|
hemoglobin
|
|
HiCN
|
hemoglobin cyanide
|
|
RBCs
|
red blood cells
|
References
|
1
|
Douglas-Escobar M and Weiss MD:
Hypoxic-ischemic encephalopathy: A review for the clinician. JAMA
Pediatr. 169:397–403. 2015. View Article : Google Scholar : PubMed/NCBI
|
|
2
|
Agut T, León M, Rebollo M, Muchart J, Arca
G and Garcia-Alix A: Early identification of brain injury in
infants with hypoxic ischemic encephalopathy at high risk for
severe impairments: Accuracy of MRI performed in the first days of
life. BMC Pediatr. 14:177–183. 2014. View Article : Google Scholar : PubMed/NCBI
|
|
3
|
Pierrat V, Haouari N, Liska A, Thomas D,
Subtil D and Truffert P: Groupe d'Etudes en Epidémiologie
Périnatale: Prevalence, causes, and outcome at 2 years of age of
newborn encephalopathy: Population based study. Arch Dis Child
Fetal Neonatal Ed. 90:F257–F261. 2005. View Article : Google Scholar : PubMed/NCBI
|
|
4
|
Filippi L, Fiorini P, Daniotti M, Catarzi
S, Savelli S, Fonda C, Bartalena L, Boldrini A, Giampietri M,
Scaramuzzo R, et al: Safety and efficacy of topiramate in neonates
with hypoxic ischemic encephalopathy treated with hypothermia
(NeoNATI). BMC Pediatr. 12:144–154. 2012. View Article : Google Scholar : PubMed/NCBI
|
|
5
|
Shang Y, Mu L, Guo X, Li Y, Wang L, Yang
W, Li S and Shen Q: Clinical significance of interleukin-6, tumor
necrosis factor-α and high-sensitivity C-reactive protein in
neonates with hypoxic-ischemic encephalopathy. Exp Ther Med.
8:1259–1262. 2014. View Article : Google Scholar : PubMed/NCBI
|
|
6
|
Douglas-Escobar M and Weiss MD: Biomarkers
of hypoxic-ischemic encephalopathy in newborns. Front Neurol.
3:1442012. View Article : Google Scholar : PubMed/NCBI
|
|
7
|
Tolan NV, Vidal-Folch N,
Algeciras-Schimnich A, Singh RJ and Grebe SK: Individualized
correction of neuron-specific enolase (NSE) measurement in
hemolyzed serum samples. Clin Chim Acta. 424:216–221. 2013.
View Article : Google Scholar : PubMed/NCBI
|
|
8
|
Berger RP: The use of serum biomarkers to
predict outcome after traumatic brain injury in adults and
children. J Head Trauma Rehabil. 21:315–333. 2006. View Article : Google Scholar : PubMed/NCBI
|
|
9
|
Guzel A, Er U, Tatli M, Aluclu U, Ozkan U,
Duzenli Y, Satici O, Guzel E, Kemaloglu S, Ceviz A, et al: Serum
neuron-specific enolase as a predictor of short-term outcome and
its correlation with Glasgow Coma Scale in traumatic brain injury.
Neurosurg Rev. 31:439–444; discussion 444–445. 2008. View Article : Google Scholar : PubMed/NCBI
|
|
10
|
Chabok SY, Moghadam AD, Saneei Z, Amlashi
FG, Leili EK and Amiri ZM: Neuron-specific enolase and S100BB as
outcome predictors in severe diffuse axonal injury. J Trauma Acute
Care Surg. 72:1654–1657. 2012. View Article : Google Scholar : PubMed/NCBI
|
|
11
|
Celtik C, Acunaş B, Oner N and Pala O:
Neuron-specific enolase as a marker of the severity and outcome of
hypoxic ischemic encephalopathy. Brain Dev. 26:398–402. 2004.
View Article : Google Scholar : PubMed/NCBI
|
|
12
|
Marangos PJ, Campbell IC, Schmechel DE,
Murphy DL and Goodwin FK: Blood platelets contain a neuron-specific
enolase subunit. J Neurochem. 34:1254–1258. 1980. View Article : Google Scholar : PubMed/NCBI
|
|
13
|
National Committee for Clinical Laboratory
Standards (NCCLS): Method Comparison and Bias Estimation Using
Patient Samples; Approved Guideline-Second EditionNCCLS document
EP9-A2. NCCLS; Wayne, PA: 2002
|
|
14
|
Nakajima H, Takemura T, Nakajima O and
Yamaoka K: Studies on hemo α-methenyl oxygenase. I. The enzymatic
conversion of pyridine-hemichromogen and hemoglobin-haptoblobin
into a possible precursor of biliverdin. J Biol Chem.
238:3784–3796. 1963.PubMed/NCBI
|
|
15
|
Robinson SH and Koeppel E: Preferential
hemolysis of immature erythrocytes in experimental iron deficiency
anemia: Source of erythropoietic bilirubin formation. J Clin
Invest. 50:1847–1853. 1971. View Article : Google Scholar : PubMed/NCBI
|
|
16
|
Richards JE, Goldbloom RB and Denton RL:
Physiologic hyperbilirubinemia and hemolysis of erythrocytes by
hydrogen peroxide solution in the newborn: Investigation of a
possible relationship. Pediatrics. 20:92–97. 1957.PubMed/NCBI
|
|
17
|
Gulczyńska E and Gadzinowski J:
Therapeutic hypothermia for neonatal hypoxic-ischemic
encephalopathy. Ginekol Pol. 83:214–218. 2012.(In Polish).
PubMed/NCBI
|
|
18
|
Horn AR, Swingler GH, Myer L, Linley LL,
Raban MS, Joolay Y, Harrison MC, Chandrasekaran M, Rhoda NR and
Robertson NJ: Early clinical signs in neonates with hypoxic
ischemic encephalopathy predict an abnormal amplitude-integrated
electroencephalogram at age 6 hours. BMC Pediatr. 13:52–62. 2013.
View Article : Google Scholar : PubMed/NCBI
|
|
19
|
No authors listed: International committee
for standardization in haematology. Recommendations for
haemoglobinometry in human blood. Br J Haematol. 13:71–75. 1967.
View Article : Google Scholar : PubMed/NCBI
|