Introduction
Coronavirus disease 2019 (COVID-19) illness,
stemming from severe acute respiratory syndrome coronavirus 2
(SARS-CoV-2), posed a critical emergency for healthcare systems
during the first 3 years of the pandemic (1). However, the World Health Organization
has advised maintaining readiness and vigilance across healthcare
systems at all levels to address potential increases in outpatient
cases and hospitalization, especially during peak periods of other
communicable diseases with high care demand (2).
Despite most infections being self-limiting
(3), the number of cases made
COVID-19 one of the leading causes of mortality worldwide from 2020
to 2022. Nonetheless, this trend has diminished in recent years,
partly due to vaccination strategies (4,5).
The prevalence of severe/critical COVID-19 cases and
the need for hospitalization may vary based on regional factors
(6). Globally, hospitalized
patients with COVID-19 experienced mortality rates ranging from 1
to 52% (7), varying significantly
based on the pandemic stage, ethnic and sociocultural
characteristics, as well as vaccination or treatment strategies
(8).
In Mexico, the overall hospital case mortality rate
between March 2020 and August 2022 was 45.1% (95% CI, 44.9, 45.3),
reaching a peak of 50.8% (9). This
was one of the highest mortality rates among hospitalized patients
with COVID-19 globally (10). Up to
January 2024, Mexico has reported a total of 7,633,355 confirmed
cumulative COVID-19 cases and >334,336 deaths (11,12).
The emergency caused by COVID-19 has led to the
necessity and implementation of clinical instruments with high
predictive value to support decision-making in patients with severe
and critical illness (12). Various
clinical risk scales and severity indices for respiratory disease
and the progression of organ failure have been implemented to
monitor patients hospitalized due to COVID-19. Although some of
these scales were developed to monitor bacterial infection, they
have been adapted for use in COVID-19, such as the Pneumonia
Severity Index (PSI), the National Early Warning Score 2 (NEWS-2)
and the Quick Sepsis-Related Organ Failure Assessment Score (qSOFA)
(13-15).
Other scales were specifically created for COVID-19, such as Viral
Pneumonia Mortality Score (MuLBSTA: multilobular infiltration,
hypo-lymphocytosis, bacterial coinfection, smoking history,
hypertension, and age) and COVID-Guangzhou Institute of Respiratory
Health Calculator at Admission (GRAM) (16,17).
The Kirby Index (PaO2/FiO2, arterial oxygen
pressure/fraction of inspired oxygen) is a tool used to measure
lung capacity and functionality, particularly for diagnosing and
prognosticating the severity of acute respiratory distress syndrome
(18,19). The liver fibrosis index (FIB-4) is
another scale that is worth studying, because previous studies
showed that it has promising predictive power for mortality rate in
patients with COVID-19, without underlying liver disease and in all
age groups (20,21).
Nevertheless, the prognostic capacity of these
scales in COVID-19 has typically been evaluated through receiver
operating characteristic (ROC) curve analysis using only clinical
data or markers at hospital admission or within the first 48 h of
hospitalization (22-24).
However, it is evident that both the disease status and the value
of clinical markers used in the scales are changing over time,
especially in hospitalized patients with COVID-19(25). Therefore, in diseases with changing
clinical states, it has been proposed that to assess the predictive
power of certain markers or indices, it is more appropriate to use
time-dependent ROC curve analysis (26). ROC curves are generated at different
time points to determine if a severity scale maintains its
predictive capacity consistently or if it may weaken or strengthen
as the target time moves away from the baseline (26).
The present study aimed to assess the predictive
capacity for mortality of seven commonly used clinical indicators
(PSI and Kirby index, COVID-GRAM, NEWS-2, qSOFA, FIB-4 and MuLBSTA)
in patients with severe and critical COVID-19 upon admission and at
2, 4, 6 and 8 days of hospitalization using time-dependent ROC
curve analysis. These clinical indicators were selected because
they have been demonstrated utility in predicting mortality and
severity in patients with respiratory disease, including COVID-19.
These tools incorporate clinical parameters such as vital signs,
laboratory results, and comorbidities to provide a comprehensive
assessment of patient prognosis. Additionally, they have been
previously validated in similar patient populations and have shown
promising results in predicting outcomes in patients with COVID-19.
Furthermore, the effectiveness of these predictive tools relies on
the availability of relevant data types, including clinical
observations, laboratory results, and patient demographics
(15,16,18,20,27-29).
The present study aimed to identify severity indices maintaining
consistent predictive capacity in patients with fluctuating health
status, such as those hospitalized with COVID-19, within a cohort
exhibiting one of the highest mortality rates globally.
Materials and methods
Study design
An ambispective (bidirectional) cohort study was
conducted longitudinally with data collected from patients with
severe and/or critical (30)
COVID-19 who were hospitalized from February 2021 to December 2022
at the COVID-19 unit at General Hospital Number 1 of the Mexican
Institute of Social Security (IMSS)-Colima (Colima, Mexico). The
study was conducted in compliance with the Declaration of Helsinki
and was approved by the local health research committee of General
Hospital Number 1 of IMSS-Colima (approval no. R-2021-601-014).
Following national legislation and institutional protocols, the
local health research committee waived the requirement for written
consent from patients involved in this observational study (article
23 of the Regulations of the General Health Law on Health Research
in Mexico) (31,32) as it solely entailed analyzing data
from a hospital database, posing no risk to patients. Patient
confidentiality was maintained throughout the study, which was
classified as low risk (31).
Patients
The inclusion criteria were non-pregnant patients
aged >18 years diagnosed with COVID-19 based on positive results
from Severe Acute Respiratory Syndrome Coronavirus 2 Reverse
Transcription PCR (SARS-CoV-2 RT-PCR) or antigen tests. The study
enrolled patients admitted to regular hospital floors, high-flow
oxygen rooms, or intensive care units. Exclusion criteria included
patients receiving only emergency room care without admission and
those with incomplete clinical records. 515 patients were included
in the analysis. The median age was 63.3±16.1 years, with a
percentage of male patients was 61.9% and the percentage of female
patients was 38.1%.
Measures and follow-up
Patient information, including medical history,
COVID-19 vaccination status and clinical parameters from admission
to discharge (due to either improvement or death), was retrieved
from clinical records. Data collected included age, sex, medical
history (comorbidities, Charlson comorbidity index score) (33), history of prior COVID-19 infection,
smoking status (based on the Glossary of the National Health
Interview Survey of the United States of America) (34), admission disease phase
(severe/critical), clinical, laboratory and imaging data for each
day of hospitalization, and reason for discharge (death or
improvement). Arterial hypertension was identified by criteria
aligned with the guidelines set forth by the Eighth Joint National
Committee (JNC 8) for hypertension; these criteria encompassed a
documented history in the clinical records (prior to
hospitalization due to COVID-19 infection) of blood pressure
readings equal to or exceeding 140/90 mmHg, a prior diagnosis of
hypertension, or a positive record of antihypertensive therapy
(35,36).
Data collected during hospitalization included
variables necessary to calculate the scores of severity scales,
laboratory parameters (such as D-dimer, ferritin, markers of renal
or liver function, complete blood count), use of mechanical
ventilation or hemodialysis and administration of medication
(paracetamol, anticoagulants, antibiotics, vasopressors, steroids,
and diuretics).
The seven severity and clinical risk index scores
[PSI (12), Kirby index (9), COVID-GRAM (19), NEWS-2(37), qSOFA (38), MuLBSTA (30) and FIB-4 (39,40)]
were calculated upon admission and at 2, 4, 6 and 8 days of
hospital stay (Table SI, Table SII, Table SIII, Table SIV, Table SV, Table SVI and Table SVII).
PSI (41) is a tool
for stratifying the severity of patients with community-acquired
pneumonia (42). PSI scale
categorizes patients into five categories based on age,
pre-existing comorbidity, physical examination, and clinical
analysis results (37,43).
Kirby index (PaO2/FiO2) has
been widely used to classify acute respiratory distress syndrome
due to its simplicity and diagnostic and prognostic capacity
(18,44). The 2011 Berlin definition (38) was considered as it presents better
predictive validity for mortality. Kirby index establishes the
degree of hypoxemia as mild (200<
PaO2/FIO2 ≤300), moderate (100<
PaO2/FIO2 ≤200) and severe
(PaO2/FIO2 ≤100 mmHg) (38,44).
COVID-GRAM (45) was
developed to predict critical illness in patients with COVID-19
upon hospital admission. It comprises X-ray abnormality (yes/no),
age, hemoptysis (yes/no), dyspnea (yes/no), unconsciousness
(yes/no), number of comorbidities, history of cancer (yes/no),
neutrophil-to-lymphocyte ratio, lactate dehydrogenase levels and
direct bilirubin (46). This score
considers the risk of developing critical COVID-19 as low
(<1.7%), medium (1.7-<40.4%) (16) and high (≥40.4%) (16,46).
NEWS-2(47) is based
on a set of simple physiological variables to which a score is
assigned. Currently, in its modified version, there are seven
parameters: Respiratory rate, hypercapnic respiratory failure
[partial pressure of carbon dioxide (pCO2) levels],
oxygen saturation (pO2), systolic blood pressure, pulse rate, level
of consciousness or new confusion (assessed according to Glasgow
Coma Scale) (48) and body
temperature. The combination of these values provides a score
ranging from 0 to 20 (49,50).
qSOFA is used to clinically classify a septic
patient and as a predictor of hospital mortality (27). It consists of clinical indicators
including respiratory rate (≥22/min), altered mental status, and
altered systolic blood pressure (≤100 mmHg), with each parameter
generating a score from 0 to 3(51). The components of qSOFA allow for an
early and simple evaluation in hospital settings (25,27,51,52).
Viral Pneumonia Mortality Score (MuLBSTA) is
composed of six parameters: Multilobular infiltration (yes/no),
absolute lymphocyte count ≤0.8x10⁹/l (yes/no), bacterial
coinfection (detected by sputum or blood culture; yes/no), smoking
history (no, inactive, active), history of hypertension (yes/no)
and age ≥60 years (yes/no). The combination of these values
provides a score ranging from 0 to 22(29). Scores classified as follows: 0-11,
low risk and 12-22, high risk of mortality (53). MuLBSTA score is considered to have
potential clinical utility for stratifying the progression of
SARS-CoV-2 disease (17).
FIB-4 index is a commonly used, used for
non-invasive assessment of liver fibrosis in chronic liver disease
due to its accessibility, cost-effectiveness, and validated
reliability, offering a safer and more convenient alternative to
invasive liver biopsy (20,21). It is calculated using four
parameters: Age, levels of aspartate and alanine aminotransferase
and platelet count. A score of ≤1.3 indicates low risk of fibrosis,
>1.3-2.67 moderate risk and >2.67 indicates high risk of
fibrosis. (21,40). The FIB-4 score predicts mortality
better than liver transaminases and may serve as a simple tool to
identify patients with COVID-19 with a poorer prognosis in the
emergency department (20,39).
Statistical analysis
Kolmogorov-Smirnov test was used to determine the
normal distribution of data and Levene's test was used to confirm
the equality of variances. Qualitative variables are expressed as
absolute numbers or percentages, while quantitative variables are
expressed as mean ± standard deviation or 95% confidence intervals.
Quantitative data with non-normal distribution are expressed as
median and range or 25-75th percentile (Q1-Q3). Unpaired Student's
t test was used to compare numerical data with normal distribution
(body mass index and age) whereas Mann-Whitney U tests were used to
compare data with non-normal distribution (length of hospital
stay). Categorical values were compared using Fisher's exact test.
Univariate linear mixed effects model tests were used to compare
the evolution of clinical parameters (PSI, NEWS-2 and COVID-GRAM)
between patients according to their reason for discharge
(improvement or death; fixed effect) during the hospitalization
period (repeated observations), employing two random variables
(month of hospital admission and length of hospital stay).
Additionally, mixed-effects multinomial logistic regression models
were constructed for analysis of longitudinal nominal data [yes vs.
no; patients in critical condition, with mechanical ventilation,
elevated serum D-dimer, lactate dehydrogenase, ferritin, or blood
urea nitrogen (BUN) or use of antibiotics or amines] comparing the
basal values with the values of subsequent days. To determine
predictive capacity for mortality of the clinical severity scales
and indices, the areas under the ROC curve (AUCs) were calculated
for the different scales with their 95% confidence intervals,
cut-off point, P-values along with sensitivity, specificity, and
predictive values upon admission and at 2, 4, 6, and 8 days of
hospitalization. Predictive capacity was classified based on AUC
values as follows: 0.50-0.60 (failed), 0.61-0.70 (worthless),
0.71-0.80 (poor), 0.81-0.90 (good) and >0.90 (excellent), as
previously described (54,55). Regarding the scales (PSI, Kirby
index, COVID-GRAM, NEWS-2, qSOFA, MuLBSTA and FIB-4), the cut-off
point was selected based on the point on the curve that provided
the highest sensitivity and specificity (56). Sensitivity and specificity were
classified as follows: High, >80; moderate, 65-80% and low,
<65% (57). The statistical
analysis was performed using SPSS software, version 20 (IBM
Corp.).
Results
Patient characteristics and
outcomes
During the study period from February 1, 2021, to
December 31, 2022 (Fig. 1), 1747
patients were admitted to the respiratory area of the internal
medicine service at General Hospital Zone #1, Villa de Álvarez,
Colima. Of these, 1,247 were excluded due to bacterial or influenza
pneumonia (without COVID-19), pregnancy, age under 18 years and
incomplete medical records, leaving 515 patients included in the
analysis. The mean age was 63.3±16.1 years with differences between
those who lived or died (60.9±16.7 vs. 66.7±14.2 years,
respectively). The percentage of male patients was 61.9%, with no
differences regarding sex for mortality. Patients who died had a
higher comorbidity index, use of amines, hemodialysis and invasive
ventilatory support, as well as a higher score in all severity
indices analyzed upon hospital admission (except Kirby index, where
its value is inversely proportional to severity of the disease;
Table I). The median length of
hospital stay was a 7.0 days (range, 1-38), being shorter for
patients discharged due to improvement (median of 4-6 days, range,
1-29) compared with those discharged due to death (median of 8.0
days, range, 1-38; Table I). The
characteristics of patients upon admission, as well as the primary
treatments used during hospitalization according to their final
discharge status (alive or deceased), are summarized in Table I. A total of 31.9% of patients
presented with critical illness at the time of admission. Mortality
in the analyzed cohort was 43.9%.
 | Table IClinical characteristics of
patients. |
Table I
Clinical characteristics of
patients.
| Characteristic | All (n=515) | Lived (n=289) | Died (n=226) | P-value |
|---|
| Mean age,
years | 63.3±16.1 | 60.9±16.7 | 66.7±14.2 |
<0.001a |
| Median hospital
stay, days (Q1-Q3) | 7.0 (4-11) | 6.0 (4-9) | 8.0 (5-14) |
<0.001b |
| Male (%) | 61.9 | 60.0 | 64.1 | 0.194c |
| Mean BMI | 30.3±6.9 | 30.3±6.8 | 30.7±6.7 | 0.726a |
| Diabetes (%) | 43.3 | 44.5 | 41.8 | 0.302c |
| High blood pressure
(%) | 42.3 | 50.2 | 32.9 |
<0.001c |
| COPD/asthma
(%) | 10.4 | 7.9 | 13.5 | 0.029c |
| Smoker (%) | 7.6 | 5.6 | 10.0 | 0.045c |
| Cirrhosis (%) | 3.5 | 3.2 | 3.8 | 0.439c |
| Cancer (%) | 0.4 | 0.4 | 0.4 | 0.704c |
| CKD (%) | 22.4 | 19.6 | 25.6 | 0.065c |
| Autoimmune disease
(%) | 6.0 | 5.7 | 6.4 | 0.445c |
| Heart disease
(%) | 3.5 | 2.5 | 4.7 | 0.135c |
| Mean Charlson
index | 3.6±2.1 | 3.2±2.1 | 4.1±2.1 |
<0.001a |
| Vaccinated (%) | 43.9 | 51.2 | 35.0 |
<0.001c |
| Critical COVID
(%) | 31.9 | 9.3 | 59.0 |
<0.001c |
| Mean PSI | 105.0±40.4 | 88.1±29.7 | 133.7±37.3 |
<0.001a |
| Mean
COVID-GRAM | 128.0±35.2 | 116.8±2.3 | 9.6±3.2 |
<0.001a |
| Mean NEWS | 7.0±3.4 | 5.5±29.7 | 133.7±37.3 |
<0.001a |
| Mean qSOFA | 1.00±0.70 | 0.96±0.46 | 1.52±0.81 |
<0.001a |
| Mean MuLBSTA | 9.0±2.8 | 8.2±2.6 | 10.4±2.6 |
<0.001a |
| Mean Kirby
index | 158.0±126.4 | 231.8±132.7 | 132.5±93.1 |
<0.001a |
| Median FIB-4
(Q1-Q3) | 1.63
(0.95-3.02) | 1.35
(0.85-2.28) | 2.16
(1-25-3.69) |
<0.001b |
| Treatment
(%)c | | | | |
|
Paracetamol | 11.3 | 12.5 | 9.8 | 0.213 |
|
Anticoagulants | 90.5 | 88.6 | 92.7 | 0.074 |
|
Antibiotics | 48.4 | 45.9 | 51.5 | 0.119 |
|
Amine
support | 8.6 | 2.5 | 15.8 | <0.001 |
|
Steroids | 92.9 | 95.7 | 92.0 | 0.003 |
|
Diuretics | 14.2 | 13.7 | 14.8 | 0.408 |
|
Mechanical
ventilation | 32.0 | 3.6 | 66.2 | <0.001 |
|
Hemodialysis | 10.3 | 6.8 | 14.5 | 0.003 |
Variability of clinical markers during
hospitalization
Fig. 2A illustrates
the progression of patient outcomes from admission (baseline) to
day 8. A significant increase in patient mortality was observed.
Specifically, on day 7, 44% of admitted patients died, while among
those still hospitalized on day 7, the mortality rate increased to
53%. Similarly, on day 8, mortality rate further rose to 56%. In
patients hospitalized with COVID-19, the disease state was not
static; the proportion of patients with critical illness and
requiring mechanical ventilation increased with time (Fig. 2B and C). Therefore, the value of clinical
markers changed throughout the hospitalization period. The
proportion of patients with elevated serum levels of D-dimer,
lactate dehydrogenase, ferritin and BUN increased with hospital
stay (Fig. 2D-G), as did the need
for antibiotic treatment or support with amines (Fig. 2H and I). Furthermore, PSI, NEWS-2, and
COVID-GRAM remained relatively constant over time, although their
values differ depending on the reason for discharge from the
hospital (improvement or death; Fig.
2J-L).
 | Figure 2Clinical parameters and treatment of
patients with COVID-19 over the first 8 days of hospitalization.
(A) Proportion of patients who died or survived. Compared with
baseline data, the proportion of patients who died increased
significantly on days 7 (P=0.037) and 8 (P=0.007). (B) Proportion
of patients in critical condition significantly increased on days 6
(P=0.024), 7 (P=0.002) and 8 (P<0.001). (C) Proportion of
patients requiring mechanical significantly increased ventilation
on days 3 (P=0.034) and 4-8 (all P<0.001). (D) Proportion of
patients with elevated serum D-dimer significantly increased on
days 6-8 (all P<0.001). (E) Proportion of patients with elevated
serum lactate dehydrogenase significantly increased on days 5
(P=0.016), 6 (P=0.036), 7 (P=0.029) and 8 (P=0.039). (F) Proportion
of patients with elevated serum ferritin significantly increased on
days 2-8 (all P<0.001). (G) Proportion of patients with elevated
blood urea nitrogen significantly increased on days 6 (P=0.011), 7
(P=0.001) and 8 (P=0.006). (H) Proportion of patients requiring
antibiotics significantly on days 3 (P=0.014), 4 (P=0.002) and 5-8
(all P<0.001). (I) Proportion of patients requiring amine
therapy significantly increased on days 4 (P=0.009), 5 (P=0.002)
and 6-8 (all P<0.001). All comparisons were conducted using
mixed-effects multinomial logistic regression analysis.
*P<0.05 vs. baseline. (J) National early warning
score 2, (K) pneumonia severity index and (L) COVID-GRAM remained
relatively constant over time, although their values differ
depending on the reason for discharge from the hospital
(improvement or death) *P<0.001. COVID-19,
Coronavirus Disease 2019; COVID-GRAM, Critical Illness Risk
Score. |
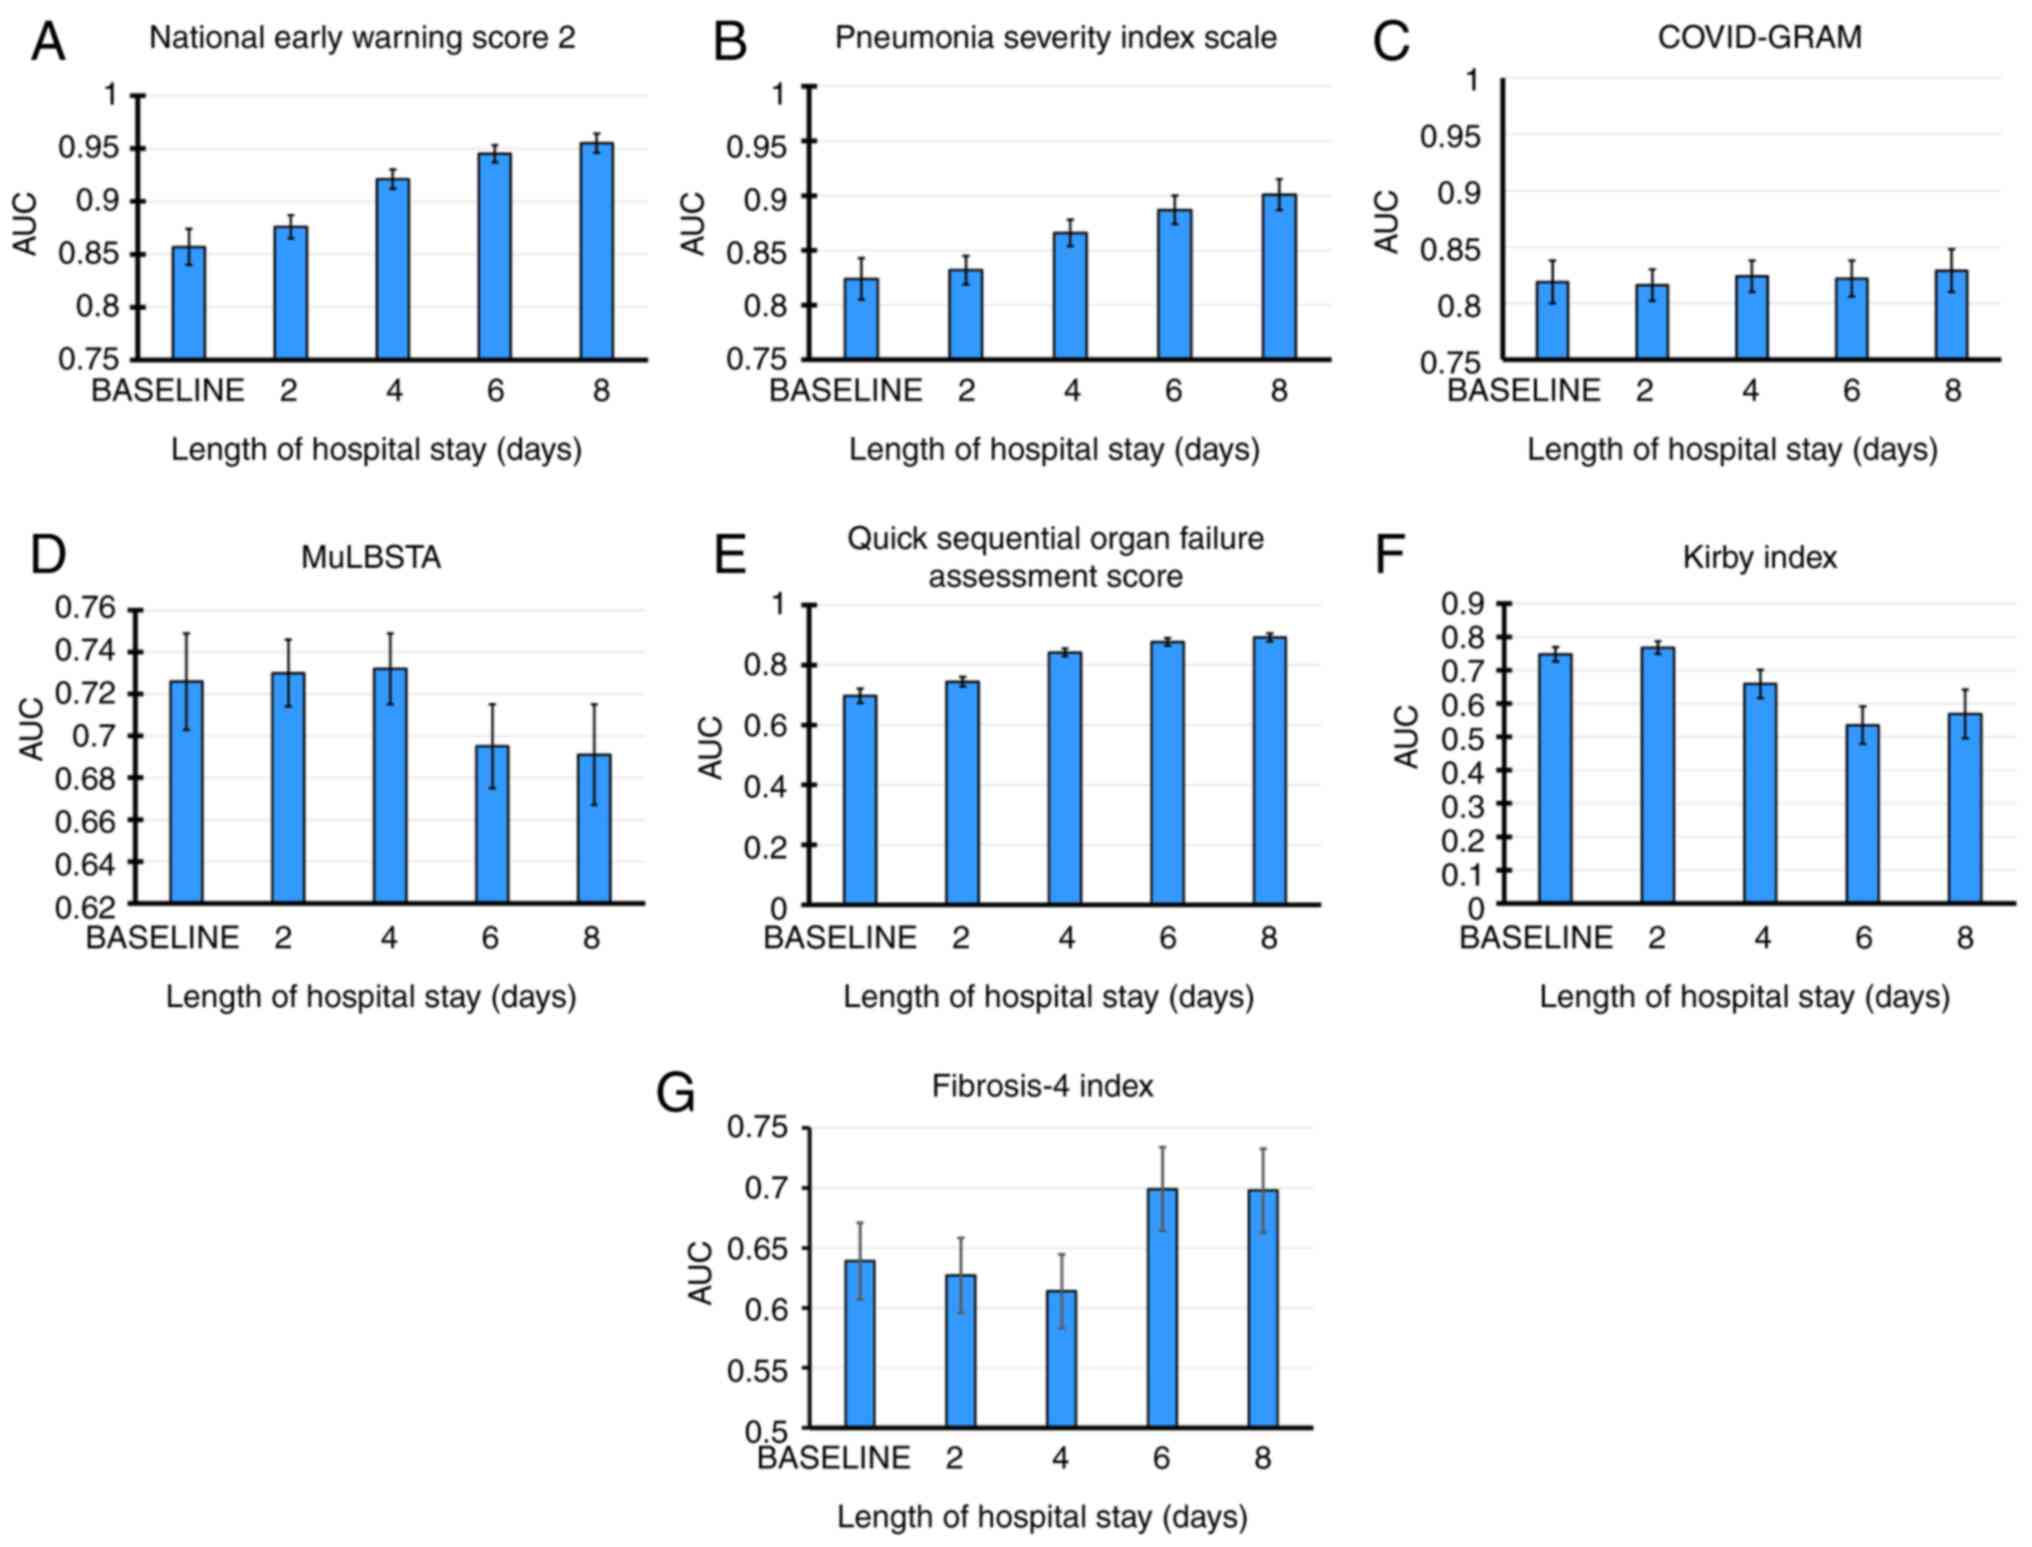
Predictive capacity of mortality
according to severity scales and indices over the course of
hospitalization
Table II shows
predicted mortality at each time point. AUC was calculated to
determine the optimal cut-off point for each variable in predicting
death at different time points (Table
II). For all time points, the index with the highest predictive
power for mortality (according to its AUC values) was NEWS-2,
followed by PSI and COVID-GRAM. These parameters increased
predictive power as the hospitalization time progresses. NEWS-2 had
good predictive power up to 2 and excellent power from 4 days h.
NEWS-2 had the highest sensitivity to predict death (>96% in all
periods evaluated), but its specificity was low (22.9% on admission
to 58.1% on day 8 of hospitalization). PSI had good predictive
capacity from admission to day 6 and excellent power at day 8. Its
sensitivity was high (>80%) in all periods, with moderate
specificity ranging from 70.6 to 77.3%. COVID-GRAM had good
predictive capacity at all time points with high sensitivity
(84.2-87.3%), albeit with low-to-moderate specificity (61.5-67.6%).
The qSOFA index had an AUC with worthless predictive power (0.697)
on the admission, improving its predictive capacity from 96 h (AUC,
0.842). MuLBSTA and Kirby index had poor predictive power on
hospital admission (AUC, 0.726 and 0.748, respectively), with
decreased after 6 days. Kirby index predictive power for patient
survival is shown. MuLBSTA and qSOFA had high sensitivity at all
time points (85-99%) with low specificity (14-33%). Kirby index
showed low sensitivity (57.9% on day 0 and 57.1% on day 2) and high
specificity in the first 2 days (82.5% on day 0 to 84.2% on day 2).
However, after six days, both sensitivity and specificity decreased
(45.7 and 59.4%, respectively). FIB-4 demonstrated statistically
significant predictive capacity at all time points, albeit with
limited clinical value (AUC, 0.639-0.698) and showing low
sensitivity and specificity. Fig. 3
plots the AUC of indices over time, showing that NEWS-2 and PSI had
lowest predictive capacity, and this increased with length of
hospital stay.
| Table IIPredictive capacity of PSI, Kirby
index, COVID-GRAM, NEWS-2, qSOFA, MuLBSTA for mortality in patients
with COVID-19. |
Table II
Predictive capacity of PSI, Kirby
index, COVID-GRAM, NEWS-2, qSOFA, MuLBSTA for mortality in patients
with COVID-19.
| A, Day 0 |
|---|
| Index | AUC | 95% CI | P-value | Cut-off value | SEN, % | SPEC, % | PPV, % | NPV, % |
|---|
| NEWS-2 | 0.857 | 0.823-0.891 | <0.001 | 12.00 | 96.40 | 22.90 | 62.29 | 87.50 |
| PSI | 0.824 | 0.787-0.861 | <0.001 | 114.00 | 80.40 | 70.60 | 76.73 | 74.88 |
| COVID-GRAM | 0.819 | 0.781-0.856 | <0.001 | 142.00 | 87.30 | 61.50 | 72.81 | 80.34 |
| MuLBSTA | 0.726 | 0.682-0.770 | <0.001 | 12.00 | 89.80 | 33.00 | 61.80 | 72.81 |
| qSOFA | 0.697 | 0.650-0.745 | <0.001 | 3.00 | 98.90 | 14.00 | 57.99 | 91.42 |
| Kirby | 0.748 | 0.704-0.792 | <0.001 | 198.00 | 57.90 | 82.50 | 79.89 | 61.93 |
| FIB-4 | 0.639 | 0.029-0.583 | <0.001 | 1.64 | 61.20 | 38.70 | 56.80 | 61.20 |
| B, Day 2 |
| Index | AUC | 95% CI | P-value | Cut-off value | SEN, % | SPEC, % | PPV, % | NPV, % |
| NEWS-2 | 0.876 | 0.854-0.897 | <0.001 | 12.00 | 96.90 | 30.30 | 62.73 | 89.10 |
| PSI | 0.832 | 0.806-0.857 | <0.001 | 115.00 | 81.20 | 70.50 | 77.24 | 75.17 |
| COVID-GRAM | 0.816 | 0.789-0.843 | <0.001 | 142.00 | 86.80 | 61.20 | 73.19 | 79.17 |
| MuLBSTA | 0.730 | 0.699-0.761 | <0.001 | 12.00 | 90.00 | 33.50 | 62.69 | 72.90 |
| qSOFA | 0.744 | 0.713-0.775 | <0.001 | 3.00 | 98.90 | 16.70 | 59.39 | 92.59 |
| Kirby | 0.768 | 0.731-0.805 | <0.001 | 196.00 | 57.10 | 84.20 | 78.66 | 65.80 |
| FIB-4 | 0.627 | 0.531-0.723 | 0.009 | 1.26 | 65.60 | 35.70 | 62.70 | 65.60 |
| C, Day 4 |
| Index | AUC | 95% CI | P-value | Cut-off value | SEN, % | SPEC, % | PPV, % | NPV, % |
| NEWS-2 | 0.921 | 0.904-0.938 | <0.001 | 12.00 | 97.60 | 33.70 | 64.87 | 91.87 |
| PSI | 0.866 | 0.841-0.890 | <0.001 | 115.00 | 81.70 | 75.50 | 80.70 | 76.64 |
| COVID-GRAM | 0.824 | 0.797-0.852 | <0.001 | 142.00 | 85.00 | 65.90 | 75.45 | 78.04 |
| MuLBSTA | 0.732 | 0.700-0.765 | <0.001 | 12.00 | 88.90 | 33.80 | 62.83 | 70.68 |
| qSOFA | 0.842 | 0.817-0.867 | <0.001 | 3.00 | 98.80 | 23.30 | 61.85 | 94.00 |
| Kirby | 0.659 | 0.573-0.740 | <0.001 | 124.00 | 58.50 | 66.80 | 37.62 | 82.46 |
| FIB-4 | 0.614 | 0.518-0.709 | 0.020 | 1.37 | 59.20 | 40.00 | 63.40 | 59.20 |
| D, Day 6 |
| Index | AUC | 95% CI | P-value | Cut-off value | SEN, % | SPEC, % | PPV, % | NPV, % |
| NEWS-2 | 0.945 | 0.929-0.961 | <0.001 | 11.00 | 98.30 | 49.10 | 66.73 | 96.53 |
| PSI | 0.887 | 0.862-0.912 | <0.001 | 122.00 | 86.90 | 77.30 | 79.84 | 85.06 |
| COVID-GRAM | 0.822 | 0.791-0.854 | <0.001 | 147.00 | 85.90 | 65.20 | 71.46 | 82.02 |
| MuLBSTA | 0.695 | 0.656-0.734 | <0.001 | 12.00 | 86.30 | 32.60 | 57.16 | 69.62 |
| qSOFA | 0.877 | 0.853-0.902 | <0.001 | 3.00 | 99.20 | 29.80 | 59.52 | 97.11 |
| Kirby | 0.535 | 0.425-0.645 | 0.308 | 119.00 | 45.70 | 59.40 | 18.82 | 84.16 |
| FIB-4 | 0.699 | 0.599-0.799 | <0.001 | 1.31 | 63.90 | 31.40 | 74.20 | 63.90 |
| E, Day 8 |
| Index | AUC | 95% CI | P-value | Cut-off value | SEN, % | SPEC, % | PPV, % | NPV, % |
| NEWS-2 | 0.955 | 0.938-0.972 | <0.001 | 11.00 | 99.10 | 58.10 | 65.68 | 58.10 |
| PSI | 0.901 | 0.874-0.928 | <0.001 | 129.00 | 90.10 | 72.20 | 72.20 | 90.09 |
| COVID-GRAM | 0.829 | 0.792-0.866 | <0.001 | 151.00 | 84.20 | 67.60 | 67.03 | 84.54 |
| MuLBSTA | 0.691 | 0.645-0.737 | <0.001 | 12.00 | 85.30 | 33.30 | 50.93 | 73.60 |
| qSOFA | 0.892 | 0.865-0.919 | <0.001 | 3.00 | 100.00 | 36.30 | 55.63 | 100.00 |
| Kirby | 0.569 | 0.427-0.711 | 0.253 | 123.00 | 51.90 | 56.30 | 16.09 | 87.85 |
| FIB-4 | 0.698 | 0.579-0.816 | ≤0.001 | 1.34 | 59.7 | 29.70 | 77.60 | 59.70 |
AUC was calculated to determine the optimal cut-off
point for several common clinical biomarkers [neutrophil/lymphocyte
ratio (NLR), serum lactate dehydrogenase (LDH), D-dimer, and
ferritin) predicting death at various time points (Table III). All of these biomarkers
exhibited variable predictive capacity depending on the evaluated
time point. Although serum ferritin showed statistically
significant predictive capacity at all time points, it was deemed
worthless (Table III). LDH
demonstrated poor predictive capacity in all analyses. NLR and
D-dimer showed inadequate predictive ability on admission day (AUC
0.645 and 0.692, respectively) and the second day (AUC 0.649 and
0.652, respectively), but improved to poor on the fourth day (AUC,
0.754 and 0.728, respectively). Notably, NLR significantly enhanced
its predictive capacity on days 6 and 8 of hospitalization (AUC
0.855 and 0.833, respectively), while D-dimer maintained poor
predictive capacity (AUC 0.680 and 0.787, respectively).
| Table IIIPredictive capacity of NLR, D-dimer,
ferritin, and LDH for mortality in patients with COVID-19. |
Table III
Predictive capacity of NLR, D-dimer,
ferritin, and LDH for mortality in patients with COVID-19.
| A, Day 0 |
|---|
| Index | AUC | 95% CI | P-value | Cut-off value | SEN, % | SPEC, % | PPV, % | NPV, % |
|---|
| NLR | 0.645 | 0.596-0.695 | <0.001 | 9.90 | 61.10 | 37.20 | 57.60 | 61.10 |
| Dimer-D | 0.692 | 0.611-0.772 | <0.001 | 607.00 | 66.70 | 39.00 | 55.20 | 66.70 |
| LDH | 0.710 | 0.662-0.758 | <0.001 | 355.00 | 59.10 | 29.00 | 63.80 | 59.10 |
| Ferritin | 0.586 | 0.511-0.660 | 0.024 | 634.00 | 54.10 | 44.20 | 48.20 | 54.10 |
| B, Day 2 |
| Index | AUC | 95% CI | P-value | Cut-off value | SEN, % | SPEC, % | PPV, % | NPV, % |
| NLR | 0.649 | 0.586-0.712 | <0.001 | 10.50 | 61.80 | 39.40 | 56.30 | 61.80 |
| Dimer-D | 0.652 | 0.560-0.744 | 0.001 | 699.00 | 60.00 | 40.70 | 50.00 | 60.00 |
| LDH | 0.774 | 0.695-0.854 | <0.001 | 351.00 | 68.90 | 29.20 | 66.70 | 68.90 |
| Ferritin | 0.607 | 0.518-0.696 | 0.018 | 783.00 | 53.60 | 45.20 | 46.80 | 53.60 |
| C, Day 4 |
| Index | AUC | 95% CI | P-value | Cut-off value | SEN, % | SPEC, % | PPV, % | NPV, % |
| NLR | 0.754 | 0.699-0.809 | <0.001 | 11.50 | 71.10 | 29.30 | 69.70 | 71.10 |
| Dimer-D | 0.728 | 0.644-0.812 | <0.001 | 935.00 | 66.70 | 35.20 | 63.80 | 66.70 |
| LDH | 0.794 | 0.721-0.867 | <0.001 | 345.00 | 68.00 | 24.30 | 75.00 | 68.00 |
| Ferritin | 0.653 | 0.574-0.732 | <0.001 | 665.00 | 60.20 | 39.30 | 61.50 | 60.20 |
| D, Day 6 |
| Index | AUC | 95% CI | P-value | Cut-off value | SEN, % | SPEC, % | PPV, % | NPV, % |
| NLR | 0.855 | 0.806-0.904 | <0.001 | 12.75 | 69.70 | 21.60 | 79.00 | 69.70 |
| Dimer-D | 0.680 | 0.575-0.785 | 0.001 | 1411.00 | 60.40 | 38.30 | 64.00 | 60.40 |
| LDH | 0.792 | 0.703-0.881 | <0.001 | 365.00 | 64.90 | 25.00 | 80.00 | 64.90 |
| Ferritin | 0.623 | 0.527-0.719 | 0.012 | 876.10 | 60.30 | 37.30 | 66.70 | 60.30 |
| E, Day 8 |
| Index | AUC | 95% CI | P-value | Cut-off value | SEN, % | SPEC, % | PPV, % | NPV, % |
| NLR | 0.833 | 0.768-0.898 | <0.001 | 14.14 | 68.80 | 19.70 | 82.10 | 68.80 |
| Dimer-D | 0.787 | 0.691-0.883 | <0.001 | 1610.00 | 0.706 | 23.50 | 81.80 | 70.60 |
| LDH | 0.701 | 0.594-0.809 | <0.001 | 365.50 | 60.00 | 34.20 | 73.50 | 60.00 |
| Ferritin | 0.640 | 0.539-0.742 | 0.007 | 985.90 | 62.90 | 35.80 | 67.20 | 62.90 |
Discussion
In patients hospitalized with severe and critical
COVID-19, there are variations among severity indices regarding
their ability to predict death, which may also change as the
hospital stay progresses. NEWS-2 and PSI were the best indices for
predicting death in patients hospitalized with COVID-19 from
admission to day 8, although PSI showed the best balance between
specificity and sensitivity. These results are consistent with
those previously reported by Artero et al (58) in hospitals in Spain, where it was
shown that PSI and CURB-65 were better than qSOFA and MuLBSTA at
predicting mortality in patients with COVID-19 and pneumonia, and
that PSI had the highest sensitivity (84.1%) and specificity
(72.2%). The predictive capability of PSI for hospital mortality
was similar to that in other studies (AUC, 0.77-0.85) (22,24,59).
The main drawback that has previously postulated on the PSI is the
high score assigned to comorbidity and age variables, which could
bias the risk assessment, especially if other clinically relevant
factors do not receive the same weight. This could result in an
overestimation of risk for certain patients, potentially leading to
inappropriate clinical decisions such as unnecessary
hospitalization or overly aggressive treatments (37,43),
although this does not affect its predictive capacity in
COVID-19.
The present study identified potential factors that
could enhance the sensitivity and specificity of predictive models
for mortality in patients with severe and critical COVID-19.
Longitudinal data on specific clinical markers such as NLT, or
serum levels of D-dimer, lactate dehydrogenase and ferritin
throughout the hospitalization period could assist clinicians in
evaluating patient prognosis. However, utility of these markers
varied, and they did not surpass the predictive capacity of PSI,
NEWS-2, or COVID-GRAM indices. LDH exhibited poor predictive
capacity, albeit consistent over time. Conversely, the markers
D-dimer and NLR lacked predictive utility upon admission and on the
second day, thought their predictive capacity improved from day 4
onwards. NLR, which displayed good predictive capacity on days 6
and 8 (AUC 0.855 AND 0.833, respectively). These findings align
with previous studies (10,60,61).
Additionally, integrating demographic variables such as age,
comorbidities, and vaccination status may predict prognosis for
each patient (10). Use of steroids
in the present cohort was significantly higher in patients who
survived, which may have contributed to improved prognosis,
consistent with evidence supporting the use of steroids in patients
with COVID-19, especially those requiring mechanical ventilation
(62). These insights underscore
the importance of considering temporal trends in clinical markers,
such as serum levels of D-dimer, which demonstrated increasing
predictive power for mortality as hospitalization progressed.
While NEWS-2 has shown variability in its predictive
capacity for mortality across different studies and populations,
with an AUC of 0.68 (with low sensitivity and specificity) in the
UK population, a study in the Spanish population obtained an AUC of
0.81, with moderate sensitivity and low specificity (12,47,49).
Other indices, such as qSOFA, also show notable variability in
their predictive capacity in different populations, ranging from an
AUC of 0.67 to 0.95 (22,24,58).
Therefore, there is a controversy assuming its relevance for
predicting hospital mortality for various diseases (27,51,52).
This is consistent with the results of the present report, where it
showed variability in its predictive capacity, which ranged from
worthless to good, at the different evaluation time points (AUC
0.69 to 0.89). Regarding the MuLBSTA scale, it has been considered
to have potential clinical utility for stratifying the progression
of SARS-CoV-2 disease. However, this has been established mainly in
Asian and Indian populations and in mild-to-moderate COVID-19
disease (53,63), and in a Spanish cohort of
hospitalized patients (64).
Therefore, it was relevant to extrapolate the use of this scale in
a Latin American population and to evaluate its use not only upon
hospital admission and discharge. In hospitalized Spanish patients,
the MuLBSTA scale had a poor predictive capacity (AUC 0.73) for
mortality/mechanical ventilation, with the PSI and CURB-65 indices
having better predictive capacity (64). This is consistent with the results
of the present study, where the MuLBSTA scale demonstrates that it
is capable of predicting the death of patients hospitalized with
COVID-19, but with variability depending on the evaluation time
during their hospital stay (AUC varies from 0.69 to 0.82).
COVID-GRAM had good predictive capacity at all time points with
high sensitivity (84.2-87.3%), albeit with low-to-moderate
specificity (61.5-67.6%). The above is consistent with previous
studies that report it as an index, which with a cut-off point
(≥89) similar to those found in the present work (>86), had a
very high sensitivity (97.7%), but low specificity (32.7%) for
developing critical illness (16,46).
The variability in the predictive capacity reported
for severity indices in COVID-19 may be due to differences in
characteristics of the analyzed populations, especially regarding
risk factors (comorbidity, age, vaccination status, and therapeutic
strategies), which are also reflected in the variations in the
mortality rate in different cohorts analyzed (10,23,65).
The present study was conducted in a cohort of hospitalized
patients with COVID-19 with adverse prognosis and high mortality
(45.5%, one of the highest in the world) (10) compared with other studies that had
lower mortality rates, ranging from 2.3 to 30.5% (22-24,58).
Another strength of the present study is that the predictive power
was determined at different time points. Previous reports have
generally evaluated the predictive power of indices only at
hospital admission (22-24).
The present results reveal that there are indices
whose predictive capacity remains relatively constant (COVID-GRAM,
MuLBSTA and FIB-4), increase (NEWS-2, PSI, qSOFA) or decrease
(Kirby index) as the hospital stay progresses. Each severity index
is derived from clinical parameters, which may undergo varying
degrees of change throughout hospitalization. Consequently, the
predictive efficacy of each index may fluctuate based on the
significance and temporal variability of the clinical parameters it
encompasses. In particular, the variability in the predictive
capacity of severity indices, including the decline in the
predictive power of the Kirby index over time, could be influenced
by the evolving clinical trajectory of the disease, heterogeneous
manifestations of COVID-19 and factors such as patient demographics
and treatment strategies (18).
Further research is warranted to understand the underlying
mechanisms driving these changes and to optimize integration of the
Kirby index into clinical practice for prognostication in patients
with COVID-19.
FIB-4 index was confirmed as a tool capable of
predicting mortality in patients with COVID-19, which agrees with
previous studies (20,21). Its predictive capacity remained
consistent across the evaluated periods, although it was lower (AUC
0.639-0.698) compared with that previously reported in a Taiwanese
population (AUC, 0.863) (20).
These disparities may be because these populations exhibited
significantly different mortality outcomes. For example, in the
Taiwanese cohort (n=221), the median FIB-4 on admission was 1.91,
with 4.5% of patients succumbing to the illness, while in the
present study (n=515), these values were 4.68 and 43.9%,
respectively (66).
The variations in the predictive capacity of
severity indices among patients hospitalized with severe and
critical COVID-19 underscore the complex nature of prognostication
in this population. While NEWS-2 and PSI were the most reliable
predictors of mortality, it is crucial to understand the factors
contributing to the varying performance of indices over time.
Notably, the present analysis revealed a decline in the predictive
power of Kirby index over time, which may reflect the dynamic
changes in lung function and oxygenation status during
hospitalization.
In standard ROC curve analysis, a marker is measured
at one time, assuming that the marker value (or index) remains
fixed throughout the study period. However, in practice, both the
disease state and level of prognostic biomarkers change over time
(26). During the course of a
disease, clinical status varies, making time-dependent ROC curve
analysis appropriate. A ROC curve can be generated at various time
points and the predictive capacity of the marker can be compared
(26). Therefore, the
time-dependent ROC curve is an effective tool for measuring
performance or robustness of a marker, given the changing clinical
status. The predictive capacity of a marker may weaken or
strengthen as the target time moves away from baseline. Using a
time-dependent ROC curve for an index or marker that varies over
time is most appropriate for guiding key medical decisions
(26). This is relevant in
conditions that can be highly fluctuating, such COVID-19. In
countries and hospitals with limited resources, it is key to obtain
reliable clinical severity scales and indices that allow for
effective and early medical care for patients at high risk of
mortality. Identifying the best prognostic index, particularly one
whose predictive power remains constant during hospital stay, is
key. Therefore, the results of the present study can be useful for
clinicians. There are other severity scores for community-acquired
pneumonia such as The confusion, uremia, respiratory rate, BP, age
≥65 years) and A-DROP (age, dehydration, respiratory failure,
orientation disturbance, and low blood pressure) scores, whose
predictive utility is specifically established in patients aged
>65 and 70 years, respectively, as well as in bacterial
pneumonia, with limited prognostic capacity for assessing severity
in viral infection (67-69).
One important aspect is the possibility of
simultaneously applying two or more scales during clinical course
to assess their condition and guide treatment. While certain scales
may not be effective at certain stages, they may provide valuable
clinical insights for future considerations. This approach allows
for a more comprehensive evaluation of the patient progression and
enables clinicians to adapt treatment strategies, leveraging the
strengths of different scales to optimize patient care over time.
ROC curve provides a valuable tool for evaluating and enhancing
performance of assessment scales. Strategies to improve scales may
include incorporating new biomarkers, refining inclusion criteria,
external validation, optimizing cutoff points and considering
confounding factors. These strategies can enhance accuracy and
reliability of scales, resulting in more effective and personalized
clinical decision-making. However, one aspect that must be
considered when the various predictive scales are used for clinical
purposes is that currently there is no standard definition of high,
moderate, or low specificity and/or sensitivity. Although this
stratification has been used in various contexts (70,71),
its interpretation depends on the clinical context and the specific
disease or condition (57).
In conclusion, in hospitalized patients with
COVID-19 and a high mortality rate, NEWS-2 scale has the best
predictive power; it has high sensitivity but low specificity,
indicating that it is unlikely to give a false negative result.
Therefore, it would identify patients who are likely to die, but it
would also inform patients who will not die of this possibility.
NEWS-2 (a test with high sensitivity) can be useful for ruling out
(with good certainty) the possibility of death if a person has a
negative result. On the other hand, PSI also has good to excellent
predictive capacity, but additionally has a more balanced
sensitivity and specificity (high and moderate, respectively),
making it a useful and practical indicator for clinical use.
Additionally, in hospitalized patients with COVID-19, where the
disease and severity indices can be variable, using time-dependent
ROC curves is an effective tool for measuring predictive
performance of various indices. NEWS-2 and PSI indices were the
most robust instruments for predicting patient death throughout
hospital stay.
Supplementary Material
Scoring parameters for predicting
mortality and severity in patients with Coronavirus Disease 2019
for Pneumonia severity index.
Scoring parameters for predicting
mortality and severity in patients with Coronavirus Disease 2019
(COVID-19) for Kirby index.
Scoring parameters for predicting
mortality and severity in patients with Coronavirus Disease 2019
for Critical Illness Risk Score.
Scoring parameters for predicting
mortality and severity in patients with Coronavirus Disease 2019
for National Early Warning Score (NEWS-2).
Scoring parameters for predicting
mortality and severity in patients with Coronavirus | Disease 2019
for the quick Sequential Organ Failure Assessment score.
Scoring parameters for predicting
mortality and severity in patients with Coronavirus Disease 2019
(COVID-19) for the Viral Pneumonia Mortality Score.
Scoring parameters for predicting
mortality and severity in patients with Coronavirus Disease 2019
for Fibrosis-4.
Acknowledgements
The authors would like to thank Professor Julio V.
Barrios Nuñez from University of Colima (Colima, Mexico) for
assistance with English language editing.
Funding
Funding: The present study was supported by the National Council
of Humanities, Sciences, and Technologies (grant no. 319282; Call
for Frontier Science, Modality: Paradigms and Controversies of
Science).
Availability of data and materials
The data generated in the present study may be
requested from the corresponding author.
Authors' contributions
MAMH and IDE conceived and designed the study. MAMH,
FRL, JGE, MICR and LDLZ reviewed the literature and collected
patient information. IDE, GAHF, MLMF, BTH and HODL performed the
statistical analysis. CASR, IPRS, MFM and KSM participated in the
analysis/interpretation of the results, in addition to writing the
manuscript. All authors revised the manuscript. All authors have
read and approved the final manuscript. All authors confirm the
authenticity of all the raw data.
Ethics approval and consent to
participate
The present study was conducted in accordance with
the Declaration of Helsinki and approved by the local health
research committee of General Hospital Number 1 of IMSS-Colima,
Mexico (approval no. R-2021-601-014, June 30, 2021). Following
national legislation and institutional protocols, the requirement
for written consent was waived.
Patient consent for publication
Not applicable.
Competing interests
The authors declare that they have no competing
interests.
Authors' information
Martha A. Mendoza-Hernandez, ORCID no.
0000-0002-7646-0842
Gustavo A. Hernandez-Fuentes, ORCID no.
0000-0003-4685-3095
Carmen A. Sanchez-Ramirez, ORCID no.
0000-0002-3525-7821
Fabian Rojas-Larios, ORCID no.
0000-0003-1744-9173
Jose Guzman-Esquivel, ORCID no.
0000-0002-6727-0051
Iram P. Rodriguez-Sanchez, ORCID no.
0000-0002-5988-4168
Margarita L. Martinez-Fierro, ORCID no.
0000-0003-1478-9068
Martha I Cardenas-Rojas, ORCID no.
0000-0001-7117-5922
Luis De-Leon-Zaragoza, ORCID no.
0000-0003-3753-7541
Benjamin Trujillo-Hernandez, ORCID no.
0000-0001-8306-0137
Mercedes Fuentes-Murguia, ORCID no.
0000-0001-9632-7953
Héctor Ochoa-Díaz-López, ORCID no.
0000-0002-8421-4983
Karmina Sánchez-Meza, ORCID no.
0000-0002-8702-0252
Ivan Delgado-Enciso, ORCID no.
0000-0001-9848-862X
References
|
1
|
Barbero MG: ¿Como ha afectado la COVID- 19
al sistema sanitario y la formación de los médicos y que hemos
aprendido? Educación Médica. 22:S1–S2. 2021.
|
|
2
|
Pan American Health Organization:
Epidemiological update: SARS-CoV-2 and other respiratory viruses in
the Americas Region-8 January 2024., 2024.
|
|
3
|
Delgado-Enciso I, Paz-Garcia J,
Barajas-Saucedo CE, Mokay-Ramírez KA, Meza-Robles C, Lopez-Flores
R, Delgado-Machuca M, Murillo-Zamora E, Toscano-Velazquez JA,
Delgado-Enciso J, et al: Safety and efficacy of a COVID-19
treatment with nebulized and/or intravenous neutral electrolyzed
saline combined with usual medical care vs. usual medical care
alone: A randomized, open-label, controlled trial. Exp Ther Med.
22(915)2021.PubMed/NCBI View Article : Google Scholar
|
|
4
|
Mascellino MT, Di Timoteo F, De Angelis M
and Oliva A: Overview of the main anti-SARS-CoV-2 vaccines:
Mechanism of action, efficacy and safety. Infect Drug Resist.
14:3459–3476. 2021.PubMed/NCBI View Article : Google Scholar
|
|
5
|
Havers FP, Pham H, Taylor CA, Whitaker M,
Patel K, Anglin O, Kambhampati AK, Milucky J, Zell E, Moline HL, et
al: COVID-19-associated hospitalizations among vaccinated and
unvaccinated adults 18 years or older in 13 US States, January 2021
to April 2022. JAMA Intern Med. 182:1071–1081. 2022.PubMed/NCBI View Article : Google Scholar
|
|
6
|
Chang D, Chang X, He Y and Tan KJK: The
determinants of COVID-19 morbidity and mortality across countries.
Sci Rep. 12(5888)2022.PubMed/NCBI View Article : Google Scholar
|
|
7
|
Abate SM, Checkol YA and Mantefardo B:
Global prevalence and determinants of mortality among patients with
COVID-19: A systematic review and meta-analysis. Ann Med Surg
(Lond). 64(102204)2021.PubMed/NCBI View Article : Google Scholar
|
|
8
|
Gray WK, Navaratnam AV, Day J, Wendon J
and Briggs TWR: COVID-19 hospital activity and in-hospital
mortality during the first and second waves of the pandemic in
England: An observational study. Thorax. 77:1113–1120.
2022.PubMed/NCBI View Article : Google Scholar
|
|
9
|
de Jesus Ascencio-Montiel I, Ovalle-Luna
OD, Rascón-Pacheco RA, Borja-Aburto VH and Chowell G: Comparative
epidemiology of five waves of COVID-19 in Mexico, March 2020-August
2022. BMC Infect Dis. 22(813)2022.PubMed/NCBI View Article : Google Scholar
|
|
10
|
Mendoza-Hernandez MA, Guzman-Esquivel J,
Ramos-Rojas MA, Santillan-Luna VV, Sanchez-Ramirez CA,
Hernandez-Fuentes GA, Diaz-Martinez J, Melnikov V, Rojas-Larios F,
Martinez-Fierro ML, et al: Differences in the evolution of
clinical, biochemical, and hematological indicators in hospitalized
patients with COVID-19 according to their vaccination scheme: A
cohort study in one of the world's highest hospital mortality
populations. Vaccines (Basel). 12(72)2024.PubMed/NCBI View Article : Google Scholar
|
|
11
|
COVID-19 Tablero
México-CONACYT-CentroGeo-GeoInt-DataLab.
|
|
12
|
Myrstad M, Ihle-Hansen H, Tveita AA,
Andersen EL, Nygård S, Tveit A and Berge T: National early warning
score 2 (NEWS2) on admission predicts severe disease and
in-hospital mortality from Covid-19-a prospective cohort study.
Scand J Trauma Resusc Emerg Med. 28(66)2020.PubMed/NCBI View Article : Google Scholar
|
|
13
|
De Socio GV, Gidari A, Sicari F, Palumbo M
and Francisci D: National early warning score 2 (NEWS2) better
predicts critical Coronavirus Disease 2019 (COVID-19) illness than
COVID-GRAM, a multi-centre study. Infection. 49:1033–1038.
2021.PubMed/NCBI View Article : Google Scholar
|
|
14
|
Heldt S, Neuböck M, Kainzbauer N, Shao G,
Tschoellitsch T, Duenser M, Kaiser B, Winkler M, Para C, Meier J,
et al: qSOFA score poorly predicts critical progression in COVID-19
patients. Wien Med Wochenschr. 172:211–219. 2022.PubMed/NCBI View Article : Google Scholar
|
|
15
|
Alanís-Naranjo JM, Anguiano-Álvarez VM,
Hammeken-Larrondo EF and Olguín-Contreras G: Desempeño de PSI/PORT
y SOFA para predicción de ventilación mecánica invasiva en neumonía
por SARS-CoV-2. Med Crít. 36:155–160. 2022.
|
|
16
|
Moreno-Pérez Ó, Andrés M, León-Ramirez JM,
Sánchez-Payá J, Boix V, Gil J and Merino E: The COVID-GRAM tool for
patients hospitalized with COVID-19 in Europe. JAMA Intern Med.
181(1000)2021.PubMed/NCBI View Article : Google Scholar
|
|
17
|
George R, Mehta AA, Paul T, Sathyapalan
DT, Haridas N, Kunoor A and Ravindran GC: Validation of MuLBSTA
score to derive modified MuLB score as mortality risk prediction in
COVID-19 infection. PLoS Glob Public Health.
2(e0000511)2022.PubMed/NCBI View Article : Google Scholar
|
|
18
|
Sandoval-Gutiérrez JL: A 40 años de la
descripción del índice de Kirby (PaO2/FiO2). Med Intensiva.
39(521)2015.PubMed/NCBI View Article : Google Scholar : (In Spanish).
|
|
19
|
García-Pereña L, Sesma VR, Divieso ML,
Carrascosa AL, Fuentes SV and Parra-Ruiz J: Beneficio del empleo
precoz de la oxigenoterapia nasal de alto flujo (ONAF) en pacientes
con neumonía por SARS-CoV-2. Med Clin (Barc). 158:540–542.
2022.PubMed/NCBI View Article : Google Scholar : (In English,
Spanish).
|
|
20
|
Liu CY, Chou SF, Chiang PY, Sun JT, Tsai
KC, Jaw FS, Chang CT, Fan CM, Wu YH, Lee PY, et al: The FIB-4
scores in the emergency department to predict the outcomes of
COVID-19 patients in Taiwan. Heliyon. 10(e25649)2024.PubMed/NCBI View Article : Google Scholar
|
|
21
|
Schreiner AD, Moran WP, Zhang J,
Livingston S, Marsden J, Mauldin PD, Koch D and Gebregziabher M:
The association of fibrosis-4 index scores with severe liver
outcomes in primary care. J Gen Intern Med. 37:3266–3274.
2022.PubMed/NCBI View Article : Google Scholar
|
|
22
|
Fan G, Tu C, Zhou F, Liu Z, Wang Y, Song
B, Gu X, Wang Y, Wei Y, Li H, et al: Comparison of severity scores
for COVID-19 patients with pneumonia: A retrospective study. Eur
Respir J. 56(2002113)2020.PubMed/NCBI View Article : Google Scholar
|
|
23
|
Sheerin T, Dwivedi P, Hussain A and
Sivayoham N: Performance of the CURB65, NEWS2, qSOFA, SOFA, REDS,
ISARIC 4C, PRIEST and the novel COVID-19 severity scores, used to
risk-stratify emergency department patients with COVID-19, on
mortality-an observational cohort study. COVID. 3:555–566.
2023.
|
|
24
|
Ahnert P, Creutz P, Horn K,
Schwarzenberger F, Kiehntopf M, Hossain H, Bauer M, Brunkhorst FM,
Reinhart K, Völker U, et al: Sequential organ failure assessment
score is an excellent operationalization of disease severity of
adult patients with hospitalized community acquired
pneumonia-results from the prospective observational PROGRESS
study. Crit Care. 23(110)2019.PubMed/NCBI View Article : Google Scholar
|
|
25
|
Becerra-Muñoz VM, Núñez-Gil IJ, Eid CM,
Aguado MG, Romero R, Huang J, Mulet A, Ugo F, Rametta F, Liebetrau
C, et al: Clinical profile and predictors of in-hospital mortality
among older patients hospitalised for COVID-19. Age Ageing.
50:326–334. 2021.PubMed/NCBI View Article : Google Scholar
|
|
26
|
Kamarudin AN, Cox T and Kolamunnage-Dona
R: Time-dependent ROC curve analysis in medical research: Current
methods and applications. BMC Med Res Methodol.
17(53)2017.PubMed/NCBI View Article : Google Scholar
|
|
27
|
Goulden R, Hoyle MC, Monis J, Railton D,
Riley V, Martin P, Martina R and Nsutebu E: qSOFA, SIRS and NEWS
for predicting inhospital mortality and ICU admission in emergency
admissions treated as sepsis. Emerg Med J. 35:345–349.
2018.PubMed/NCBI View Article : Google Scholar
|
|
28
|
Shahsavarinia K, Moharramzadeh P, Arvanagi
RJ and Mahmoodpoor A: qSOFA score for prediction of sepsis outcome
in emergency department. Pak J Med Sci. 36:668–672. 2020.PubMed/NCBI View Article : Google Scholar
|
|
29
|
Xinxin Z: MuLBSTA score for viral
pneumonia mortality. MDCalc, 2020.
|
|
30
|
World Health Organization (WHO): Clinical
Management of COVID-19: Evolving Guidelines. WHO, Geneva, 2021.
|
|
31
|
United Mexican States - Ministry of
Health: Regulations of the General Health Law concerning Health
Research. Official Gazette of the Federation: 1-31, 1987.
|
|
32
|
Miranda-Novales MG and Villasís-Keever MÁ:
El protocolo de investigación VIII. La ética de la investigación en
seres humanos. Rev Alerg Mex. 66:115–122. 2019.PubMed/NCBI View Article : Google Scholar : (In Spanish).
|
|
33
|
Charlson ME, Carrozzino D, Guidi J and
Patierno C: Charlson Comorbidity index: A critical review of
clinimetric properties. Psychother Psychosom. 91:8–35.
2022.PubMed/NCBI View Article : Google Scholar
|
|
34
|
National Center for Health Statistics:
National Center for Health Statistics (NCHS) C for DC and P (CDC):
Glossary. National Health Interview Survey, 2017.
|
|
35
|
Delgado-Enciso I, Gonzalez-Hernandez NA,
Baltazar-Rodriguez LM, Millan-Guerrero RO, Newton-Sanchez O,
Bayardo-Noriega A, Aleman-Mireles A, Enriquez-Maldonado IG,
Anaya-Carrillo MJ, Rojas-Martinez A and Ortiz-Lopez R: Association
of matrix metalloproteinase-2 gene promoter polymorphism with
myocardial infarction susceptibility in a Mexican population. J
Genet. 88:249–252. 2009.PubMed/NCBI View Article : Google Scholar
|
|
36
|
James PA, Oparil S, Carter BL, Cushman WC,
Dennison-Himmelfarb C, Handler J, Lackland DT, LeFevre ML,
MacKenzie TD, Ogedegbe O, et al: 2014 evidence-based guideline for
the management of high blood pressure in adults. JAMA. 311:507–520.
2014.PubMed/NCBI View Article : Google Scholar
|
|
37
|
Jonathan B, Cilloniz C and Torres A:
Community-acquired pneumonia (non COVID-19). BMJ Best Practice,
2023.
|
|
38
|
ARDS Definition Task Force. Ranieri VM,
Rubenfeld GD, Thompson BT, Ferguson ND, Caldwell E, Fan E,
Camporota L and Slutsky AS: Acute respiratory distress syndrome:
The Berlin definition. JAMA. 307:2526–2533. 2012.PubMed/NCBI View Article : Google Scholar
|
|
39
|
Bucci T, Galardo G, Gandini O, Vicario T,
Paganelli C, Cerretti S, Bucci C, Pugliese F and Pastori D:
Research On Medical patients Admitted to the Emergency Department
(ROMA-ED) study group. Fibrosis-4 (FIB-4) index and mortality in
COVID-19 patients admitted to the emergency department. Intern
Emerg Med. 17:1777–1784. 2022.PubMed/NCBI View Article : Google Scholar
|
|
40
|
Kuma A, Mafune K, Uchino B, Ochiai Y,
Miyamoto T and Kato A: Potential link between high FIB-4 score and
chronic kidney disease in metabolically healthy men. Sci Rep.
12(16638)2022.PubMed/NCBI View Article : Google Scholar
|
|
41
|
DeLaney M and Khoury C: Community-acquired
pneumonia in the emergency department. Emerg Med Pract. 23:1–24.
2021.PubMed/NCBI
|
|
42
|
Wang D, Willis DR and Yih Y: The pneumonia
severity index: Assessment and comparison to popular machine
learning classifiers. Int J Med Inform. 163(104778)2022.PubMed/NCBI View Article : Google Scholar
|
|
43
|
Fine MJ, Auble TE, Yealy DM, Hanusa BH,
Weissfeld LA, Singer DE, Coley CM, Marrie TJ and Kapoor WN: A
prediction rule to identify low-risk patients with
community-acquired pneumonia. N Engl J Med. 336:243–250.
1997.PubMed/NCBI View Article : Google Scholar
|
|
44
|
Morales-Aguirre AM, Márquez-González H,
Salazar-Rosales H, Álvarez-Valencia JL, Muñoz-Ramírez CM and
Zárate-Castañón P: Cociente PaO2/FiO2 o índice de Kirby:
Determinación y uso en población pediátrica. Residente. 10:88–92.
2015.
|
|
45
|
QxMD Software Inc: COVID-GRAM critical
Illness risk score-MDCalc. Medscape, 2020.
|
|
46
|
Liang W, Liang H, Ou L, Chen B, Chen A, Li
C, Li Y, Guan W, Sang L, Lu J, et al: Development and validation of
a clinical risk score to predict the occurrence of critical illness
in hospitalized patients with COVID-19. JAMA Intern Med.
180:1081–1089. 2020.PubMed/NCBI View Article : Google Scholar
|
|
47
|
Gary BS: National early warning score
(NEWS) 2. MDCalc, 2020.
|
|
48
|
Teasdale G, Murray G, Parker L and Jennett
B: Adding up the glasgow coma score. In: Proceedings of the 6th
European Congress of Neurosurgery. Springer Vienna, Vienna,
pp13-16, 1979.
|
|
49
|
Smith GB, Redfern OC, Pimentel MA, Gerry
S, Collins GS, Malycha J, Prytherch D, Schmidt PE and Watkinson PJ:
The national early warning score 2 (NEWS2). Clin Med (Lond).
19(260)2019.PubMed/NCBI View Article : Google Scholar
|
|
50
|
Royal College of Physicians: Royal College
of physicians. National early warning score (NEWS) 2: Standardising
the assessment of acute-illness severity in the NHS. Updated report
of a working party. London: RCP. London, 2017.
|
|
51
|
Ferreira M, Blin T, Collercandy N,
Szychowiak P, Dequin PF, Jouan Y and Guillon A: Critically ill
SARS-CoV-2-infected patients are not stratified as sepsis by the
qSOFA. Ann Intensive Care. 10(43)2020.PubMed/NCBI View Article : Google Scholar
|
|
52
|
Seymour CW, Liu VX, Iwashyna TJ,
Brunkhorst FM, Rea TD, Scherag A, Rubenfeld G, Kahn JM,
Shankar-Hari M, Singer M, et al: Assessment of clinical criteria
for sepsis: For the third international consensus definitions for
sepsis and septic shock (Sepsis-3). JAMA. 315:762–774.
2016.PubMed/NCBI View Article : Google Scholar
|
|
53
|
Guo L, Wei D, Zhang X, Wu Y, Li Q, Zhou M
and Qu J: Clinical features predicting mortality risk in patients
with viral Pneumonia: The MuLBSTA score. Front Microbiol.
10(2752)2019.PubMed/NCBI View Article : Google Scholar
|
|
54
|
Polo TCF and Miot HA: Aplicações da curva
ROC em estudos clínicos e experimentais. J Vasc Bras.
19(e20200186)2020.
|
|
55
|
Safari S, Baratloo A, Elfil M and Negida
A: Evidence based emergency medicine; part 5 receiver operating
curve and area under the curve. Emerg (Tehran). 4:111–113.
2016.PubMed/NCBI
|
|
56
|
Unal I: Defining an optimal cut-point
value in ROC analysis: An alternative approach. Comput Math Methods
Med. 2017:1–14. 2017.PubMed/NCBI View Article : Google Scholar
|
|
57
|
Evans HJ, Gibson NA, Bennett J, Chan SY,
Gavlak J, Harman K, Ismail-Koch H, Kingshott RN, Langley R, Morley
A, et al: British thoracic society guideline for diagnosing and
monitoring paediatric sleep-disordered breathing. Thorax.
78:s1–s27. 2023.PubMed/NCBI View Article : Google Scholar
|
|
58
|
Artero A, Madrazo M, Fernández-Garcés M,
Miguez AM, García AG, Vieitez AC, Guijarro EC, Aizpuru EM, Gómez
MG, Manrique MA, et al: Severity scores in COVID-19 pneumonia: A
multicenter, retrospective, cohort study. J Gen Intern Med.
36:1338–1345. 2021.PubMed/NCBI View Article : Google Scholar
|
|
59
|
Asai N, Watanabe H, Shiota A, Kato H,
Sakanashi D, Hagihara M, Koizumi Y, Yamagishi Y, Suematsu H and
Mikamo H: Efficacy and accuracy of qSOFA and SOFA scores as
prognostic tools for community-acquired and healthcare-associated
pneumonia. Int J Infect Dis. 84:89–96. 2019.PubMed/NCBI View Article : Google Scholar
|
|
60
|
Toori KU, Qureshi MA, Chaudhry A and
Safdar MF: Neutrophil to lymphocyte ratio (NLR) in COVID-19: A
cheap prognostic marker in a resource constraint setting. Pak J Med
Sci. 37:1435–1439. 2021.PubMed/NCBI View Article : Google Scholar
|
|
61
|
Ulloque-Badaracco JR, Salas-Tello W,
Al-kassab-Córdova A, Alarcón-Braga EA, Benites-Zapata VA, Maguiña
JL and Hernandez AV: Prognostic value of neutrophil-to-lymphocyte
ratio in COVID-19 patients: A systematic review and meta-analysis.
Int J Clin Pract. 75(e14596)2021.PubMed/NCBI View Article : Google Scholar
|
|
62
|
Pasin L, Navalesi P, Zangrillo A, Kuzovlev
A, Likhvantsev V, Hajjar LA, Fresilli S, Lacerda MVG and Landoni G:
Corticosteroids for patients with coronavirus disease 2019
(COVID-19) with different disease severity: A meta-analysis of
randomized clinical trials. J Cardiothorac Vasc Anesth. 35:578–584.
2021.PubMed/NCBI View Article : Google Scholar
|
|
63
|
Preetam M and Anurag A: MuLBSTA score in
COVID-19 pneumonia and prediction of 14.day mortality risk: A study
in an Indian cohort. J Family Med Prim Care. 10:223–227.
2021.PubMed/NCBI View Article : Google Scholar
|
|
64
|
Micó-Gandia J, Pina-Belmonte A,
Aguilera-Ayllón A, Carmona-Martín M, Piles-Roger L, Martínez-Reig M
and Artero-Mora M: CO-121-MULBSTA, PSI y CURB65, predicción de
pronóstico en pacientes con COVID-19. Rev Clin Esp. 1(221)2021.(In
Spanish).
|
|
65
|
Schumacher AE, Kyu HH, Aali A, Abbafati C,
Abbas J, Abbasgholizadeh R, Abbasi MA, Abbasian M, Abd ElHafeez S,
Abdelmasseh M, et al: Global age-sex-specific mortality, life
expectancy, and population estimates in 204 countries and
territories and 811 subnational locations, 1950-2021, and the
impact of the COVID-19 pandemic: A comprehensive demographic
analysis for the global burden of disease study 2021. Lancet.
8:S0140–S6736. 2024.PubMed/NCBI View Article : Google Scholar
|
|
66
|
Ruggeri P and Esquinas A: Fibrosis-4
(FIB-4) index and mortality in COVID-19 patients admitted to the
emergency department: a new interesting predictive index for
patients with COVID-19 disease? Intern Emerg Med. 17:2451–2452.
2022.PubMed/NCBI View Article : Google Scholar
|
|
67
|
Estella A: Usefulness of CURB-65 and
pneumonia severity index for influenza A H1N1v pneumonia. Monaldi
Arch Chest Dis. 77:118–121. 2015.
|
|
68
|
Armiñanzas C, de Las Revillas FA, Cuadra
MG, Arnaiz A, Sampedro MF, González-Rico C, Ferrer D, Mora V,
Suberviola B, Latorre M, et al: Usefulness of the COVID-GRAM and
CURB-65 scores for predicting severity in patients with COVID-19.
Int J Infect Dis. 108:282–288. 2021.PubMed/NCBI View Article : Google Scholar
|
|
69
|
Ahn JH and Choi EY: Expanded A-DROP score:
A new scoring system for the prediction of mortality in
hospitalized patients with community-acquired pneumonia. Sci Rep.
8(14588)2018.PubMed/NCBI View Article : Google Scholar
|
|
70
|
Power L, Mullally D, Gibney ER, Clarke M,
Visser M, Volkert D, Bardon L, de van der Schueren MAE and Corish
CA: MaNuEL Consortium. A review of the validity of malnutrition
screening tools used in older adults in community and healthcare
settings-A MaNuEL study. Clin Nutr ESPEN. 24:1–13. 2018.PubMed/NCBI View Article : Google Scholar
|
|
71
|
Ranganathan P and Aggarwal R: Common
pitfalls in statistical analysis: Understanding the properties of
diagnostic tests-Part 1. Perspect Clin Res. 9:40–43.
2018.PubMed/NCBI View Article : Google Scholar
|