Introduction
Head and neck squamous cell carcinoma (HNSCC) has a
high therapeutic failure rate, resulting in low 5-year survival
rate (1). Alterations in
metabolism, especially glycolysis, in cancer cells have been
investigated to determine their potential as a cancer therapy
target (2). Changes in glycolysis
and associated signaling pathways has been associated with
chemoresistance in various types of cancer (3).
Glycolysis is a key metabolic pathway in cancer
cells that provides sufficient ATP, nucleotides, lipids, and amino
acids for high tumor cell proliferation under aerobic conditions
that contribute to tumor progression; this phenomenon is called the
‘Warburg effect’ (4). One of the
hallmarks of cancer is a high glycolytic rate in cancer cells that
is characterized by two key biochemical steps: Increased glucose
uptake and conversion of glucose into lactate. The increased
glucose uptake in cancer cells is facilitated by upregulating
expression of glucose transporters (GLUTs) (5). GLUTs are a transmembrane protein
family that is sub-divided into three phylogenetically distinct
classes. Class 1 (GLUT1, 2, 3 and 4) has been extensively studied
in mammalian cells (6,7). GLUT1 has a high affinity for glucose
and is highly expressed in normal cells, including erythrocytes and
endothelial cells, and overexpressed in breast (8), gastric (9), colorectal (10) and prostate (11) cancer. Moreover, GLUT1 upregulation
is significantly associated with poorly differentiated cancer,
positive lymph node metastasis, increased tumor size and worse
overall and disease-free survival in patients with various types of
cancers, such as gastric, colorectal, breast, pancreatic, liver,
lung, ovarian and oral cancer (12). GLUT3 is primarily expressed in the
nervous system and has a higher affinity for glucose than
GLUT1(13). GLUT3 is overexpressed
in glioblastoma (14) and gastric
(15) and non-small cell lung
cancer (16). GLUT2 is
constitutively expressed in the intestinal absorptive epithelial
cells, hepatocytes and pancreatic β and kidney cells (17). GLUT2 is overexpressed in
hepatocellular carcinoma cells (18) and colorectal cancer (19). GLUT4 is present in insulin-sensitive
tissue, including adipose, heart and skeletal muscle. However, the
expression of GLUT4 varies in ovarian and renal cancer (5).
Hexokinases (HKs), phosphofructokinase (PFK) and
pyruvate kinase are rate-limiting enzymes in glycolysis and play
important roles in catalyzing conversion of glucose to lactate
(20). Increased activity of these
glycolytic enzymes and upregulated lactate production are
associated with tumor progression, such as tumor growth,
chemoresistance and metastasis (21).
Nitric oxide (NO), a free radical that is highly
reactive and diffusible, exhibits dual roles in the physiological
maintenance and pathology of disease, including cancer (22). High NO levels cause nitrosative
stress that affects homeostasis and alters protein function
(23). Depending on the cancer type
and NO concentration, NO modulates different aspects of cancer
aggressiveness, including angiogenesis, apoptosis, cell cycle,
invasion and metastasis (24). A
high NO concentration induces HNSCC cell adaptability, such as
survival, invasion and autophagy enhancement (25,26).
To the best of our knowledge, there is limited
information on the effect of NO on glycolysis in cancer cells. In
ovarian cancer, low NO concentration (≤100 nM) promote glycolysis,
resulting in ATP production, oxidative defense and cell
proliferation, whereas high NO concentration (≥500 nM) inhibits
glycolysis and tumor progression (27). Based on the aforementioned roles of
NO on tumor progression in HNSCC, it was hypothesized that NO might
drive these tumorigenic behaviors via its effects on glycolysis. To
the best of our knowledge, however, there is no evidence of the
effect of NO on glycolysis in HNSCC. Therefore, the aim of the
present study was to investigate the effects of NO on HNSCC cell
proliferation and glycolytic intermediates including GLUT1-4
gene expression, HK activity and lactate production.
Materials and methods
Cell culture
The isogenic primary and metastatic HNSCC cell lines
were from the same patient and were initially established by
Cardinali et al (28) and
provided by Professor Silvio Gutkind (Moores Cancer Center,
Department of Pharmacology, UC San Diego, USA). HN18 cells were
obtained from primary tongue lesions and the HN17 cells were
isolated from neck dissections (T2N2M0 stage). HN30 cells were
obtained from primary pharynx lesions and HN31 cells were isolated
from lymph node metastases (T3N1M0 stage). The cells were cultured
in DMEM (Invitrogen; Thermo Fisher Scientific, Inc.) supplemented
with 10% fetal bovine serum (Invitrogen; Thermo Fisher Scientific,
Inc.), 100 U/ml penicillin and 100 µg/ml streptomycin at 37˚C in a
5% CO2 atmosphere.
MTT assay
HNSCC cell lines were cultured in 96-well plates
(2,000 cells/well) at 37˚C for 24 h. Based on preliminary
experiments (data not shown), diethylamine NONOate(DEA-NONOate)
concentrations that affected the mean % cell proliferation within
the 95% confidence interval were selected for investigation of the
proliferative effect on each cell line in the present study. NO
donor, DEA-NONOate (Sigma-Aldrich; Merck KGaA) concentrations 0.5,
5.0, 100.0 and 500.0 µM were selected to treat HN18 cells and 0.5,
10.0, 100.0 and 500.0 µM were selected to treat HN17, 30 and 31
cells at 37˚C for 72 h.
The minimum concentration that generated the highest
cell proliferation was used as the effective dose for each cell
line in subsequent experiments. The effective doses of 0.5, 10.0
and 100.0 µM DEA-NONOate were used to treat HN18 and HN17, HN30 and
HN31 cells, respectively, at 37˚C for 24, 48 and 72 h. Cells in
DMEM without DEA-NONOate served as control. The cell proliferation
in each group was determined using MTT (Sigma-Aldrich; Merck KGaA)
assay as previously described (29). Three independent experiments were
performed.
NO determination
HNSCC cell lines were cultured and treated as
aforementioned. The conditioned media from each condition was
collected and stored at -80˚C until analysis. NO secretion was
determined using the Griess Reagent System (Promega Corporation)
per the manufacturer's instructions. Three separate experiments
were conducted.
Reverse transcription-quantitative
(RT-q)PCR
HNSCC cells were seeded in 6-well plates (200,000
cells/well) at 37˚C for 24 h. The HN18 and HN17, HN30 and HN31
cells were treated with 0.5, 10.0 and 100.0 µM DEA-NONOate,
respectively, at 37˚C for 2 h. Total RNA was extracted using TRIzol
(Invitrogen; Thermo Fisher Scientific, Inc.). The total RNA was
converted into complementary DNA using a PrimeScript 1st strand
cDNA Synthesis kit (Takara Bio, Inc.) per the manufacturer's
instructions. The relative GLUT1, 2, 3 and 4 mRNA expression
levels were determined using the KAPA SYBR® FAST qPCR Kit Master
Mix (Kapa Biosystems) in the QuantStudio™ 3 Real-Time PCR System
(Thermo Fisher Scientific, Inc.). The primers were designed by
Primer-BLAST online (National Center for Biotechnology Information;
ncbi.nlm.nih.gov/tools/primer-blast/; Table I). The thermocycling conditions were
as follows: Initial denaturation at 95˚C for 10 min, followed by 40
cycles of denaturation at 95˚C for 15 sec and annealing at 60˚C for
60 sec. The constitutive expression was calculated using the
2-ΔCq equation (30).
β-actin was used as a housekeeping gene. ΔCq was calculated
as GLUT Cq-β-actin Cq. The percentage of GLUT
expression in each cell line was calculated as follows: GLUT
expression (%)=[(mean 2-ΔCq of GLUT)/(total
2-ΔCq of GLUTs)] x100. To determine
DEA-NONOate-induced GLUT expression in HNSCC cell lines, the
relative expression of each GLUT was evaluated using the
2-ΔΔCq method (30) as
follows: ΔCq=Cq (treated cells)-Cq (untreated cells). Three
independent experiments were conducted.
 | Table IPrimer sequences for reverse
transcription-quantitative PCR. |
Table I
Primer sequences for reverse
transcription-quantitative PCR.
| Gene | Forward primer,
5'→3' | Reverse primer,
5'→3' | Product size,
bp | Accession no. |
|---|
| GLUT1 |
TGGCATCAACGCTGTCTTCT |
AACAGCGACACGACAGTGAA | 123 | NM_006516.4 |
| GLUT2 |
GCCACACTCACACAAGACCT |
AACTGGAAGGAACCCAGCAC | 119 | NM_000340.2 |
| GLUT3 |
AGCTATCAAGTGTGCTTTAGCTTG |
AAATGGGACCCTGCCTTACTG | 100 | NM_006931.3 |
| GLUT4 |
TCTCCAACTGGACGAGCAAC |
CAGCAGGAGGACCGCAAATA | 101 | NM_001042.3 |
| β-actin |
CTCACCATGGATGATGATATCGC |
ATAGGAATCCTTCTGACCCATGC | 165 | NM_001101.5 |
Lactate quantification
Cells were cultured in 25-cm2 flasks at a
density of 100,000 cells/ml for 24 h and treated as aforementioned.
The cell suspension was centrifuged at 13,000 x g, 4˚C for 5 min to
collect cell pellets. The cell pellets (1x10⁶ cells)
were collected and homogenized in 50 µl Lactate Assay buffer.
Lactate Assay kit (cat. no. #MAK064; Sigma-Aldrich; Merck KGaA) was
used for the lactate production test according to the
manufacturer's instructions. Three independent experiments were
performed.
HK activity evaluation
The cells were cultured in 25-cm2 flasks
at a density of 100,000 cells/ml at 37˚C for 24 h and treated as
aforementioned. The cell pellets (1x10⁶ cells) were
collected by centrifugation at 13,000 x g, 4˚C for 5 min and
homogenized in 100 µl ice-cold HK Assay buffer (Hexokinase
Colorimetric Assay kit; cat. no. #MAK091; Sigma-Aldrich; Merck
KGaA) according to the manufacturer's instructions. HK activity was
determined by its oxidized product (NADH). The samples were
measured at an absorbance of 450 nm at the initial time
[T(A450)initial] in a MULTISKAN Sky
microplate reader (Thermo Fisher Scientific, Inc.). The plates were
then incubated at room temperature, and measurements were taken
every 5 min for 30 min. A450 at 30 min was defined as
final time [T(A450)final]. The change in the
measurement from Tinitial to Tfinal for each
sample (ΔA450) was calculated as follows:
ΔA450=(A450)final-(A450)initial.
The amount of NADH generated between
Tinitial and Tfinal was determined by
comparing the ΔA450 of each sample to a standard curve.
HK activity of each sample was determined as follows: HK
activity=[NADH x dilution
factor/(Tfinal-Tinitial) x sample volume].
Three independent experiments were performed.
Statistical analysis
All data are presented as the mean ± SEM from three
independent experiments. Multiple group comparisons were performed
using one-way ANOVA followed by Tukey's post hoc test. Unpaired t
test was applied to compare two independent groups. The statistical
analyses were performed using Prism GraphPad 9.0 software (GraphPad
Software, Inc.; Dotmatics). P≤0.05 was considered to indicate a
statistically significant difference.
Results
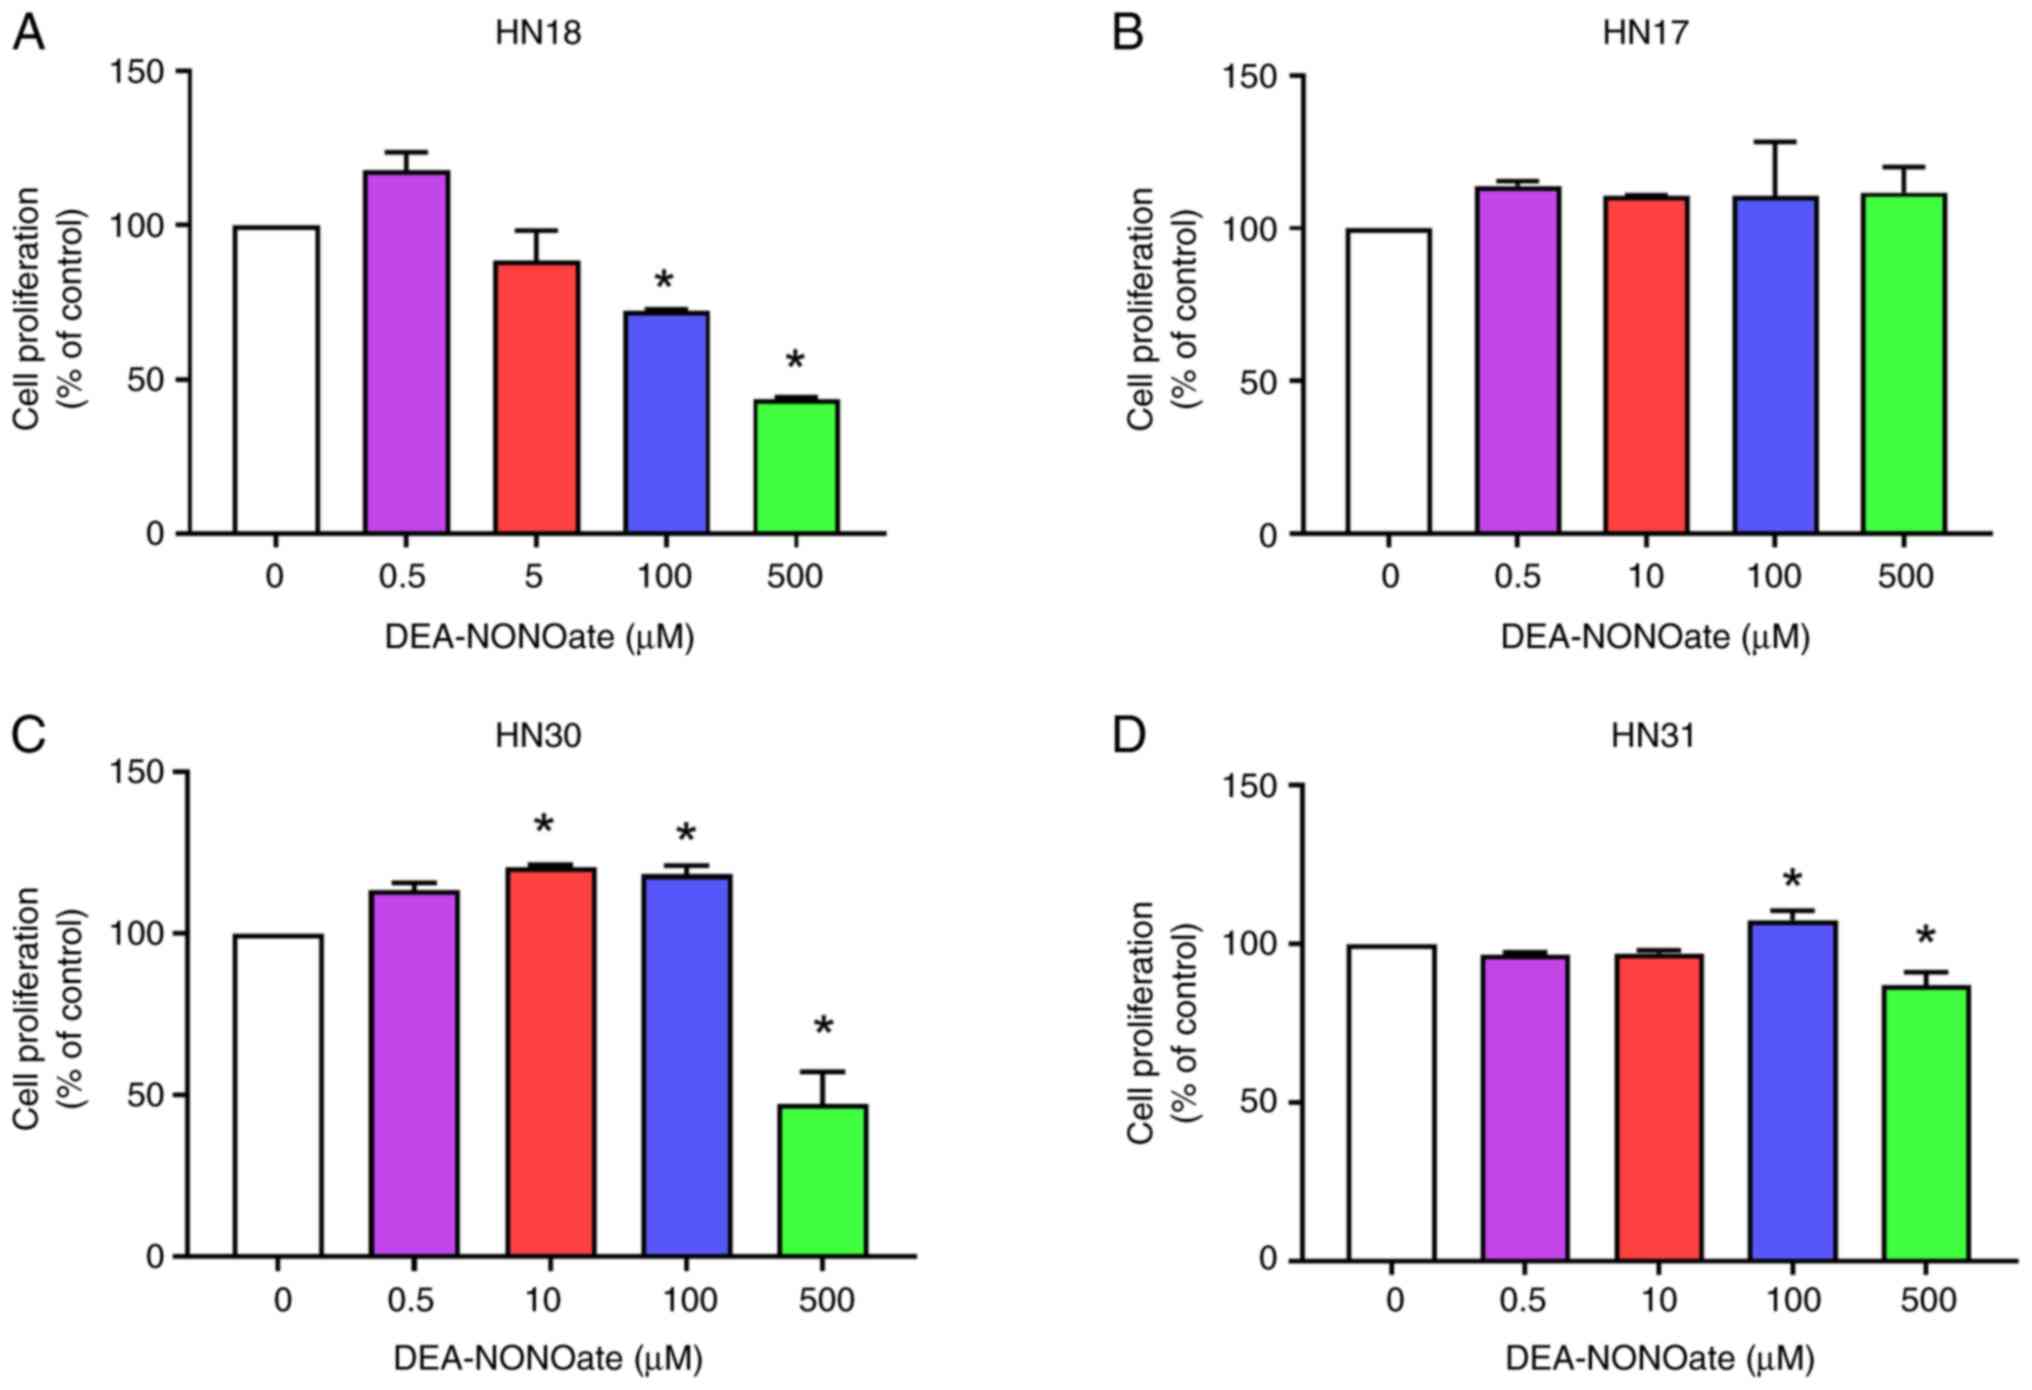
Effect of DEA-NONOate on HNSCC cell
proliferation
HNSCC cell lines were treated with 0.5-500.0 µM
DEA-NONOate for 72 h. DEA-NONOate (10-500 µM) decreased HN18 cell
proliferation in a dose-dependent manner (Fig. 1A). DEA-NONOate at 0.5 and 5.0 µM
demonstrated no significant difference in proliferation in HN18
cell when compared with control. By contrast, DEA-NONOate treatment
did not significantly change proliferation in HN17 cells (Fig. 1B). DEA-NONOate significantly
increased proliferation in HN30 (10 and 100 µM) and HN31 (100 µM)
cells compared with control (Fig.
1C and D). Moreover, 500 µM
DEA-NONOate had a cytotoxic effect on HN18, HN30 and HN31 cells
(Fig. 1A, C and D).
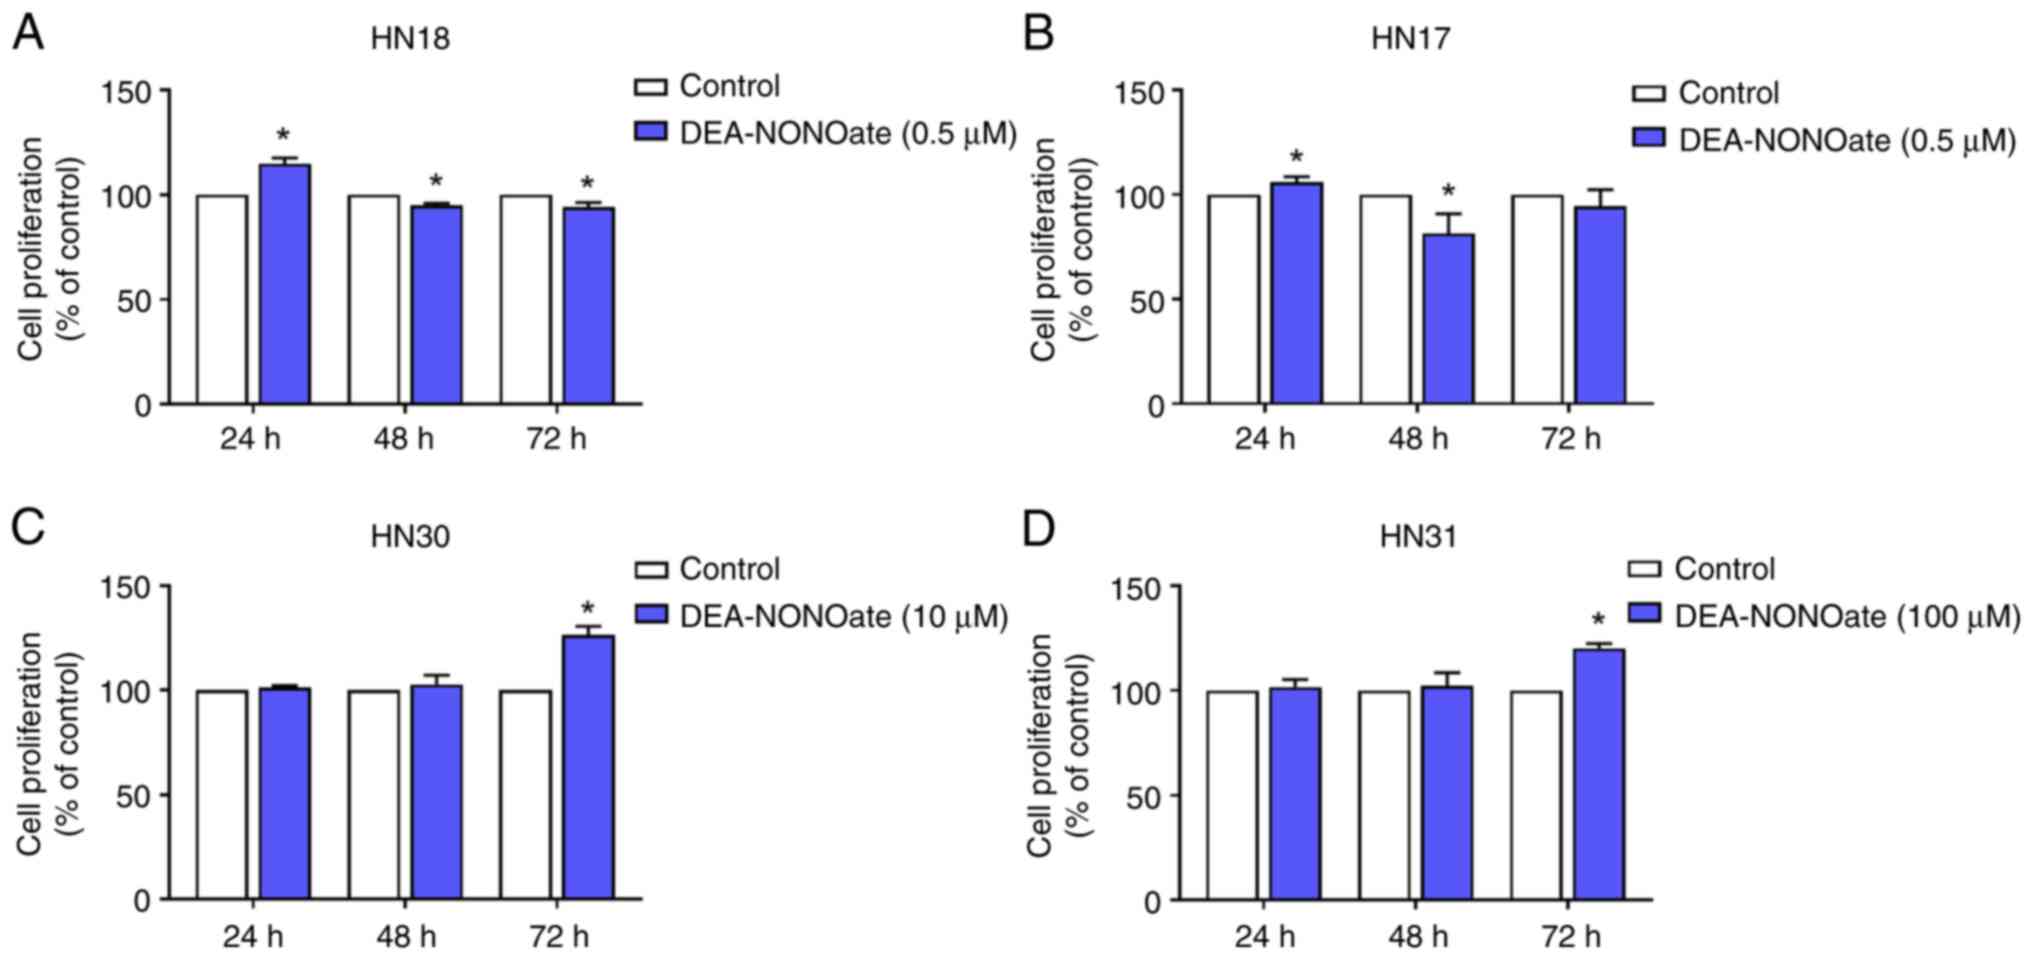
DEA-NONOate at 0.5, 10.0 and 100.0 µM was used to
test proliferation at 24-72 h in HN18 and HN17, HN30 and HN31
cells, respectively. The proliferation significantly increased in
DEA-NONOate-treated HN18 and HN17 cells at 24 h compared with
control (Fig. 2A and B), however, proliferation significantly
declined at 48 to 72 h. DEA-NONOate significantly induced
proliferation in HN30 and HN31 cells at 72 h compared with control
(Fig. 2C and D). By contrast, at 24-48 h, DEA-NONOate
did not affect proliferation of these cell lines.
Therefore, 0.5, 10.0 and 100.0 µM DEA-NONOate was
selected as the effective concentration for HN18 and HN17, HN30 and
HN31 cells, respectively, in the subsequent experiments.
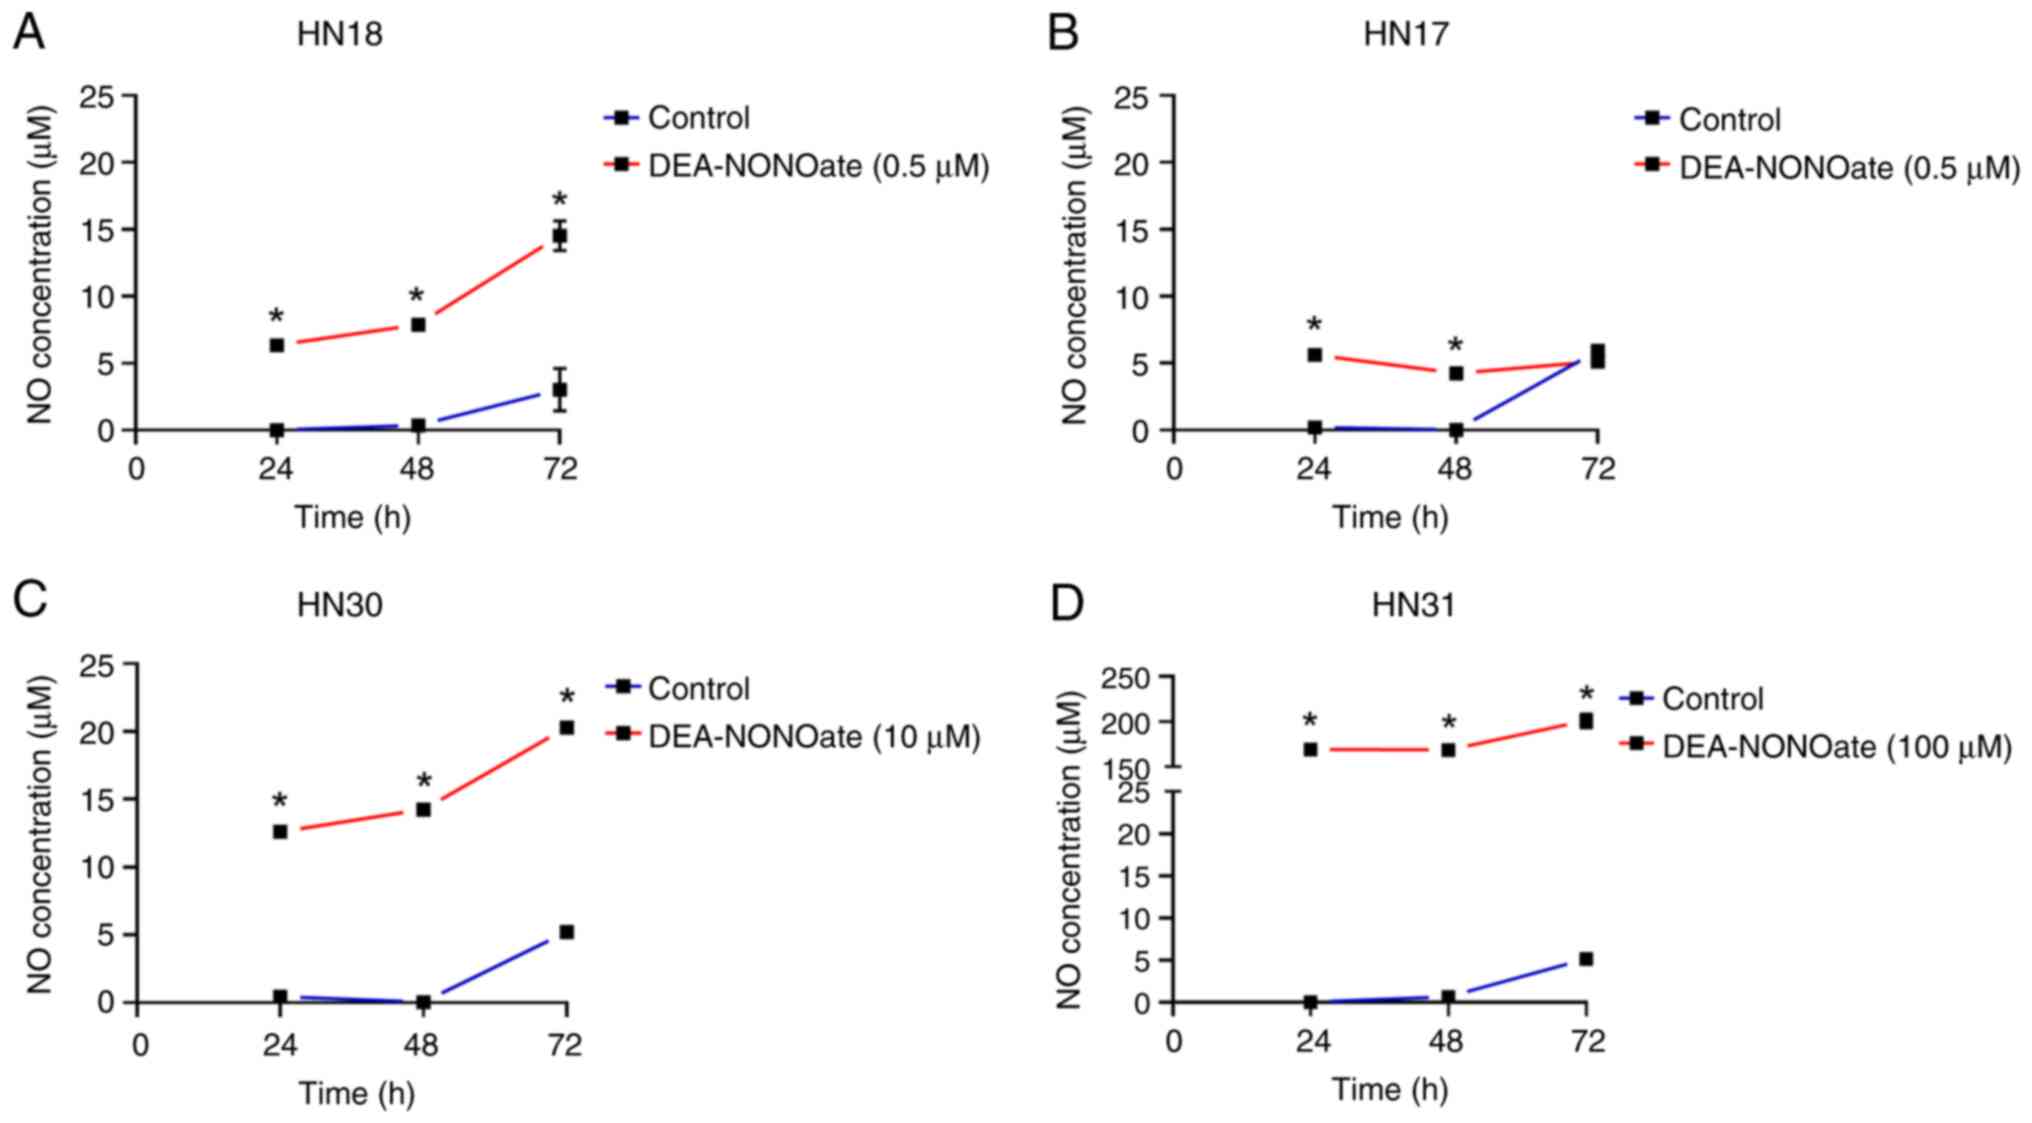
Determination of NO in
DEA-NONOate-treated HNSCC cells
The cells were treated with their effective
DEA-NONOate concentration for 24-72 h. NO was secreted from the
DEA-NONOate-induced cells and significantly increased in HN18, HN30
and HN31 cells from 24 to 72 h compared with control (Fig. 3A, C
and D). The amount of NO released
by DEA-NONOate-treated cells was 6.3-14.5 µM in HN18, 12.6-20.3 µM
in HN30 and 169.4-201.0 µM in HN31 cells. Although DEA-NONOate
significantly induced NO secretion in HN17 cells at 24 and 48 h
compared with control (Fig. 3B),
its levels remained constant until 72 h. NO secreted from
DEA-NONOate-treated HN17 cells was 5.1-5.6 µM.
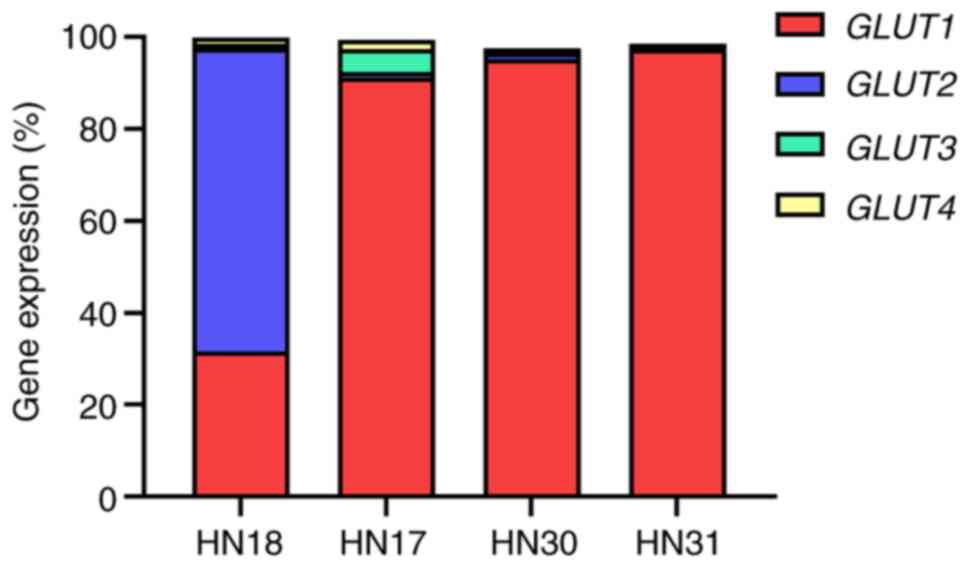
Gene expression profiling of GLUTs in
HNSCC cells
The constitutive expression of GLUT1, 2, 3
and 4 genes in HNSCC cell lines was evaluated before DEA-NONOate
induction. The relative expression of GLUT1 was 91.3, 95.1
and 97.3% in HN17, HN30 and HN31 cells, respectively (Fig. 4). The GLUT2 expression
(65.9%) was the highest among the GLUTs in HN18 cells.
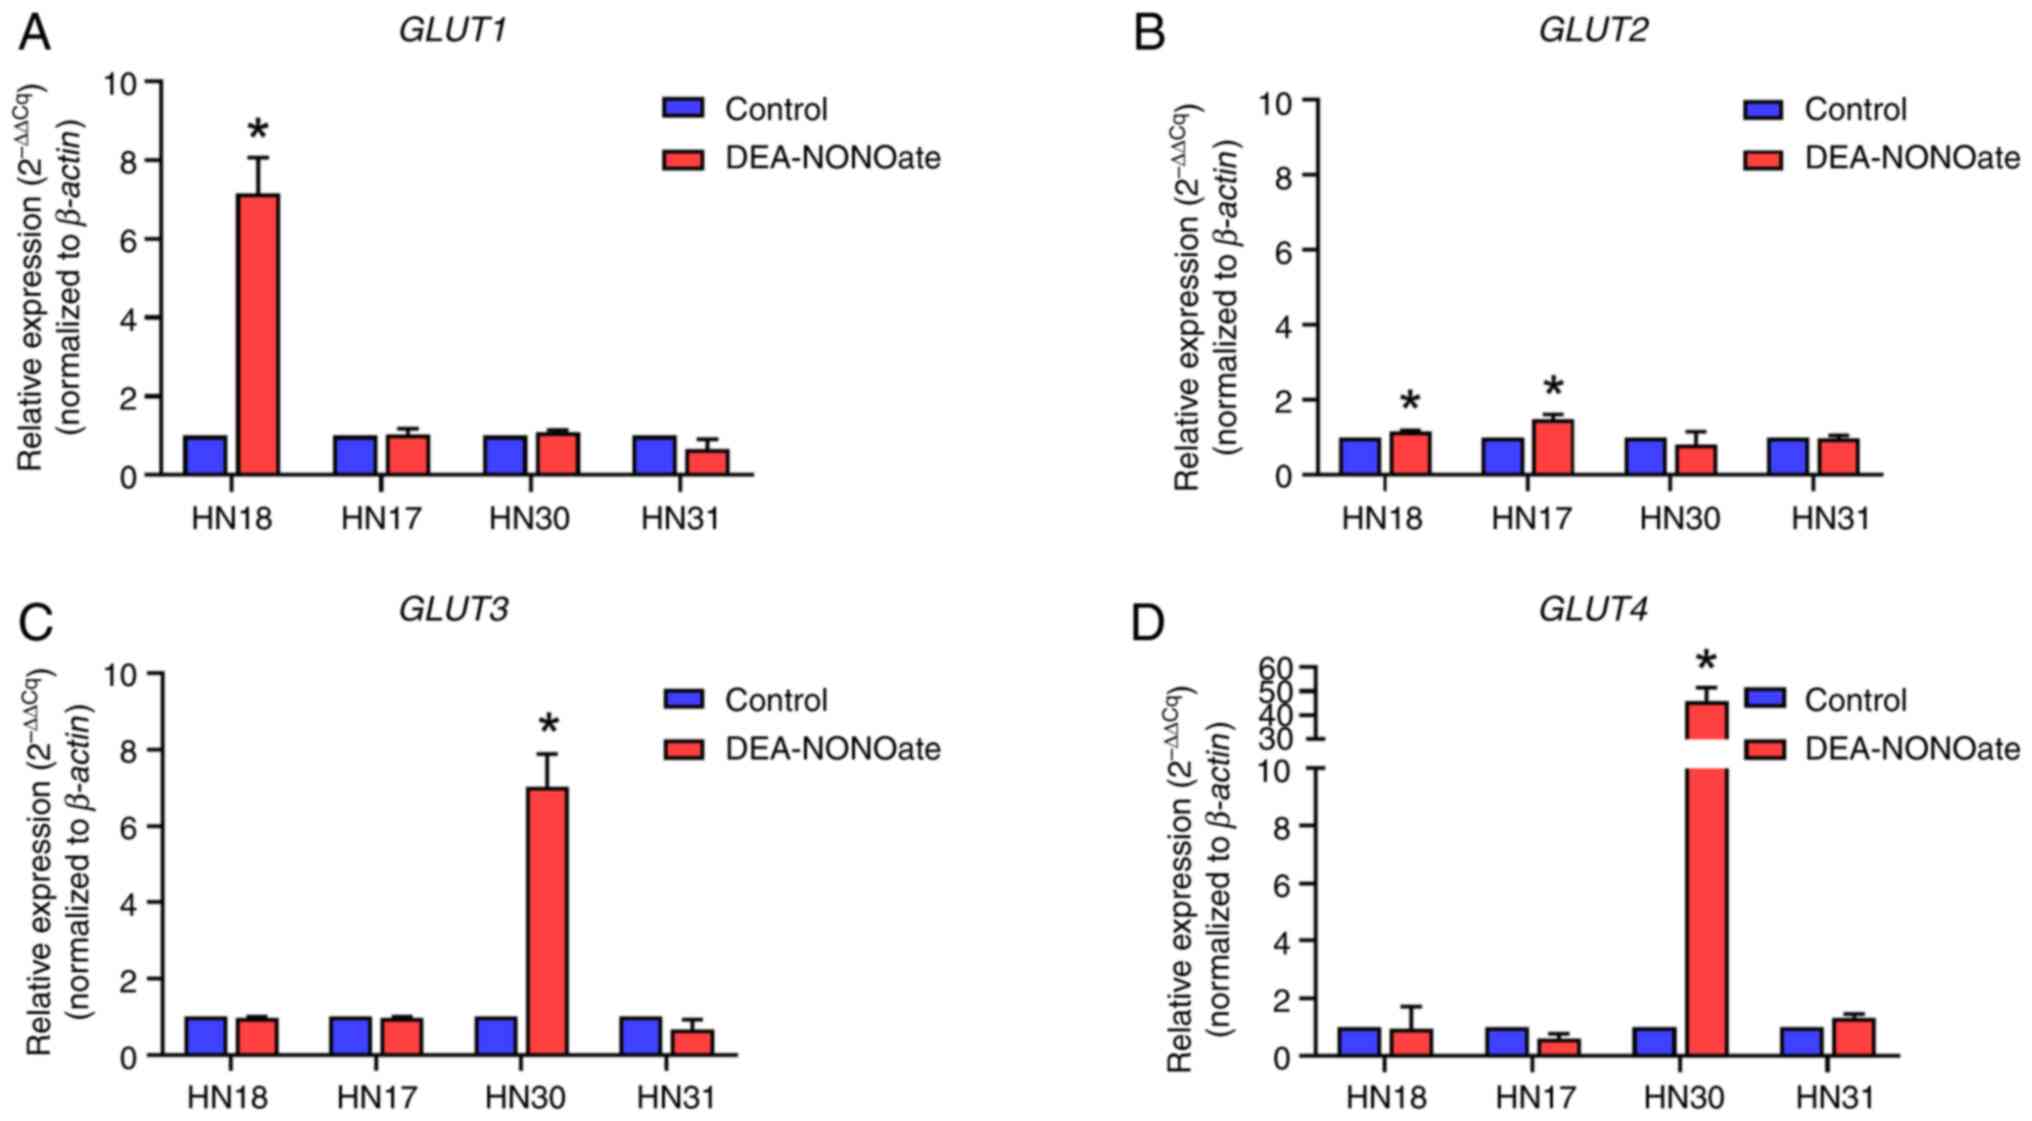
DEA-NONOate induces GLUT gene
expression in HNSCC cells
After DEA-NONOate induction, GLUT1 and 2
expression was significantly increased in HN18 cells compared with
control (Fig. 5A and B). GLUT2 expression was
significantly increased in DEA-NONOate-induced HN17 cells compared
with control (Fig. 5B). Moreover,
GLUT3 and 4 expression was significantly increased in
DEA-NONOate-induced HN30 cells compared with control (Fig. 5C and D). However, there was no alteration in
GLUT1, 2, 3 and 4 expression following DEA-NONOate induction
in HN31 cells (Fig. 5).
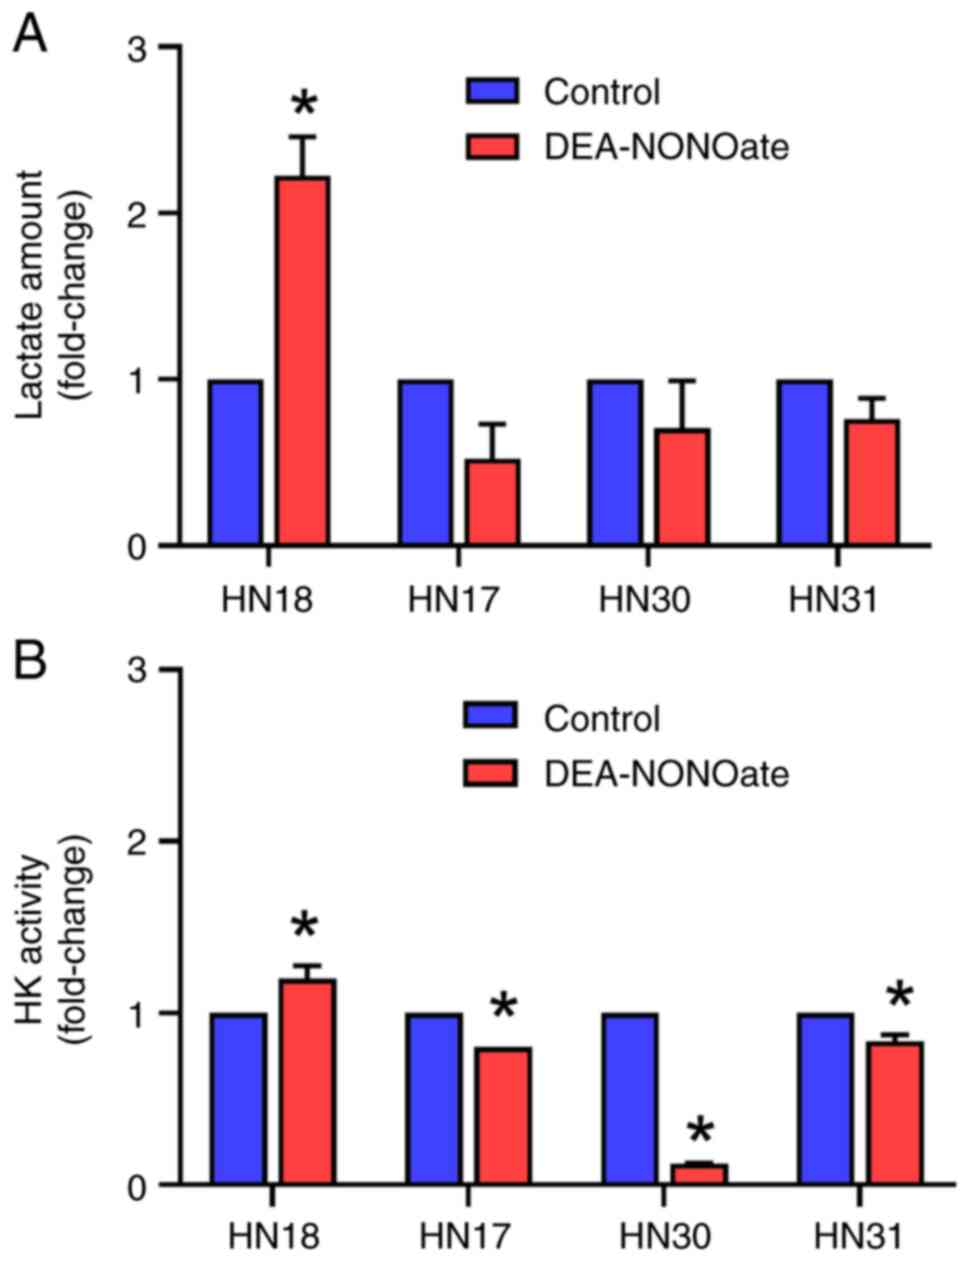
Effect of DEA-NONOate on lactate
amount and HK activity in HNSCC cells
The lactate amount in DEA-NONOate-treated HN18 cells
significantly increased to 5.15 pmol or 2.22-fold of control
(Fig. 6A). However, the lactate
levels in HN17, HN30 and HN31 cells were not affected by
DEA-NONOate. Furthermore, DEA-NONOate significantly induced HK
activity in HN18 cells to 20.36 milliunits/ml or 1.20-fold of
control (Fig. 6B). By contrast, the
HK activity in HN17, HN30 and HN31 cells significantly decreased
following DEA-NONOate treatment.
Discussion
The present study investigated the effects of
DEA-NONOate on proliferation and glycolysis in HNSCC cell lines.
Based on its concentration, DEA-NONOate exhibited disparate effects
on proliferation, GLUTs expression, HK activity and lactate
production between HNSCC cell lines. NO has a biphasic function in
the tumor microenvironment (31).
NO exhibits pro- and anti-tumor mechanisms depending on its
concentration and cancer type (24). NO at 10-30 nM promotes
pro-tumorigenic mechanisms, such as ERK pathway activation; NO
>1 µM increases nitrative stress and apoptosis in a breast
cancer cell line (32). In ovarian
cancer, NO ≤100 nM promotes glycolysis and cell proliferation,
whereas NO ≥500 nM exhibits antitumorigenic effects (27).
In the present study, DEA-NONOate was used as a NO
donor to induce proliferation and glycolysis in HNSCC cells.
DEA-NONOate significantly promoted HNSCC cell proliferation at
different concentrations and induction periods; 0.5 µM DEA-NONOate
increased proliferation in HN18 and HN17 cells at 24 h, whereas 10
and 100 µM DEA-NONOate induced proliferation in HN30 and HN31 cells
at 72 h. Moreover, overall, the anti-proliferative concentration of
DEA-NONOate for HNSCC cells was >200 µM. These effective
concentrations of NO on HNSCC cells were relatively higher than
those of other cancers, as aforementioned. Moreover, the present
study demonstrated that the effect of NO on HNSCC cell
proliferation might depend on TNM staging and NO concentration.
Although NO-associated oncogenic signaling has been
described with respect to NO concentration in certain types of
cancer cells (24), to the best of
our knowledge, there is no information on the impact of NO on the
metabolic pathways that modulate cancer cell activity. Glycolysis
is the primary metabolic pathway that supports tumor progression,
which is known as the ‘Warberg effect’ (4). GLUT1-4 are upstream proteins that
facilitate glucose entry into the glycolysis pathway, providing
high levels of ATP in cancer cells (17). GLUT1 upregulation is widely detected
in cancer, including oral cancer tissue, and is significantly
associated with poorly differentiated cancer, positive lymph node
metastasis, increased tumor size and worse overall survival in
patients (12). GLUT2 is
overexpressed in hepatocellular carcinoma cells (18) and colorectal cancer (19). In the present study, the
GLUT1 gene had relatively high expression levels in HN17,
HN30 and HN31 cells compared with the other GLUTs.
GLUT2 gene showed the highest expression in HN18 cells.
However, the present study had some limitations. GLUTs
expression were verified at the mRNA level but not the protein
level. In addition, only two pairs of cell lines were tested; the
study of other HNSCC cell lines is necessary to validate the
findings within the broader spectrum of HNSCC.
A previous study reported that NO promotes
glycolysis in ovarian cancer by increasing gene expression of
GLUT1, HK, PFK and lactate dehydrogenase
(27). The present study partially
confirmed that DEA-NONOate induced glycolysis in HN18 cells by
increasing the gene expression of GLUT1 and GLUT2, HK
activity and lactate production. Although the GLUT2,
GLUT3 and GLUT4 genes were upregulated, HK activity
decreased and the lactate amount did not significantly change in
DEA-NONOate-treated HN17 and HN30 cells. GLUT2 has a very low
affinity for glucose and fructose (33). In the present study, the higher
expression of GLUT2 in the DEA-NONOate-induced HN18 cells
might be sufficient for increased glucose influx and glycolysis
compared with HN17 cells. Previous studies found that NO induces
breast cancer cell proliferation via non-glycolysis pathways, such
as EGF receptor (EGFR), PI3K/AKT and MAPK (34-36).
Notably, EGFR is constitutively expressed in the HNSCC cell lines
used in the present study (28). To
confirm the effect of NO on HNSCC cell proliferation, the glucose
uptake and non-glycolysis pathways should be assessed in additional
studies. GLUT4 is the insulin-responsive glucose transporter,
therefore, glucose uptake is dependent on insulin stimulation in
cancer cell lines (5). GLUT4
expression levels are highly associated with insulin-like growth
factor (IGF) and associated with the survival of patients with
colorectal cancer (37). Based on
the present data, the crosstalk between GLUT4 and the IGF signaling
pathway should be evaluated prior to interpreting the effect of NO
on HN30 cell proliferation.
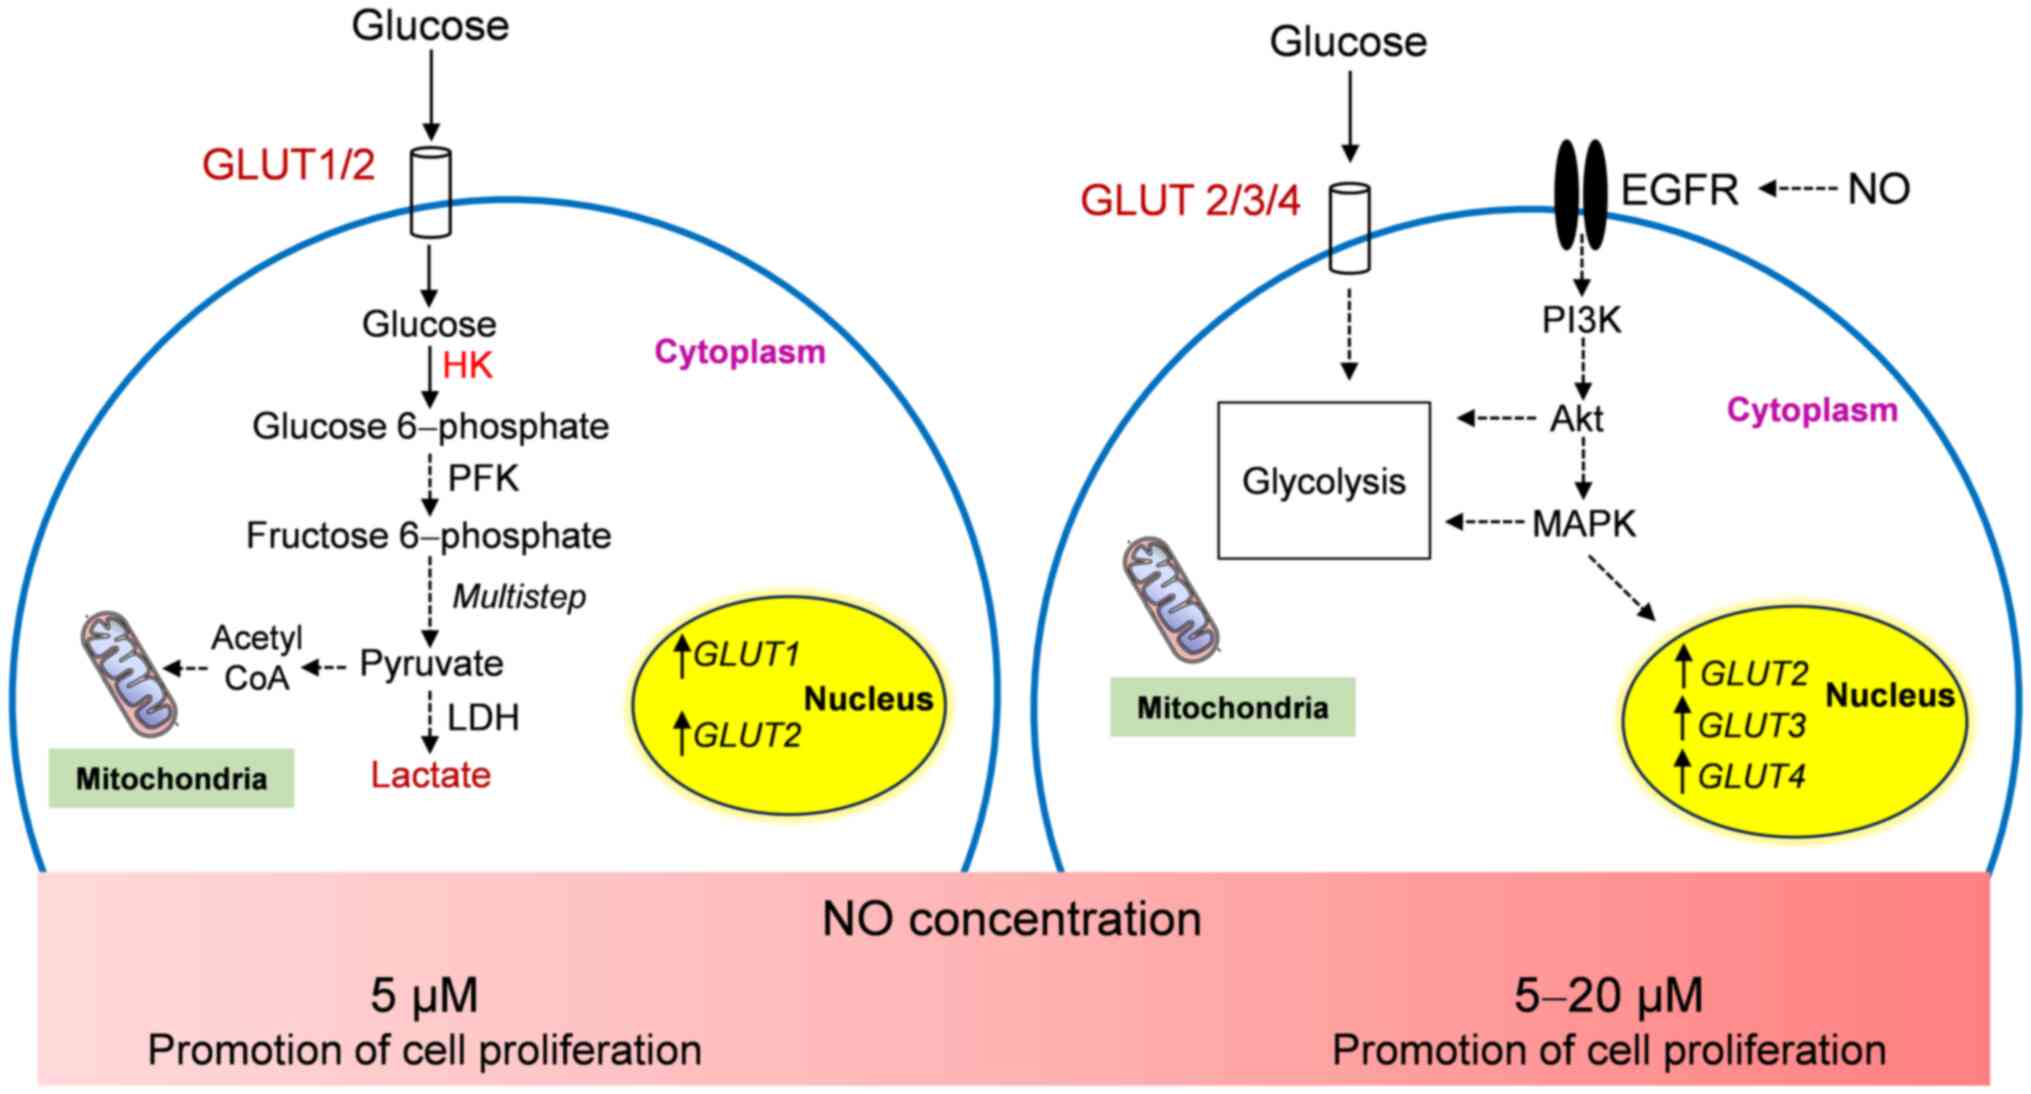
In conclusion, the present study demonstrated the
effects of DEA-NONOate on HNSCC cell proliferation and glycolysis.
DEA-NONOate exhibited pro-and anti-proliferative effects in HNSCC
cell lines depending on its concentration and TNM staging. NO at
lower concentrations (10-200 µM) had pro-proliferative effects,
whereas >200 µM had an anti-proliferative effect on the HNSCC
cells. NO (5 µM) promoted proliferation and glycolysis in HN18 cell
by upregulating GLUT1 and GLUT2 gene expression and
increasing HK activity and lactate amount. At 5-20 µM, NO-induced
HN17 and HN30 cells demonstrated increased proliferation and
GLUT2, GLUT3 and GLUT4 gene expression,
however, the glycolytic pathway was not affected. The proposed
proliferative mechanism of NO in HNSCC cells is presented in
Fig. 7. However, the
pro-proliferative concentration of NO (200 µM) induced HN31 cell
proliferation without glycolysis activation. Therefore, the
pro-tumorigenic effects of NO on HNSCC cells on glycolysis and
non-glycolysis mechanisms should be evaluated. Further
investigation into crosstalk between the proliferation-related
signaling pathways and glycolysis in HNSCC cells is needed.
Acknowledgements
The authors would like to thank Professor Silvio
Gutkind (Moores Cancer Center, Department of Pharmacology, UC San
Diego, San Diego, USA) for providing the HNSCC cell lines.
Funding
Funding: The present study was supported by the Thammasat
University Research Fund (grant no. TUFT 94/2564).
Availability of data and materials
The data generated in the present study may be
requested from the corresponding author.
Authors' contributions
KU and SK designed the experiments. KU and PK
performed the experiments. KU analyzed the data and wrote the
manuscript. KU and SK confirm the authenticity of all the raw data.
All authors have read and approved the final manuscript.
Ethics approval and consent to
participate
Not applicable.
Patient consent for publication
Not applicable.
Competing interests
The authors declare that they have no competing
interests.
References
|
1
|
Argiris A, Karamouzis MV, Raben D and
Ferris RL: Head and neck cancer. Lancet. 371:1695–1709.
2008.PubMed/NCBI View Article : Google Scholar
|
|
2
|
Ma L and Zong X: Metabolic symbiosis in
chemoresistance: Refocusing the role of aerobic glycolysis. Front
Oncol. 10(5)2020.PubMed/NCBI View Article : Google Scholar
|
|
3
|
Visioli F, Wang Y, Alam GN, Ning Y, Rados
PV, Nor JE and Polverini PJ: Glucose-regulated protein 78 (Grp78)
confers chemoresistance to tumor endothelial cells under acidic
stress. PLoS One. 9(e101053)2014.PubMed/NCBI View Article : Google Scholar
|
|
4
|
Warburg O: The metabolism of carcinoma
cells. J Cancer Res. 9:148–163. 1925.
|
|
5
|
Szablewski L: Glucose transporters as
markers of diagnosis and prognosis in cancer diseases. Oncol Rev.
16(561)2022.PubMed/NCBI View Article : Google Scholar
|
|
6
|
Holman GD: Structure, function and
regulation of mammalian glucose transporters of the SLC2 family.
Pflugers Arch. 472:1155–1175. 2020.PubMed/NCBI View Article : Google Scholar
|
|
7
|
Gould GW and Holman GD: The glucose
transporter family: Structure, function and tissue-specific
expression. Biochem J. 295 (Pt 2):329–341. 1993.PubMed/NCBI View Article : Google Scholar
|
|
8
|
Barbosa AM and Martel F: Targeting glucose
transporters for breast cancer therapy: The effect of natural and
synthetic compounds. Cancers (Basel). 12(154)2020.PubMed/NCBI View Article : Google Scholar
|
|
9
|
Ding X, Liu J, Liu T, Ma Z, Wen D and Zhu
J: miR-148b inhibits glycolysis in gastric cancer through targeting
SLC2A1. Cancer Med. 6:1301–1310. 2017.PubMed/NCBI View Article : Google Scholar
|
|
10
|
Gou Q, Dong C, Jin J, Liu Q, Lu W, Shi J
and Hou Y: PPARα agonist alleviates tumor growth and
chemo-resistance associated with the inhibition of glucose
metabolic pathway. Eur J Pharmacol. 863(172664)2019.PubMed/NCBI View Article : Google Scholar
|
|
11
|
Xiao H, Wang J, Yan W, Cui Y, Chen Z, Gao
X, Wen X and Chen J: GLUT1 regulates cell glycolysis and
proliferation in prostate cancer. Prostate. 78:86–94.
2018.PubMed/NCBI View Article : Google Scholar
|
|
12
|
Yu M, Yongzhi H, Chen S, Luo X, Lin Y,
Zhou Y, Jin H, Hou B, Deng Y, Tu L and Jian Z: The prognostic value
of GLUT1 in cancers: A systematic review and meta-analysis.
Oncotarget. 8:43356–43367. 2017.PubMed/NCBI View Article : Google Scholar
|
|
13
|
Simpson IA, Dwyer D, Malide D, Moley KH,
Travis A and Vannucci SJ: The facilitative glucose transporter
GLUT3: 20 years of distinction. Am J Physiol Endocrinol Metab.
295:E242–E253. 2008.PubMed/NCBI View Article : Google Scholar
|
|
14
|
Libby CJ, Gc S, Benavides GA, Fisher JL,
Williford SE, Zhang S, Tran AN, Gordon ER, Jones AB, Tuy K, et al:
A role for GLUT3 in glioblastoma cell invasion that is not
recapitulated by GLUT1. Cell Adh Migr. 15:101–115. 2021.PubMed/NCBI View Article : Google Scholar
|
|
15
|
He Z, Chen D, Wu J, Sui C, Deng X, Zhang
P, Chen Z, Liu D, Yu J, Shi J, et al: Yes associated protein 1
promotes resistance to 5-fluorouracil in gastric cancer by
regulating GLUT3-dependent glycometabolism reprogramming of
tumor-associated macrophages. Arch Biochem Biophys.
702(108838)2021.PubMed/NCBI View Article : Google Scholar
|
|
16
|
Ali A, Levantini E, Fhu CW, Teo JT,
Clohessy JG, Goggi JL, Wu CS, Chen L, Chin TM and Tenen DG:
CAV1-GLUT3 signaling is important for cellular energy and can be
targeted by atorvastatin in non-small cell lung cancer.
Theranostics. 9:6157–6174. 2019.PubMed/NCBI View Article : Google Scholar
|
|
17
|
Pliszka M and Szablewski L: Glucose
Transporters as a target for anticancer therapy. Cancers (Basel).
13(4184)2021.PubMed/NCBI View Article : Google Scholar
|
|
18
|
Daskalow K, Pfander D, Weichert W, Rohwer
N, Thelen A, Neuhaus P, Jonas S, Wiedenmann B, Benckert C and
Cramer T: Distinct temporospatial expression patterns of
glycolysis-related proteins in human hepatocellular carcinoma.
Histochem Cell Biol. 132:21–31. 2009.PubMed/NCBI View Article : Google Scholar
|
|
19
|
Godoy A, Ulloa V, Rodriguez F, Reinicke K,
Yanez AJ, Garcia Mde L, Medina RA, Carrasco M, Barberis S, Castro
T, et al: Differential subcellular distribution of glucose
transporters GLUT1-6 and GLUT9 in human cancer: Ultrastructural
localization of GLUT1 and GLUT5 in breast tumor tissues. J Cell
Physiol. 207:614–627. 2006.PubMed/NCBI View Article : Google Scholar
|
|
20
|
Masters C: Cellular differentiation and
the microcompartmentation of glycolysis. Mech Ageing Dev. 61:11–22.
1991.PubMed/NCBI View Article : Google Scholar
|
|
21
|
Ganapathy-Kanniappan S and Geschwind JF:
Tumor glycolysis as a target for cancer therapy: Progress and
prospects. Mol Cancer. 12(152)2013.PubMed/NCBI View Article : Google Scholar
|
|
22
|
Lopez-Sanchez LM, Aranda E and
Rodriguez-Ariza A: Nitric oxide and tumor metabolic reprogramming.
Biochem Pharmacol. 176(113769)2020.PubMed/NCBI View Article : Google Scholar
|
|
23
|
Mintz J, Vedenko A, Rosete O, Shah K,
Goldstein G, Hare JM, Ramasamy R and Arora H: Current advances of
nitric oxide in cancer and anticancer therapeutics. Vaccines
(Basel). 9(94)2021.PubMed/NCBI View Article : Google Scholar
|
|
24
|
Choudhari SK, Chaudhary M, Bagde S,
Gadbail AR and Joshi V: Nitric oxide and cancer: A review. World J
Surg Oncol. 11(118)2013.PubMed/NCBI View Article : Google Scholar
|
|
25
|
Selvido ID, Koontongkaew S, Kokilakanit P,
Sacharoen A, Korsuwannawong S and Utispan K: High nitric
oxide-adapted head and neck cancer cell lines demonstrate altered
autophagy and apoptosis. J Dent Sci. 19:855–864. 2024.PubMed/NCBI View Article : Google Scholar
|
|
26
|
Utispan K and Koontongkaew S: High nitric
oxide adaptation in isogenic primary and metastatic head and neck
cancer cells. Anticancer Res. 40:2657–2665. 2020.PubMed/NCBI View Article : Google Scholar
|
|
27
|
Li L, Zhu L, Hao B, Gao W, Wang Q, Li K,
Wang M, Huang M, Liu Z, Yang Q, et al: iNOS-derived nitric oxide
promotes glycolysis by inducing pyruvate kinase M2 nuclear
translocation in ovarian cancer. Oncotarget. 8:33047–33063.
2017.PubMed/NCBI View Article : Google Scholar
|
|
28
|
Cardinali M, Pietraszkiewicz H, Ensley JF
and Robbins KC: Tyrosine phosphorylation as a marker for aberrantly
regulated growth-promoting pathways in cell lines derived from head
and neck malignancies. Int J Cancer. 61:98–103. 1995.PubMed/NCBI View Article : Google Scholar
|
|
29
|
Utispan K and Koontongkaew S: Mucin 1
regulates the hypoxia response in head and neck cancer cells. J
Pharmacol Sci. 147:331–339. 2021.PubMed/NCBI View Article : Google Scholar
|
|
30
|
Rao X, Huang X, Zhou Z and Lin X: An
improvement of the 2^(-delta delta CT) method for quantitative
real-time polymerase chain reaction data analysis. Biostat
Bioinforma Biomath. 3:71–85. 2013.PubMed/NCBI
|
|
31
|
Ying L and Hofseth LJ: An emerging role
for endothelial nitric oxide synthase in chronic inflammation and
cancer. Cancer Res. 67:1407–1410. 2007.PubMed/NCBI View Article : Google Scholar
|
|
32
|
Thomas DD, Ridnour LA, Espey MG, Donzelli
S, Ambs S, Hussain SP, Harris CC, DeGraff W, Roberts DD, Mitchell
JB and Wink DA: Superoxide fluxes limit nitric oxide-induced
signaling. J Biol Chem. 281:25984–25993. 2006.PubMed/NCBI View Article : Google Scholar
|
|
33
|
Gould GW, Thomas HM, Jess TJ and Bell GI:
Expression of human glucose transporters in Xenopus oocytes:
Kinetic characterization and substrate specificities of the
erythrocyte, liver, and brain isoforms. Biochemistry. 30:5139–5145.
1991.PubMed/NCBI View Article : Google Scholar
|
|
34
|
Pervin S, Singh R, Hernandez E, Wu G and
Chaudhuri G: Nitric oxide in physiologic concentrations targets the
translational machinery to increase the proliferation of human
breast cancer cells: Involvement of mammalian target of
rapamycin/eIF4E pathway. Cancer Res. 67:289–299. 2007.PubMed/NCBI View Article : Google Scholar
|
|
35
|
Ridnour LA, Barasch KM, Windhausen AN,
Dorsey TH, Lizardo MM, Yfantis HG, Lee DH, Switzer CH, Cheng RY,
Heinecke JL, et al: Nitric oxide synthase and breast cancer: Role
of TIMP-1 in NO-mediated Akt activation. PLoS One.
7(e44081)2012.PubMed/NCBI View Article : Google Scholar
|
|
36
|
Switzer CH, Glynn SA, Cheng RY, Ridnour
LA, Green JE, Ambs S and Wink DA: S-nitrosylation of EGFR and Src
activates an oncogenic signaling network in human basal-like breast
cancer. Mol Cancer Res. 10:1203–1215. 2012.PubMed/NCBI View Article : Google Scholar
|
|
37
|
Chen CL, Chang YC and Hsiao M: Rab GTPases
accelerates GLUT4 translocation in colorectal cancer progression by
Insulin/IGF system. FASEB J. 34:1. 2020.
|