Introduction
The United Nations and World Health Organization
(WHO) have pointed to diabetes as the greatest health issue from a
global epidemic prospect (1).
Global diagnosis criteria have already been standardised between
the WHO, the International Diabetes Federation (IDF) and the
American Diabetes Association (ADA) (1). The 2021 edition of the International
Diabetes Federation Atlas estimates that 537 million adults between
20 and 79 years of age have diabetes (10.5% prevalence), of whom
90% have type 2 diabetes mellitus (T2DM) (2). Moreover, an estimated 240 million
people are undiagnosed, meaning that almost half of patients
globally are not aware of their condition (2). By 2045, ~783 million people are
predicted to have diabetes (12.2% prevalence) (2).
In Mexico, the National Institute for Public Health
has carried out the National Health and Nutrition Survey (ENSANUT)
for >25 years. According to the latest data of ENSANUT 2021
COVID 19(3), the prevalence of
diabetes was 11.1% (confidence interval 95%=9.5-12.8) in a country
whose population was 128.9 million in 2020.
Glycaemic control is fundamental to treat diabetes.
The United Kingdom Prospective Diabetes Study confirmed that
glycaemic control significantly decreases complication rates in
patients with T2DM (4). HbA1c
control objective <7% (53 mmol) was associated with fewer
microvascular complications in patients with type 1 and 2 diabetes,
thus T2DM handling should be focused on adequate control of
hyperglycaemia and other risk factors such as overweight,
hypertension, and dyslipidemia (5).
Metformin is classified as a biguanide and it is
considered an essential drug by the WHO. It is the first-line
therapy against T2DM because of its efficacy, safety and low cost.
It has a beneficial effect on HbA1c and weight reduction and it can
reduce cardiovascular and death risk (4).
The primary effect of metformin is the hepatic
inhibition of gluconeogenesis, however, its mechanism is still
debated (6). Patients receiving a
daily dose of 500-2,550 mg metformin have a plasmatic concentration
of 10-40 µM (6). Metformin is a
positively charged hydrophilic molecule that is mainly transported
by organic cations 1-3 (OCT1-3), equilibrant nucleoside transporter
4 (ENT4) and multidrug and toxin extrusions (MATEs) 1 and 2k
(6,7). In the intestinal lumen, metformin is
absorbed by enterocytes via ENT4 and OCT3, then it is released into
the intravascular space through OCT1 and distributed across the
organism. Hepatocytes absorb metformin through OCT1 and OCT3, and
excrete it into bile via MATE1. Renal tubular cells absorb
metformin via OCT2, excreting it in urine via MATE1, MATE2-k and
OCT1(7). Thus, metformin
distribution in humans is associated with the location of these
transporters, where higher concentrations of metformin are found in
the liver, kidney and intestine, while lower concentrations are
found in peripheral organs (6). The
efficacy and toxicity of any drug are determined by its
pharmacokinetic and pharmacodynamic balance. Inherent genetic
variations contribute to this variability, since multiple genes
encode proteins directly involved in the aforementioned
pharmacological balance (8).
Transporters involved in metformin pharmacokinetics and
pharmacodynamics belong to the solute carrier (SLC) family.
This superfamily encompasses OCTs. OCT1 is a 554 amino acid protein
with a molecular weight of 61,154 Da; it is codified by gene
SLC22A1, located in the long arm of chromosome 6, in region
25.3 (6q25.3), possessing a total of 12 exons (9). Like numerous other members of the
SLC22 family, it has 12 helixes or transmembrane domains
(TMDs), including a large extracellular loop between domains 6 and
7(10). SLC22A1 is a highly
polymorphic gene and its polymorphisms may induce altered OCT1
function, which affects metformin pharmacokinetics and response
(7,11). This study aims to determine the
effects of one exonic (due to direct protein changes) and one
intronic polymorphism (due to possible changes in the protein
translation) on HbA1c levels. The exonic polymorphism in question
is rs72552763 (c.1260_1262del), since it may represent another 3:
rs35167514 (c.1258del), rs34305973 (c.1259del), and rs35191146
(c.1260del), located in exon 7, which would be found by TMD 9 in
the final protein (10,12). The intronic OCT1 polymorphism is
rs622342 (g.160151834), a variant which affects transcription rate
decrease (13). Studying the
frequency and functionality of these two polymorphisms could lead
to identifying pharmacogenetic biomarkers of relevance in T2DM
therapeutic response.
Materials and methods
Study design
The present study was an observational, transversal,
clinical and analytical trial conducted at the Hospital Regional de
Alta Especialidad de Ixtapaluca, Mexico (HRAEI) between April 2018
and April 2019. Patient histories were compiled collecting clinical
and biochemical data found in their electronic records. These
included age, disease duration, HbA1c levels, height, weight, BMI,
blood pressure, metformin dosage, fasting glucose, cholesterol
total, triglyceride and glomerular filtration rate. A peripheral
venous blood sample was collected from every patient using two
tubes containing ethylenediaminetetraacetic acid (EDTA). Following
a fasting period of at least 8 h, blood samples were taken within 8
h after the evening's metformin dose. A 10 ml peripheral venous
blood sample was extracted using EDTA vacutainer tubes. The sample
was centrifuged at 400 x g for 5 min at 4˚C. Plasma aliquots were
collected using Eppendorf tubes and the samples were frozen at
-80˚C until drug determination assay.
Patient recruitment
Out of a previously studied sample of 103
Mexican-Mestizo patients with T2DM [diagnosed by ADA (5) and WHO criteria (14)] from HRAEI (15, Ortega), 59 (17
(28.81%) male; women=42 (71.18%), (age, men=51.00-62.00, women
(46.20-61.00)] undergoing metformin monotherapy were selected for
the present study.
Clinical evaluation
Patients were recruited according to the following
inclusion criteria: i) Patient was undergoing metformin treatment;
ii) the patient had undergone a treatment schedule comprising a
stable metformin dose for at least 3 months. The clinical record
and treatment characteristics of each individual were accessible
via their medical file at the corresponding healthcare centre,
particularly data concerning drug dosage (including hypoglycemic
agents) during the aforementioned 3 month period. The medical file
comprised anthropometric parameters and clinical laboratory reports
performed at High-Speciality Regional Hospital of Ixtapaluca,
Ixtapaluca, Mexico on a number of key biochemical variables
including HbA1c via high-performance liquid chromatography (HPLC)
in a Variant II Turbo 2.0 (Bio-Rad Laboratories, Inc.); fasting
glucose levels, total cholesterol, low density lipoprotein (LDL),
high density lipoproteins (HDL), triglycerides and creatinine by
photometry in an AU480 Chemistry Analyzer (Beckman Coulter, Inc.)].
Individuals who reported chronic alcoholism, previous pancreatic
pathology, renal failure, hypoglycemic treatment with insulin or
insulin analogs, insufficient medical records, T1DM or voluntary
withdrawal were excluded. A database was created to retrieve and
analyse the information of the 103 patients. File revision was
performed through random probabilistic sampling.
Genotyping procedure
Genotyping was performed as previously described
(15). A peripheral 10 ml blood
sample was collected from all participants in EDTA tubes, and
genomic DNA was extracted from 200 µl venous peripheral blood using
UltraClean® BloodSpin® DNA isolation reagents
(Mo Bio Laboratories; Qiagen, Inc.), evaluated for integrity and
concentration via 1% agarose electrophoresis and spectrophotometry
using NanoDrop™ 2000/2000c (Thermo Scientific, Inc.), respectively.
For SLC22A1, SLC22A2 and SLC22A3, different allelic
variants were analysed by real time PCR technology using
fluorescence-based TaqMan® assays on a Fast 7300
Real-Time PCR System (both Applied Biosystems; Thermo Fisher
Scientific, Inc.). Reactions were performed in a final reaction
volume of 10 µl with 30 ng genomic DNA template, 1X
TaqMan® Universal PCR Master mix, 1X each probe assessed
(SLC22A1: rs12208357, C__30634096_10; SLC22A1:
rs2282143, C__15877554_40; SLC22A1: rs594709,
C___1898206_20; SLC22A1: rs622342, C____928527_30;
SLC22A1: rs628031, C___8709275_60; SLC22A1: rs683369,
C____928536_30; SLC22A1: rs72552763, C__34211613_10;
SLC22A2: rs316019, C___3111809_20; SLC22A3:
rs2076828, C___2763995_1_ and SLC22A3: rs8187725,
C__30633894_10) and water. Thermocycling conditions and allelic
discrimination to identify the genotypes using allelic
discrimination software ABI PRISM 700 Sequence Detection System
v1.0 (Applied Biosystems; Thermo Fisher Scientific, Inc.) were as
previously described (15). SNP
allelic and genotypic frequencies of OCT1, OCT2, and OCT3 were
performed by direct counting.
Genotypic and allelic frequency
analysis
Allelic frequencies were counted, and expected
values were calculated for each genotype (Appendix S1). Hardy Weinberg equilibrium
was calculated through χ2 and P-value was determined
through 1-pchisq(χ2, df=1) with one degree of freedom
for each of the four SNPs (rs72552763, rs622342, rs316019, and
rs2076828). P>0.05 was considered to indicate a Hardy-Weinberg
equilibrium.
Plasmatic metformin determination
Determinations were performed in the Clinical
Pharmacology Unit of the Faculty of Medicine of the Universidad
Nacional Autónoma de México (UNAM), Mexico City, Mexico. The
methodology was validated in accordance with the Mexican Official
Normativity NOM-177-SSA 1-2013(16), which establishes tests and
procedures to demonstrate drug interchangeability, the mandatory
requirements authorised third parties must observe, which research
or healthcare institutions may perform biocompatibility tests and
the internal procedure of analytical methodology validation. The
study adhered to international requirements established in the
Standard Operating Procedure SOP-UA-05-09 ‘Validation of analytical
methodology on special and bioavailability and/or bioequivalence
studies’ (17). Biological samples
were analysed according to analytical methodology index card
FMA-018/B, previously validated according to Mexican Official
Normativity NOM-177-SSA1-2013(16).
The analytical method was selective over the quantification of both
plasmatic metformin and glibenclamide, without interference of
either endogenous or exogenous compounds. The employed methodology
is selective, linear, precise,and exact over the assessed
concentration range. For sample analysis, ultra-HPLC-mass
spectroscopy in multiple reaction monitoring (20˚C; flow rate 0.6
ml/min) mode was performed using an Agilent Technologies G6490A
mass spectrometer. Calibration curves and controls for sample
analysis were prepared using the following reference substances:
Metformin hydrochloride (United States Pharmacopea batch R069H0,
purity 99.7%), glibenclamide (batch R022S0, purity 99.4%), and
loratadine (U.S.P. R052U0, purity 99.8%). To quantify plasmatic
metformin/glibenclamide, mass/charge ratio of metformin 130.1/71.0,
glibenclamide 494.0/369.0 and the internal standard loratadine
383.1/337.1 were used. A Luna PFP analytical column (2.0x100.00 mm,
3.0 µm; Phenomenex) was used for analyte separation and
determination. The isocratic elution of samples was performed using
acidified ammonium formate 10 mM (A): acetonitrile 100% (B), as
mobile phase. Analytes were extracted through protein
extraction/precipitation: A 100 µl aliquot was extracted from a
plasma sample centrifuged at 400 x g for 5 min at 4˚C and deposited
into a microtube. A total of 10 µl loratadine internal standard
solution (30 µg/ml) was added. For protein precipitation, 400 µl
HPLC-grade acetonitrile was added. The tube was shaken on a
multiple vortex at maximum (438 x g) speed for 1 min at room
temperature. The tube was centrifuged at 20,600 x g and 4˚C for 5
min. A total of 250 µl supernatant was transferred to a 96-well
plate. The injection volume on the chromatographic system was 2.0
µl. The method was linear in the range of 20-10,000 ng/ml. Intra-
and inter-day variation coefficients were <15%. In the case of
metformin, recovery ranged from 89.676 to 90.731%. The association
between chromatographic response and concentration on every
calibration curve was adjusted by linear least squares regression
for metformin. To quantify the plasmatic samples, regression was
performed using Mass Hunter B.08 Quantitative Analysis software
(agilent.com/en/product/software-informatics/mass-spectrometry-software/data-analysis).
Statistical analysis
Statistical analyses were conducted using R-4.2.0
language (r-project.org/). Apposite code lines
were generated to programme every analysis. Kolmogorov-Smirnov or
Shapiro-Wilk test was performed for the population description
analysis. According to distribution, quantitative variables were
analysed using either unpaired Student's t or Mann-Whitney U tests
for independent groups. Data are presented as the median and
standard deviation or 25 and 75 percentiles. Qualitative variables
were analysed by Pearson's χ2 test. Kruskal-Wallis test
was used to conduct comparisons between >2 groups, followed by
Mann-Whitney U post hoc test using the pgirmess package version
2.0.2 (R-project.org/.) pairwise.wilcox.test()
command.
Simple and multiple linear regression models.
Assessed variables included metformin concentration effect (ng/dl),
age (years), metformin dosage (mg/kg/day) and BMI
(kg/m2) with respect to HbA1c percentage (as dependent
variable) in patients grouped by a dominant genotypic model. A
total of eight simple and two multiple linear regression models
were used.
Two linear regression machine learning models were
applied to the dominant genotypic model in rs72552763 GAT/GAT
(n=28) and GAT/del + del/del (n=31) groups, where atypical and
influential values were assessed through Cook's distance and
leverage, and three observations were eliminated. Models were
constructed in R-4.2.0 (r-project.org/), where simple validation through
sample.split (caTools library version 1.18.2, SplitRatio at 2/3),
was used to create a training and a testing set.
By means of adjustment, a model was trained with the
first set. Predicted values were obtained by adjusting the trained
model with the testing set. The model was validated by graphic
collinearity exploration, residue distribution via Shapiro-Wilk
(shapiro.test) and graphic and numeric analysis of atypical and
influential values by Cook's distance and leverage. Variance
homogeneity was evaluated with Breusch-Pagan's test using the
bptest function from Imtest library (version 0.9-40; R-project.org/. Kruskal-Wallis inference was performed
to compare HbA1c levels predicted by the model vs. the training and
testing sets. P<0.05 was considered to indicate a statistically
significant difference.
Results
Clinical and biochemical data of
patients
Out of 103 patients, 59 fulfilled the inclusion
criteria. As shown in Table I,
patients were grouped by sex. Significant differences were only
found for height. HbA1c median was 6.30 (5.80-7.30) and 6.40
(6.10-7.85), respectively, for male and female patients.
Uncontrolled (HbA1c >7%) proportions were 29.42% for male and
26.19% for female patients; there was no significant
difference.
 | Table IClinical and demographic
characteristics of patients with type 2 diabetes mellitus
undergoing metformin treatment. |
Table I
Clinical and demographic
characteristics of patients with type 2 diabetes mellitus
undergoing metformin treatment.
| Characteristic | Male (n=17) | Female (n=42) | P-value |
|---|
| Age, years | 59.00
(51.00-62.00) | 54.50
(46.20-61.00) | 0.335 |
| Height, m | 1.64±0.05 | 1.54±0.05 |
<0.001a |
| Weight, kg | 81.50±11.90 | 77.70±18.30 | 0.224 |
| BMI,
kg/m2 | 30.20±4.04 | 32.60±6.93 | 0.095 |
| BMI
classificationd
(%) | | | 0.283 |
|
Normal
(18.50-24.99) | 0 (0.00) | 4 (9.52) | |
|
Overweight
(25.00-29.99) | 8 (47.05) | 12 (28.57) | |
|
Obese I
(30.00-34.99) | 7 (41.17) | 11 (26.19) | |
|
Obese II
(35.00-39.99) | 2 (11.76) | 10 (23.80) | |
|
Obese III (≥
40.00) | 0 (0.00) | 5 (11.90) | |
| Systolic BP,
mmHg | 127 (119-136) | 124 (110-134) | 0.513 |
| Diastolic BP,
mmHg | 78 (68-88) | 77 (70-80) | 0.906 |
| Time since
diagnosis, years | 3.00
(1.00-6.00) | 3.50
(1.62-8.00) | 0.453 |
| Metformin dose,
mg/kg/day | 19.80
(10.50-23.80) | 18.4
(12.70-26.80) | 0.383 |
| Metformin
doseb, mg/day (%) | | | 0.587 |
|
500 | 0 (0.00) | 2 (5.00) | |
|
850 | 7 (43.75) | 13 (32.50) | |
|
1,700 | 7 (43.75) | 16 (40.00) | |
|
2,550 | 2 (12.50) | 9 (22.50) | |
| Metformin
concentration, ng/ml | 650.00
(135.00-877.00) | 263.00
(107.00-748.00) | 0.375 |
| Fasting
glucosec, mg/dl | 107.00
(102.00-134.00) | 121.00
(100.00-187.00) | 0.505 |
|
Control
(<126) | 13 (76.47%) | 22 (53.65%) | 0.186 |
|
Uncontrolled
(≥126) | 4 (23.53%) | 19 (46.35%) | |
| NGSP% | 6.30
(5.80-7.30) | 6.40
(6.10-7.85) | |
| IFCC mmol/mol | 45.35
(39.89-56.28) | 46.45
(43.17-62.30) | 0.322 |
| Control HbA1c
(<7%) | 12 (70.58) | 31 (73.81) | |
| Uncontrolled HbA1c
(≥7%) | 5 (29.42) | 11 (26.19) | >0.999 |
| Total cholesterol,
mg/dl | 165.00±32.40 | 179.00±41.60 | 0.236 |
|
Control
(<200) | 13 (81.25%) | 28 (66.66%) | 0.442 |
|
Uncontrolled
(≥200) | 3 (18.75%) | 14 (33.33%) | |
| Triglyceride,
mg/dl | 185.00
(108.00-201.00) | 195.00
(132.00-239.00) | 0.333 |
|
Control
(<150) | 6 (42.75%) | 10 (24.39%) | 0.330 |
|
Uncontrolled
(≥150) | 8 (57.15%) | 31 (75.61) | |
| GFR, MDRD-4,
ml/min | 92.80
(80.7-113.00) | 94.50
(89.30-115.00) | 0.933 |
Allelic and genotypical frequencies of
the studied polymorphisms among patients with T2DM undergoing
metformin treatment
Table II shows the
allelic and genotypic frequencies. P-value for Hardy-Weinberg
equilibrium test was >0.05 across all polymorphisms in every
case, except rs622342.
| Table IIAllele and genotype frequency of
SLC22A1, SLC22A2 and SLC22A3 polymorphisms in
patients with type 2 diabetes mellitus undergoing metformin
treatment. |
Table II
Allele and genotype frequency of
SLC22A1, SLC22A2 and SLC22A3 polymorphisms in
patients with type 2 diabetes mellitus undergoing metformin
treatment.
| Gene | SNP | Genotype | n | Frequency | Allele | n | Frequency | P-value |
|---|
| SLC22A1 | rs72552763 | GAT/GAT | 28 | 0.474 | GAT | 78 | 0.661 | 0.197 |
| |
(c.1260_1262del) | GAT/del | 22 | 0.372 | del | 40 | 0.338 | |
| | | del/del | 9 | 0.152 | | | | |
| | rs622342 | A/A | 25 | 0.423 | A | 69 | 0.584 | 0.009 |
| | (g.160572866) | A/C | 19 | 0.322 | C | 49 | 0.415 | |
| | | C/C | 15 | 0.254 | | | | |
| SLC22A2 | rs316019 | C/C | 52 | 0.881 | C | 110 | 0.932 | 0.133 |
| | (c.808G>T) | C/A | 6 | 0.101 | A | 8 | 0.067 | |
| | | A/A | 1 | 0.016 | | | | |
| SLC22A3 | rs2076828 | C/C | 46 | 0.779 | C | 103 | 0.872 | 0.219 |
| | (g.160451754) | C/G | 11 | 0.186 | G | 15 | 0.127 | |
| | | G/G | 2 | 0.033 | | | | |
HbA1c control associated with SNPs in
SLC22A1, SLC22A2, and SLC22A3
The present study assessed frequency distribution
among patients with controlled (HbA1c <7%) and uncontrolled
(HbA1c ≥7%) T2DM. Frequency distribution based on polymorphism
genotype and dominant genotypic model for every SNP was assessed
but no statistical significance was found (data not shown).
Biomarker values by genotypic
model
Statistical inference across the different SNP
genotypes was performed and SNPs were grouped according to an
individualised genotypic model (Table
III). There were significant differences in HbA1c levels
associated with rs72552763 and rs622342 in SLC22A1; however,
this result did not parallel fasting glucose levels in rs72552763
[GAT/GAT, 103.00 (100.0-133.20), GAT/del: 127.00 (106.00-195.00),
del/del: 127.00 (116.00-146.00)] and rs622342 [A/A: 105.00
(102.00-133.00), A/C: 113.00 (100.00-133.00), C/C: 135.00
(118.50-205.00)]. There was a significant difference between
GAT/del and CC in rs72552763 and rs622342 when respectively
compared with the wild-type genotype (Table III).
| Table IIIHbA1c and fasting glucose levels by
genotype and dominant genotype model. |
Table III
HbA1c and fasting glucose levels by
genotype and dominant genotype model.
| A, Genotype |
|---|
| Gene | SNP | Genotype | NGSP HbA1c (%) | IFCC HbA1c,
mmol/mol | P-value | Fasting glucose,
mg/dl | P-value |
|---|
| SLC22A1 | rs72552763 | GAT/GAT | 6.05
(5.75-6.65) | 42.60
(39.30-49.20) | 0.022a | 103.00
(100.00-133.20) | 0.082 |
| | |
GAT/delc | 6.55
(6.20-9.05) | 48.10
(44.30-75.40) | | 127.00
(106.00-195.00) | |
| | | del/del | 6.50
(6.40-6.80) | 47.50
(46.50-50.80) | | 127.00
(116.00-146.00) | |
| | rs622342 | A/A | 6.00
(5.80-6.50) | 42.10
(39.90-47.50) | 0.009a | 105.00
(102.00-133.00) | 0.086 |
| | | A/C | 6.40
(6.10-7.70) | 46.50
(43.20-60.70) | | 113.00
(100.00-133.00) | |
| | | C/Cc | 6.80
(6.45-9.35) | 50.80
(47.00-78.70) | | 135.00
(118.50-205.00) | |
| SLC22A2 | rs316019 | C/C | 6.40
(5.98-7.15) | 46.50
(41.80-54.60) | 0.609 | 115.00
(101.00-140.00) | 0.313 |
| | | C/A | 6.25
(5.90-7.65) | 44.80
(41.00-60.10) | | 139.00
(107.50-207.20) | |
| | | A/A | 8.10
(8.10-8.10) | 65.00
(65.00-65.00) | | 223.00
(223.00-223.00) | |
| SLC22A3 | rs2076828 | C/C | 6.35
(5.93-6.88) | 45.90
(41.30-51.60) | 0.335 | 115.00
(102.00-152.00) | 0.507 |
| | | C/G | 6.40
(5.95-8.25) | 46.50
(41.50-66.70) | | 107.00
(100.00-167.00) | |
| | | G/G | 8.65
(7.62-9.67) | 71.00
(59.80-82.20) | | 175.00
(151.00-199.00) | |
| B, Dominant
genotype model |
| Gene | SNP | Genotype | NGSP HbA1c (%) | IFCC HbA1c,
mmol/mol | P-value | Fasting glucose
(mg/dl) | P-value |
| SLC22A1 | rs72552763 | GAT/GAT | 6.05
(5.75-6.65) | 42.62
(39.34-49.18) | 0.005b | 103.00
(100.00-133.25) | 0.026b |
| | | GAT/del +
del/del | 6.50
(6.20-8.90) | 47.54
(44.26-73.77) | | 127.00
(107.20-193.00) | |
| | rs622342 | A/A | 6.00.
(5.80-6.50) | 42.08
(39.89-47.54) | 0.010b | 105.00
(102.00-133.00) | 0.155 |
| | | A/C + C/C | 6.50
(6.20-8.52) | 47.54
(44.26-69.67) | | 127.00
(104.00-187.00) | |
| SLC22A2 | rs316019 | C/C | 6.40
(5.97-7.15) | 46.45
(41.80-54.64) | 0.888 | 115.00
(101.00-140.50) | 0.210 |
| | | C/A + A/A | 6.30
(6.00-8.10) | 45.35
(42.08-65.03) | | 157.00
(112.00-223.50) | |
| SLC22A3 | rs2076828 | C/C | 6.35
(5.92-6.87) | 45.90
(41.26-51.64) | 0.355 | 115.00
(102.00-152.00) | 0.815 |
| | | C/G + G/G | 6.60
(6.10-9.20) | 48.63
(43.17-77.05) | | 121.00
(100.00-204.00) | |
Metformin plasmatic concentrations by
genotype and genotypic model
Metformin plasmatic concentrations were assessed
across all four polymorphisms. There were no significant
differences. The dominant genotypic model assessment revealed no
significant difference. There was no significant difference between
SNPs in SLC22A2 and SLC22A3 regarding HbA1c levels
across genotypes. Grouping by dominant genotypic model (GAT/GAT vs.
GAT/del + del/del) revealed significant difference in both HbA1c
(Table III) and fasting glucose
levels, whilst the dominant genotypic model of rs622342 (A/A vs.
A/C+C/C) revealed significant differences only in HbA1c levels, not
in fasting glucose (Table III).
Models applied to rs316019 and rs2076828 yielded no significant
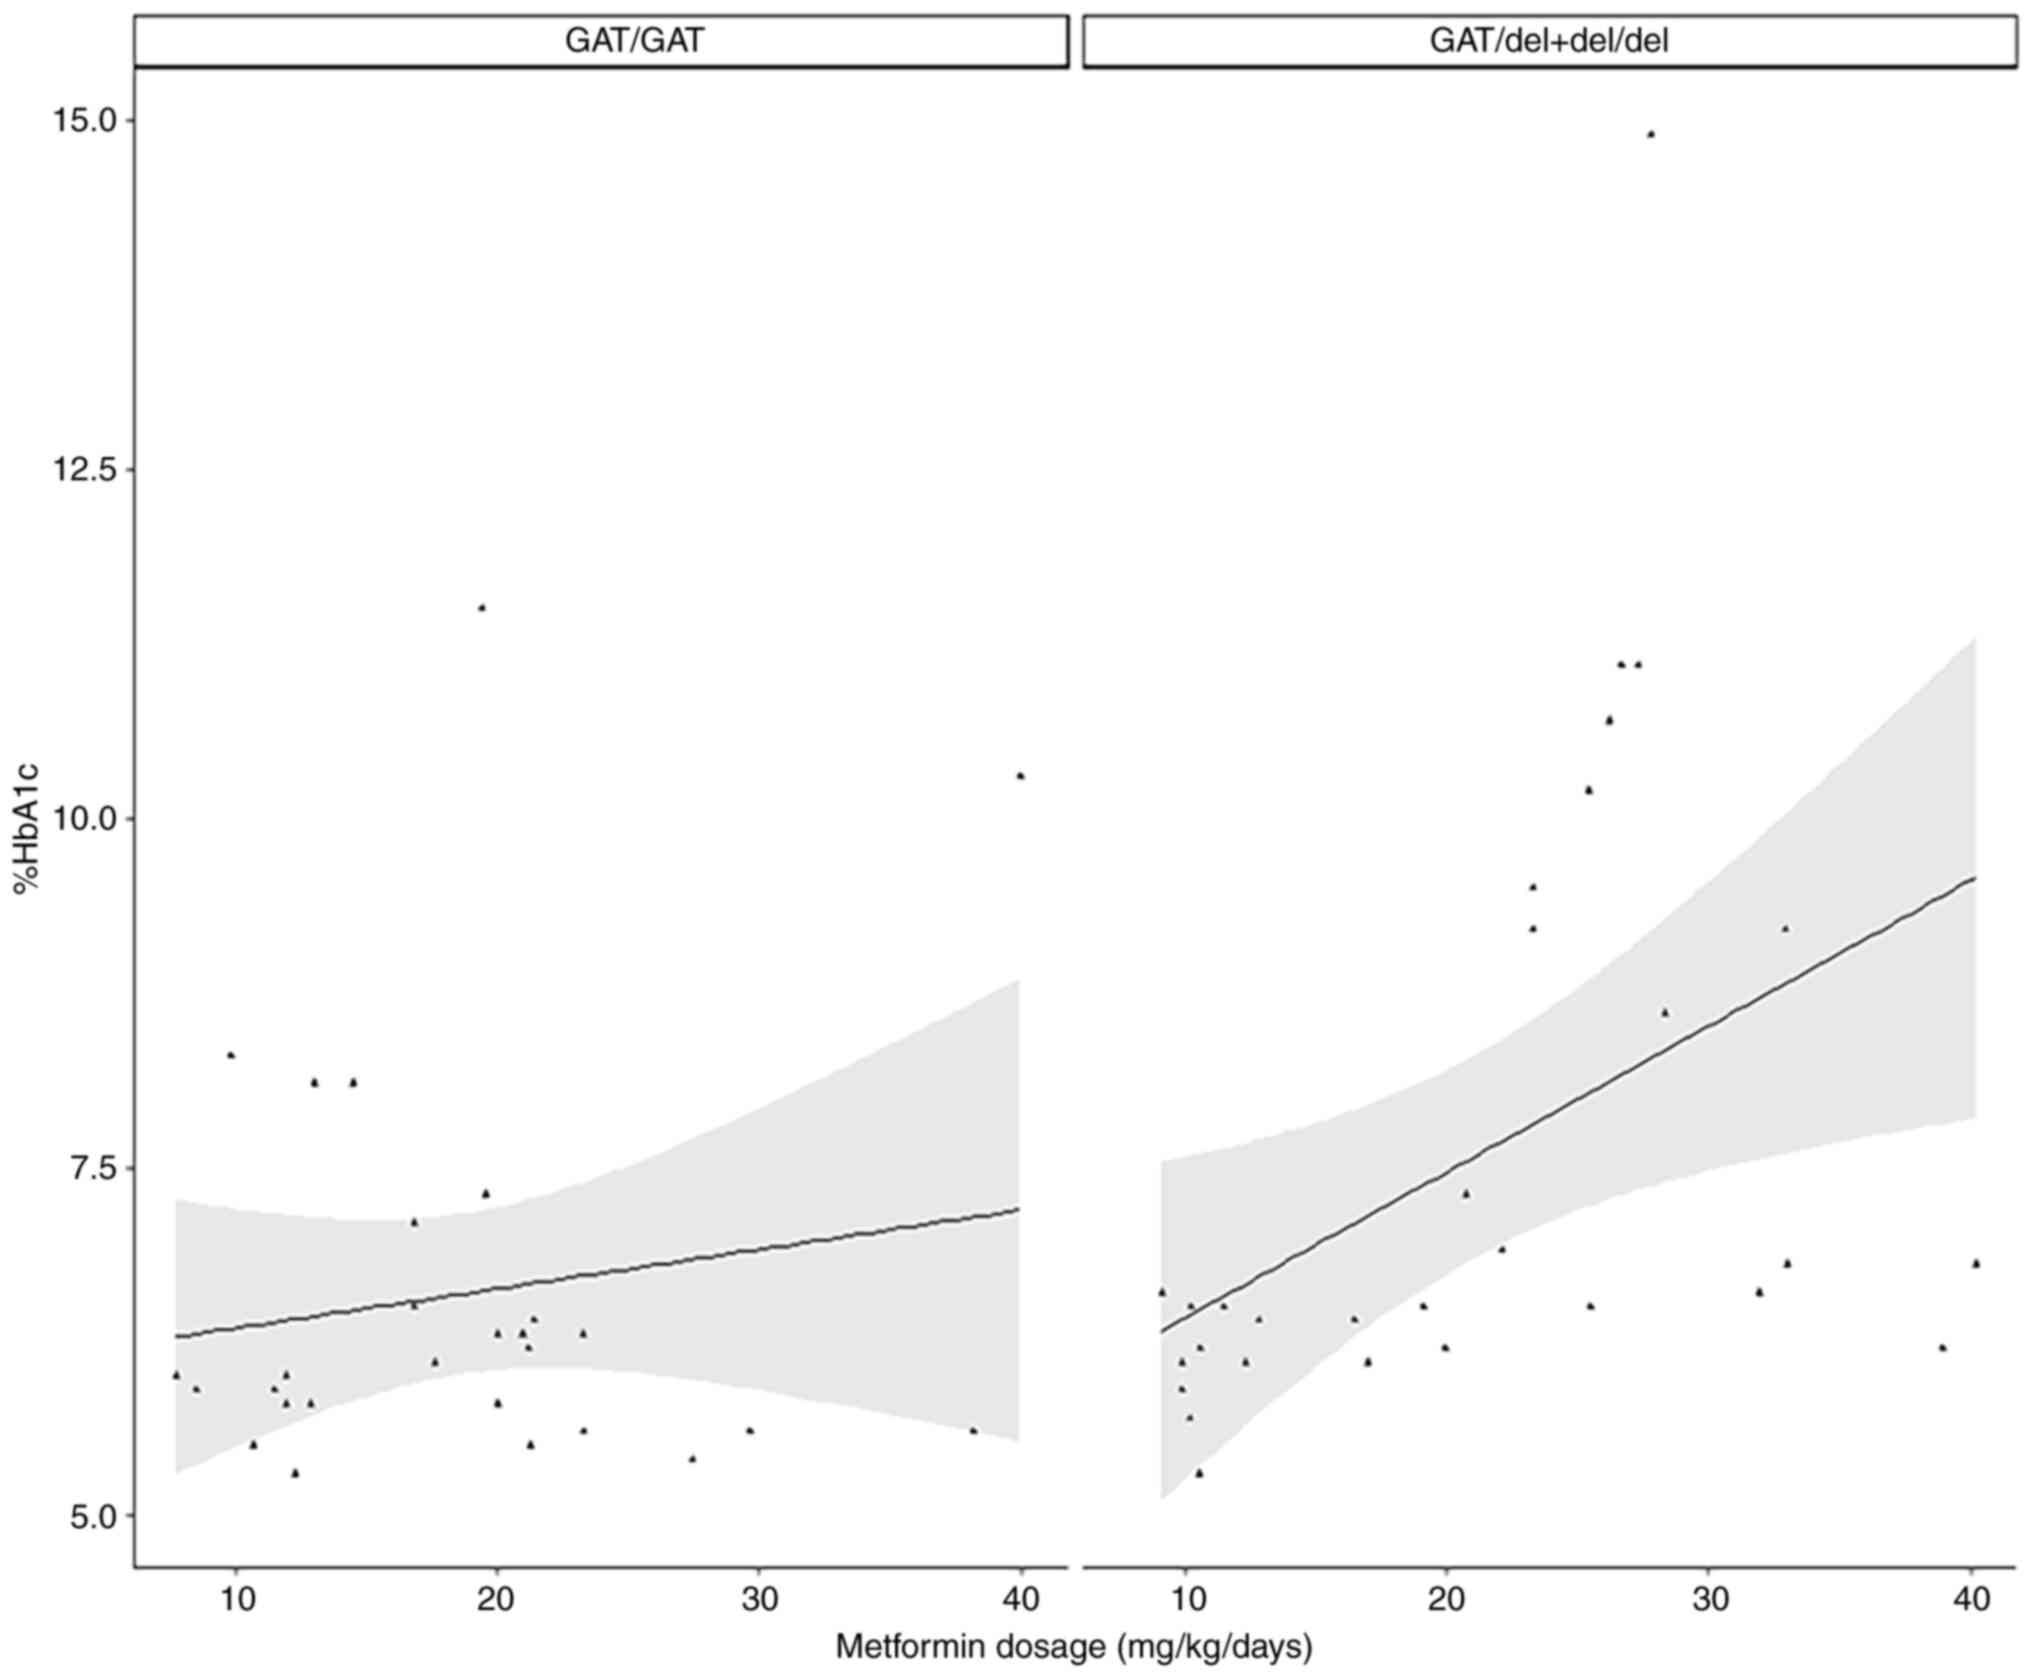
difference. In the GAT/GAT group (n=28), no variable was
significantly associated with %HbA1c, but for GAT/del + del/del
(n=28), metformin dosage was significantly associated with %HbA1c
levels in both the simple and multiple models (Table IV; Fig.
1). Training and testing set groups were created within GAT/GAT
(n=28) and GAT/del + del/del (n=31). Linear regression was
conducted on every group. Cook's distance and leverage revealed
three atypical and influential observations which were eliminated
to prepare the final model on the del allele group (n=28). Linear
regression models in the training set were subjected to the testing
set, yielding predicted values for every patient group (Table V).
| Table IVLinear regression in the dominant
genotypical model of rs72552763 (c.1260_1262del). |
Table IV
Linear regression in the dominant
genotypical model of rs72552763 (c.1260_1262del).
| A, GAT/GAT carriers
(n=28) |
|---|
| | Univariate | Multivariate |
|---|
| Variable | β (95% CI) | P-value | β (95% CI) | P-value |
|---|
| Metformin
concentration | -0.0003 (-0.0015,
0.0008) | 0.549 | -0.0007 (-0.0021,
0.0005) | 0.229 |
| Age | -0.0001 (-0.0494,
0.0490) | 0.994 | 0.0036 (-0.0589,
0.0662) | 0.902 |
| Dosage | 0.0282 (-0.0448,
0.1012) | 0.435 | 0.0677 (-0.0366,
0.1722) | 0.187 |
| BMI | 0.0309 (-0.0564,
0.1183) | 0.472 | 0.0581 (-0.0556,
0.1719) | 0.293 |
| B, GAT/del +
del/del carriers (n=28)a |
| | Univariate | Multivariate |
| Variable | β (95% CI) | P-value | β (95% CI) | P-value |
| Metformin
concentration | 0.0001 (-0.0006,
0.0010) | 0.698 | 0.0001 (-0.0004,
0.0007) | 0.642 |
| Age | -0.0412 (-0.1101,
0.0276) | 0.230 | -0.0144 (-0.0807,
0.0517) | 0.651 |
| Dosage | 0.1436 (0.0742,
0.2130) |
<0.001b | 0.1591 (0.0820,
0.2362) |
<0.001b |
| BMI | 0.0512 (-0.0662,
0.1687) | 0.378 | 0.0760 (-0.0236,
0.1758) | 0.326 |
| Table VMachine learning model summary. |
Table V
Machine learning model summary.
| A, GAT/GAT
(n=28) |
|---|
| Training set
(n=18) | Testing set
(n=10) | Predicted
(n=10) | P-value |
|---|
| 6.25
(5.60-6.92) | 5.95
(5.82-6.07) | 6.32
(6.23-6.37) | 0.365 |
| B, GAT/del +
del/del (n=28) |
| Training set
(n=18) | Testing set
(n=10) | Predicted
(n=10) | P-value |
| 6.55
(6.40-8.27) | 6.45
(6.12-8.55) | 6.63
(6.04-7.58) | 0.599 |
The model assessment detected one atypical but
non-influential value in GAT/GAT, where Shapiro-Wilk residue
distribution was P=0.001 and variance homogeneity was P=0.432. In
GAT/del + del/del, there were detected two atypical but
non-influential values and a plausible influential observation
which was not eliminated due to the sample size. Residue normality
and variance homogeneity were validated. Finally, central tendency
and dispersion measurements of both data sets, as well as predicted
values, were compared using Kruskal-Wallis test, which revealed no
significance in GAT/GAT (P=0.365) or GAT/del + del/del.
Discussion
There are official reports which indicate an HbA1c
non-control prevalence of ~75% among patients with T2DM (15,19);
the present study reported a non-control prevalence of 29.42% among
male and 26.19% among female patients; the difference was not
significant. The present study reported an overall non-control
prevalence of 27.11%, a lower rate compared with ENSANUT
2012(18). ENSANUT reports consider
all people with diabetes undergoing any kind of treatment, not
solely metformin monotherapy. The present data suggested that the
non-controlled proportion of patients receiving metformin
monotherapy was lower than that reported by ENSANUT. This may be
due to the median diagnosis period (3 years) in the present study,
which likely reflects early disease stages. However, according to
central tendency measurements, ≥50% of the population had a BMI
>30 kg/m2, which represents a risk factor
non-controlled T2DM (15,19). OCTs directly affect metformin
pharmacokinetics, since they absorb, distribute and eliminate the
drug (7). Moreover, genetic
variations caused by polymorphisms in SLC22A1,
SLC22A2, and SLC22A3 alter metformin
pharmacokinetics, affecting its hepatic action (7). Polymorphism rs72552763 in
SLC22A1, where 3 bases (ATG) in codon 420 (p.M420del) are
deleted, has been studied in Mexican populations by Reséndiz-Abarca
et al (20) and Menjivar
et al (21). On rs622342
Reséndiz-Abarca et al (20)
found significant differences between genotypes AA, AC, and the
minor allele CC regarding HbA1c among patients treated with
metformin for <3 years. In a linear model association analysis
of rs622342, adjusted by sex, age, disease duration and waist
circumference, there was a significant difference associated with
CC, where HbA1c value (P<0.001) increased after 12 months
(20). Nonetheless, Menjívar et
al (21) investigated
rs72552763 and found no significant difference between fasting
glucose (P=0.368) and HbA1c levels (P=0.181). The aforementioned
study reported differences in rs72552763 genotypic frequencies in
controlled vs. uncontrolled patients depending on HbA1c levels,
respectively: GAT/GAT=33/107, GAT/del=19/39, and del/del=16/16,
(P=0.011). These results differ from the present study, because
there were no significant differences between controlled and
uncontrolled patients across rs72552763 genotypes (P=0.467). The
present analysis of HbA1c suggested lower levels were associated
with GAT/GAT compared with the minor allele. Menjívar et al
(21) included patients undergoing
a combined treatment of metformin and glibenclamide, whereas the
present study included only metformin monotherapy, similar to
Reséndiz-Abarca et al (20).
The present results coincide with Christensen et al
(22), which reported that minor
alleles in SLC22A1 SNPs, including rs72552763, are
associated with a lower steady-state metformin plasma concentration
(P=0.001) and higher HbA1c levels (P=0.043). The present study
analysed metformin plasmatic concentrations; while its median value
was higher for GAT/GAT (504.04; 131.65-900.16 ng/ml), there was no
significant difference compared with deletion carriers of s72552763
(236.4; 86.76-785.24 ng/ml). The Audit trail in Tayside, Scotland
(23), a cohort survey including
1,531 patients treated with metformin, reported that genotypes of
rs72552763 have no effect on HbA1c levels or its decrease after 42
months; however, in the aforementioned study the proportion of
del/del was three times lower than in the present study (4.70 vs.
15.25%). On the other hand, in 2015 Umamaheswaran et al
(24) studied patients with
recently diagnosed T2DM treated with metformin monotherapy,
starting at 500 mg/day, which increased to 2.5 g/day after 12
weeks. Comparison between respondent (HbA1c decrease ≥0.5%) and
non-respondent patients (fasting glucose >180 mg; HbA1c decrease
<1% after 12 weeks) by logistic regression based on AA as the
reference group found that carriers of the minor allele C presented
a greater non-response risk in genotypes AC (P=0.011; OR=3.50;
1.39-8.84 95% CI) and CC (P=0.033; OR=5.60; 1.24-25.80 95% CI). A
dominant genotypic model (AA vs. AC + CC), found that minor allele
C confers greater non-response risk (P=0.003; OR=3.85; 1.61-9.19
95% CI). These results coincide with the present study, which found
higher HbA1c levels in patients carrying the minor allele C of
rs622342 in SLC22A1. Simple linear regression analysis
revealed no association between metformin dosage and %HbA1c levels
in patients carrying GAT/GAT of rs72552763 in SLC22A1.
However, a significant correlation was found for del allele
carriers (GAT/del + del/del). These results suggest that GAT/GAT
patients exhibit stable %HbA1c levels when the metformin dosage
increases, whereas del allele carriers exhibit high %HbA1c levels
in spite of increased metformin intake. These finds concur with our
previous study (15), which
reported higher %HbA1c levels in patients with T2DM carrying the
del allele (P=0.022). In a prospective study conducted on patients
with metformin-treated T2DM from the University Clinical Centre of
Sarajevo, Bosnia-Herzegovina by Dujic et al (25), the number of minor alleles of two
OCT1 SNPs, including rs72552763, was associated with adverse
gastroenteric reaction [OR=2.31 (IC95% 1.07-5.01), P=0.034].
Considering the aforementioned and the present results, rs72552763
minor allele carriers may require higher metformin doses to
effectively regulate HbA1c levels, which fosters adverse reactions.
An in vitro study of mouse hepatocytes by Shu et al
(26) found that OCT1 deletion
(420del) decreases metformin absorption ordinally according to the
number of minor alleles in the rs72552763 genotype, which further
supports the present results. The del minor allele may be
associated with a lower metformin response. To the best of our
knowledge, the present study is the first to combine a machine
learning model with a linear regression to predict HbA1c levels
(affected by metformin daily dosage) in patients grouped according
to a dominant genotypical rs72552763 model. Although there were no
significant differences between the predicted data and the training
and testing sets, the GAT/GAT model revealed one influential value
and residual normality absence. The del allele model detected
neither atypical nor influential values and residues were normally
distributed, but there was variance heterogeneity, which may be a
consequence of the aforementioned atypical and influential
adjustment. Nevertheless, these models approach quantitative
prediction of metformin-affected %HbA1c levels in a patient
population studied through this genotypical model of SNP
rs72552763, which is associated with uptake and response in
metformin monotherapy clinically (15,25)
and in vitro (26). Although
the present sample size is small, the data suggested that
polymorphisms of rs72552763 and rs622342 in SLC22A1 affect
metformin response in patients with T2DM. Longitudinal studies in a
population undergoing metformin monotherapy are necessary to
observe this effect over time. While it is necessary to perform
further studies using different method designs (including
statistical techniques and machine learning), these findings may
support personalised medicine for patients with T2DM.
Supplementary Material
APPENDIX S1
Acknowledgements
Not applicable.
Funding
Funding: The present study was supported by the Research and
Technological Innovation Support Programme (grant no. IN205121) of
the General Directorate for Academic Personnel Support, National
Autonomous University of Mexico, and Extremaduran International
Cooperation Agency for Development, Council of Extremadura, Spain
(‘Hampi-Yachay’ grant no. AEXCID 22IA002).
Availability of data and materials
The data generated in the present study are not
publicly available due to legal constraints but may be requested
from the corresponding author.
Authors' contributions
AOA, CBM, FDA, AL, and JAMG conceived the study,
designed the methodology, analysed data and wrote the manuscript.
AL and JAMG performed experiments. AOA, FDA, AL, and JAMG edited
the manuscript. JAMG and AOA confirm the authenticity of all the
raw data presented in this study. All authors have read and
approved the final manuscript.
Ethics approval and consent to
participate
The present study was conducted in accordance with
the Declaration of Helsinki. Protocol NR-005-2016 was approved on
the 8th of April, 2016 by the Research and Ethics Commissions of
the Hospital Regional de Alta Especialidad de Ixtapaluca, the
Secretary of Health, and the Research Division of Universidad
Nacional Autónoma de México's Faculty of Medicine (approval no.
001/SR/2016). All patients provided written informed consent to
participate. No identifying information, including names, initials,
date of birth, or hospital numbers, images, or statements are
included in the manuscript.
Patient consent for publication
Not applicable.
Competing interests
The authors declare that they have no competing
interests.
References
|
1
|
Standl E, Khunti K, Hansen TB and Schnell
O: The global epidemics of diabetes in the 21st century: Current
situation and perspectives. Eur J Prev Cardiol. 26
(2_suppl):S7–S14. 2019.PubMed/NCBI View Article : Google Scholar
|
|
2
|
Sun H, Pouya P, Karuranga S, Pinkepank M,
Ogurtsova K, Duncan BB, Stein C, Basit A, Chan JCN, Mbanya JC, et
al: IDF DiabetesAtlas:Global, regional and country-level diabetes
prevalence estimates for 2021 and projections for 2045. Diabetes
Res Clin Pract. 183(109119)2022.PubMed/NCBI View Article : Google Scholar
|
|
3
|
Romero-Martínez M, Barrientos-Gutiérrez T,
Cuevas-Nasu L, Bautista-Arredondo S, Colchero A, Gaona-Pineda EB,
Lazcano-Ponce E, Martínez-Barnetche J, Alpuche-Aranda C,
Rivera-Dommarco J and Shamah-Levy T: Metodología de la Encuesta
Nacional de Salud y Nutrición 2020 sobre Covid-19. Salud Publica
Mex. 63:444–451. 2021.PubMed/NCBI View
Article : Google Scholar : (In Spanish).
|
|
4
|
Intensive blood-glucose control with
sulphonylureas or insulin compared with conventional treatment and
risk of complications in patients with type 2 diabetes (UKPDS 33).
UK Prospective Diabetes Study (UKPDS) Group. Lancet. 352:837–853.
1998.PubMed/NCBI
|
|
5
|
American Diabetes Association.
Introduction: Standards of Medical Care in Diabetes-2022. Diabetes
Care. 45 (Suppl 1):S1–S2. 2022.PubMed/NCBI View Article : Google Scholar
|
|
6
|
LaMoia TE and Shulman GI: Cellular and
molecular mechanisms of metformin action. Endocr Rev. 42:77–96.
2021.PubMed/NCBI View Article : Google Scholar
|
|
7
|
Staiger H, Schaeffeler E, Schwab M and
Häring HU: Pharmacogenetics: Implications for modern type 2
diabetes therapy. Rev Diabet Stud. 12:363–376. 2015.PubMed/NCBI View Article : Google Scholar
|
|
8
|
Huang C and Florez JC: Pharmacogenetics in
type 2 diabetes: Potential implications for clinical practice.
Genome Med. 3(76)2011.PubMed/NCBI View
Article : Google Scholar
|
|
9
|
Weizzman Institute of Science: Gene cards
SLC22A1. https://www.genecards.org/cgi-bin/carddisp.pl?gene=SLC22A1.
Accessed July 20, 2023.
|
|
10
|
Koepsell H, Lips K and Volk C:
Polyspecific organic cation transporters: Structure, function,
physiological roles, and biopharmaceutical implications. Pharm Res.
24:1227–1251. 2007.PubMed/NCBI View Article : Google Scholar
|
|
11
|
Lai Y: Organic anion, organic cation and
zwitterion transporters of the SLC22 and SLC47 superfamily (OATs,
OCTs, OCTNs and MATEs). In: Transporters in Drug Discovery and
Development. Woodhead Publishing, Sawston, 2013.
|
|
12
|
Goswami S, Gong L, Giacomini K, Altman RB
and Klein TE: PharmGKB summary: Very important pharmacogene
information for SLC22A1. Pharmacogenet Genomics. 24:324–328.
2014.PubMed/NCBI View Article : Google Scholar
|
|
13
|
Becker ML, Visser LE, van Schaik RHN,
Hofman A, Uitterlinden AG and Stricker BH: Interaction between
polymorphisms in the OCT1 and MATE1 transporter and metformin
response. Pharmacogenet Genomics. 20:38–44. 2010.PubMed/NCBI View Article : Google Scholar
|
|
14
|
World Health Organization (WHO):
Definition and diagnosis of diabetes mellitus and intermediate
hyperglycemia: Report of a WHO/IDF consultation. WHO, Geneva, 2006.
https://iris.who.int/handle/10665/43588. Accessed
April 08, 2024).
|
|
15
|
Ortega-Ayala A, Rodríguez-Rivera NS,
Andrés F, Llerena A, Pérez-Silva E, Espinosa-Sánchez AG and
Molina-Guarneros JA: Pharmacogenetics of metformin transporters
suggests no association with therapeutic inefficacy among diabetes
type 2 mexican patients. Pharmaceuticals (Basel).
15(774)2022.PubMed/NCBI View Article : Google Scholar
|
|
16
|
Health Secretary: Official Mexican
Normative NOM-177-SSA1-2013 [Internet]. DOF2013. http://www.dof.gob.mx/nota_detalle.php?codigo=5314833&fecha=20/09/2013.
Accessed September 17, 2023.
|
|
17
|
US Department of Health and Human
Services, Food and Drug Administration (FDA), Center for Drug
Evaluation and Research (CDER) and Center for Veterinary Medicine
(CVM): Bioanalytical Methods Validation, Guidance for lndustry.
https://www.fda.gov/files/drugs/published/Bioanalytical-Method-Validation-Guidance-for-Industry.pdf.
Accessed May 24, 2018.
|
|
18
|
Shamah Levy T, Cuevas Nasu L, Morales Ruan
MC, Mundo Rosas V, Méndez Gómez-Humarán I and Villalpando Hernández
S: Profile of the health and nutritional status of older adults in
Mexico. 2012 National Health and Nutrition Survey. J Frailty Aging.
2:184–191. 2013.PubMed/NCBI View Article : Google Scholar
|
|
19
|
World Health Organization (WHO): Physical
Status: The Use of and Interpretation of Anthropometry, Report of a
WHO Expert Committee. WHO, Geneva, 1995. https://apps.who.int/iris/handle/10665/37003.
Accessed July 21, 2023.
|
|
20
|
Reséndiz-Abarca CA, Flores-Alfaro E,
Suárez-Sánchez F, Cruz M, Valladares-Salgado A, Del Carmen
Alarcón-Romero L, Wacher-Rodarte NA and Gómez-Zamudio JH: Altered
glycemic control associated with polymorphisms in the SLC22A1
(OCT1) Gene in a Mexican population with type 2 diabetes mellitus
treated with metformin: A cohort study. J Clin Pharmacol.
59:1384–1390. 2019.PubMed/NCBI View Article : Google Scholar
|
|
21
|
Menjivar M, Sánchez-Pozos K,
Jaimes-Santoyo J, Monroy-Escutia J, Rivera-Santiago C, de Los
Ángeles Granados-Silvestre M and Ortiz-López MG: Pharmacogenetic
evaluation of metformin and sulphonylurea response in mexican
mestizos with type 2 diabetes. Curr Drug Metab. 21:291–300.
2020.PubMed/NCBI View Article : Google Scholar
|
|
22
|
Christensen MH, Brasch-Andersenb C, Greene
H, Nielsen F, Damkierc P, Beck-Nielsen H and Brosena K: The
pharmacogenetics of metformin and its impact on plasma metformin
steady-state levels and glycosylated hemoglobin A1c. Pharmacogenet
Genomics. 21:837–850. 2011.PubMed/NCBI View Article : Google Scholar
|
|
23
|
Zhou K, Donnelly LA, Kimber CH, Donnan PT,
Doney AS, Leese G, Hattersley AT, McCarthy MI, Morris AD, Palmer CN
and Pearson ER: Reduced-function SLC22A1 polymorphisms encoding
organic cation transporter 1 and glycemic response to metformin: A
GoDARTS study. Diabetes. 58:1434–1439. 2009.PubMed/NCBI View Article : Google Scholar
|
|
24
|
Umamaheswaran G, Praveen RG, Damodaran SE,
Das AK and Adithan C: Influence of SLC22A1 rs622342 genetic
polymorphism on metformin response in South Indian type 2 diabetes
mellitus patients. Clin Exp Med. 15:511–517. 2015.PubMed/NCBI View Article : Google Scholar
|
|
25
|
Dujic T, Causevic A, Bego T, Malenica M,
Velija-Asimi Z, Pearson ER and Semiz S: Organic cation transporter
1 variants and gastrointestinal side effects of metformin in
patients with type 2 diabetes. Diabet Med. 33:511–514.
2016.PubMed/NCBI View Article : Google Scholar
|
|
26
|
Shu Y, Sheardown SA, Brown C, Owen RP,
Zhang S, Castro RA, Ianculescu AG, Yue L, Lo JC, Burchard EG, et
al: Effect of genetic variation in the organic cation transporter 1
(OCT1) on metformin action. J Clin Invest. 117:1422–1431.
2007.PubMed/NCBI View
Article : Google Scholar
|