Introduction
Type 2 diabetes mellitus (T2DM) is characterized by
sustained insulin resistance, increased insulin levels and chronic
hyperglycemia. It affects 7.7% of adults in developed countries,
with prevalence projected to increase by 20% in developed and 70%
in developing countries by 2030, highlighting its status as a
growing global health concern (1).
Prolonged hyperglycemia causes severe damage to essential organs,
increasing the risk of cardiovascular disease and diabetic
microvascular complications, including atherosclerosis, diabetic
nephropathy, retinopathy and neuropathy (1,2).
Furthermore, hyperglycemia is a key factor linking T2DM with
various types of cancer (3),
including pancreatic, liver, breast, endometrial and colorectal
cancer (4), as hyperglycemia has
been demonstrated to promote the proliferation of cancer cells,
resistance to cell death, and cancer cell migration and invasion
(3). The development of T2DM is
influenced by risk factors, including aging, diet, lifestyle
changes and genetics. In 2007, Sladek et al (5) published the first genome-wide
association study in the field of T2DM genetics, and identified at
least 75 independent genetic loci associated with the disease;
however, to date, there has been little focus on investigating
genetic factors that may associate T2DM with cancer (6).
The protein tyrosine phosphatase non-receptor type 3
(PTPN3) is a non-transmembrane protein tyrosine phosphatase that
serves a role in regulating the membrane cytoskeleton and signal
transduction through the T cell antigen receptor (TCR). It is
involved in the dephosphorylation of the TCR ζ subunit and the
activation of nuclear factor-κB in T cells (7,8). A
previous study showed that PTPN3 influences growth hormone receptor
expression and systemic growth in mice by regulating insulin-like
growth factor 1 secretion (9).
Notably, abnormalities in PTPN3 expression are associated with the
development and progression of numerous types of human cancer. For
example, an increased level of PTPN3 expression was significantly
associated with the differentiation and malignancy of human gastric
adenocarcinoma (10). Furthermore,
Gao et al (11) reported
that activating mutations in PTPN3 gene increase proliferation and
migration in cholangiocarcinoma cells, also noting an accelerated
tumor recurrence in patients with intrahepatic cholangiocarcinoma.
In a study that compared global gene transcript profiles between
insulin-resistant and -sensitive non-diabetic individuals, Elbein
et al (12) found that mRNA
expression of PTPN3 was lower in insulin-resistant individuals
compared with insulin-sensitive counterparts based on subcutaneous
adipose tissue and muscle biopsy sample analyses. Furthermore, a
significant increase in PTPN3 gene expression was observed in
adipose tissues of patients with acromegaly, who exhibited higher
levels of fasting plasma glucose and fasting insulin, and also a
higher homeostasis model assessment-insulin resistance (HOMA-IR)
index (13). Therefore, the present
study aimed to investigate whether variations in PTPN3 genetic
polymorphisms may serve a crucial role in the development of
T2DM.
In the present study, PTPN3 genetic polymorphisms
were examined in blood samples to identify significant differences
between patients with T2DM and healthy control subjects. The
BKS.Cg-Dock7m+/+ Leprdb/JNarl
(db/db) mouse model has been widely used in diabetes
research on the basis of the similarity of its pathological
progression to that of T2DM (14,15).
db/db mice harbor a spontaneous mutation in the leptin
receptor gene (Lepr), which results in leptin resistance (16). Lepr genetic defect leads to
inability to properly regulate energy balance, contributing to
development of obesity, which is a major risk factor for T2DM in
humans (17). By 4-6 weeks of age,
db/db mice exhibit significant hyperphagia, obesity,
hyperglycemia and hyperinsulinemia (18). Furthermore, db/db mice
demonstrate diabetes-associated complications such as diabetic
nephropathy, hepatic steatosis and cardiovascular disease, which
are key for understanding the systemic impacts of T2DM (19). The comprehensive manifestation of
T2DM-associated phenotypes makes db/db mice a robust
preclinical model to investigate mechanisms underlying T2DM.
Therefore, hepatic mRNA and protein levels of PTPN3 were assessed
in both db/db and genotype control mice at 4, 16 and 32
weeks of age to analyze association between PTPN3 expression and
the progression of T2DM.
Materials and methods
Genotype analysis
A total of 469 patients diagnosed with T2DM (age,
40.5-84.0 years; male:female=51.3: 48.7) was enrolled for DNA
genotype analysis through whole blood collection at China Medical
University Hospital in Taichung, Taiwan, between August 2014 and
July 2015. Patients with T2DM were selected according to the
guidelines of the American Diabetes Association, as described
previously (20). Briefly,
diagnosis of diabetes was based on hemoglobin A1c ≥6.5% or fasting
plasma glucose ≥126 mg/dl (7 mmol/l). Fasting was defined as no
caloric intake for at least 8 h or 2-h plasma glucose ≥200 mg/dl
(11.1 mmol/l) in the oral glucose tolerance test or a patient with
classic symptoms of hyperglycemia or hyperglycemic crisis [random
plasma glucose ≥200 mg/dl (11.1 mmol/l)]. Exclusion criteria were
patients diagnosed with T1DM, maturity-onset diabetes of the young,
or gestational diabetes. Genotype frequency data from 1,699 healthy
controls were obtained from the Taiwan Biobank (taiwanview.twbiobank.org.tw). The
single-nucleotide polymorphisms (SNPs) within the PTPN3 gene were
identified using the National Center for Biotechnology Information
SNP database (ncbi.nlm.nih.gov/snp). SNPs were selected using Tagger
function (software.broadinstitute.org/mpg/tagger/server.html;
accessed on 13 Jun 2017) with the additional criteria: i) Threshold
minor allele frequency in the HapMap phase 3 and ii) Han Chinese in
Beijing, China + Japanese in Tokyo, Japan population of 0.05 for
‘tag SNPs’. All the patients signed informed consent forms, and the
study protocol was reviewed and approved by Ethics
Committee/Institutional Review Board of China Medical University
Hospital (approval no. CMUH103-REC2-071).
Animal studies
A total of 24 male db/db mice (weighing 18-20
g (n=12) and +Dock7m/+Dock7m genotype control
counterparts (n=12), all aged 4 weeks, were purchased from the
National Laboratory Animal Center in Taipei, Taiwan. The animals
were maintained in a temperature-controlled environment at 22±2˚C
with 55±10% humidity, a 12/12-h light/dark cycle and had free
access to a standard diet and water. As outlined in our previous
study (21), db/db mice at
the ages of 4, 16 and 32 weeks correspond to early, middle and late
stages of T2DM, respectively. Mice were separated into six groups,
representing three stages of T2DM (early, middle and late) for both
the control and T2DM groups (n=4 mice/group). Blood samples for
glucose measurement were obtained with a volume of 10 µl/mouse from
the tail veins of the mice at the 4th, 16th and 32nd weeks after a
12-h fasting period. Blood glucose levels were measured using a
glucose monitor (ONETOUCH® Ultra Plus Flex™
Meter; ONETOUCH, Inc.). At the end of the procedure, the mice were
euthanized via a gradual introduction of CO2 starting at
30% of the chamber volume/min and increasing to 70% of the chamber
volume/min, until mice were fully unconscious. To confirm death,
cervical dislocation was performed after ensuring that the mice no
longer responded to painful stimuli. Liver tissue was collected for
further analysis. This animal study was approved by the
Institutional Animal Care and Use Committee of China Medical
University (approval no. 104-34-C-1).
Reverse transcription-quantitative
(RT-q)PCR assay
Total RNA was isolated from liver tissues using
RNeasy® mini kit (Qiagen GmbH). cDNA synthesis was
performed using a RevertAid™ First Strand cDNA Synthesis
kit (Thermo Fisher Scientific, Inc.) following the manufacturer's
instructions. cDNA was subjected to RT-qPCR analysis using an ABI
ViiA™ 7 RT-PCR system (Thermo Fisher Scientific Inc.)
with TaqMan® fluorophore-based probes (Thermo Fisher
Scientific, Inc.) and universal probe #1 (cat. no. 04684974001;
Roche Diagnostics). The primer sequences for PTPN3 (NM_011207.2)
were as follows: forward, 5'-GAATGTTCTCTCTCAGTACTGGACTC-3' and
reverse, 5'-CCTTTTTGCAATATTGGTTATTTACA-3'. GAPDH (M32599.1) served
as the internal control, with probe #29 (cat. no. 04687612001). The
GAPDH primer sequences were as follows: forward,
5'-GAGCCAAACGGGTCATCA-3' and reverse strand,
5'-CATATTTCTCGTGTTCACACC-3'. Thermocycling conditions were as
follows: Initial denaturation at 95˚C for 5 min, followed by 25
cycles of 95˚C for 10 sec, 56˚C for 10 sec and 72˚C for 20 sec, and
final extension at 72˚C for 5 min. The PCR data for PTPN3 were
normalized to the GAPDH threshold cycle value and quantified using
the comparative threshold cycle 2-ΔΔCq method (22).
Western blot analysis
Frozen liver tissue (150 mg) was homogenized in 3 ml
ice-cold 10 mM phosphate lysis buffer containing 0.25 M sucrose (pH
7.0), 1 mM EDTA, 0.1 mM PMSF and 1 mM sodium azide. The homogenate
was centrifuged at 20,000 x g for 30 min at 4˚C. The protein
concentration was determined using BCA assay. Subsequently, 40
µg/lane protein was separated by 8% SDS-PAGE and transferred to
PVDF membranes. The PVDF membranes were incubated in 5% non-fat dry
milk dissolved in Tris-buffered saline containing 0.1% TBS-T) at
room temperature for 1 h to block non-specific binding. The
membranes were incubated overnight at 4˚C with primary antibodies
against PTPN3 (1:1,000; cat. no. GTX54572; GeneTex, Inc.) and
secondary antibodies (1:5,000; cat. nos. #31430 and #31460; Thermo
Fisher Scientific, Inc.) at room temperature for 1 h. The signals
were visualized using an Enhanced Chemiluminescence kit (GE
Healthcare) following the manufacturer's protocol, analyzed with
ImageQuant 5.2 software (GE Healthcare), and normalized using
β-actin (1:5,000; cat. no. ab8226; Abcam) as the internal
control.
Immunohistochemistry (IHC) staining
analysis
Liver IHC staining was performed using a Leica Bond
MAX automated immunostainer (Leica Microsystems, Inc.) as
previously described (21).
Briefly, tissue sections were dewaxed and treated with 3%
H2O2 at room temperature for 10 min for
blocking, followed by overnight incubation at 4˚C with a specific
rabbit anti-human PTPN3 antibody (1:100; cat. no. GTX54572;
GeneTex, Inc.). The sections were treated with a goat anti-rabbit
HRP polymer (1:500; cat. no. #31460; Thermo Fisher Scientific,
Inc.) for 30 min at room temperature. Chromogen visualization was
achieved using DAB for 5 min, and the staining was observed under a
light microscope (Leica DM 1000 LED Lab microscope; cat. no.
10052-384; Leica Microsystems, Inc.) at 100x and 400x
magnifications.
Statistical analysis
Genotype and allele frequencies of the PTPN3 SNPs
rs75235286 and rs17202062 between patients with T2DM and healthy
controls were assessed using χ2 test. Additionally, 95%
confidence intervals for the odds ratios were calculated for the
genotype and allele frequencies of PTPN3 SNPs rs75235286 and
rs17202062. Data are presented as the mean ± SD of three
independent experimental repeats. Differences were evaluated using
one-way ANOVA followed by post hoc least significant difference
test. Statistical analyses were performed using IBM SPSS Statistics
27.0 (IBM Corp.). P<0.05 was considered to indicate a
statistically significant difference.
Results
Higher allelic frequency of PTPN3 SNPs
rs75235286 and rs17202062 in patients with T2DM
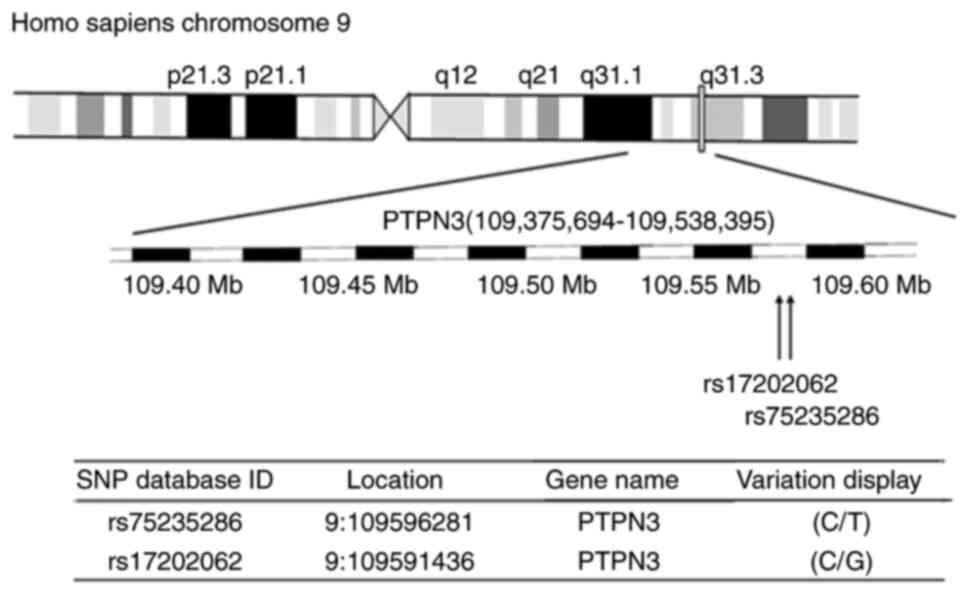
A comparative analysis between SNPs in the PTPN3
gene of patients with T2DM and healthy control subjects revealed
allele C at the rs75235286 site, and allele G at the rs17202062
site, within the chromosome region 9q31.3 of the PTPN3 gene
(Fig. 1). Variants rs75235286 and
rs17202062 were identified within chromosome region 9q31.1-9q31.3
in the PTPN3 gene (Fig. 1). Allele
C frequency in the rs75235286 SNP of PTPN3 was significantly higher
among patients with T2DM (82.1%; 770/938) compared with healthy
controls (79.1%; 2688/3398; Table
I). Similarly, the allele G frequency in rs17202062 SNP of
PTPN3 among patients with T2DM (82.8%; 775/936) was significantly
higher compared with that in healthy controls (79.5%; 2,698/3,392).
However, the genotype frequencies for rs75235286 and rs17202062 SNP
did not exhibit significant differences between the T2DM and
healthy control groups.
 | Table IGenotypic and allelic frequencies of
PTPN3 genetic polymorphisms in patients with T2DM and healthy
controls. |
Table I
Genotypic and allelic frequencies of
PTPN3 genetic polymorphisms in patients with T2DM and healthy
controls.
| dbSNP ID | Genotype | Patients with T2DM
(n=469) (%) | Healthy controls
(n=1,699) (%) | OR (95% CI) | P-value |
|---|
| rs75235286 | CC | 320 (68.2) | 168 (17.9) | 1.23
(0.73-2.06) | 0.095 |
| | CT | 130 (27.7) | 554 (32.6) | 0.96
(0.56-1.65) | |
| | TT | 19 (4.1) | 78 (4.6) | Ref | |
| | C | 770 (82.1) | 2,688 (79.1) | 1.21
(1.00-1.46) | 0.044 |
| | T | 168 (17.9) | 710 (20.9) | | |
| rs17202062 | CC | 17 (3.6) | 76 (4.5) | 0.74
(0.43-1.28) | 0.075 |
| | CG | 127 (27.1) | 542 (32.0) | 0.78
(0.62-0.98) | |
| | GG | 324 (69.2) | 1,078 (63.6) | Ref | |
| | C | 161 (17.2) | 694 (20.5) | 0.81
(0.67-0.98) | 0.027 |
| | G | 775 (82.8) | 2,698 (79.5) | Ref | |
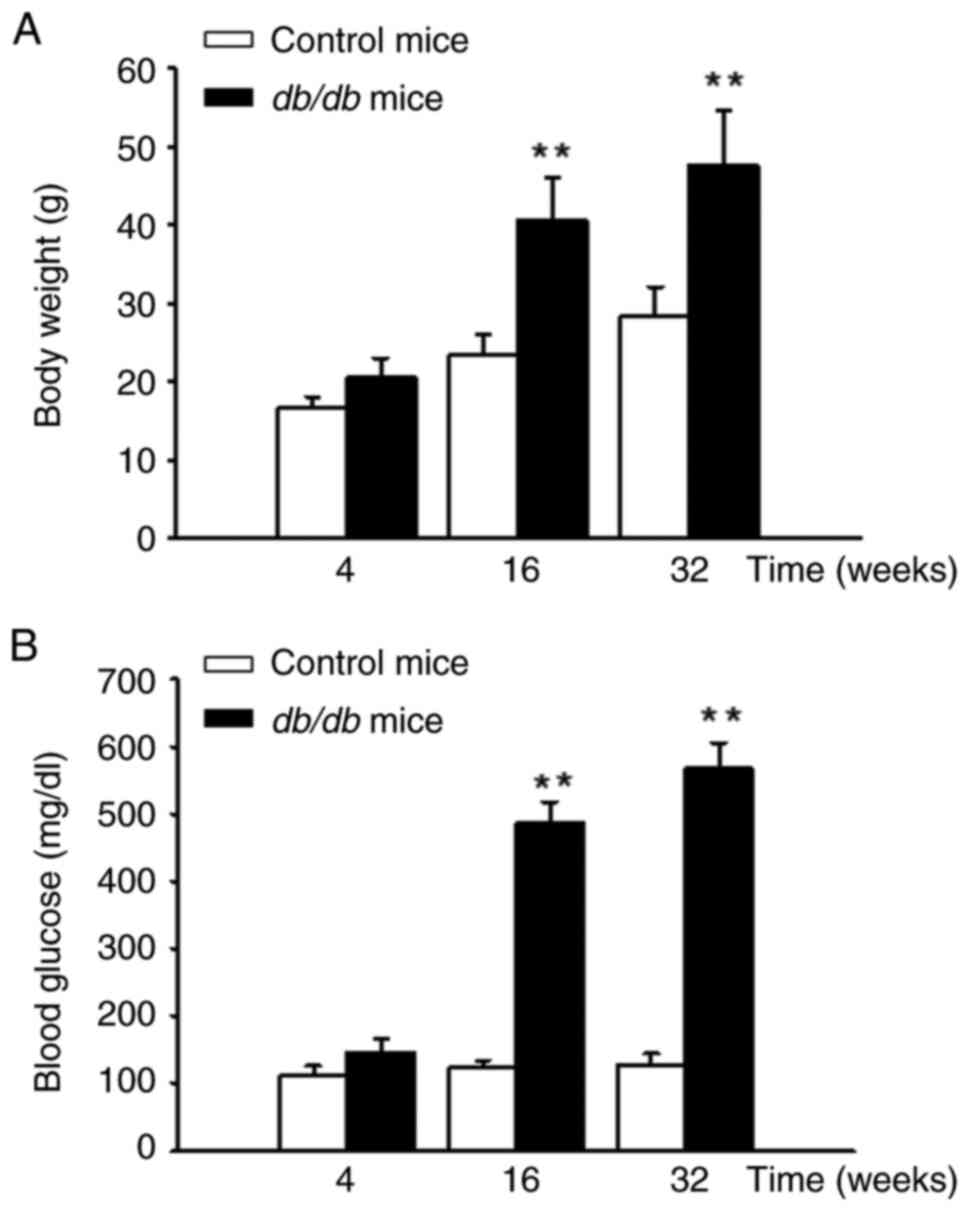
Significant increases in body weight
and blood glucose levels in db/db mice compared to controls
mice
The db/db mice exhibited a significant
increase in body weight compared with the control group (Fig. 2A) at 16 and 32 weeks. Additionally,
blood glucose levels in the db/db mice were significantly
elevated from the 4th to the 32nd week. By the 32nd week, the blood
glucose levels in db/db mice were >500 mg/dl (Fig. 2B).
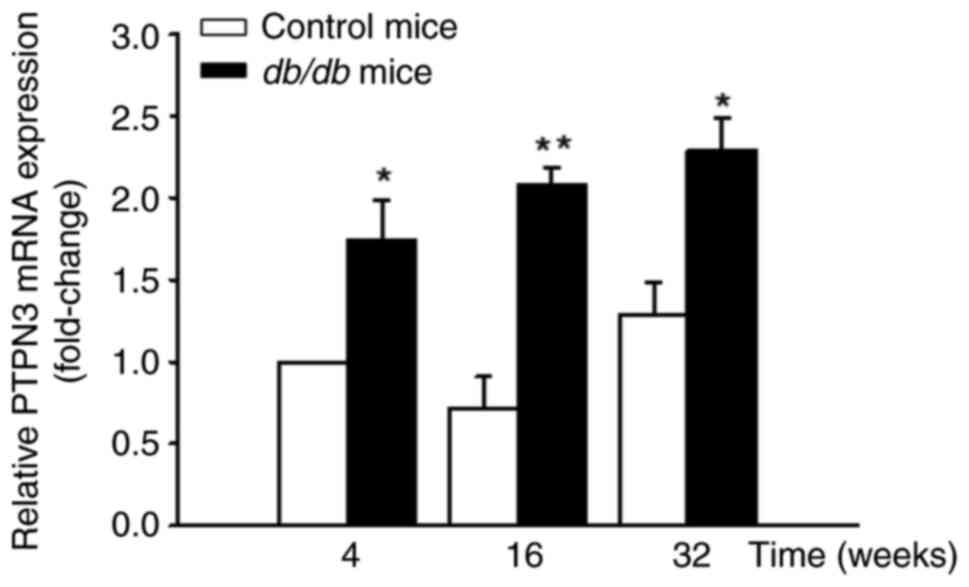
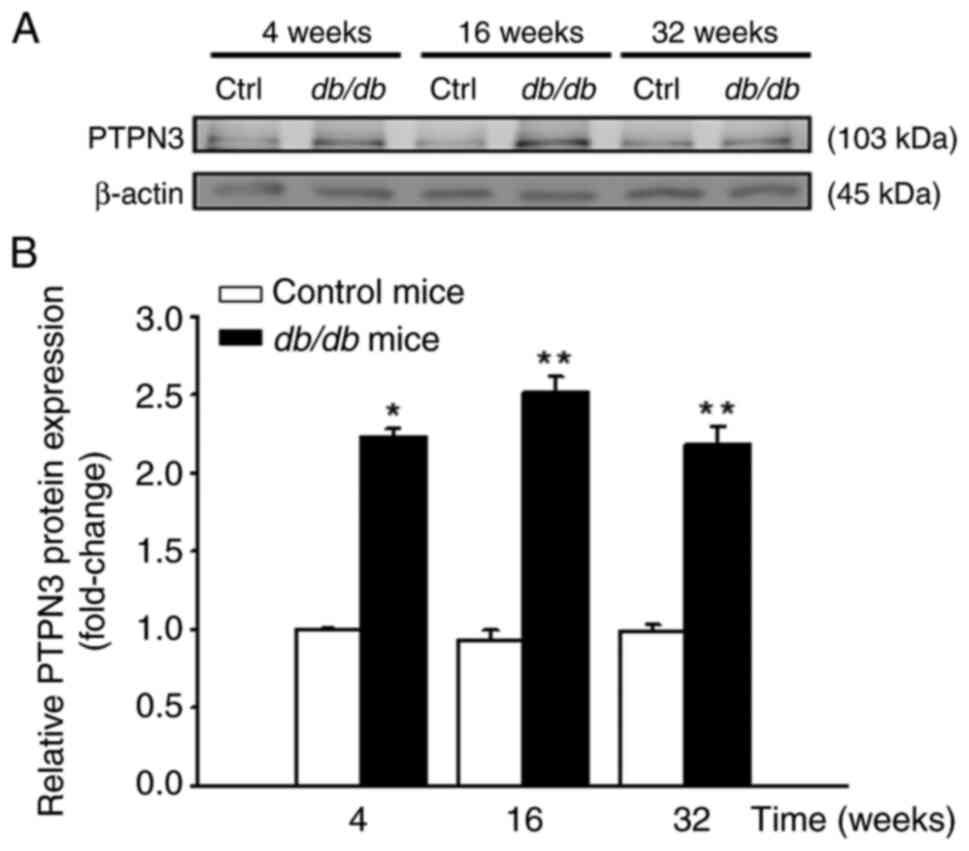
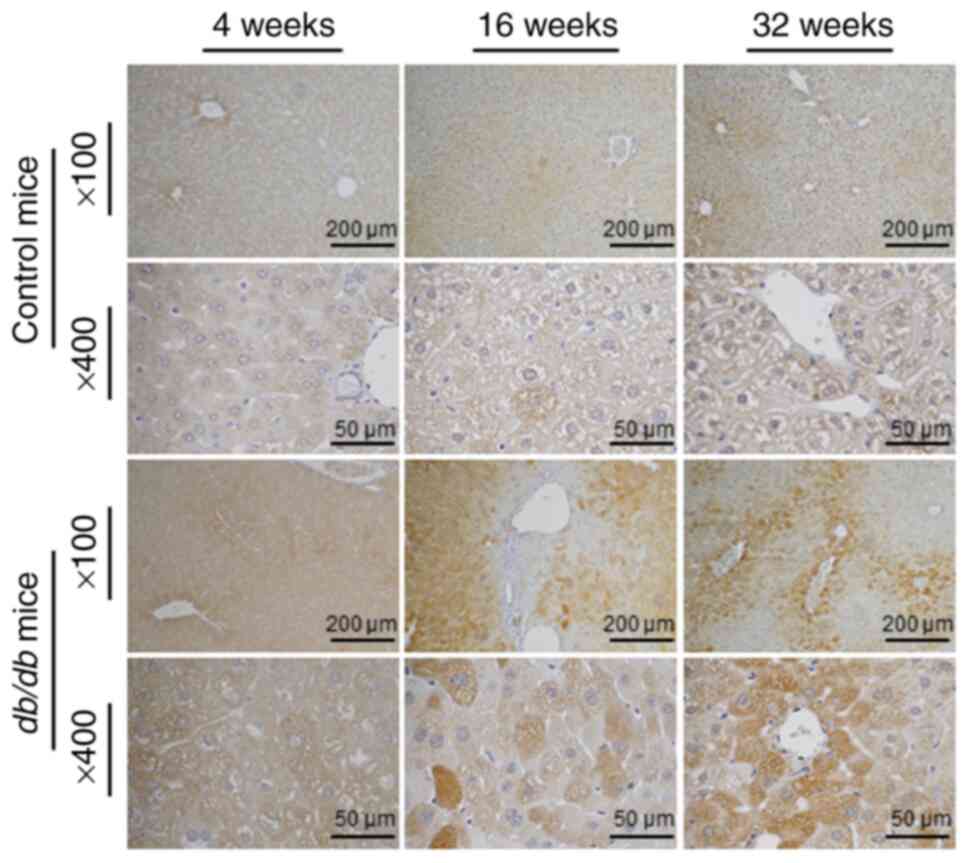
Elevated hepatic PTPN3 mRNA and
protein expression in db/db mice
Hepatic mRNA levels of PTPN3 were significantly
higher in db/db mice compared with the control mice
(Fig. 3). Similarly, PTPN3 protein
levels were significantly higher in liver tissues of db/db
compared with control mice (Fig.
4). IHC staining data demonstrated a marked increase in hepatic
PTPN3 expression in db/db mice compared to control mice.
This increase was consistently observed across all evaluated time
points, with clear localization of PTPN3 staining predominantly in
hepatocytes. The intensity and extent of PTPN3 staining were
visibly greater in db/db mice, indicating an upregulation of
the protein in response to the diabetic condition. The most
pronounced difference was observed at 32 weeks; db/db mice
showed strong, widespread PTPN3 staining, whereas control mice
exhibited minimal staining levels (Fig.
5).
Discussion
T2DM is a multifaceted metabolic disorder with a
notable genetic predisposition; understanding the role of
epigenetic modifications is key in T2DM research. Additionally,
there is a well-established connection between T2DM and development
of cancer (23,24). Given the frequent occurrence of
cancer in individuals with diabetes, it is essential to investigate
the potential factors that connect these diseases. Several
contributing elements, such as poor glycemic control, dyslipidemia
and elevated levels of insulin-like growth factors, influence both
T2DM and cancer development (4).
Additionally, these factors adversely impact the effectiveness of
cancer treatment. In the present study, patients with T2DM and
db/db mice, a widely used T2DM animal model (14,15,25),
exhibited increased levels of PTPN3 gene expression. As the PTPN3
gene is associated with a higher incidence of different types of
cancer (10,11), an elevated expression of PTPN3 in
T2DM may represent another crucial pathological connection between
T2DM and cancer. To the best of our knowledge, the present study is
the first to support this.
PTPN3 gene encodes the PTPN3 protein, which is an
enzyme that is involved in cellular signaling pathways that
regulate various processes, including cell proliferation,
differentiation, mitosis, and potentially, oncogenic transformation
(26). Hochberg et al
(13) suggested that patients with
acromegaly with higher PTPN3 expression in adipose tissues exhibit
elevated fasting plasma glucose levels and fasting insulin levels
and higher HOMA-IR scores compared with patients with
non-functioning pituitary adenoma. PTPN3 is associated with growth
hormone signaling and may perform a role in glucose homeostasis
(9,27). Therefore, its upregulation may
affect pathological development of T2DM. Additionally, this enzyme
is involved in regulation of the plasma membrane cytoskeleton,
TCR-associated signal transduction and T cell activation (7,8). A
recent study has reported on the critical role of PTPN3 in
modulating immune responses in cancer, especially via influencing
the production of cytokines such as IL-6 and tumor necrosis
factor-α (TNF-α) (28).
Additionally, poorly regulated glucose metabolism and hyperglycemia
in diabetic patients are often associated with higher levels of
chronic inflammatory markers, including IL-1β, IL-6 and TNF-α
(29-31).
Immune response activation contributes to the development and
progression of cancer cells (32).
Based on the aforementioned findings, it was hypothesized that an
increased expression of PTPN3 in patients with T2DM may lead to an
imbalance in the immune system. This imbalance may disrupt
regulation of both inflammatory and anti-inflammatory responses,
potentially accelerating progression of T2DM. The present results
do not align with the findings of Elbein et al (12), which indicated that PTPN3 expression
is downregulated in both adipose and muscle tissues of
insulin-resistant individuals, highlighting its potential role in
insulin resistance and metabolic regulation pathways, it is
important to consider that the therapeutic approach for patients
with T2DM with elevated PTPN3 expression may require some
adjustment. Further studies, including animal and clinical studies,
are key to explore the effects of increased PTPN3 expression on
pathological progression of T2DM.
Yin et al (33) demonstrated that p38γ promotes
dephosphorylation of epidermal growth factor receptor via
activating PTPN3 and silencing the p38γ/c-Jun/PTPN3 signaling
pathway increases sensitivity of K-Ras mutant cells to tyrosine
kinase inhibitors. Similarly, Gao et al (11) found that patients with intrahepatic
cholangiocarcinoma with higher PTPN3 protein levels have increased
recurrence rates of cancer. These findings suggested that PTPN3
requires co-factors such as p38γ to mediate its oncogenic effects.
Furthermore, PTPN3 expression is markedly increased in cisplatin-
and doxorubicin-resistant ovarian cancer cells and silencing PTPN3
restored drug-sensitivity and inhibited cancer cell migration,
stemness and tumorigenicity (34).
Individuals with T2DM are at heightened risk for various types of
cancers and encounter additional challenges due to elevated PTPN3
levels, which are exacerbated by p38γ-induced phosphorylation. This
not only increases cancer risk but also promotes drug resistance,
complicating treatment. Strategies targeting PTPN3 or its
phosphorylation pathway must address both diabetes and related
oncogenic risks, while balancing effectiveness and safety.
Therefore, medical strategies that focus on decreasing PTPN3
expression or p38γ-induced phosphorylation of PTPN3 could be
beneficial for patients with T2DM with high PTPN3 levels. These
approaches may decrease cancer incidence and improve drug
resistance in this population. The present study primarily focused
on the significant increase in PTPN3 expression in diabetic
patients and db/db mice and the mechanistic role of PTPN3 in
cancer development was not directly examined herein. However,
previous studies support the involvement of PTPN3 in oncogenesis:
PTPN3 mutations could promote tumor proliferation and migration in
cholangiocarcinoma (11) and Wu
et al (10) demonstrated
that PTPN3 overexpression is associated with malignancy in gastric
adenocarcinoma and with drug resistance in various types of cancer
cell. Future studies should explore the functional role of PTPN3 in
cancer development in patients with T2DM, including the effect on
tumor growth and cancer-associated signaling pathways in diabetic
models with elevated PTPN3 expression.
A limitation of the present study is the absence of
comprehensive clinicopathological data for T2DM patients involved.
This lack of information could introduce biases in interpreting the
association between PTPN3 expression and the progression of T2DM.
However, to reduce these potential biases, the study was designed
with strict inclusion criteria, focusing solely on genetic
polymorphism analysis and using a well-defined control group from
the Taiwan Biobank. For future research, it is essential to include
clinicopathological data such as age, BMI, disease stage and
duration to clarify the role of PTPN3 in T2DM pathology and its
potential association with cancer risk. Additionally, future
studies should incorporate western blot analysis to measure PTPN3
levels in serum proteins from patients with T2DM and healthy
controls to confirm the results obtained from the db/db
mouse model and establish the association between PTPN3 expression
and clinical outcomes. Furthermore, examining the expression of
PTPN3 in additional tissue samples, such as adipose and muscle
tissues, may reveal its broader impact on systemic effects of T2DM,
demonstrating the association between T2DM, PTPN3 expression and
cancer, potentially guiding therapeutic developments.
In conclusion, in the present study, expression of
PTPN3 gene and protein was significantly elevated in patients with
T2DM and db/db mice. Upregulated PTPN3 may contribute to
progression of diabetic complications, cancer and drug resistance
in patients with T2DM due to its interactions with other molecules,
such as p38γ. The present findings suggest that the role of PTPN3
gene warrants further investigation.
Acknowledgements
Not applicable.
Funding
Funding: The present study was supported by Chung Shan Medical
University, Taichung, Taiwan (grant no. RD11211) and China Medical
University (grant no. CMU110-N-30).
Availability of data and materials
The data generated in the present study may be
requested from the corresponding author.
Authors' contributions
SYC, RYT and CCC performed the experiments and wrote
the manuscript. SYC and CCC confirm the authenticity of all raw
data. TJT analyzed data and constructed the figures. SYC and CCC
conceived the study. All authors have read and approved the final
manuscript.
Ethics approval and consent to
participate
The present study was approved by Ethics
Committee/Institutional Review Board of China Medical University
Hospital (approval no. CMUH103-REC2-071). Additionally, the animal
study was approved by the Institutional Animal Care and Use
Committee of China Medical University (approval no. 104 34 C
1).
Patient consent for publication
Not applicable.
Competing interests
The authors declare that they have no competing
interests.
Use of artificial intelligence tools
During the preparation of this work, AI tools were
used to improve the readability and language of the manuscript or
to generate images, and subsequently, the authors revised and
edited the content produced by the AI tools as necessary, taking
full responsibility for the ultimate content of the present
manuscript.
References
|
1
|
Gray SP and Jandeleit-Dahm K: The
pathobiology of diabetic vascular complications-cardiovascular and
kidney disease. J Mol Med (Berl). 92:441–452. 2018.PubMed/NCBI View Article : Google Scholar
|
|
2
|
Faselis C, Katsimardou A, Imprialos K,
Deligkaris P, Kallistratos M and Dimitriadis K: Microvascular
complications of type 2 diabetes mellitus. Curr Vasc Pharmacol.
18:117–124. 2020.PubMed/NCBI View Article : Google Scholar
|
|
3
|
Ryu TY, Park J and Scherer PE:
Hyperglycemia as a risk factor for cancer progression. Diabetes
Metab J. 38:330–336. 2014.PubMed/NCBI View Article : Google Scholar
|
|
4
|
Wojciechowska J, Krajewski W, Bolanowski
M, Kręcicki T and Zatoński T: Diabetes and cancer: A review of
current knowledge. Exp Clin Endocrinol Diabetes. 124:263–275.
2016.PubMed/NCBI View Article : Google Scholar
|
|
5
|
Sladek R, Rocheleau G, Rung J, Dina C,
Shen L, Serre D, Boutin P, Vincent D, Belisle A, Hadjadj S, et al:
A genome-wide association study identifies novel risk loci for type
2 diabetes. Nature. 445:881–885. 2007.PubMed/NCBI View Article : Google Scholar
|
|
6
|
Vincent EE and Yaghootkar H: Using
genetics to decipher the link between type 2 diabetes and cancer:
Shared aetiology or downstream consequence? Diabetologia.
63:1706–1717. 2020.PubMed/NCBI View Article : Google Scholar
|
|
7
|
Han S, Williams S and Mustelin T:
Cytoskeletal protein tyrosine phosphatase PTPH1 reduces T cell
antigen receptor signaling. Eur J Immunol. 30:1318–1325.
2000.PubMed/NCBI View Article : Google Scholar
|
|
8
|
Young JA, Becker AM, Medeiros JJ, Shapiro
VS, Wang A, Farrar JD, Quill TA, van Huijsduijnen RH and van Oers
NSC: The protein tyrosine phosphatase PTPN4/PTP-MEG1, an enzyme
capable of dephosphorylating the TCR ITAMs and regulating
NF-kappaB, is dispensable for T cell development and/or T cell
effector functions. Mol Immunol. 45:3756–3766. 2008.PubMed/NCBI View Article : Google Scholar
|
|
9
|
Pilecka I, Patrignani C, Pescini R,
Curchod ML, Perrin D, Xue Y, Yasenchak J, Clark A, Magnone MC,
Zaratin P, et al: Protein-tyrosine phosphatase H1 controls growth
hormone receptor signaling and systemic growth. J Biol Chem.
282:35405–35415. 2007.PubMed/NCBI View Article : Google Scholar
|
|
10
|
Wu CW, Chen JH, Kao HL, Li AFY, Lai CH,
Chi C and Lin WC: PTPN3 and PTPN4 tyrosine phosphatase expression
in human gastric adenocarcinoma. Anticancer Res. 26:1643–1649.
2006.PubMed/NCBI
|
|
11
|
Gao Q, Zhao YJ, Wang XY, Guo WJ, Gao S,
Wei L, Shi JY, Shi GM, Wang ZC, Zhang YN, et al: Activating
mutations in PTPN3 promote cholangiocarcinoma cell proliferation
and migration and are associated with tumor recurrence in patients.
Gastroenterology. 146:1397–1407. 2014.PubMed/NCBI View Article : Google Scholar
|
|
12
|
Elbein SC, Kern PA, Rasouli N,
Yao-Borengasser A, Sharma NK and Das SK: Global gene expression
profiles of subcutaneous adipose and muscle from glucose-tolerant,
insulin-sensitive, and insulin-resistant individuals matched for
BMI. Diabetes. 60:1019–1029. 2011.PubMed/NCBI View Article : Google Scholar
|
|
13
|
Hochberg I, Tran QT, Barkan AL, Saltiel
AR, Chandler WF and Bridges D: Gene expression signature in adipose
tissue of acromegaly patients. PLoS One.
10(e0129359)2015.PubMed/NCBI View Article : Google Scholar
|
|
14
|
Ohno T, Shimizu M, Shirakami Y, Baba A,
Kochi T, Kubota M, Tsurumi H, Tanaka T and Moriwaki H: Metformin
suppresses diethylnitrosamine-induced liver tumorigenesis in obese
and diabetic C57BL/KsJ-+Leprdb/+Leprdb mice. PLoS One.
10(e0124081)2015.PubMed/NCBI View Article : Google Scholar
|
|
15
|
Guest PC and Rahmoune H: Characterization
of the db/db mouse model of type 2 diabetes. Methods Mol Biol.
1916:195–201. 2019.PubMed/NCBI View Article : Google Scholar
|
|
16
|
Chen H, Charlat O and Tartaglia LA:
Genetics of leptin and obesity: db/db mice as a model for human
obesity. Nat Rev Genet. 13:145–155. 2012.
|
|
17
|
Chua SC, White DW and Wu-Peng XS:
Phenotype of fatty liver and diabetes in leptin receptor-deficient
db/db mice. J Clin Invest. 97:1258–1264. 1996.
|
|
18
|
King AJ: The use of animal models in
diabetes research. Br J Pharmacol. 166:877–894. 2012.PubMed/NCBI View Article : Google Scholar
|
|
19
|
Sharma K and Ziyadeh FN: Hyperglycemia and
diabetic complications: The role of TGF-β in the pathogenesis of
diabetic nephropathy. Kidney Int. 48 (Suppl 52):S7–S10. 1995.
|
|
20
|
American Diabetes Association. Diagnosis
and classification of diabetes mellitus. Diabetes Care. 33 (Suppl
1):S62–S69. 2010.PubMed/NCBI View Article : Google Scholar
|
|
21
|
Tang YH, Wang YH, Chen CC, Chan CJ, Tsai
FJ and Chen SY: Genetic and functional effects of adiponectin in
type 2 diabetes mellitus development. Int J Mol Sci.
23(13544)2022.PubMed/NCBI View Article : Google Scholar
|
|
22
|
Huang TH, Chen CC, Liu HM, Lee TZ and
Shieh SH: Resveratrol pretreatment attenuates concanavalin
A-induced hepatitis through reverse of aberration in the immune
response and regenerative capacity in aged mice. Sci Rep.
7(2705)2017.PubMed/NCBI View Article : Google Scholar
|
|
23
|
Giovannucci E, Harlan DM, Archer MC,
Bergenstal RM, Gapstur SM, Habel LA, Pollak M, Regensteiner JG and
Yee D: Diabetes and cancer: A consensus report. CA Cancer J Clin.
60:207–221. 2010.PubMed/NCBI View Article : Google Scholar
|
|
24
|
Bonagiri PR and Shubrook JH: Review of
associations between type 2 diabetes and cancer. Clin Diabetes.
38:256–265. 2020.PubMed/NCBI View Article : Google Scholar
|
|
25
|
Bogdanov P, Corraliza L, Villena JA,
Carvalho AR, Garcia-Arumí J, Ramos D, Ruberte J, Simó R and
Hernández C: The db/db mouse: A useful model for the study of
diabetic retinal neurodegeneration. PLoS One.
9(e97302)2014.PubMed/NCBI View Article : Google Scholar
|
|
26
|
Tonks NK and Neel BG: Combinatorial
control of the specificity of protein tyrosine phosphatases. Curr
Opin Cell Biol. 13:182–195. 2001.PubMed/NCBI View Article : Google Scholar
|
|
27
|
Nishad R, Mukhi D, Menon RK and Pasupulati
AK: Growth hormone and metabolic homeostasis. EMJ Diabet. 6:78–87.
2018.
|
|
28
|
Iwamoto N, Onishi H, Masuda S, Imaizumi A,
Sakanashi K, Morisaki S, Nagao S, Koga S, Ozono K, Umebayashi M, et
al: PTPN3 inhibition contributes to the activation of the dendritic
cell function to be a promising new immunotherapy target. J Cancer
Res Clin Oncol. 149:14619–14630. 2023.PubMed/NCBI View Article : Google Scholar
|
|
29
|
Stentz FB, Umpierrez GE, Cuervo R and
Kitabchi AE: Proinflammatory cytokines, markers of cardiovascular
risks, oxidative stress, and lipid peroxidation in patients with
hyperglycemic crises. Diabetes. 53:2079–2086. 2004.PubMed/NCBI View Article : Google Scholar
|
|
30
|
Lee H, Kim MJ, Lee IK, Hong CW and Jeon
JH: Impact of hyperglycemia on immune cell function: A
comprehensive review. Diabetol Int. 15:745–760. 2024.PubMed/NCBI View Article : Google Scholar
|
|
31
|
Pickup JC: Inflammation and activated
innate immunity in the pathogenesis of type 2 diabetes. Diabetes
Care. 27:813–823. 2004.PubMed/NCBI View Article : Google Scholar
|
|
32
|
Chang SC and Yang WCV: Hyperglycemia,
tumorigenesis, and chronic inflammation. Crit Rev Oncol Hematol.
108:146–153. 2016.PubMed/NCBI View Article : Google Scholar
|
|
33
|
Yin N, Lepp A, Ji Y, Mortensen M, Hou S,
Qi XM, Myers CR and Chen G: The K-Ras effector p38γ MAPK confers
intrinsic resistance to tyrosine kinase inhibitors by stimulating
EGFR transcription and EGFR dephosphorylation. J Biol Chem.
292:15070–15079. 2017.PubMed/NCBI View Article : Google Scholar
|
|
34
|
Zhou Z, Lin Z, Wang M, Wang L, Ji Y, Yang
J, Yang Y, Zhu G and Liu T: Identification and verification of
PTPN3 as a novel biomarker in predicting cancer prognosis,
immunity, and immunotherapeutic efficacy. Eur J Med Res.
29(12)2024.PubMed/NCBI View Article : Google Scholar
|