Introduction
Parkinson's disease (PD) is a neurodegenerative
disease that affects the dopaminergic (DA) neurons in the
nigrostriatal circuit of the basal ganglia. The etiology of PD is
complex and involves gene-environment interactions that interfere
with cellular function. The main risk factors for PD are ageing,
mitochondrial dysfunction, aggregation of α-synuclein, proteotoxic
stress and oxidative stress (1-3).
Current treatments for PD, such as medicine, brain surgery and
supportive treatment, primarily focus on symptom management
(4,5). Although gene therapy is a promising
therapeutic approach under evaluation, many challenges remain
(6,7). At present, PD is still difficult to
treat. Therefore, it is important to explore specific pathways that
can target disease progression.
The DNA binding protein zinc finger with KRAB and
SCAN domains 3 (ZKSCAN3) is a transcriptional repressor of many
autophagy-related genes, including LC3 and WIPI2(8). ZKSCAN3 plays an important role in the
progression of PD. It has been reported that in the PD model, the
A30P mutant α-synuclein is more prone to oligomerization than the
wild-type α-synuclein. It activates ZKSCAN3 in a JNK-dependent
manner to promote its nuclear translocation, thus inhibiting the
autophagy of dopaminergic neurons (9). ZKSCAN3 knockout induces autophagy and
promotes lysosomal biogenesis and ZKSCAN3 overexpression reduces
sirolimus-induced autophagy.
ZKSCAN3, an antagonist of transcription factor EB
(TFEB), can regulate the autophagy-lysosome pathway (10). Lysosomes play crucial roles in PD
(11). More than two-thirds of
lysosomal storage diseases involve dysfunction of the central
nervous system (12). Lysosomal
dysfunction and the accumulation of undegraded autophagosomes in
neurons were observed in PD patients and an animal model. The
lysosomal Ca2+ channel mucolipin 1 (MCOLN1) and
lysosomal potassium ion channel TMEM175 affect the
autophagy-mediated degradation of α-synuclein oligomers (13,14).
It was hypothesized that ZKSCAN3 affects the occurrence and
development of PD through TFEB-mediated autophagy-lysosome pathway.
Studies on the function of the ZKSCAN3-mediated autophagy-lysosome
pathway are helpful for identifying the potential pathological
mechanism of PD.
Materials and methods
Reagents
6-hydroxydopamine (6-OHDA; cat. no. HY-B1081;
MedChemExpress), overexpression vector (Jiangxi Zvast-Biotechnology
Co.). Primary antibodies: Rabbit anti-ZKSCAN3 (1:1,000; cat. no.
DF7752; Affinity Biosciences), rabbit anti-transcription factor EB
(1:1,000; TFEB; cat. no. AF7015; Affinity Biosciences), rabbit
anti-Beclin-1 (1:500; cat. no. AF5128; Affinity Biosciences),
rabbit anti-LC3 I/II (1:1,000; cat. no. 12741T; Cell Signaling
Technology), rabbit anti-α-synuclein (1:500; cat. no. AF0402;
Affinity Biosciences), rabbit anti-lysosomal-associated membrane
protein 1 (1:1,000; Lamp-1; cat. no. 21997-1-AP, Proteintech),
mouse Anti-β-Actin (1:2,000; cat. no. HC201; TransGen Biotech).
Secondary antibodies: HRP conjugated Goat Anti-Mouse IgG (H+L;
1:2,000; cat. no. GB23301; Wuhan Servicebio Technology Co., Ltd.),
HRP conjugated Goat Anti-Rabbit IgG (H+L; 1:2,000; cat. no.
GB23303; Wuhan Servicebio Technology Co., Ltd.). LysoTracker Red
(cat. no. C1046; Beyotime Institute of Biotechnology) and Hoechst
33342 (cat. no. C1026; Beyotime Institute of Biotechnology) were
used. ZKSCAN3 overexpression vector was constructed by cloning the
CDS of ZKSCAN3 into VP001-CMV-MCS-EF1-ZsGreen-T2A-PURO lentivirus
vector (General Biol (Anhui) Co., Ltd.). TFEB overexpression vector
was constructed by cloning the CDS of TFEB into pcDNA3.1(+).
Cell transfection
The SH-SY5Y cell line was obtained from Procell Life
Science & Technology Co., Ltd. (cat. no. CL-0208). The short
tandem repeat (STR) profiling method was used for the
authentication of the SH-SY5Y cell line. The cells were prepared
for transfection when the cell density reached 70%. The cell
culture medium was replaced with 1 ml of serum-free medium. A total
of 125 µl of Opti-MEM was added to two sterilized EP tubes.
Lipofectamine 3000® (Invitrogen; Thermo Fisher
Scientific, Inc.; 5 µl) was added to one EP tube and 12.5 µl of
siRNA (125 µl/1OD) was added to the other EP tube. The sequences of
siRNAs used in the present study are shown in Table I. After incubation at room
temperature for 5 min, the reagents in the two EP tubes were mixed
and incubated at room temperature for 15 min. The mixture was added
to a 6-well plate, after which the cells were placed in the
incubator. At 6 h later, 1 ml of complete culture medium
supplemented with 20% serum was added to each well of the 6-well
plate. At 48 h later, the cells were collected for testing.
 | Table ISequences of siRNAs used in the
present study. |
Table I
Sequences of siRNAs used in the
present study.
| Name | Sequences |
|---|
| siRNA-NC |
UUCUCCGAACGUGUCACGUTT |
| |
ACGUGACACGUUCGGAGAATT |
| ZKSCAN3 siRNA-1 |
GAGAAGCCAUGUAGGGAAATT |
| |
UUUCCCUACAUGGCUUCUCTT |
| ZKSCAN3 siRNA-2 |
CAGAGAAGAUAAAGUGGUATT |
| |
UACCACUUUAUCUUCUCUGTT |
| ZKSCAN3 siRNA-3 |
AUGGAAAGCCAGUUGGAAATT |
| |
UUUCCAACUGGCUUUCCAUTT |
| TFEB siRNA |
CUGAAAUGCAGAUGCCCAATT |
| |
UUGGGCAUCUGCAUUUCAGTT |
CCK8 assay
The cells were digested, resuspended, counted and
seeded at a density of 500 cells per well. The cells were treated
for 24 h when they had adhered to the wall of the plate. The media
in the 96-well plate was replaced with fresh culture media (100 µl
per well). CCK8 reagent (10 µl) was added to each well and
incubated at 37˚C for 2 h. The absorbance value of each well was
detected at a wavelength of 450 nm using a microplate reader.
Reverse transcription-quantitative
(RT-q) PCR
Cells (5x10⁵) were collected and lysed
with TRIzol® reagent. Total RNA was extracted for
concentration and purity determination. cDNA was synthesized via
the use of a reverse transcription HiFiScript cDNA first strand
synthesis kit. RT-qPCR was performed using the ChamQ Universal SYBR
qPCR Master Mix (cat. no. Q711-02; Vazyme Biotech Co., Ltd.) and
conducted on a fluorescence quantitative PCR instrument. RNA
extraction, cDNA synthesis, and qPCR were performed according to
the manufacturers' protocols. The thermocycling conditions were:
Initial denaturation at 95˚C for 10 min, followed by 40 cycles of
95˚C for 10 sec, 58˚C for 30 sec and 72˚C for 30 sec, and final
extension at 72˚C for 10 min. β-actin was used as the internal
reference. The relative expression levels of genes were calculated.
The primers used are shown in Table
II. These experiments were replicated for 3 times. The relative
gene expression was calculated using the 2-ΔΔCq method
(15).
| Table IIPrimers used in the present study. |
Table II
Primers used in the present study.
| Primer name | Sequences
(5'-3') |
|---|
| β-actin forward |
TGGCACCCAGCACAATGAA |
| β-actin reverse | CTAAGTCATAGTCCGCCTAGA
AGCA |
| Beclin-1 forward |
TCCCGTGGAATGGAATGAGA |
| Beclin-1 reverse |
GTAAGGAACAAGTCGGTATCT CTG |
| LC3A forward |
CTCAGACCGGCCTTTCAAGC |
| LC3A reverse |
GCTCGATGATCACCGGGATTT |
| LC3B forward |
CATCCAACCAAAATCCCGGT |
| LC3B reverse |
GAGCTGTAAGCGCCTTCTAA |
| α-synuclein
forward |
TGTTGGAGGAGCAGTGGTGA |
| α-synuclein
reverse |
GGCATTTCATAAGCCTCATTG TC |
| Lamp-1 forward |
GAAGGACAACACGACGGTGA |
| Lamp-1 reverse |
CGCGTTGCACTTGTAGGAAT |
Western blotting
RIPA cell lysis buffer (cat. no. C1053; Applygen
Technologies Inc.) was added to the cells or tissues, which were
placed on ice for 15 min and then centrifuged at 13,523 x g at 4˚C
for 10 min. The supernatant was collected and the protein
concentration was determined via a BCA protein quantification kit.
The samples (50 µg) were loaded and subjected to 5% SDS-PAGE at 60V
and 80V for 120 min. The sponge, filter paper, gel, membrane,
filter paper and sponge were placed in sequence, followed by
membrane transfer at 300 mA. Proteins were blocked at 37˚C with 3%
skimmed milk in 1X TBST (0.1% Tween-20) for 1 h. The PVDF membrane
was incubated with the primary antibodies at 4˚C overnight. After
being washed with 1X TBST 3 times, the PVDF membrane was incubated
with the secondary antibodies at 37˚C for 2 h. The membrane was
subsequently washed with 1X TBST 3 times. SuperSignal west pico
chemiluminescent substrate (Thermo Fisher Scientific Inc.) was then
added and the membranes were placed in an ultrahigh-sensitivity
chemiluminescence imaging system for image development. Band
density was analyzed using the Image-Pro Plus software (version
6.0; Media Cybernetics, Inc.).
Transmission electron microscopy
The cells were fixed with 2.5% glutaraldehyde,
washed with PBS three times and fixed with 1% osmium acid at 4˚C
for 2 h. After dehydration with graduated alcohol and acetone, the
cells were embedded with Spurr812 epoxy resin by immersion in 1:3,
1:1, and 3:1 solutions of resin in acetone at room temperature for
2 h, 3 h and overnight respectively. The cell clumps were placed
into the embedding mold, the embedding agent was added and the
samples were then subjected to solidification by heating. The
samples were sectioned at 70-90 nm with an ultrathin slicer (Leica
UC 7; Leica Microsystems GmbH). Then, double staining was performed
with 2% uranium acetate and lead citrate at room temperature for 30
min. The cells were observed under a transmission electron
microscope (JEM-1230; 80 KV; JEOL Ltd.).
Lysosome staining
The cell culture solution was discarded and diluted
LysoTracker Red working solution (1:2,000) was added to the Petri
dish and incubated at 37˚C for 30 min. The medium was then
discarded and Hoechst 33342 staining solution was added. The
stained sample was fully covered and incubated at 37˚C in darkness
for 20-30 min. Then, the cells were observed and images were
collected under a fluorescence microscope (BX53; Olympus
Corporation). The nucleus stained with Hoechst 33342 was blue and
the nucleus labelled with LysoTracker Red was red.
Statistical analysis
SPSS 20.0 software (IBM Corp.) was used for
statistical analysis. All the experiments were repeated three times
and the quantitative results are expressed as the means ± standard
deviations. Comparisons of data between two groups were conducted
via independent unpaired sample t-tests, whereas comparisons
between multiple groups were conducted via one-way ANOVA. The
subsequent pairwise comparison was conducted via Tukey's test.
P<0.05 was considered to indicate a statistically significant
difference.
Results
Selection of the 6-OHDA
concentration
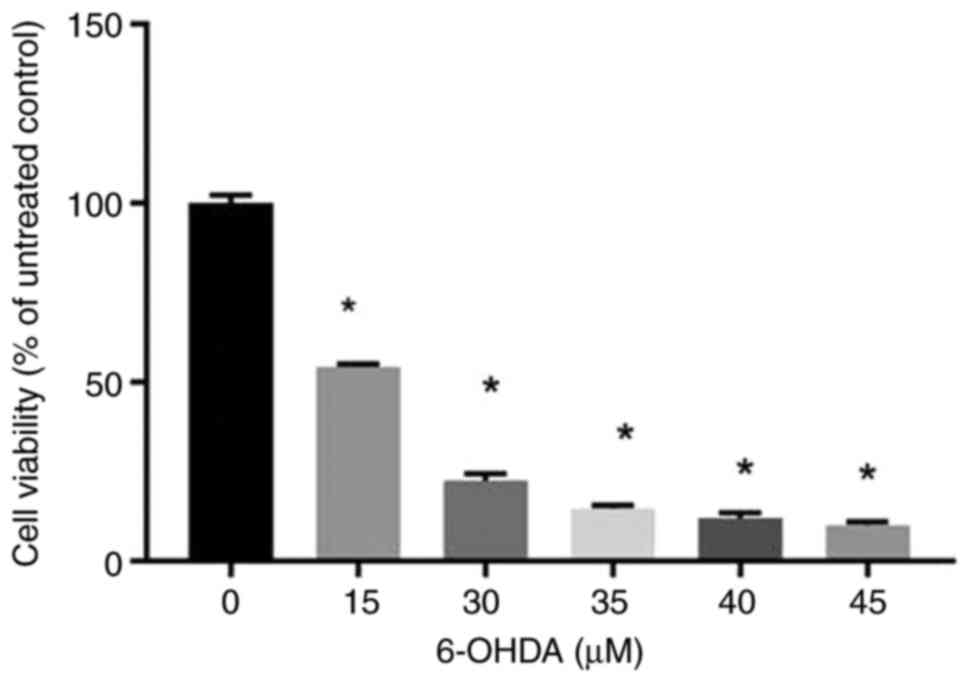
The CCK-8 results revealed that cell proliferation
decreased significantly when the cells were treated with 6-OHDA at
concentrations of ≥15 µM (Fig. 1).
The cell viability was decreased to <50% when cells were treated
with 6-OHDA >15 µM, making it difficult to conduct normal
experiments. Therefore, 15 µM was selected as the modelling
concentration.
Verification of ZKSCAN3 interference
and overexpression
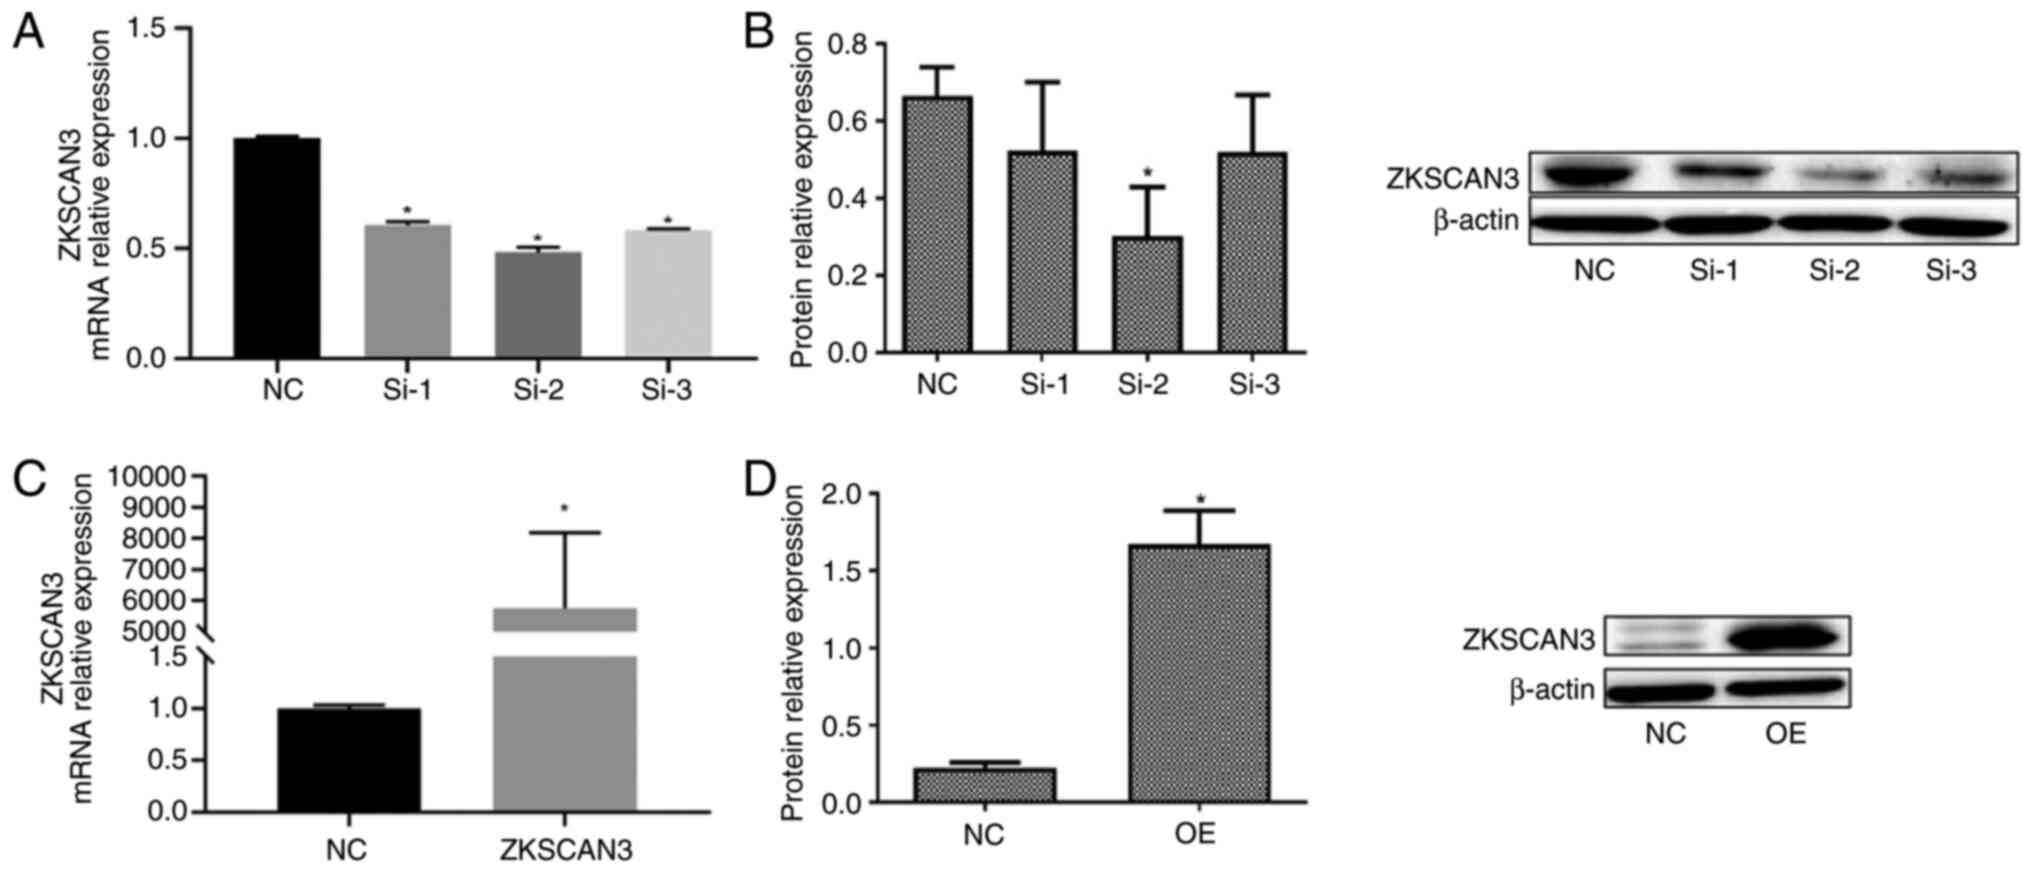
The RT-qPCR results revealed that, following
transfection of the three interference vectors, the mRNA expression
of ZKSCAN3 was significantly lower than that in the negative
control (NC) group. The siRNA-2 vector had the most significant
effect (Fig. 2A). Compared with the
NC group, the ZKSCAN3-overexpressing group showed a significant
increase in ZKSCAN3 mRNA expression (Fig. 2C). The western blotting results
revealed that, after transfection with the three interference
vectors, the protein expression of ZKSCAN3 was reduced compared
with that in the NC group. The siRNA-2 vector had the most
significant effect (Fig. 2B).
Compared with the NC group, the overexpression group showed a
significant increase in ZKSCAN3 protein expression (Fig. 2D).
Effect of ZKSCAN3 on the expression of
LC3, α-synuclein, Lamp-1 and Beclin-1 in a PD cell model
The RT-qPCR results revealed that, compared with the
NC group, the model group showed increased LC3A expression, whereas
the expression of Beclin-1 and LC3B was decreased. Compared with
the model group, the ZKSCAN3 overexpression group showed
significant decreases in Beclin-1 and LC3A and an increase in LC3B.
Compared with the interference control group, the ZKSCAN3
interference group showed an increased expression of LC3A,
α-synuclein and Lamp-1 and decreased expression of LC3B (Fig. 3A).
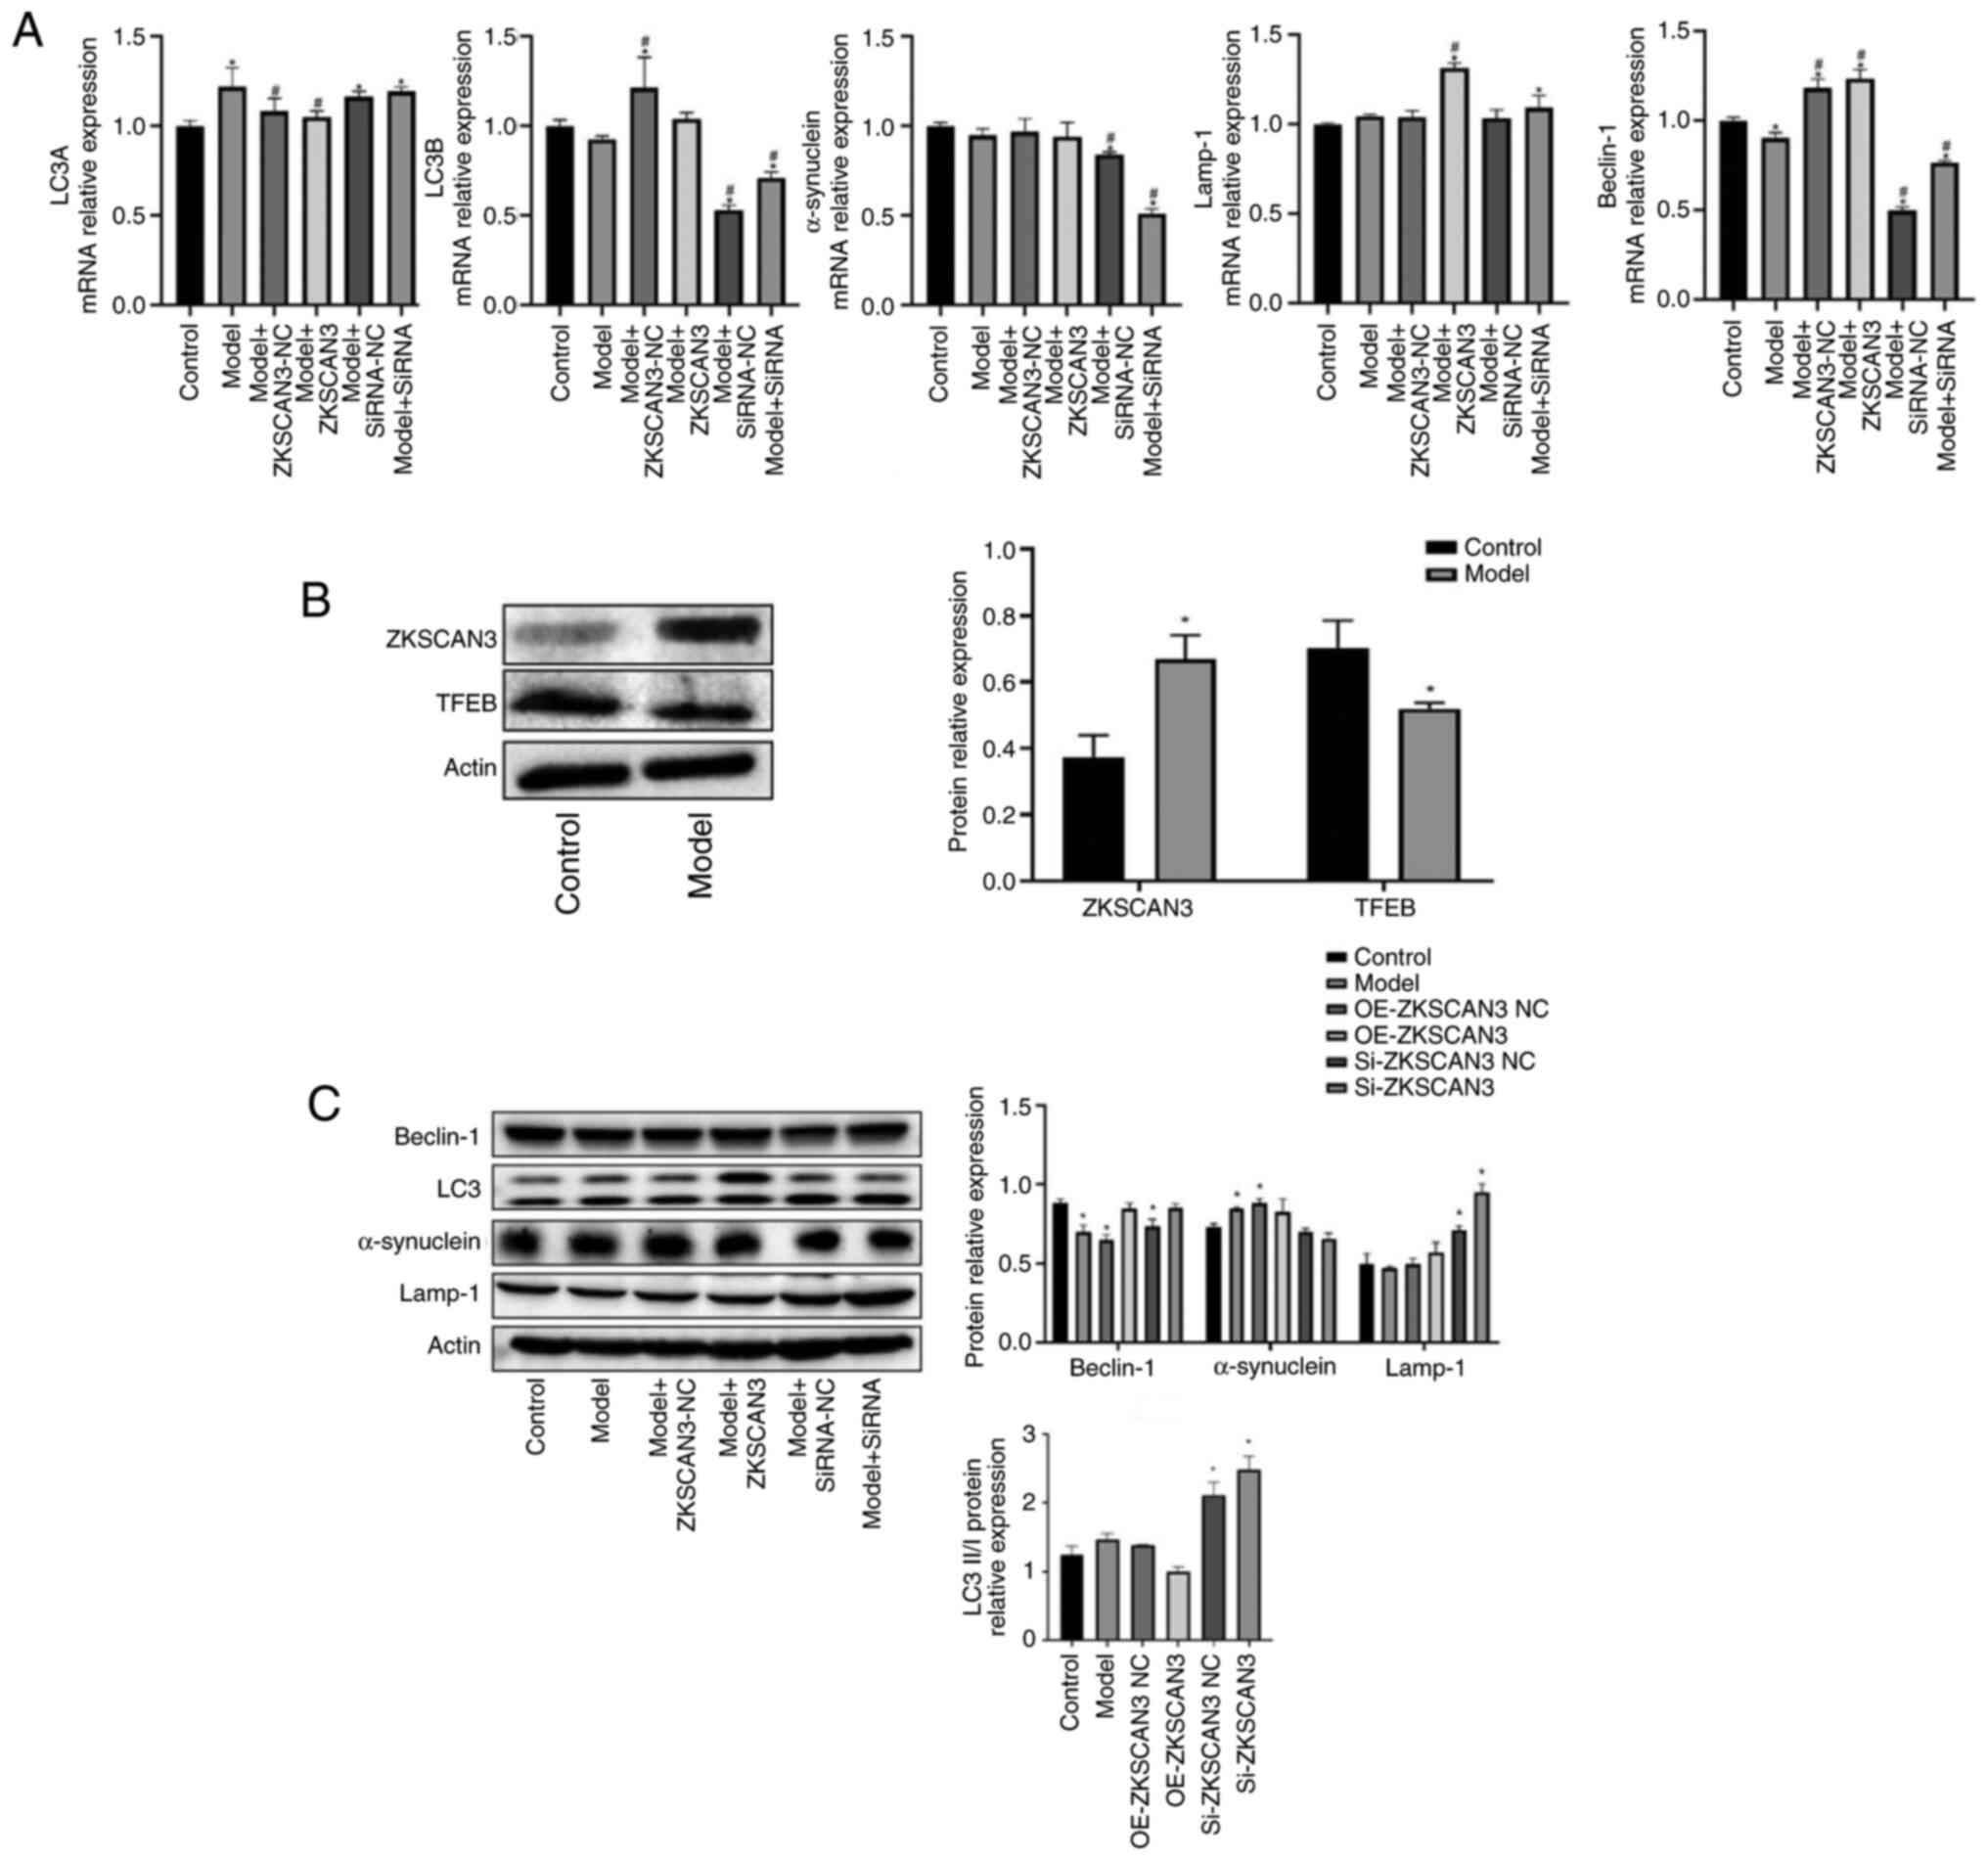 | Figure 3Effect of ZKSCAN3 on the expression of
TFEB, LC3, α-synuclein, Lamp-1 and Beclin-1 in PD cell model. (A)
The mRNA expression of LC3A, LC3B, α-synuclein, Lamp-1 and Beclin-1
when cells were transfected with ZKSCAN3 overexpression vector or
ZKSCAN3 siRNA. (B) The protein expression of ZKSCAN3 and TFEB in PD
cell model. (C) The protein expression of LC3, α-synuclein, Lamp-1
and Beclin-1 when cells were transfected with ZKSCAN3
overexpression vector or ZKSCAN3 siRNA. *P<0.05 vs.
the control group; #P<0.05 vs. the model group. PD,
Parkinson's disease; NC, negative control; ZKSCAN3, zinc finger
with KRAB and SCAN domains 3; TFEB, transcription factor EB;
Lamp-1, lysosomal-associated membrane protein 1. |
The western blotting results revealed that, compared
with the normal control group, the model group showed increased
ZKSCAN3 expression and decreased TFEB expression (Fig. 3B). Compared with the normal control
group, the model group showed decreases in Beclin-1 and Lamp-1
expression and increases in LC3II/I and α-synuclein expression.
Compared with the empty vector group, the ZKSCAN3 overexpression
group showed increases in Beclin-1 and Lamp-1 and decreases in LC3
II/I and α-synuclein expression. Compared with the interference
control group, the ZKSCAN3 interference group showed increases in
Beclin-1, Lamp-1 and LC3 II/I expression, whereas the expression of
α-synuclein was decreased (Fig.
3C).
Effect of TFEB on the expression of
Beclin-1, LC3, α-synuclein and Lamp-1 in a PD cell model
The RT-qPCR results revealed that, compared with
that in the normal control group, the expression of Beclin-1 in the
model group was increased. Compared with the Model + ZKSCAN3 + TFEB
SiNC group, the Model + ZKSCAN3 + TFEB siRNA group showed decreased
expression of Beclin-1, LC3A and LC3B, whereas the expression of
Lamp-1 was increased. Compared with the Model + ZKSCAN3 siRNA +
TFEB-NC group, the Model + ZKSCAN3 siRNA + TFEB group showed an
increased expression of Beclin-1 and LC3B, whereas the expression
of α-synuclein, LC3A and Lamp-1 was decreased (Fig. 4A).
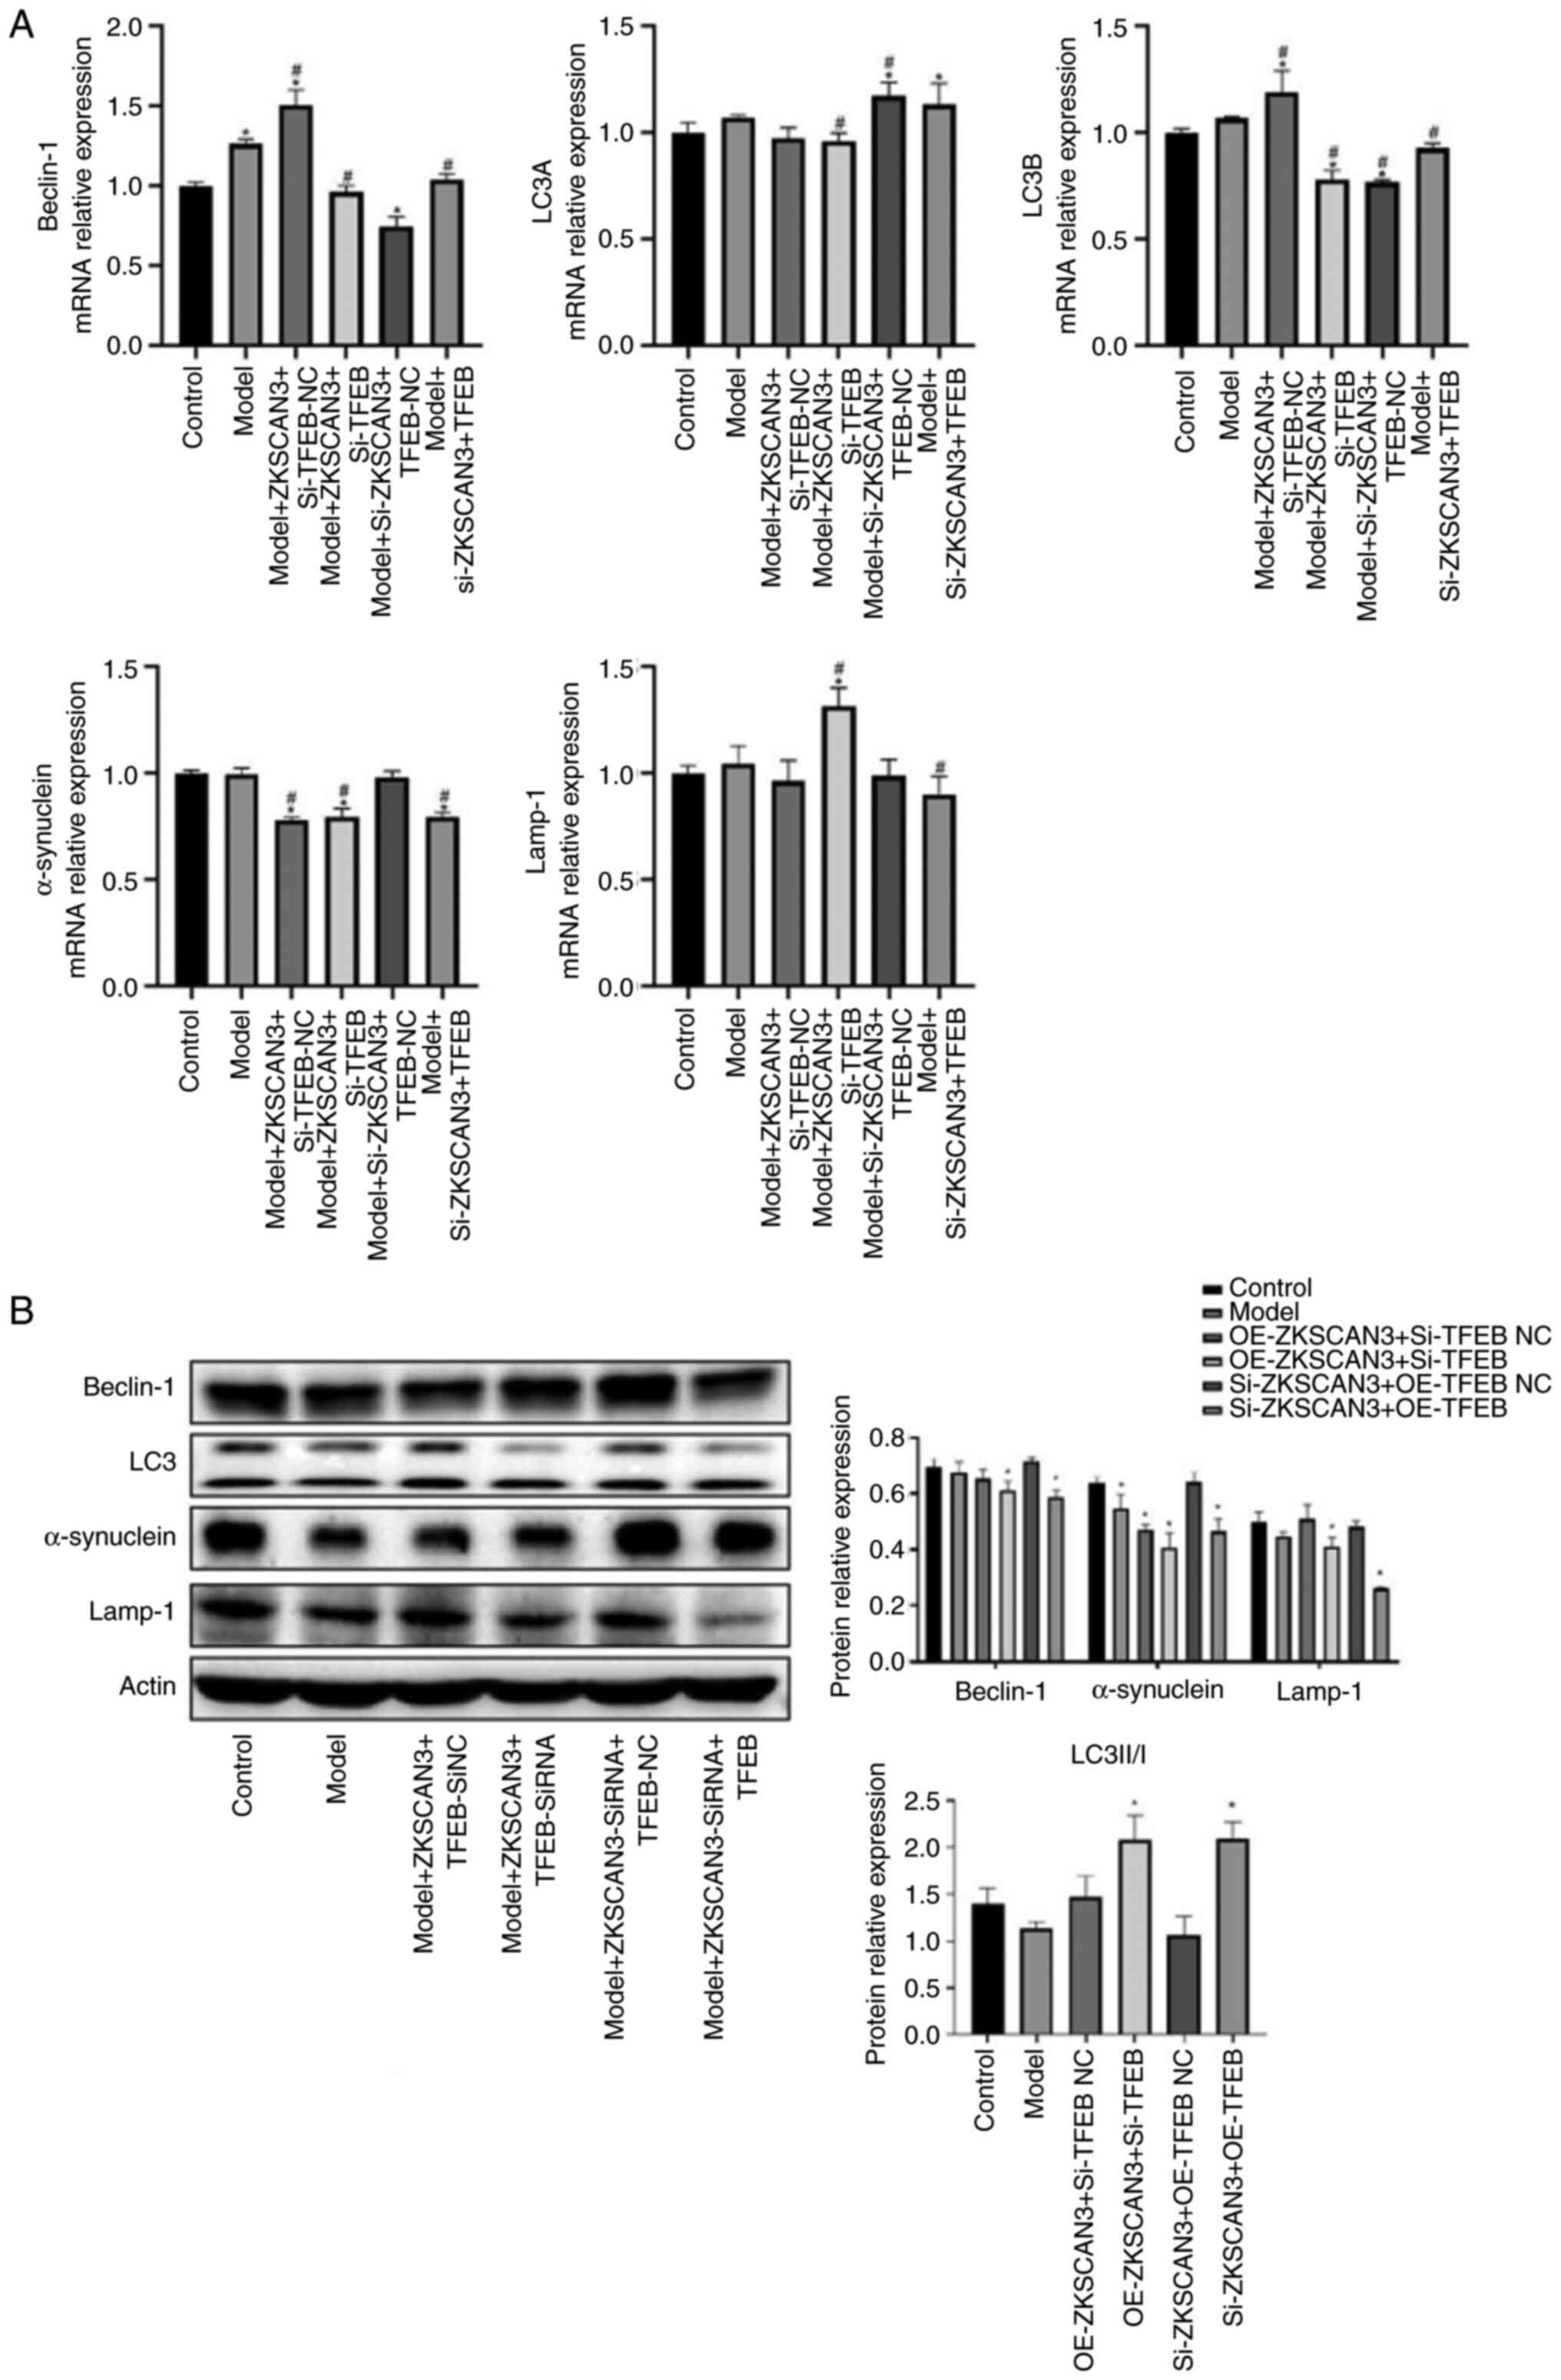 | Figure 4Effect of TFEB on the expression of
Beclin-1, LC3, α-synuclein and Lamp-1 in PD cell model. (A) The
mRNA expression of LC3A, LC3B, α-synuclein, Lamp-1 and Beclin-1
when cells were transfected with ZKSCAN3/TFEB overexpression vector
or siRNA. (B) The protein expression of LC3, α-synuclein, Lamp-1
and Beclin-1 when cells were transfected with ZKSCAN3/TFEB
overexpression vector or siRNA. *P<0.05 vs. the
control group; #P<0.05 vs. the model group. PD,
Parkinson's disease; NC, negative control; ZKSCAN3, zinc finger
with KRAB and SCAN domains 3; TFEB, transcription factor EB;
Lamp-1, lysosomal-associated membrane protein 1. |
The western blotting results revealed that, compared
with those in the normal control group, Beclin-1 levels were lower,
LC3 and α-synuclein levels were higher and Lamp-1 levels were not
significantly different in the model group. Compared with the Model
+ ZKSCAN3 + TFEB siNC group, the Model + ZKSCAN3 + TFEB SiRNA group
showed decreased expression of Beclin-1, α-synuclein and Lamp-1,
whereas the expression of LC3 was increased. Compared with the
Model + ZKSCAN3 siRNA + TFEB-NC group, the Model + ZKSCAN3 siRNA +
TFEB group showed decreased expression of Beclin-1, Lamp-1 and
α-synuclein and increased expression of LC3 (Fig. 4B).
Detection of lysosomes
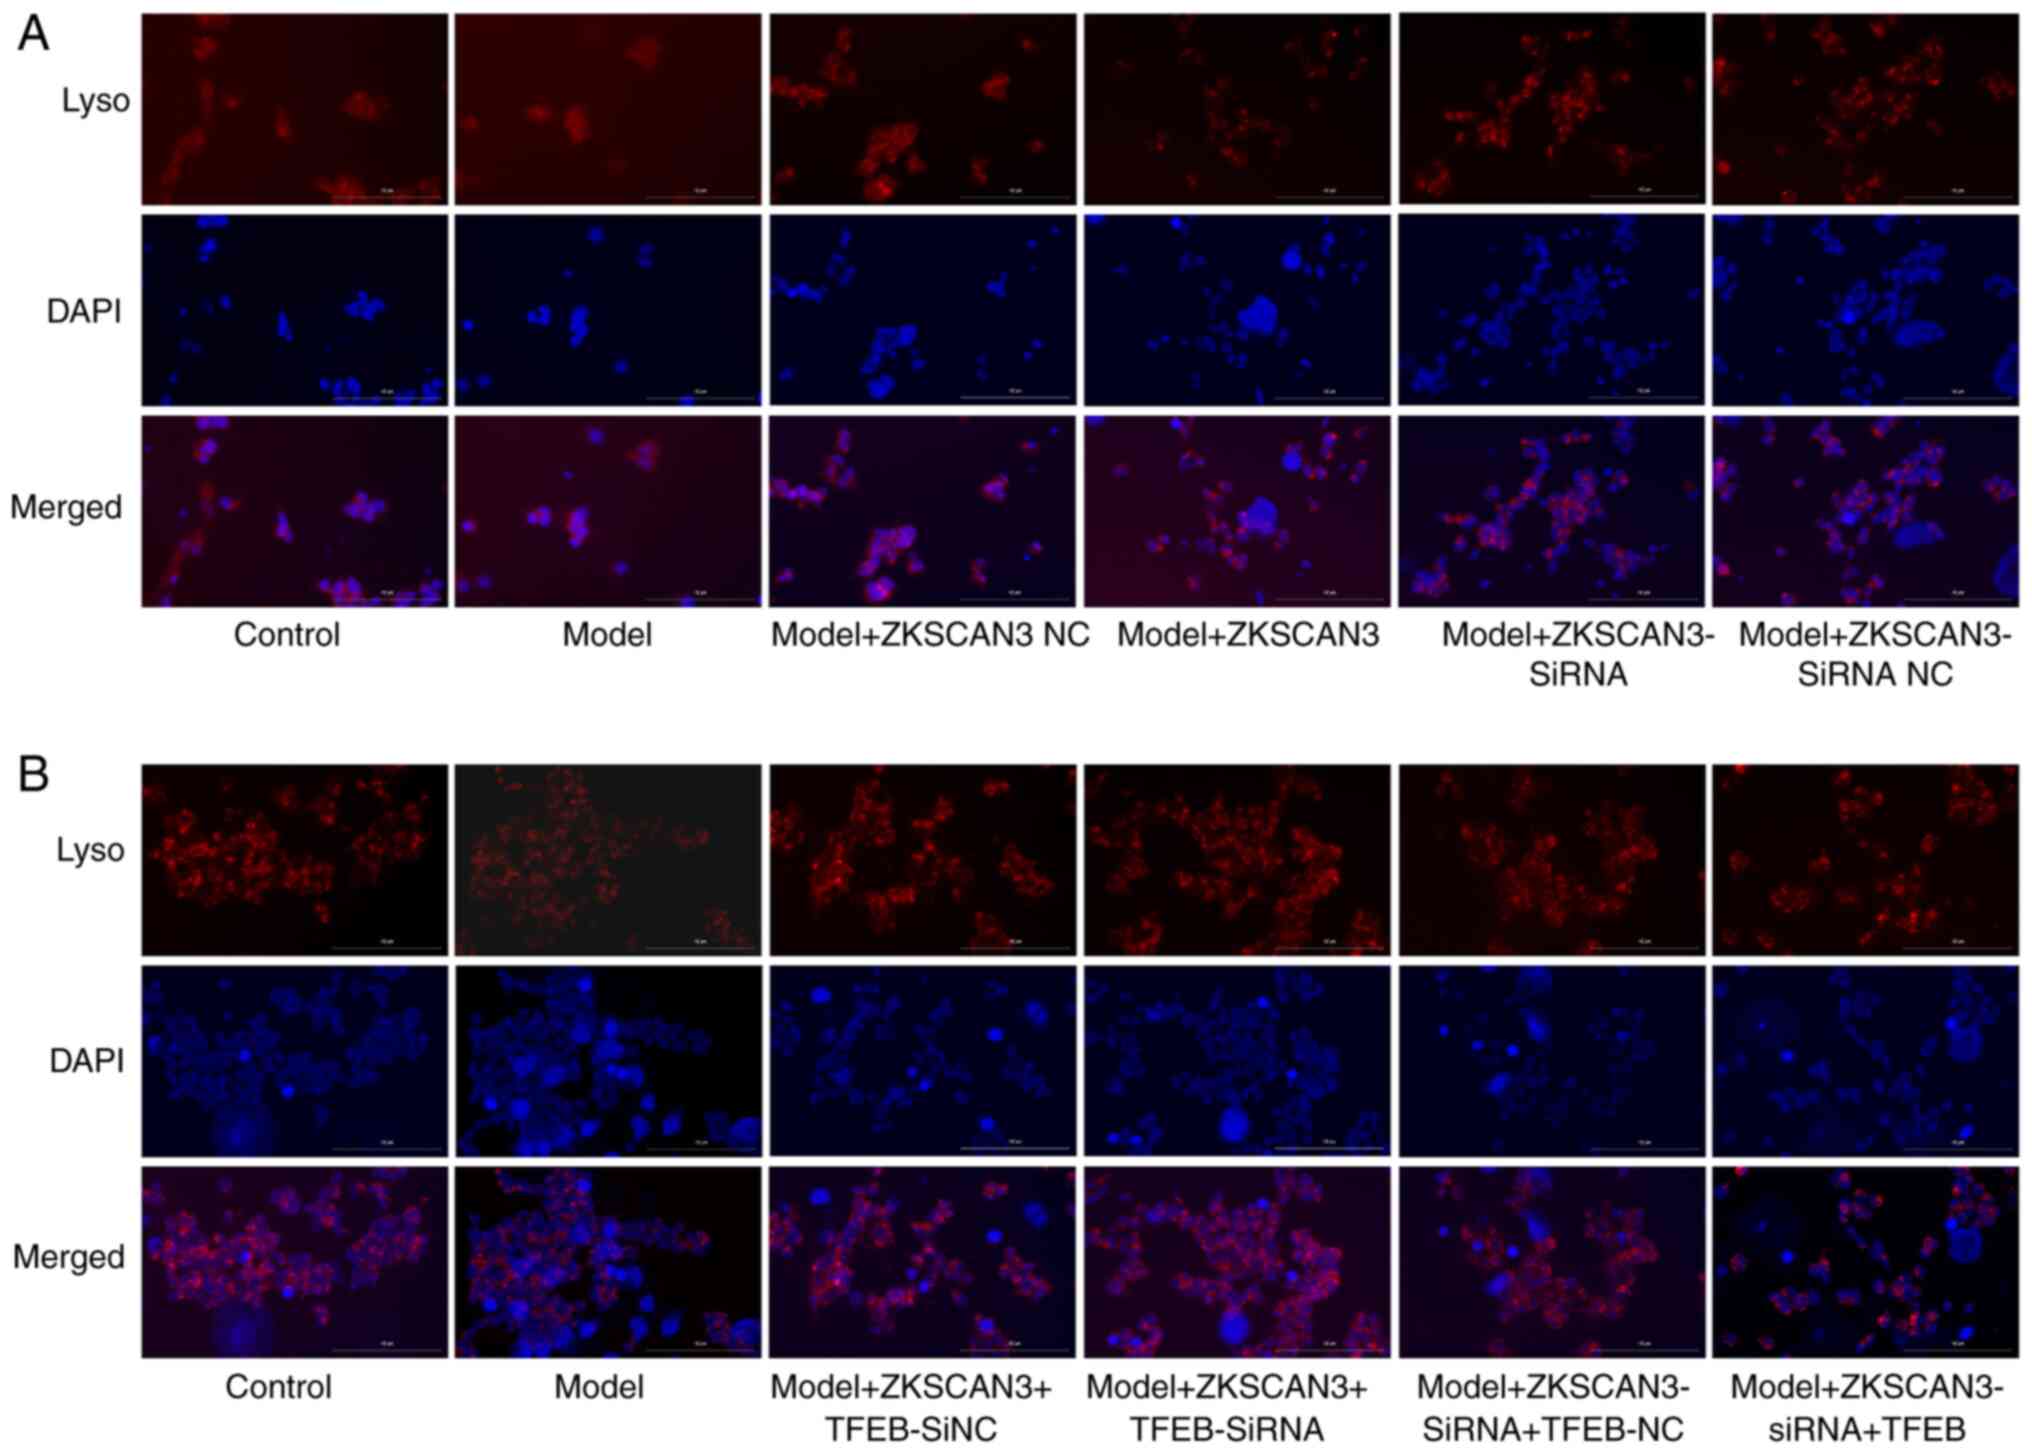
Lysosomal staining revealed that, compared with that
of the normal control group, the fluorescence intensity of the
model group was lower. Compared with those in the ZKSCAN3 NC group,
the fluorescence intensity and number of lysosomes in the
ZKSCAN3-overexpressing group were lower. Compared with the ZKSCAN3
siRNA NC group, the ZKSCAN3 interference group showed an increase
in fluorescence intensity (Fig.
5A). Compared with that of the interference empty group, the
fluorescence intensity of the TFEB interference group was greater.
Compared with that of the empty group, the fluorescence intensity
of the TFEB-overexpressing group was lower and the number of
lysosomes was lower (Fig. 5B).
Transmission electron microscopy
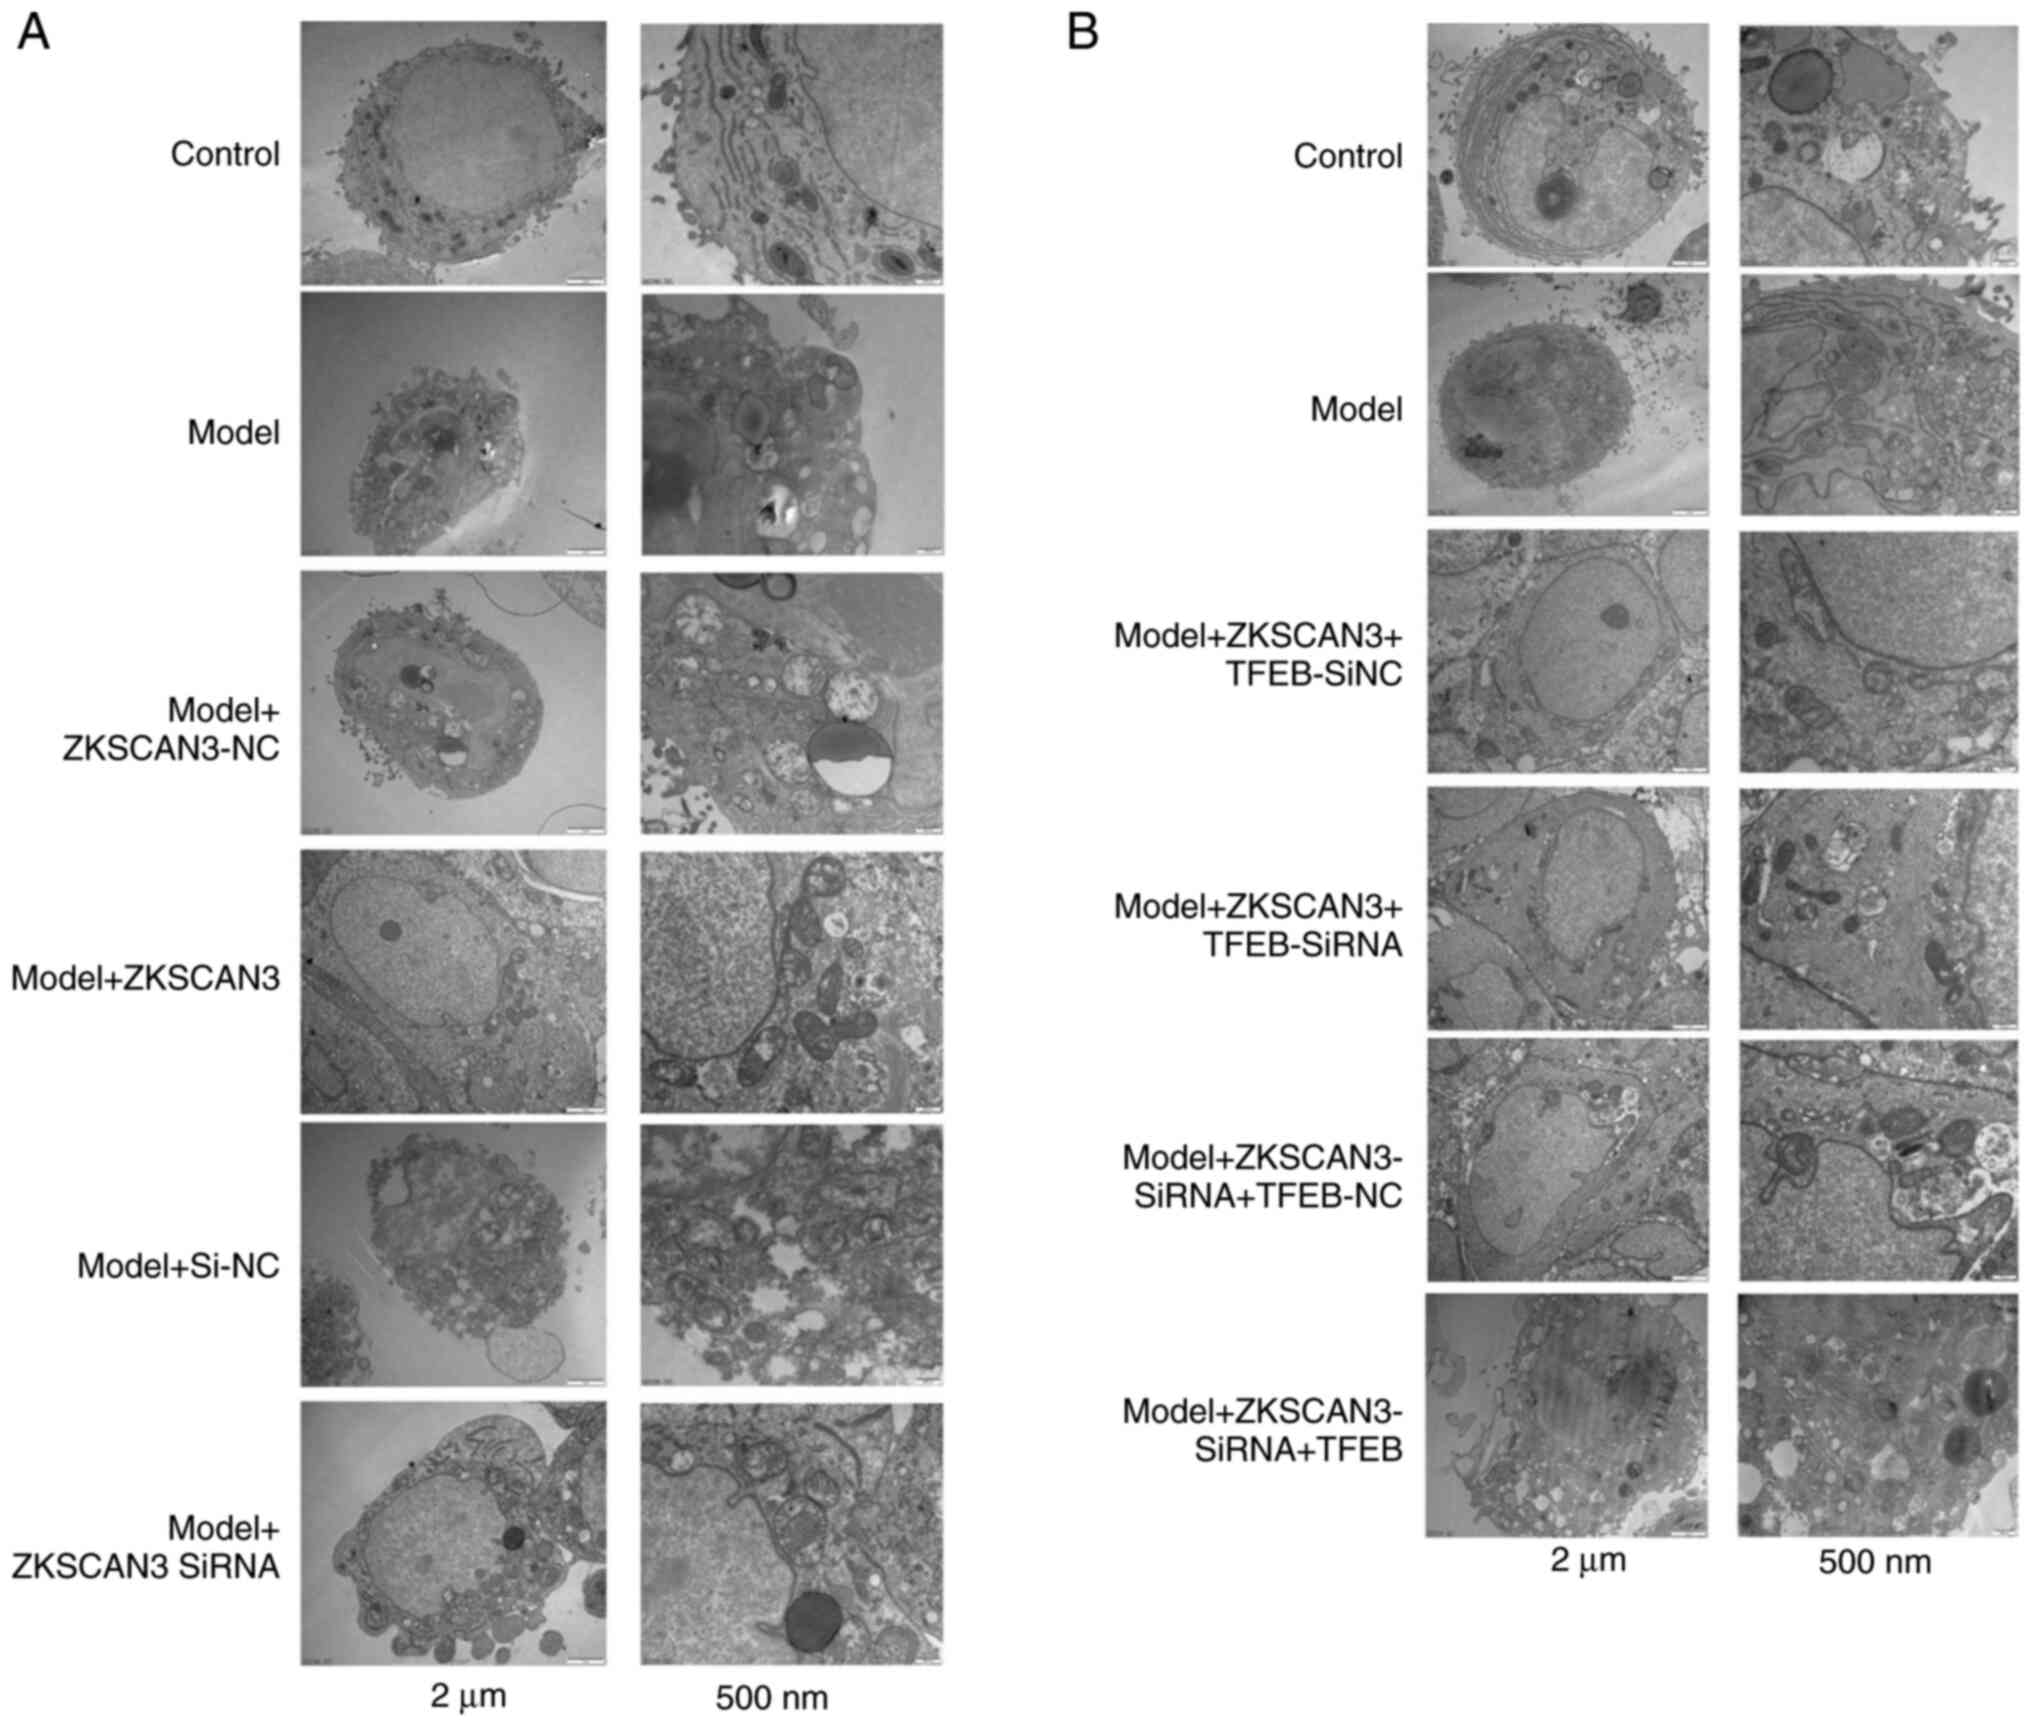
The results of transmission electron microscopy
revealed that the autophagy level in the model group was increased.
The autophagy level was decreased in the ZKSCAN3 overexpression
group and increased in the ZKSCAN3 interference group (Fig. 6A). The level of autophagy was
decreased in the TFEB-overexpressing group (Fig. 6B).
Discussion
Autophagy occurs widely in eukaryotic cells. It is a
highly evolutionary and conserved process in which cells maintain
homeostasis via phagocytosis and degradation of damaged organelles,
proteins and biological macromolecules through the
autophagy-lysosome system (16).
The basal level of autophagy removes aggregate-prone proteins and
allows cells to recycle cytoplasmic components, whereas
unrestrained autophagic activity triggers apoptotic cell death and
is considered a contributing factor in the pathogenesis of several
disorders. Autophagy plays important roles in tumors, brain
diseases and neurodegenerative diseases. Autophagy affects the
progression of diseases by regulating cell death and survival
(17,18). In recent years, increasing evidence
has suggested that autophagy is involved in PD (18,19).
The ratio of LC3II/LC3I is an important indicator of
autophagy (20). Beclin-1 is
another key protein involved in the formation of autophagosomes
(21). Zhuang et al reported
that Beclin-1 is released when the interaction between Beclin-1 and
Bcl-2 is disrupted, thus increasing the basal level of autophagy
(21).
PD is a common neurodegenerative disease.
α-Synuclein is closely related to PD (22). Additionally, Beclin-1 and LC3 are
key autophagy-related proteins (23). The present study found that the
expression of ZKSCAN3 was increased and that the expression of TFEB
was decreased in the model group compared with the normal group.
Compared with those in the normal group, the Beclin-1 and Lamp-1
levels in the model group were lower, whereas the LC3II/I and
α-synuclein expression levels were greater. Compared with the empty
group, the ZKSCAN3-overexpressing group showed increases in
Beclin-1 and Lamp-1 as well as decreases in LC3 II/I and
α-synuclein expression levels. Compared with the interference
control group, the ZKSCAN3 interference group showed increased
levels of Beclin-1, Lamp-1 and LC3 II/I, whereas the level of
α-synuclein was decreased. ZKSCAN3 promotes autophagy in PD.
The present study explored the interaction between
TFEB and ZKSCAN3. Compared with the normal group, the model group
showed a decrease in Beclin-1 levels as well as increases in LC3
and α-synuclein levels, but the expression of Lamp-1 did not
change. Compared with those in the Model + ZKSCAN3 + TFEB SiNC
group, the levels of Beclin-1, α-synuclein and Lamp-1 were lower
and the level of LC3 was greater in the Model + ZKSCAN3 + TFEB
SiRNA group. Compared with those in the Model + ZKSCAN3 siRNA +
TFEB-NC group, the expression of Beclin-1, Lamp-1 and α-synuclein
was decreased and the expression of LC3 was increased in the Model
+ ZKSCAN3 siRNA + TFEB group. In PD, TFEB can reverse the
regulatory effect of ZKSCAN3.
LysoTracker Red was used for lysosome-specific
fluorescence staining (24). The
results of lysosomal staining revealed that, compared with that of
the normal group, the fluorescence intensity of the model group was
lower. Compared with those in the overexpression empty group, the
fluorescence intensity and number of lysosomes in the ZKSCAN3
overexpression group were lower. Compared with the interference
empty group, the ZKSCAN3 interference group showed an increase in
fluorescence intensity. Compared with that of the interference
empty group, the fluorescence intensity of the TFEB interference
group was greater. Compared with those in the empty control group,
the fluorescence intensity and number of lysosomes in the TFEB
overexpression group were lower. Functional assays to confirm the
role of ZKSCAN3 in autophagy and lysosomal function could provide
more robust evidence for the proposed mechanisms.
Co-Immunoprecipitation assay for protein interactions, detection of
autophagic flow and related experiments on downstream signaling
pathways could be performed as further directions. Further research
is planned to be conducted in animal experiments.
A limitation of the present study is that all the
experiments were performed in vitro. In vivo studies
will need to be conducted in the future to confirm the in
vitro results. Treating SH-SY5Y cells with 6-OHDA is a common
method for constructing a cell model of PD. The results of the CCK8
assay represented the fundamental phenotype indicator for model
validation. Measuring more indicators will make the model more
convincing. In the present study, 15 µM was selected as the
modelling concentration of 6-OHDA and the limitation is that the
concentration within 15 µM was not tested.
In the autophagy-lysosome pathway, TFEB regulated
the biogenesis of lysosomes and participates in the regulation of
lysosomal hydrolases and autophagy-related proteins. Under normal
conditions, TFEB is phosphorylated and located on the surface of
lysosomes in a deactivated state. When TFEB is dephosphorylated, it
is activated to enter the nucleus, where it promotes the expression
of autophagy- and lysosome-related proteins and enhances the
autophagy-lysosome pathway (25).
The typical pathological change in PD is the progressive loss of
dopaminergic neurons. Misfolded α-synuclein is related to this
process. α-synuclein changes the transcriptional activity of TFEB
and impairs the degradation function of lysosomes. An increase in
exogenous TFEB activity can promote the clearance of α-synuclein
and protect dopamine neurons (26).
In normal brain tissue, ZKSCAN3 is located in the
cytoplasm and cannot inhibit autophagy. In a model of PD, ZKSCAN3
accumulates in the nucleus, inhibits the expression of
autophagy-related genes and reduces lysosome production, thus
leading to the accumulation of α-synuclein and the progression of
PD (27). Protein accumulation may
be caused by increased synthesis or decreased clearance.
Unnecessary proteins are usually removed from cells via the
ubiquitin-proteasome system or autophagy-lysosome system.
Functional defects in the ubiquitin-proteasome system and lysosomes
have been detected in patients with PD. The elimination of unwanted
proteins is one method for developing candidate drugs for PD
(28). Therapeutic strategies to
enhance the function of lysosomes and autophagy may also be
appropriate for drug development (29). In conclusion, the present study
demonstrated that ZKSCAN3 affects the occurrence and development of
PD through the TFEB-mediated autophagy-lysosome pathway.
Acknowledgements
Not applicable.
Funding
Funding: The present study was supported by Science Innovation
2030–Brain Science and BrainInspired Intelligence Technology Major
Project (grant no. 2021ZD0201100, 2021ZD0201103), Department of
Education of Guizhou Province [grant no. Guizhou Teaching and
Technology (2023)015], Joint Fund Project of Guizhou Provincial
Science and Technology Department [grant no. QianKeHe (2016)
support 2905] and Joint Fund Project of Guizhou Provincial Science
and Technology Department [grant no. QianKeHe (2017) support
7213].
Availability of data and materials
The data generated in the present study may be
requested from the corresponding author.
Authors' contributions
MY, SL, MC and JL contributed to the study
conception and design. Material preparation, data collection and
analysis were performed by SL, BS and MC, BS and WC conducted the
experiments. MY, SL, MC and JL confirmed the authenticity of all
the raw data. The first draft of the manuscript was written by MC
and all authors commented on previous versions of the manuscript.
All authors read and approved the final manuscript.
Ethics approval and consent to
participate
Not applicable.
Patient consent for publication
Not applicable.
Competing interests
The authors declare that they have no competing
interests.
References
|
1
|
Chinta SJ, Lieu CA, Demaria M, Laberge RM,
Campisi J and Andersen JK: Environmental stress, ageing and glial
cell senescence: A novel mechanistic link to Parkinson's disease? J
Intern Med. 273:429–436. 2013.PubMed/NCBI View Article : Google Scholar
|
|
2
|
Collier TJ, Kanaan NM and Kordower JH:
Ageing as a primary risk factor for Parkinson's disease: Evidence
from studies of non-human primates. Nat Rev Neurosci. 12:359–366.
2011.PubMed/NCBI View
Article : Google Scholar
|
|
3
|
Surmeier DJ: Determinants of dopaminergic
neuron loss in Parkinson's disease. FEBS J. 285:3657–3668.
2018.PubMed/NCBI View Article : Google Scholar
|
|
4
|
Roberts WS, Price S, Wu M and Parmar MS:
Emerging gene therapies for Alzheimer's and Parkinson's diseases:
An overview of clinical trials and promising candidates. Cureus.
16(e67037)2024.PubMed/NCBI View Article : Google Scholar
|
|
5
|
Tambe SM, Mali S, Amin PD and Oliveira M:
Neuroprotective potential of cannabidiol: Molecular mechanisms and
clinical implications. J Integr Med. 21:236–244. 2023.PubMed/NCBI View Article : Google Scholar
|
|
6
|
Grote J, Patel N, Bates C and Parmar MS:
From lab bench to hope: A review of gene therapies in clinical
trials for Parkinson's disease and challenges. Neurol Sci.
45:4699–4710. 2024.PubMed/NCBI View Article : Google Scholar
|
|
7
|
Xu Z, Shen B, Tang Y, Wu J and Wang J:
Deep clinical phenotyping of Parkinson's disease: Towards a new era
of research and clinical care. Phenomics. 2:349–361.
2022.PubMed/NCBI View Article : Google Scholar
|
|
8
|
Chauhan S, Goodwin JG, Chauhan S, Manyam
G, Wang J, Kamat AM and Boyd DD: ZKSCAN3 is a master
transcriptional repressor of autophagy. Mol Cell. 50:16–28.
2013.PubMed/NCBI View Article : Google Scholar
|
|
9
|
Lei Z, Cao G and Wei G: A30P mutant
α-synuclein impairs autophagic flux by inactivating JNK signaling
to enhance ZKSCAN3 activity in midbrain dopaminergic neurons. Cell
Death Dis. 10(133)2019.PubMed/NCBI View Article : Google Scholar
|
|
10
|
Ouyang X, Becker E Jr, Bone NB, Johnson
MS, Craver J, Zong WX, Darley-Usmar VM, Zmijewski JW and Zhang J:
ZKSCAN3 in severe bacterial lung infection and sepsis-induced
immunosuppression. Lab Invest. 101:1467–1474. 2021.PubMed/NCBI View Article : Google Scholar
|
|
11
|
Dai L, Liu M, Ke W, Chen L, Fang X and
Zhang Z: Lysosomal dysfunction in α-synuclein pathology: Molecular
mechanisms and therapeutic strategies. Cell Mol Life Sci.
81(382)2024.PubMed/NCBI View Article : Google Scholar
|
|
12
|
Li S, Song Y, Quach C, Guo H, Jang GB,
Maazi H, Zhao S, Sands NA, Liu Q, In GK, et al: Transcriptional
regulation of autophagy-lysosomal function in BRAF-driven melanoma
progression and chemoresistance. Nat Commun.
10(1693)2019.PubMed/NCBI View Article : Google Scholar
|
|
13
|
Rusmini P, Cortese K, Crippa V, Cristofani
R, Cicardi ME, Ferrari V, Vezzoli G, Tedesco B, Meroni M, Messi E,
et al: Trehalose induces autophagy via lysosomal-mediated TFEB
activation in models of motoneuron degeneration. Autophagy.
15:631–651. 2019.PubMed/NCBI View Article : Google Scholar
|
|
14
|
Tang T, Jian B and Liu Z: Transmembrane
protein 175, a lysosomal ion channel related to Parkinson's
disease. Biomolecules. 13(802)2023.PubMed/NCBI View Article : Google Scholar
|
|
15
|
Livak KJ and Schmittgen TD: Analysis of
relative gene expression data using real-time quantitative PCR and
the 2(-Delta Delta C(T)) method. Methods. 25:402–408.
2001.PubMed/NCBI View Article : Google Scholar
|
|
16
|
Yang C, Xu Y, Zhang W, Ma M, Wang S, Chai
L, Guo H and Hu L: Salvianolate lyophilized injection regulates the
autophagy-lysosomal pathway in cerebral ischaemia/reperfusion rats.
J Ethnopharmacol. 271(113898)2021.PubMed/NCBI View Article : Google Scholar
|
|
17
|
Wang FJ, Wang SX, Chai LJ, Zhang Y, Guo H
and Hu LM: Xueshuantong injection (lyophilized) combined with
salvianolate lyophilized injection protects against focal cerebral
ischemia/reperfusion injury in rats through attenuation of
oxidative stress. Acta Pharmacol Sin. 39:998–1011. 2018.PubMed/NCBI View Article : Google Scholar
|
|
18
|
Hou X, Chen TH, Koga S, Bredenberg JM,
Faroqi AH, Delenclos M, Bu G, Wszolek ZK, Carr JA, Ross OA, et al:
Alpha-synuclein-associated changes in PINK1-PRKN-mediated mitophagy
are disease context dependent. Brain Pathol.
33(e13175)2023.PubMed/NCBI View Article : Google Scholar
|
|
19
|
Mauri S, Bernardo G, Martinez A, Favaro M,
Trevisan M, Cobraiville G, Fillet M, Caicci F, Whitworth AJ and
Ziviani E: USP8 down-regulation promotes Parkin-independent
mitophagy in the drosophila brain and in human neurons. Cells.
12(1143)2023.PubMed/NCBI View Article : Google Scholar
|
|
20
|
Mizushima N and Yoshimori T: How to
interpret LC3 immunoblotting. Autophagy. 3:542–545. 2007.PubMed/NCBI View Article : Google Scholar
|
|
21
|
Zhuang P, Wan Y, Geng S, He Y, Feng B, Ye
Z, Zhou D, Li D, Wei H, Li H, et al: Salvianolic Acids for
Injection (SAFI) suppresses inflammatory responses in activated
microglia to attenuate brain damage in focal cerebral ischemia. J
Ethnopharmacol. 198:194–204. 2017.PubMed/NCBI View Article : Google Scholar
|
|
22
|
Brembati V, Faustini G, Longhena F and
Bellucci A: Alpha synuclein post translational modifications:
Potential targets for Parkinson's disease therapy? Front Mol
Neurosci. 16(1197853)2023.PubMed/NCBI View Article : Google Scholar
|
|
23
|
Shi G, Zeng L, Shi J and Chen Y:
Trimethylamine N-oxide promotes atherosclerosis by regulating
low-density lipoprotein-induced autophagy in vascular smooth muscle
cells through PI3K/AKT/mTOR pathway. Int Heart J. 64:462–469.
2023.PubMed/NCBI View Article : Google Scholar
|
|
24
|
He Z, Du J, Zhang Y, Xu Y, Huang Q, Zhou
Q, Wu M, Li Y, Zhang X, Zhang H, et al: Kruppel-like factor 2
contributes to blood-spinal cord barrier integrity and functional
recovery from spinal cord injury by augmenting autophagic flux.
Theranostics. 13:849–866. 2023.PubMed/NCBI View Article : Google Scholar
|
|
25
|
Pang P, Zhang X, Yuan J, Yan H and Yan D:
Acrylamide interferes with autophagy and induces apoptosis in
Neuro-2a cells by interfering with TFEB-regulated lysosomal
function. Food Chem Toxicol. 177(113818)2023.PubMed/NCBI View Article : Google Scholar
|
|
26
|
Decressac M and Björklund A: TFEB:
Pathogenic role and therapeutic target in Parkinson disease.
Autophagy. 9:1244–1246. 2013.PubMed/NCBI View Article : Google Scholar
|
|
27
|
Wu X, Ren Y, Wen Y, Lu S, Li H, Yu H, Li W
and Zou F: Deacetylation of ZKSCAN3 by SIRT1 induces autophagy and
protects SN4741 cells against MPP+-induced oxidative
stress. Free Radic Biol Med. 181:82–97. 2022.PubMed/NCBI View Article : Google Scholar
|
|
28
|
Hao XM and Li YJ: Transcription factor EB
and Parkinson's disease. Chin Pharmacol Bull. 33:305–308. 2017.(In
Chinese).
|
|
29
|
Mc Donald JM and Krainc D: Lysosomal
Proteins as a therapeutic target in neurodegeneration. Annu Rev
Med. 68:445–458. 2017.PubMed/NCBI View Article : Google Scholar
|