Introduction
Prostate cancer has become the most common cancer
among males in the United States, surpassing lung cancer, and is
the second most common cause of cancer-related mortality (1,2). In
China, the incidence of prostate cancer is gradually increasing.
Due to the absence of a reliable early diagnostic method, most
prostate cancer incidences are diagnosed during the late stages,
leading to high mortality. As the elderly population increases,
prostate cancer becomes a significant international health problem.
Prostate cancer has a wide range of individual differences and
variability and is more invasive than other tumors. No standard
methods for prostate cancer prevention, early diagnosis, treatment
or prognosis are currently available (3). Prognostic indicators that benefit the
early diagnosis and treatment of prostate cancer are required to
establish a reliable diagnostic method (4).
In the present study, the protein expression of
prostate cancer, normal prostate and benign prostatic hyperplasia
tissues were screened using two-dimensional gel electrophoresis
(2-DE) and mass spectrometry (MS) analysis to identify early
diagnostic, predictive, and prognostic markers for prostate
cancer.
Materials and methods
Samples
All tissue samples for proteomic research were
obtained from the Department of Urology, Guizhou Provincial
People’s Hospital (Guiyang, China) between July 2009 and May 2001.
The samples included 10 each of prostate cancer, benign prostatic
hyperplasia and normal prostate tissues, respectively, The patients
were 55–76 years of age, with a mean age of 65.8 years and a median
age of 65 years. The patients did not receive preoperative
radiotherapy or chemotherapy. All specimens were pathologically
confirmed to be prostate cancer, benign prostatic hyperplasia or
normal prostate tissue. All samples were immediately stored at
−80°C. This study was conducted in accordance with the declaration
of Helsinki. This study was conducted with approval from the Ethics
Committee of the People’s Hospital of Wuhan University (Wuchang,
China). Written informed consent was obtained from all
participants.
Tissue protein extraction
Up to 100 mg of tissue samples were collected and
cut into sections. Cell lysate (∼300 ml) and
phenylmethylsulfonylfluoride (200 mmol/l) were added to the
samples, which were then homogenated, ultrasonically treated and
centrifuged at 20,000 × g for 30 min at 4°C. The supernatant was
then transferred into a new EP tube. The protein was purified
according to the kit instructions (Goodtime Biological Technology
Co., Ltd., Wuhan, China), and the protein concentration was
measured.
2-DE gel electrophoresis
The protein sample was placed in an isoelectric
focusing (IEF) strip slot, and dry-immobilized pH gradient strips
were added for the first-dimension electrophoresis. The IEF
parameters were set as follows: 30 V, 12 h (strip rehydration); 500
V, 1 h; 1 kV, 1 h; and 8 kV, 30 min. Following IEF, the balance
strip was balanced in a buffer. The tape was transferred to 12.5%
SDS-PAGE gel (GE company, USA) for the second electrophoresis. The
parameters were set to 2 W/gel for 50 min, and then changed to 17
W/gel until the indicator reached the bottom edge of the
electrophoresis gel. The gel was stained according to the
instructions of the Deep Purple staining method.
Image acquisition and analysis
The gel was analyzed using a Typhoon 9400 gel
imaging system. The mass spectrum was analyzed using Image Master
Software. The points of difference were found by gel image
recognition and analysis. Statistical analysis was performed using
a Student’s t-test. Protein spots expressed differentially by
>2-fold were selected. P<0.05 was considered to indicate a
statistically significant protein spot.
Obtaining the mass spectra
The stained gel was placed in a Spothandling
workstation. The protein spots were cut automatically before being
digested with trypsin and extracted. Following desalting, the
sample was analyzed on a target mass matrix-assisted laser
desorption/ionization time-of-flight (MALDI TOF) mass spectrometer.
Peptide mass fingerprinting (PMF) and the five highest ion peaks of
peptide tandem MS (MS/MS) spectra were obtained.
MS data analysis
The MS data were searched using the Mascot software
in the NCBInr database. The parameters were Homo sapiens
species, 75 ppm peptide tolerance and 0.2 ion fragment tolerance. A
protein search score >95 was considered to indicate successful
protein identification.
Statistical analysis
Results are expressed as means ± standard deviation.
The t-test comparison was used to conduct a cross-sectional study
of all continuous data. The Pearson correlation coefficient was
used for correlation analysis. P<0.05 was considered to indicate
a statistically significant difference.
Results
Gel image analysis
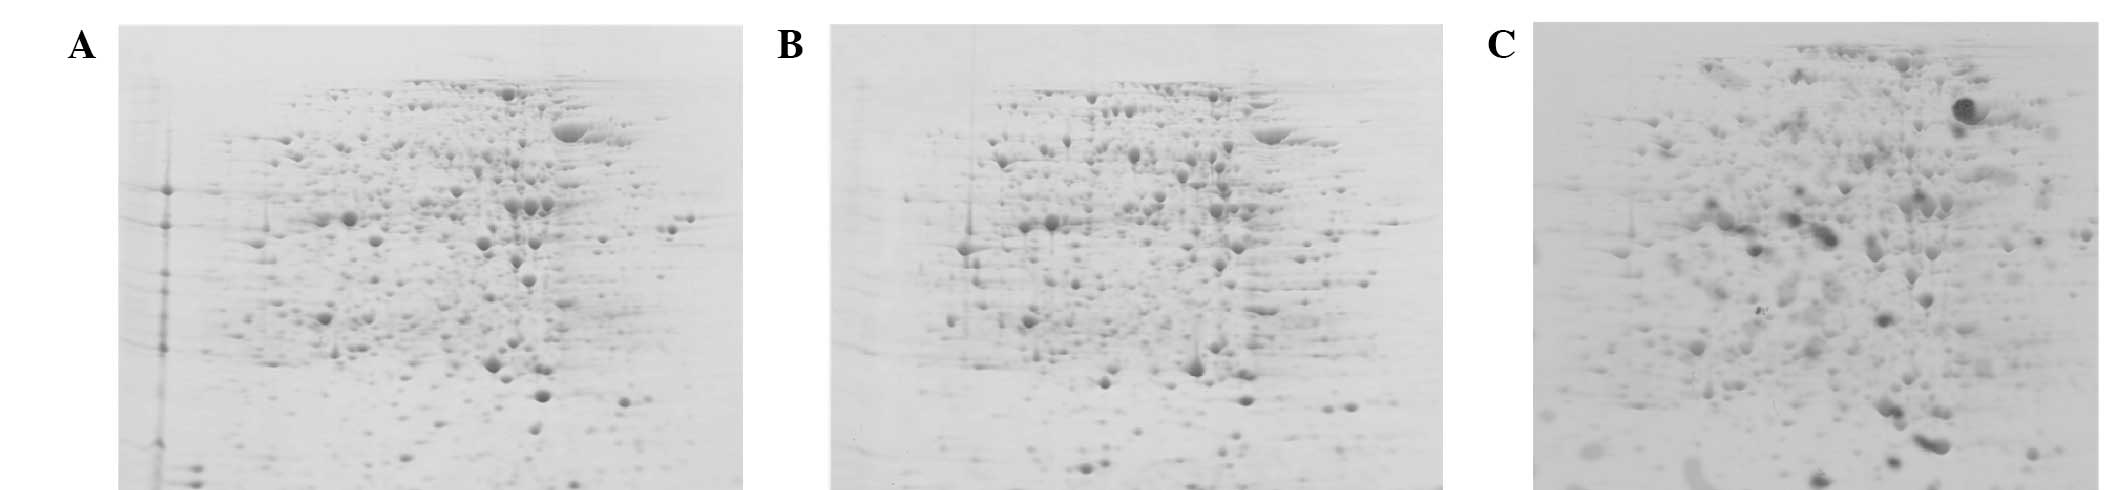
The 2-D maps revealed different protein spots in the
3 groups. The number of protein spots in the prostate cancer and
benign prostatic hyperplasia tissues was greater than those in
normal tissues (Fig. 1).
Map analysis
The average number of protein spots on the normal
prostate, prostate cancer and benign prostatic hyperplasia tissue
gel electrophoresis were 3,066, 3,289 and 2,986, respectively. One
of each group of the gels was set as a reference, and the gel
patterns for 8 spots were subjected to matching analysis. The
average protein points in the prostate normal tissue gel
electrophoresis was used as the reference gel, and then the average
protein points of the gland carcinoma tissue and benign prostatic
hyperplasia tissue were compared with these, the obtained values
were 85.6% and 81.3%, respectively. Further repeatability analysis
revealed that the 8 spots of protein patterns in prostate cancer
and benign prostatic hyperplasia were highly repeatable. When the
expression of protein spots and expression levels of all protein
spots totalled >3 and the same protein changes occurred in the
three gel maps, the protein spots were considered to be
differential.
MS results
From the 2-D maps of prostate cancer and benign
prostatic hyperplasia, 31 protein spots were identified as being
differentially expressed by >2-fold and were selected for
MALDI-TOF-MS/MS analysis. A total of 31 PMFs were obtained in 31
points.
Protein identification
The PMF data and a ProFound query were used to
search the NCBInr database and protein points were identified by
comparison and PMF of the proteins. A total of 18 matched scores
equalled >63 points (Table
I).
 | Table IProtein points identified by
comparison and peptide mass fingerprinting of the proteins. |
Table I
Protein points identified by
comparison and peptide mass fingerprinting of the proteins.
| Protein No. | Accession | Protein name | Molecular weight | PI | Peptide
identified | Score |
|---|
| 1 | L13210 | Human Mac-2 binding
protein | 92,000 | 8.45 | 79 | 247 |
| 2 | XP_001352096 | Phosphoglycerate
kinase | 45,569 | 7.63 | 15 | 110 |
| 3 | AAV38387 | Adenylate kinase
1 | 21,735 | 8.73 | 11 | 108 |
| 4 | CAB45236 | Catalase | 59,947 | 6.90 | 17 | 105 |
| 5 | C3HU | Complement C3
precursor | 188,585 | 6.02 | 23a | 95 |
| 6 | 1K1K_B |
Carbonmonoxyhemoglobin C | 15,970 | 7.98 | 12a | 88 |
| 7 | BAB17688 | Heat shock protein
hsp70 homologue Pfhsp70-3 | 71,945 | 5.90 | 30a | 84 |
| 8 | AAD29608 | kappa 1
immunoglobulin light chain | 26,181 | 5.72 | 12a | 78 |
| 9 | XP_001350775 | Calcyclin binding
protein, putative | 30,547 | 8.36 | 10 | 73 |
| 10 | P02735 | Serum amyloid A
protein | 13,581 | 6.28 | 75 | 112 |
| 11 | Q03591 | Factor H-related
protein 1 | 38777 | 7.75 | 37 | 86 |
| 12 | Q9H7N9 | FLJ00029 protein | 27,133 | 8.95 | 20 | 64 |
| 13 | O75635 | Serpin B7 | 43,166 | 6.34 | 31 | 57 |
| 14 | O43866 | CD5 antigen-like | 39,603 | 5.28 | 69 | 212 |
| 15 | P05452 | Tetranectin | 22,951 | 5.52 | 43 | 63 |
| 16 | P00739 | Haptoglobin-related
protein | 39,496 | 6.42 | 24 | 84 |
| 17 | P02766 | Transthyretin | 15,991 | 5.52 | 57 | 128 |
| 18 | O75636 | Ficolin-3 | 33,395 | 6.20 | 38 | 107 |
Discussion
In prostate cancer diagnosis, the prostate-specific
antigen (PSA) is a relative biological indicator, but it is not
very specific for this type of cancer (5). Identifying the tumor markers of
prostate cancer is extremely important for prostate cancer
prevention, treatment and prognosis.
Oncogenes are genes that control cell growth and
have the potential to induce cells to transform into malignant
cells. The products of abnormal gene expression in cancer genes
allow cells to proliferate indefinitely, allowing immortalization
to occur. Searching for cancer genes and taking appropriate
measures in cancer treatment are important means of tumor gene
therapy. 90K/Mac-2BP (Mac-2 binding protein, cytomegalovirus-2
binding protein) was identified in 1986 by Iacobelli et al
and is a tumor-associated antigen (6). It was detected in culture media using
the monoclonal antibody SP-2 from CG-5 breast cancer cell lines and
has 90-kDa subunits, hence the name 90K. 90K is a highly
glycosylated secreted protein, a plant hemagglutinin Mac-2
(galectin-3) ligand. Studies have confirmed that 90K is a serum
diagnostic marker for lymphoma (6)
as well as lung (7), breast
(8), liver (9) and ovarian cancer (10), among others (11,12).
90K is associated with the host response to tumors, which is
capable of inducing the expression of cytokines, such as IL-1, IL-2
and IL-6 (13). 90K is also highly
expressed in proteomic analysis of prostate cancer, indicating that
it is strongly correlated with prostate cancer (14). The present study revealed that 90K
is highly expressed in prostate adenocarcinoma and its expression
is statistically significant in benign prostatic hyperplasia and
normal prostate tissues.
Previous studies have indicated that 90K promotes
tumor metastasis and that the tumor promotion mechanism in
metastasis is associated with galectins. Galectins (galectin-1 and
galectin-3) mainly mediate cell-cell and cell-matrix interactions
and are involved in cell proliferation and angiogenesis. Galectins
are also important in tumor invasion and metastasis. Endogenous
galectin ligands include laminin, fibronectin, lysosome-associated
membrane protein and 90K. Galectin-1 and galectin-3 are highly
expressed in tumor tissues and galectin-3 confers high metastatic
potential. Inohara et al(15) revealed that 90K cross-links
adjacent cells expressing galectin-l and galectin-3 residues,
mediating the blood flow in tumor cell aggregation and thrombus
formation and thus promoting swelling and metastatic spread.
90K-bound galectins use a combination of sugar chains.
Glycosylation inhibitors inhibit 90K and galectin cross-linking
(16). 90K also promotes
matrilysin factor expression (17). 90K and galectins are located in the
extracellular matrix and various matrix components mediate cell
adhesion. Therefore, 90K and galectins enhance tumor cell adhesion
and the extracellular matrix to promote the formation of new tumor
cell clones. The adhesion of the extracellular matrix may aid tumor
cells avoid apoptosis.
To conclude, the proteomic approach used in the
present study was effective and is feasible for identifying
differentially expressed proteins in prostate cancer, benign
prostatic hyperplasia and normal prostate tissues. 90K/Mac-2BP may
be important for the early diagnosis and prognosis of prostate
cancer and may also be associated with the molecular mechanisms of
prostate cancer development.
Acknowledgements
This study was supported by Science
and Technology Fund Project, Guizhou, China [Guizhou Branch co-J Zi
(2010) No. 2274].
References
|
1
|
Jemal A, Tiwari RC, Murray T, et al:
Cancer Statistics, 2004. CA Cancer J Clin. 54:8–29. 2004.
View Article : Google Scholar
|
|
2
|
Jemal A, Siegel R, Ward E, et al: Cancer
statistics, 2006. CA Cancer J Clin. 56:106–130. 2006. View Article : Google Scholar
|
|
3
|
Etzioni R, Urban N, Ramsey S, et al: The
case for early detection. Nat Rev Cancer. 3:243–252. 2003.
View Article : Google Scholar
|
|
4
|
Duffy MJ: Evidence for the clinical use of
tumour markers. Ann Clin Biochem. 41:370–377. 2004. View Article : Google Scholar
|
|
5
|
Ryan CJ and Small EJ: Prostate cancer
update: 2005. Curr Opin Oncol. 18:284–288. 2006.PubMed/NCBI
|
|
6
|
Iacobelli S, Sismondi P, Giai M, et al:
Prognostic value of a novel circulating serum 90K antigen in breast
cancer. Br J Cancer. 69:172–176. 1994. View Article : Google Scholar : PubMed/NCBI
|
|
7
|
Fornarini B, D’Ambrosio C, Natoli C, et
al: Adhesion to 90K (Mac-2 BP) as a mechanism for lymphoma drug
resistance in vivo. Blood. 96:3282–3285. 2000.PubMed/NCBI
|
|
8
|
Ozaki Y, Kontani K, Teramoto K, et al:
Involvement of 90K/Mac-2 binding protein in cancer metastases by
increased cellular adhesiveness in lung cancer. Oncol Rep.
12:1071–1077. 2004.PubMed/NCBI
|
|
9
|
Iacovazzi PA, Guerra V, Elba S, et al: Are
90K/Mac-2BP serum levels correlated with poor prognosis in HCC
patients? Preliminary results. Int J Biol Markers. 18:222–226.
2003.PubMed/NCBI
|
|
10
|
Zeimet AG, Natoli C, Herold M, et al:
Circulating immunostimulatory protein 90K and soluble
interleukin-2-receptor in human ovarian cancer. Int J Cancer.
68:34–38. 1996. View Article : Google Scholar : PubMed/NCBI
|
|
11
|
Greco C, Vona R, Cosimelli M, et al: Cell
surface overexpression of galectin-3 and the presence of its ligand
90k in the blood plasma as determinants in colon neoplastic
lesions. Glycobiology. 14:783–792. 2004. View Article : Google Scholar : PubMed/NCBI
|
|
12
|
Grassadonia A, Tinari N, Iurisci I, et al:
90K (Mac-2 BP) and galectins in tumor progression and metastasis.
Glycoconj J. 19:551–556. 2004. View Article : Google Scholar : PubMed/NCBI
|
|
13
|
Powell TJ, Schreck R, McCall M, et al: A
tumor-derived protein which provides T-cell costimulation through
accessory cell activation. J Immunother Emphasis Tumor Immunol.
17:209–221. 1995. View Article : Google Scholar : PubMed/NCBI
|
|
14
|
Sardana G, Marshall J and Diamandis EP:
Discovery of candidate tumor markers for prostate cancer via
proteomic analysis of cell culture-conditioned medium. Clin Chem.
53:429–437. 2007. View Article : Google Scholar : PubMed/NCBI
|
|
15
|
Inohara H, Akahani S, Koths K and Raz A:
Interactions between galecetin-3 and Mac-2-binding protein mediate
cell-cell adhesion. Cancer Res. 56:4530–4534. 1996.PubMed/NCBI
|
|
16
|
Ulmer TA, Keeler V, Loh L, et al:
Tumor-associated antigen 90K/Mac-2-binding protein: possible role
in colon cancer. J Cell Biochem. 98:1351–1366. 2006. View Article : Google Scholar : PubMed/NCBI
|
|
17
|
Bair EL, Nagle RB, Ulmer TA, Laferté S and
Bowden GT: 90K/Mac-2 binding protein is expressed in prostate
cancer and induces promatrilysin expression. Prostate. 66:283–293.
2006. View Article : Google Scholar : PubMed/NCBI
|