Introduction
Liver fibrosis occurs as a wound-healing process
following liver injury induced by chronic liver disease and is
identified by an exorbitant accumulation of extracellular matrix
(ECM), scar tissue or collagen (1).
The deposition of ECM proteins substitute for functional tissues
and disrupt the normal liver architecture, which in turn leads to
pathophysiological damage (2). The
primary causes of liver fibrosis include chronic high alcohol
ingestion and infection with hepatitis B and C. Less common causes
include viral infection, hemochromatosis, primary biliary
cirrhosis, primary sclerosing cholangitis, helminth infection,
autoimmune diseases and nonalcoholic steatohepatitis (3). Hepatic fibrosis is a vital stage that
occurs during the development of chronic liver disease. Cirrhosis
and hepatocellular carcinomas are of great concern worldwide due to
the high morbidity and mortality rates associated with them
(4). There are currently no
effective therapies to treat liver cirrhosis; however, it has been
suggested that the damage may be reversible if treated
appropriately during the early, fibrotic stage of cirrhosis
(5). Therefore, identifying an
effective treatment for hepatic fibrosis is critical in order to
decrease the chances of patients with hepatic fibrosis developing
chronic liver disease.
Liver biopsy is the gold standard of diagnosis for
different stages of fibrosis and inflammation. However, this
technique may cause complications including bleeding, pain, bile
peritonitis, pneumothorax and mortality. Furthermore, there are
problems due to the procedure being invasive and sampling errors
occurring (6,7). Vessel imaging serves a crucial role in
the diagnosis of hepatic fibrosis. Additionally, vessel imaging can
help test for hepatic fibrosis in the early stages, making it
useful for investigating the development of hepatic fibrosis
(8). However, traditional imaging
techniques widely used in clinical practice, including magnetic
resonance elastography and conventional radiography, are
ineffective at detecting mild to moderate hepatic fibrosis,
particularly in obese patients (9,10). In
recent years, technological developments have led to a novel,
non-invasive method, protein fingerprinting of the extracellular
matrix remodeling (11), which is
being developed to diagnose hepatic fibrosis. The method includes
biochemical and hematological tests and the assessment of serum
biomarkers in connective tissue. However, it has no sensitive,
specific or reproducible application methods to detect the early
stages of fibrosis (11). Thus, it
is important to investigate other treatment options and identify
effective techniques for the early diagnosis of liver fibrosis.
Liver fibrosis biomarkers and characterization of metabolic changes
indicate that the onset of fibrosis occurs earlier than other
diagnostic forms, including noninvasive diagnostics such as imaging
diagnosis (12). This may provide an
effective way to detect liver fibrosis early, enabling the
administration of effective treatment and a clearer understanding
of the molecular mechanisms.
Metabonomics is a comprehensive analytical
technology used to study biological systems and is defined as ‘the
quantitative measurement of the dynamic multi-parametric responses
of a living system to pathophysiological stimuli or genetic
modification’ (13). Metabonomics
screens for metabolic biomarkers to detect related endogenous
metabolites, toxicological and pharmacological effects, describe
metabolic pathways, and explain the function of complex biological
systems to distinguish disease states (14). A number of analytical platforms have
been employed for metabonomic analysis, including liquid
chromatography coupled with mass spectrometry, nuclear magnetic
resonance, high-performance liquid chromatography/mass spectrometry
and gas chromatography-mass spectrophotometry (GC/MS) (15). GC/MS is a major analytical tool for
metabonomic studies used to analyze various types of samples
including those from the serum, urine, cerebrospinal fluid and
plasma. GC/MS produces results at a high resolution,
reproducibility, sensitivity and accuracy while being simple and
providing good separability (16).
Multivariate statistical methods, Including principal component
analysis (PCA) and orthogonal projections to latent structures
(OPLS) are generally used to assess metabonomic data collected by
GC/MS. PCA is an unsupervised mode recognition method that changes
a range of correlated variables into a number of smaller
uncorrelated variables called principal components.
OPLS-discriminant analysis (OPLS-DA) is a method of discerning
between two or more groups so that differences in variables may be
identified. These methods provide classification of observations
and a vast amount of information regarding the latent structures by
regression during the modeling (17).
The present study investigated the main
pharmacodynamics index, assessed changes to serum and urine
metabolite group pathways that occur during liver fibrosis and
identified potential biomarkers for liver fibrosis using GC/MS. The
study aimed to examine the practicality of GC/MS in the study of
metabonomics and provide novel targets for innovative drugs to
treat liver fibrosis.
Materials and methods
Reagents
Analytical grade pyridine, chloral hydrate, olive
oil and L-2-chlorophenylalanine were purchased from Shanghai
Hengbai Biotech Co., Ltd., (Shanghai, China). Carbon tetrachloride
(CCl4) was purchased from Xilong Chemical Co., Ltd., (Guangdong,
China) and bis- (trimethylsilyl) trifluoroacetamide (BSTFA) was
purchased from Regis Technologies, Inc. (Morton Grove, IL,
USA).
Animal Experiments
A total of 10, male Sprague-Dawley rats weighing
180–220 g and 7 weeks old were purchased from Anhui Medical
University (Anhui, China). All the rats were allowed ad libitum
access to food and water and housed individually in a facility at
18–22°C, 40–60% humidity and a 12 h light-dark cycle. Surgery was
performed under anesthesia with sodium pentobarbital (2 ml/kg,
intraperitoneal injection, IP) purchased from Shanghai chemical
reagent Co., Ltd. (Shanghai, China), and all efforts were made to
minimize suffering. The protocol was approved by the Committee on
the Ethics of Animal Experiments, Anhui University of Chinese
Medicine (approval no. 2012AH-038-01; Anhui, China).
CCl4 induction and
treatment groups
Following 1 week of acclimatization, rats were
randomly separated into two groups: Control group (n=5) and model
group (n=5). The model group was treated with CCl4 (0.1 ml/100 g
50% CCl4, diluted to 50% in olive oil), injected subcutaneously
into the back twice a week for 12 weeks to induce liver fibrosis.
Samples of overnight (12 h) urine and serum were collected in
metabolism cages from all rats 12 weeks following initial CCl4
injection. All urine and serum samples were stored at −80°C.
Histopathology
At the end of the experimental period, the animals
were anesthetized with sodium pentobarbital (2 ml/kg, IP). A lobe
of liver tissue (~2.0×2.0×0.3 cm) from each rat was removed during
surgery and fixed in 10% neutral formalin at 25°C (6–12 h), which
prior to staining with hematoxylin and eosin (H&E) and Masson
stains for histological examination as standard.
Sample preparation for GC/MS
analysis
For samples of serum and urine, 100 µl of each was
used. The urine sample was mixed with 10 µl urease suspension (160
mg/ml in water) in 1.5 ml EP tubes and vortexed for 10 sec. This
was incubated at 37°C for 1 h in order to decompose and remove
excess urea. Serum and urine samples were then each mixed with 0.35
ml extraction liquid (3:1, Vmethanol:Vchloroform) and 50 µl
L-2-chlorophenylalanine (0.2 mg/ml stock in H2O) as an internal
standard, in 1.5 ml EP tubes prior to 10 sec vortexing. The serum
sample underwent centrifugation for 10 min at 23,500 × g at 4°C.
For samples of serum and urine, 0.35 ml supernatant was transferred
into fresh 2 ml GC/MS glass vials, dried in a vacuum concentrator
without heating. Methoxyamination reagent (Shanghai chemical
reagent Co., Ltd.; 80 ml of 20 mg/ml in pyridine) was added and the
samples underwent shaking for 2 h at 37°C. A further 1 h of shaking
at 70°C was completed following the addition of 0.1 ml BSTFA regent
(1% TriMethyl Chloro Silane, Tri Methyl Chloro Silane, v/v) to the
sample aliquots. GC/MS analysis was completed when samples had
cooled to room temperature.
An Agilent 7890a gas chromatograph system (Agilent
Technologies, Santa Clara, CA, USA) coupled with a Pegasus 4D
time-of-flight mass spectrometer (LECO Corporation®, Saint Joseph,
MI, USA) was used to perform GC/MS analysis. This system utilizes a
DB-5MS capillary column coated with 5% diphenyl cross-linked with
95% dimethylpolysiloxane (30×250 µm inner diameter, 0.25 µm film
thickness; J&W Scientific, Agilent Technologies). The carrier
gas used was helium, the gas flow rate through the column was 1
ml/min and the front inlet purge flow was 3 ml/min. A 1 µl aliquot
of the analyte was injected in split-less mode. The initial
temperature was kept at 80°C for 12 sec, prior to being increased
to 180°C at a rate of serum: 10°C/min for serum (urine: 5°C/min),
then to: 240°C (urine: 220°C) at a rate of: 5°C/min (urine:
4°C/min) and finally to: 290°C (urine: 285°C) at a rate of 20°C/min
for 11 min (urine: 10 min). The transfer line, injection and ion
source temperatures were 270, 280, and 220°C, respectively. The
energy was −70 eV in electron impact mode. Full-scan mode was used
to acquire mass spectrometry data, with an m/z range of 20–600 at a
rate of 100 spectra/sec following a solvent delay of 492 sec.
Data analysis
Chroma TOF4.3X software (LECO corporation®) and
LECO-Fiehn Rtx5 database were used to examine raw peaks (http://fiehnlab.ucdavis.edu/projects/FiehnLib/). The
data baselines filtered and calibrated the peak alignment,
deconvolution analysis, peak identification and integration of the
peak area. The peaks were normalized to the total sum of the
spectrum prior to multivariate analyses and the resulting data were
analyzed using PCA and OPLS with SIMCA-P, software version 11.5
(Umetrics, Umeå, Sweden) following a unit variance procedure. The
concentrations of potential biomarkers were represented as their
relative areas (divided by the internal standard areas).
Statistical analysis
Quantitative data was presented as mean ± standard
deviation. Statistical analysis was completed by one-way analysis
of variance with Student Newman-Keuls test using the Statistic
Package for Social Science software, version 17.0 (SPSS, Inc.,
Chicago, IL, USA). The histological grade of the liver was
evaluated using Ridit analysis. P<0.05 was considered to
represent a statistically significant difference.
Results
Histopathological changes to hepatic
tissues
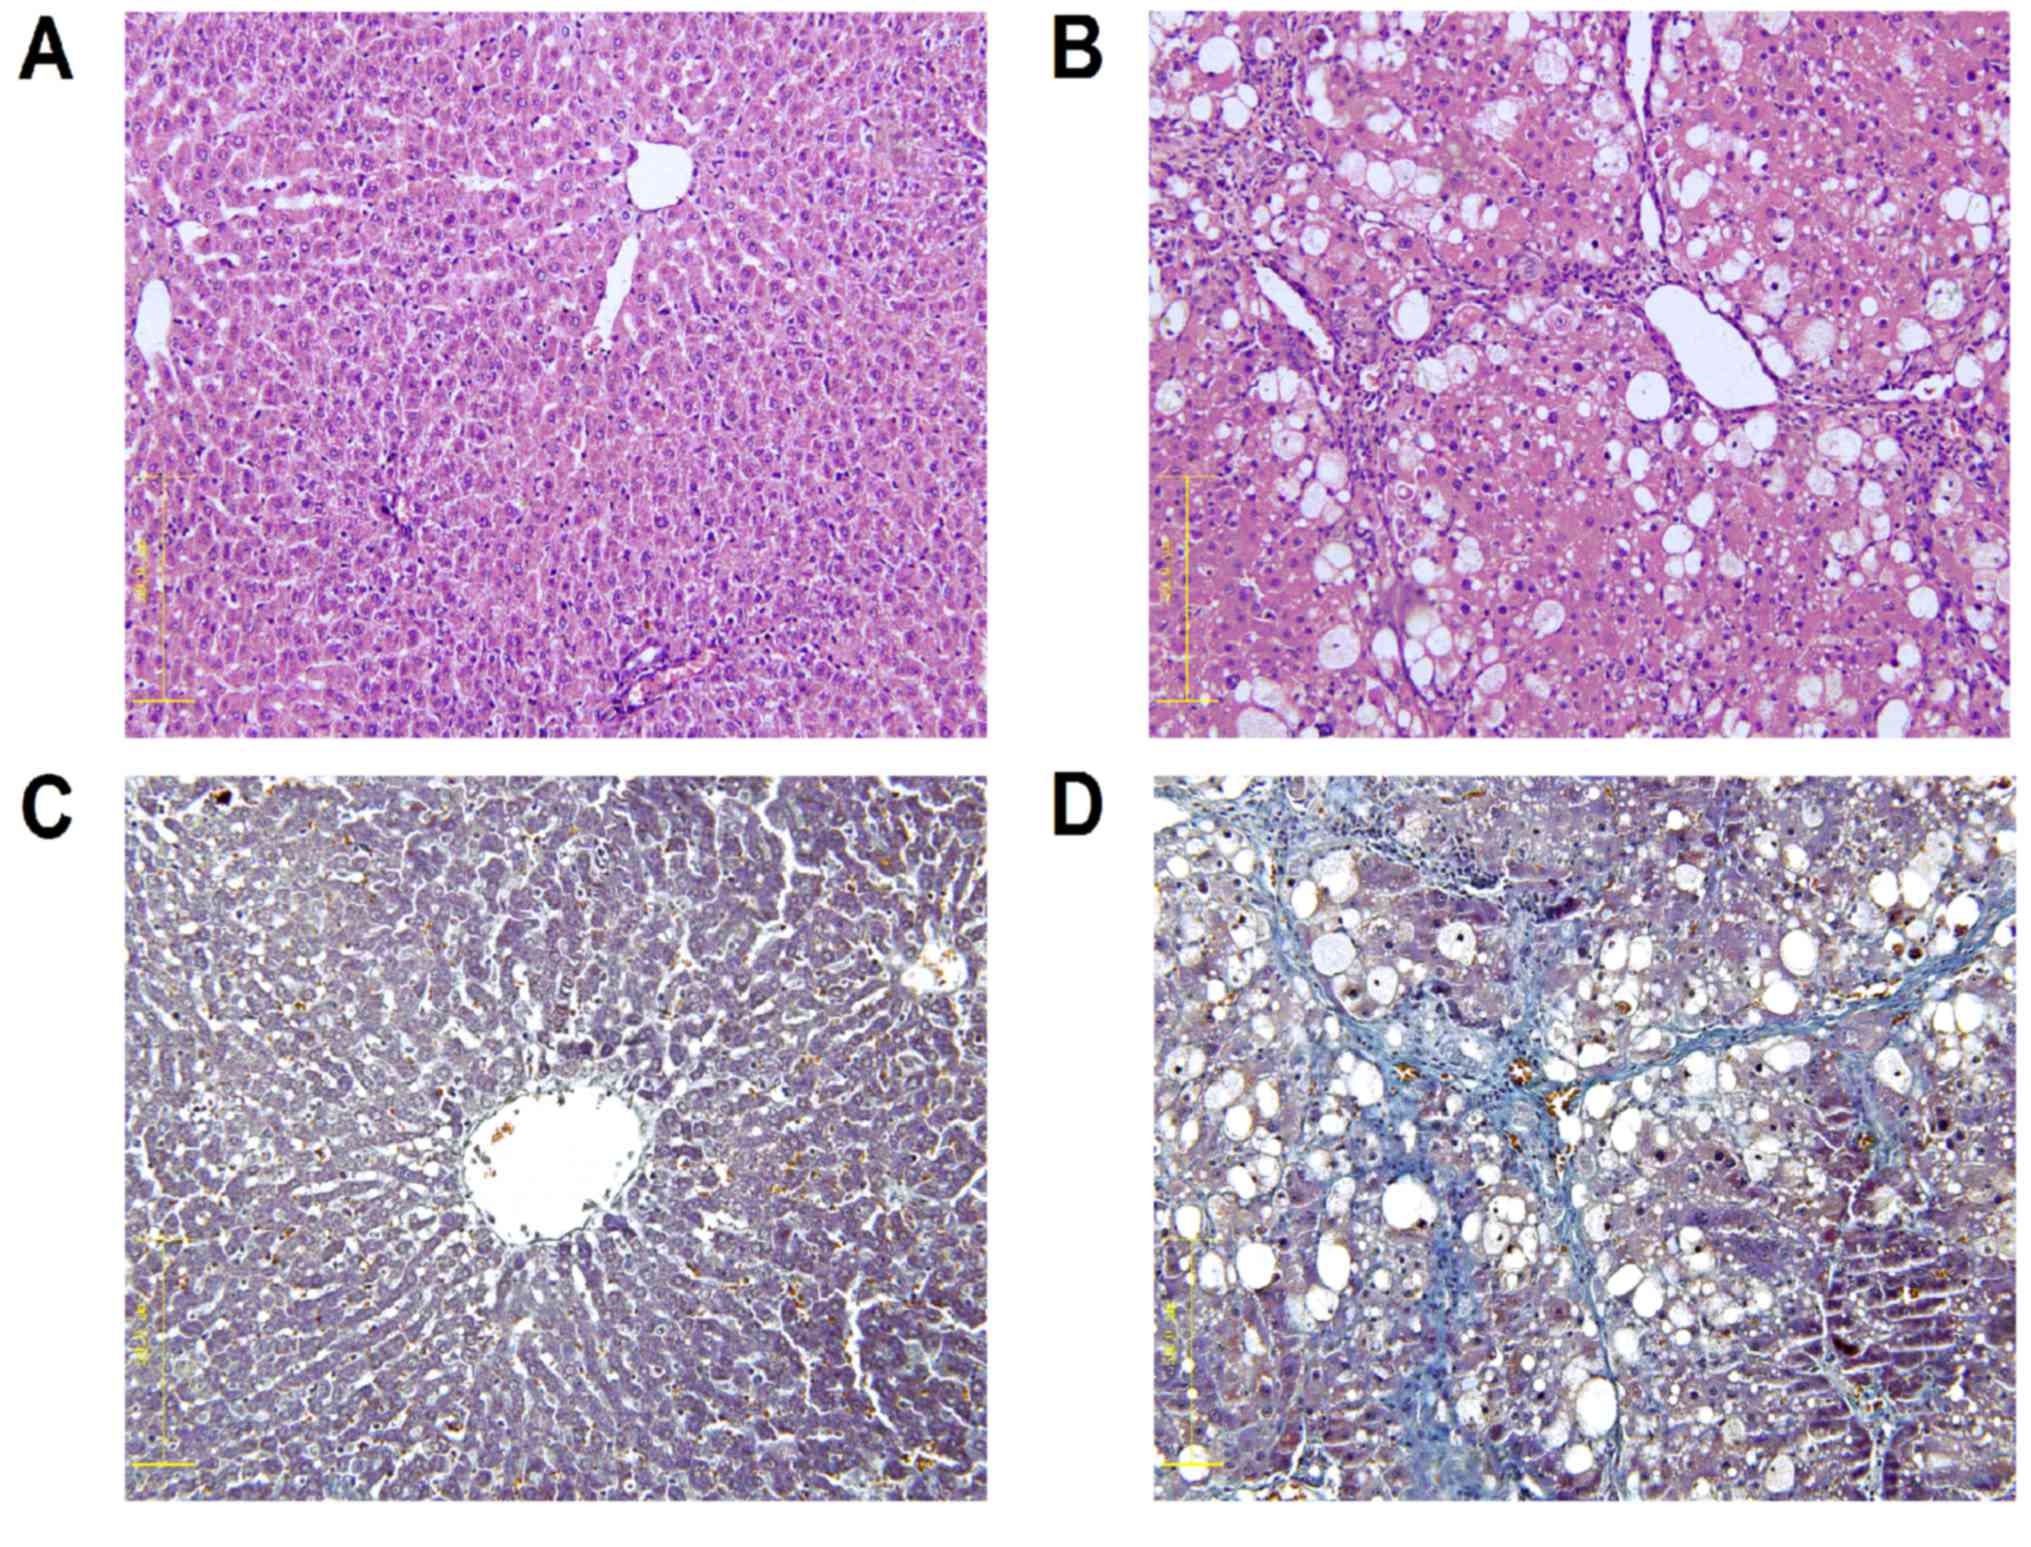
Fig. 1 presents liver
tissue samples from each group following H&E and Masson
staining. The control liver cell structure was clear with a large
and round nucleus and abundant in cytoplasm with very little
collagen deposition (Fig. 1A). The
liver tissue samples from the model group exhibited greater
hyperplasia of fibrous connective tissue, fatty degeneration,
steatosis, cell necrosis, infiltration of inflammatory cells and a
larger number of collagen fibers compared with the control group
(Fig. 1B). Collagen fibers were
stained blue following Masson staining. The portal area and
interlobular septa had a small amount of collagen fibers deposited,
which were shallow and small in the control group (Fig. 1C). However, the model group exhibited
an increased amount of collagen fiber hyperplasia, a diffusing
distribution of depth and a bulky and a false flocculus of hepatic
lobule a divided hepatic lobule into the pseudolobule (Fig. 1D).
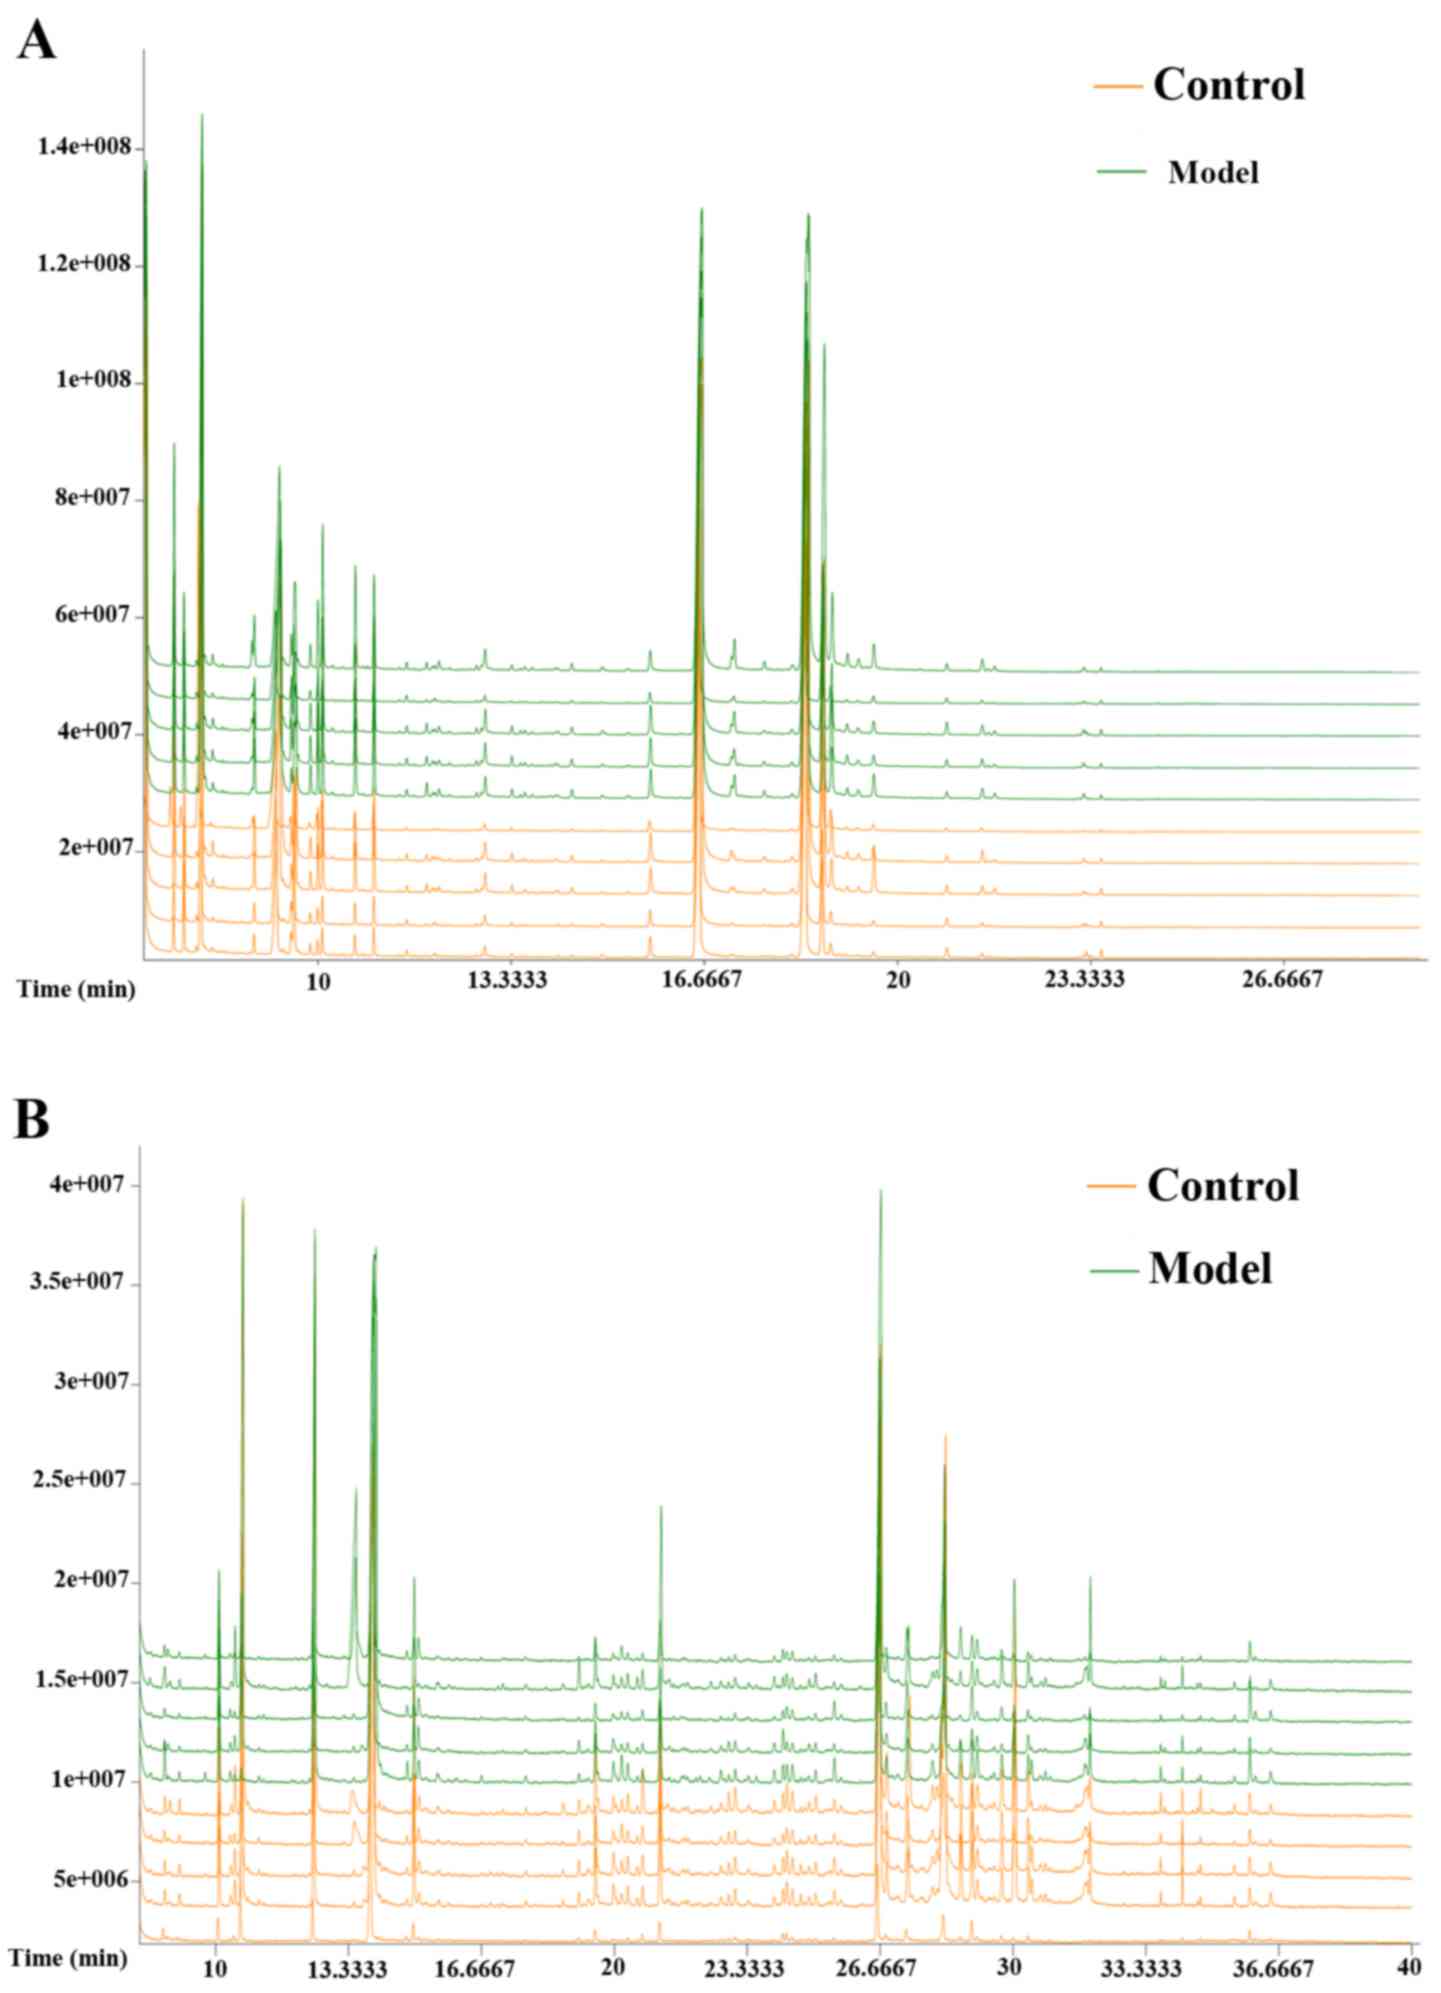
GC/MS spectra of the two groups
The typical GC/MS total ion current (TIC)
chromatograms of rat serum and urine 12 weeks following injection
for the model group is presented in Fig.
2. The horizontal axis represents the time at which metabolites
occur while the vertical axis represents the metabolite abundance.
The peaks were considered to be representative chemical
fingerprints of endogenous metabolites and the time above them
represents their retention time (18). The area under a peak represents the
relative richness of the metabolites. There were clear differences
between the TIC profiles of the control and model groups. Spectra
were pre-treated further and a pattern recognition analysis was
performed to illuminate changes in the metabolic profiles.
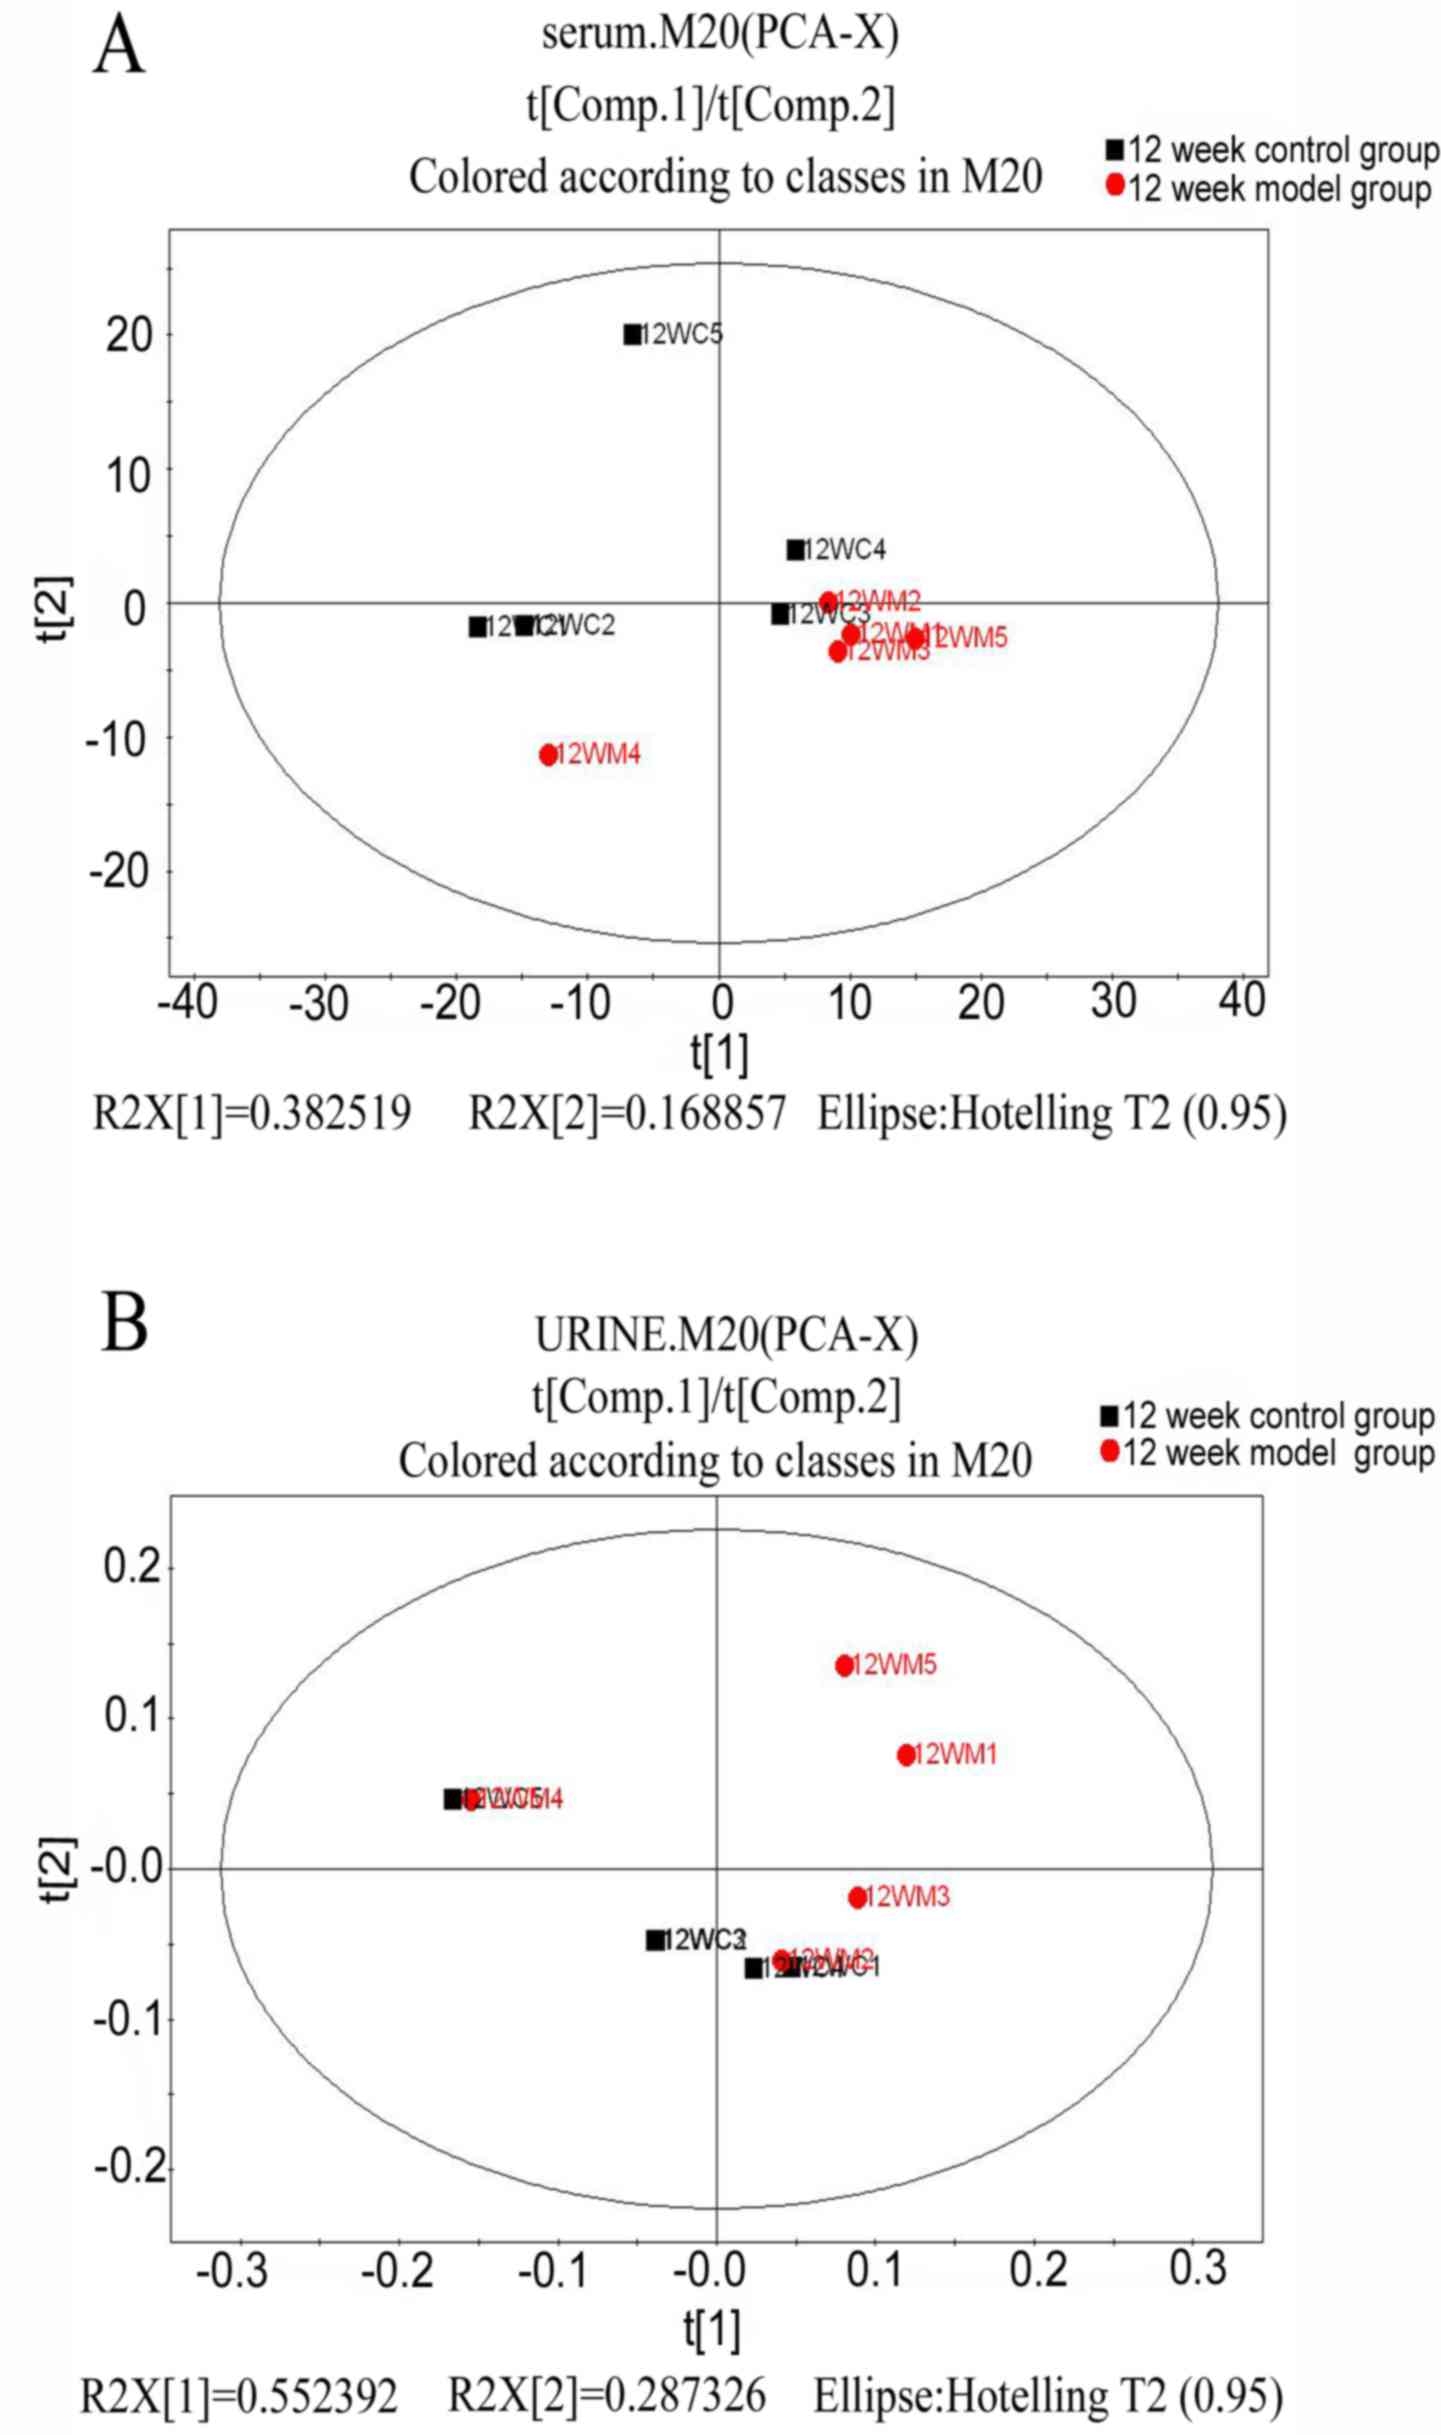
PCA analysis
To understand the general trends and identify
differences and outliers among the groups in serum and urine by
GC/MS spectra, an unsupervised PCA was carried out to analyze the
multivariate data (19,20). In the score plot of PCA, each data
point represents the samples at week 12; the distance between
points in the score plot indicates the similarity between samples.
The results demonstrated that there were unsatisfactory separations
in the score plots between the two groups (Fig. 3).
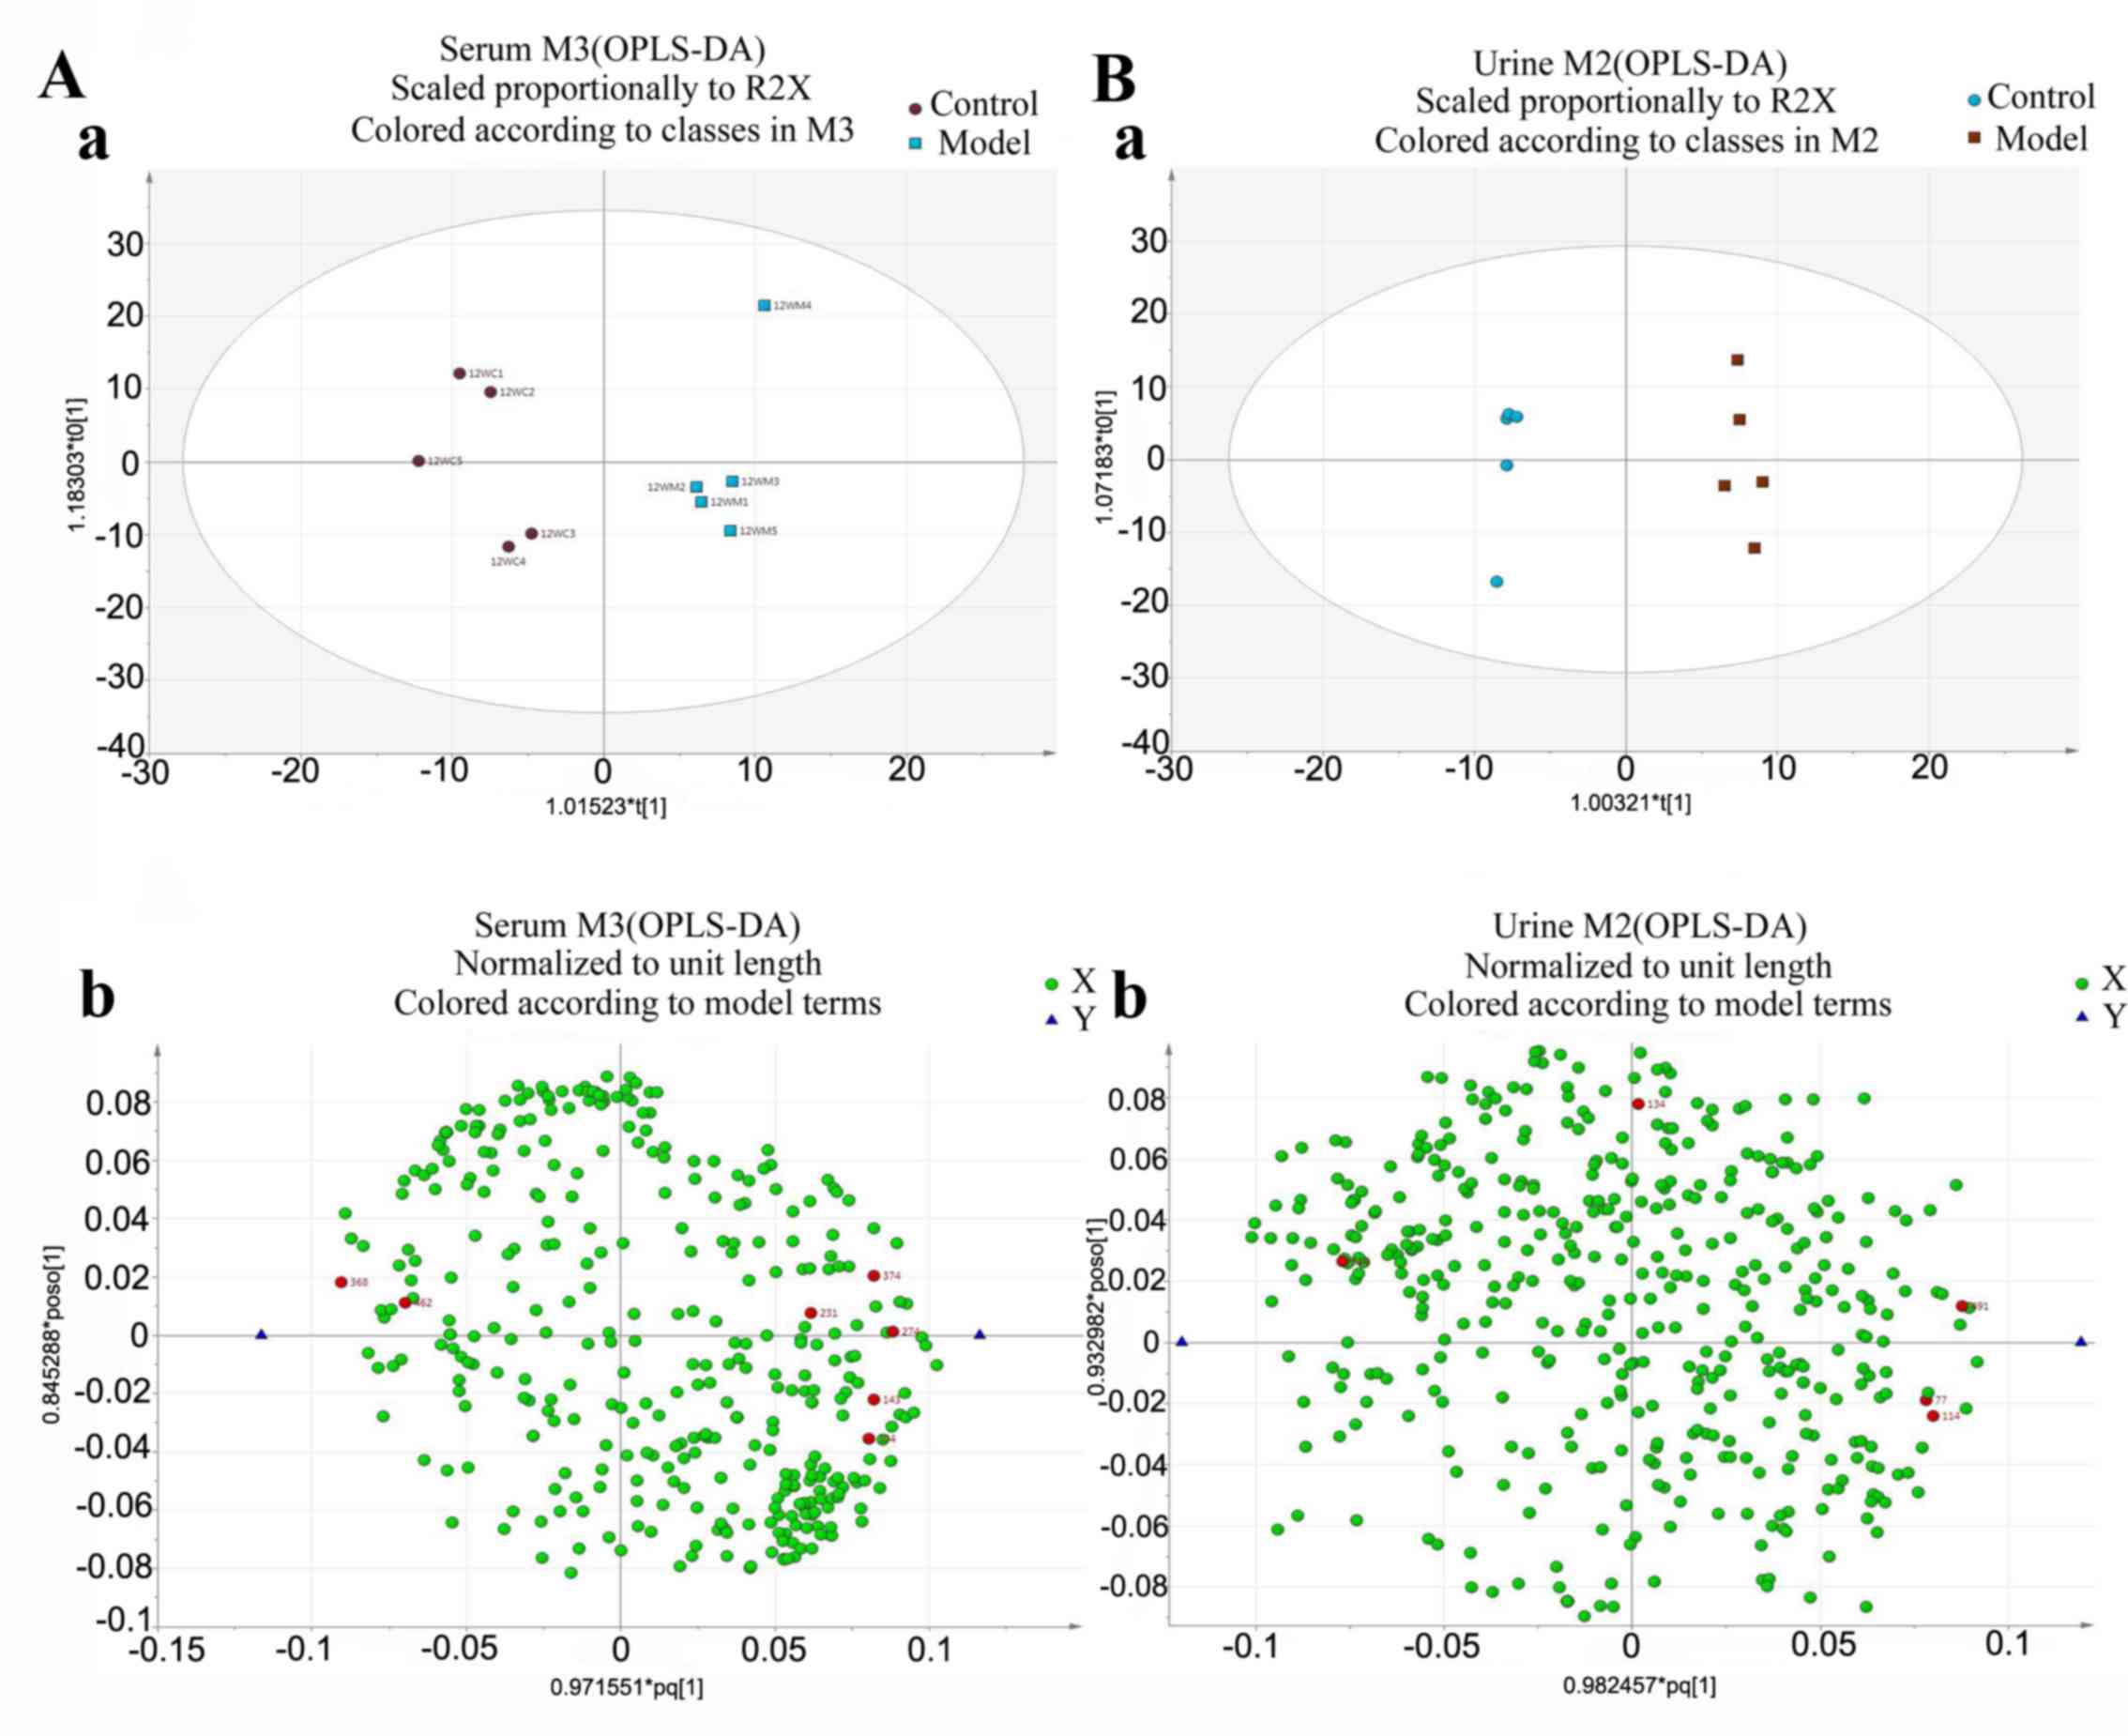
OPLS-analysis
To obtain a higher level of group separation and
enhance recognition of variables contribution to classification,
OPLS analysis was completed (21).
The experimental results demonstrated that following OPLS analysis,
the model group had been separated from the control group in serum
and urine. This indicates that the model of liver fibrosis was
produced successfully and endogenous metabolites in serum and urine
of model rats were different compared with the control group
(Fig. 4).
Identification of endogenous
metabolites
To further investigate the targeting biomarkers on
the metabolite profiles of liver fibrosis, the first principal
component of variable importance projection (VIP) was obtained by
assessing the influence of every term in the matrix variable X on
all the variable Y's, where X and Y indicate the time and
metabolite, respectively. VIP is normalized so that Sum
(VIP)2=K (number of terms in the matrix X.) VIP values
>1.0 were selected as changed metabolites initially. The
remaining variables were assessed by Student's t-test, which was
reserved between two comparison groups. To further identify the
potential biomarkers, commercial databases including the Kyoto
Encyclopedia of Genes and Genomes (KEGG, accessible at: http://www.genome.jp/kegg/) and PubChem Compound
(accessible at: https://pubchem.ncbi.nlm.nih.gov/) were utilized to
search for metabolites (22). Based
on the aforementioned analysis, seven metabolites in serum
(Table I) and five metabolites in
urine (Table II) were listed as
significantly altered. For serum, the control group exhibited
increased levels of carnitine, glucose and fucose, while
isoleucine, L-malic acid, α-copper and hippuric acid levels were
increased in the model group. In the urine, levels of
N-acetyl-β-alanine and cytidine were increased in the control group
compared with the model group while the model group had increased
levels of 2-hydroxy butyric acid, isoleucine and corticoid.
 | Table I.Biomarkers and the changing trend of
CCl4-liver fibrosis in rat serum at 12 weeks. |
Table I.
Biomarkers and the changing trend of
CCl4-liver fibrosis in rat serum at 12 weeks.
| Metabolite No. | Var ID
(Primary) | Possible
compounds | RT, min | VIP | Biomarker content
in MG |
|---|
| 1 | 143 | isoleucine | 9.86869 | 1.78195 |
Increasea |
| 2 | 231 | malic acid | 12.2710 | 1.53429 |
Increaseb |
| 3 | 274 | α-copper glutaric
acid | 13.4922 | 1.97915 |
Increasea |
| 4 | 304 | carnitine | 14.3948 | 1.86529 |
Decreasea |
| 5 | 368 | glucose | 17.5476 | 1.58140 |
Decreaseb |
| 6 | 374 | hippuric acid | 17.7654 | 1.78514 |
Increasea |
| 7 | 462 | fucose | 26.9799 | 1.48060 |
Decreaseb |
| Table II.Biomarkers and the changing trend of
CCl4-liver fibrosis in rat urine at 12 weeks. |
Table II.
Biomarkers and the changing trend of
CCl4-liver fibrosis in rat urine at 12 weeks.
| Metabolite No. | Var ID
(Primary) | Possible
compounds | RT, min | VIP | Biomarker content
in MG |
|---|
| 1 | 77 | 2-hydroxy butyric
acid | 12.9871 | 2.48859 |
Increasea |
| 2 | 114 | isoleucine | 15.0919 | 1.29507 |
Increasea |
| 3 | 134 |
N-acetyl-β-alanine | 16.9516 | 2.53192 |
Decreasea |
| 4 | 314 | cytidine | 24.8217 | 2.38341 |
Decreasea |
| 5 | 491 | corticoid | 34.8550 | 2.96963 |
Increasea |
Biological pathway and function
analysis
Metabolite profiling analyzes a group of metabolites
related to a specific metabolic pathway in biological states. To
determine whether the observed changes in the metabolites reflected
coordinate changes in defined metabolic pathways, CytoKEGG version
3.0.1 (Cytoscape Consortium, San Diego, CA, USA) was used for
pathway construction. The pathways were based on seven metabolites
in serum, including isoleucine, L-malic acid, α-copper, carnitine,
hippuric acid, glutaric acid, glucose and fucose. The substances
were associated with glucose, amino acid, P450, fatty acid or
energy metabolism. CytoKEGG was also used for pathway construction
based on the five altered metabolites in urine, including 2-hydroxy
butyric acid, isoleucine, n-acetyl-β-alanine, cytidine and
corticoid. The majority of these substances are related to amino
acid metabolism, energy metabolism, glutathione biosynthesis and
metabolism, nucleic acid metabolism or water-electrolyte metabolism
(Fig. 5).
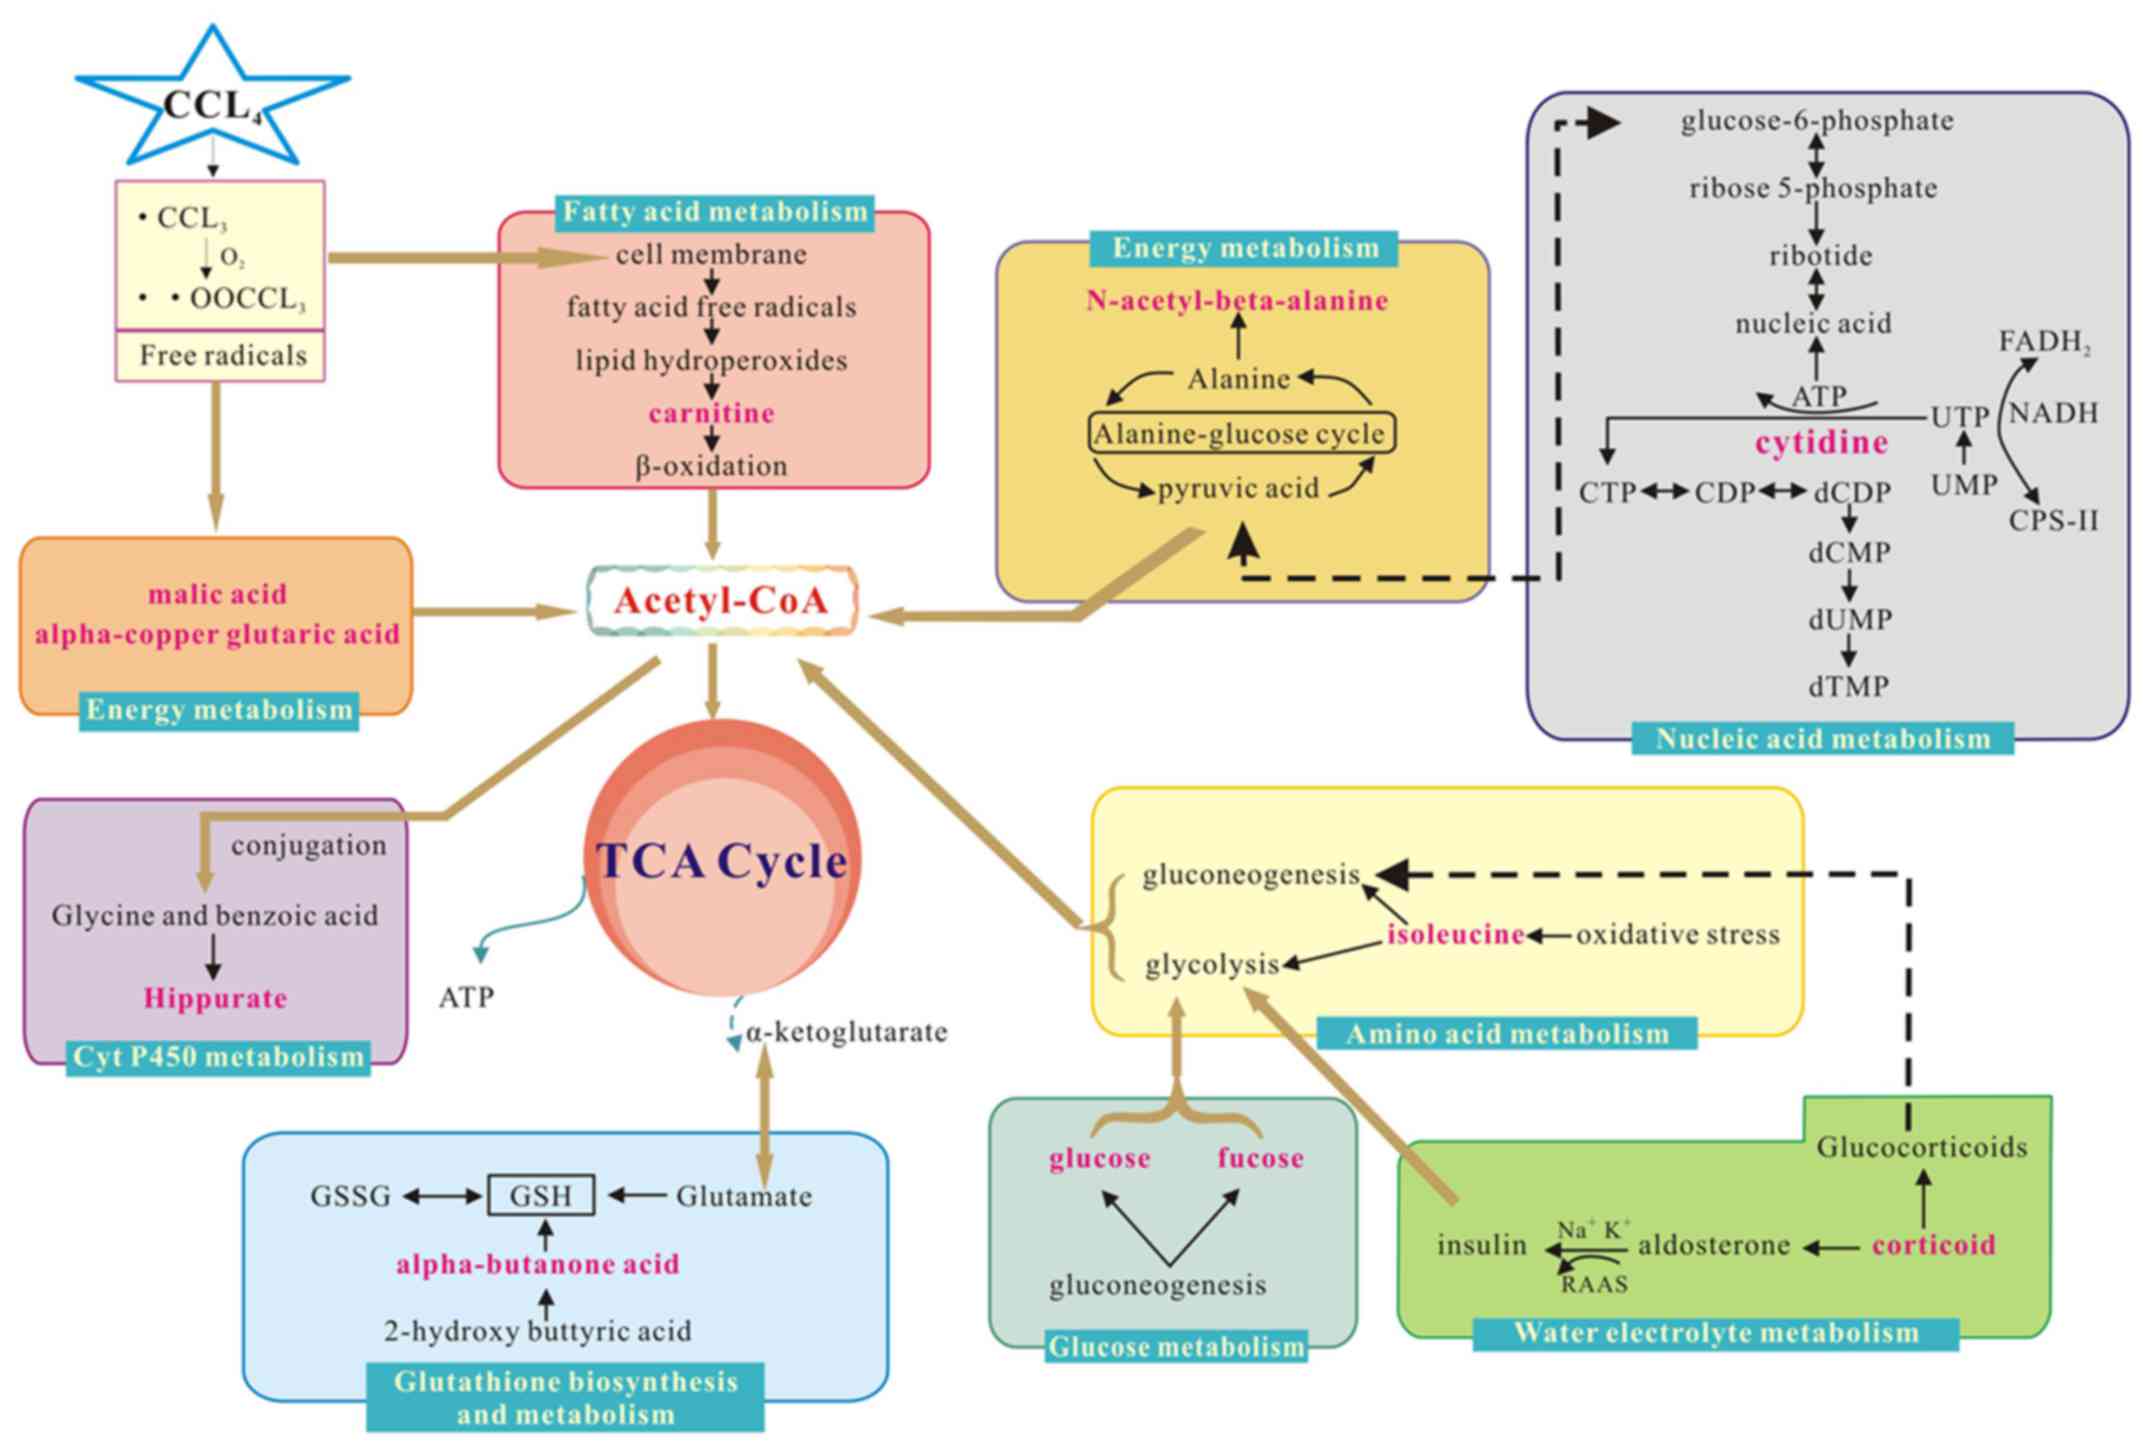 | Figure 5.Interference of the metabolic pathway
analysis in the control and model groups. Red text denotes the
endogenous metabolites used to explain the possible metabolic
pathways, and box plot of endogenous metabolites next to its
metabolic pathways. CCl4, carbon tetrachloride;
Acetyl-CoA, Acetyl coenzyme A; RAAS, Renin-Angiotensin-Aldosterone
System; ATP, adenosine triphosphate; CTP, Cytidine triphosphate;
CDP, Cytidine diphosphate; dCDP, deoxygenation cytidine
diphosphate; dCMP, deoxygenation adenosine monophosphate; dUMP,
deoxygenation uridine monophosphate; UTP, uridine triphosphate;
UMP, uridine monophosphate; FADH2, flavine adenine
dinucleotide 2; NADH, reduced form of nicotinamide-adenine
dinucleotid; Cps-II, carbamyl phosphate synthetase-II; GSSG:
oxidized glutathione; GSH: glutathione; TCA: tricarboxylic acid
cycle. |
Discussion
Liver fibrosis is caused by a variety of factors,
including hepatic stellate cell activation and proliferation
leading to the synthesis and secretion of ECM. This leads to a
large amount of collagen fiber deposition and eventually, the liver
fibrosis (23). Liver fibrosis is
the pathological basis of liver disease, which is a reversible
lesion. However, the next step of liver disease, liver cirrhosis is
irreversible (24). Therefore, it is
important to develop methods to stop the progression of liver
fibrosis.
CCl4 is one of the chemicals known to be
a common cause of acute chemical liver injury (25). As it causes a high incidence of ECM
secretion, this model is easy to reproduce and is one of the common
classical models of liver injury. The present study demonstrated
that the hepatic cell swelling and marked necrosis observed in a
number of collagen fibers in the model group may be induced by
CCl4, proving that it is a successful model of liver
fibrosis.
Metabonomics is a novel analytical method that
includes analysis of endogenous metabolites in various biofluids
and tissues and indicates potential associations between metabolic
profile changes and the physiological condition of the biosystems
(26,27). Regarding the analysis of serum and
urine samples at 12 weeks by GC/MS, the results indicated that
CCl4 exposure caused significant metabolic alterations
in serum and urine samples, which affected related metabolic
pathways.
Carnitine is an unusual amino acid synthesized by
lysine and methionine in the liver. Carnitine has more important
functions than other amino acids as it is involved in the process
of protein synthesis and supplies energy through transporting fat
into the mitochondria. Therefore, it is an indispensable factor in
the process of fatty acid metabolism (28). A previous study indicated that the
content of carnitine in serum for the model group was lower than in
the control group (29). Thus, the
change of carnitine content in the model group affects the
proceeding metabolism of fatty acids to a certain degree. The
disorder of fatty acid metabolism may damage the mitochondria and
lysosome, causing extracellular micro-organ damage and enhancing
the toxicity of cytokines (30).
This may lead to liver degeneration, inflammatory cell infiltration
and consequently, fibrosis. Therefore, the present study indicates
that there is an association between liver fibrosis and fatty acid
metabolism.
In the serum, the content of glucose and fucose
decreased in the model group compared with the control group. This
indicates that liver diseases, such as liver fibrosis, are
associated with a disturbance of carbohydrate metabolism. In the
process of liver disease, the ability of insulin inactivation in
the liver is inhibited and due to this, insulin levels in serum are
markedly increased. This leads to the utilization of glucose,
therefor enhancing the level of fucose while glucose levels
decrease (31,32). This is consistent with the decrease
of saccharides observed in the model group of rats in the current
study. Saccharides, such as glucose, are the primary raw material
for energy usage in the liver; they are also essential factors in
the sugar metabolic pathways (33).
In the present study, the content of glucose and fucose was
downregulated in the serum of the model group, therefore, it is
suggested that glucose and fucose levels are associated with
glycometabolism changes. The change in glucose and fucose may also
be related to the inactivation of insulin in the process of hepatic
fibrosis (34).
In both serum and urine, the isoleucine was
increased in the model group compared with the control group,
indicating that an amino acid metabolism disorder may exist in
liver fibrosis. A large number of experiments have demonstrated
that hepatopathy is strongly linked to inflammatory and oxidative
stress (35,36). Under oxidative stress, glycolysis and
gluconeogenesis are inhibited. Isoleucine is a branched-chain amino
acid, which is involved in the synthesis of glucose into
triglycerides (TCA) in mammals by acetyl-coenzyme A (acetyl CoA)
(37). If gluconeogenesis is
restrained, it may lead to an increase of isoleucine in hepatic
cells (38). As the important
intermediate products of TCA, malic acid and α-copper glutaric acid
are an energy supply for the body. Following CCl4
injections in rats, CCl4 decomposes into
CCl3· and CCl3O3, free radicals
that induce oxidative stress by attacking the liver cells (39). It has been demonstrated that the TCA
cycle is inhibited to reduce the generation of oxygen free radicals
under oxidative stress and may be associated with liver diseases
(40). Thus, an increase in the
content of malic acid and α-copper glutaric acid may be caused by
disturbance of the TCA cycle in the model group.
Alanine is an essential amino acid, transformed to
pyruvic acid in hepatocytes and then pyruvic acid prior to entering
the mitochondrial TCA pathway (41).
N-acetyl-β-alanine is an alanine derivative, which can be converted
into acetyl-CoA; this enters the mitochondrial pathway and
participates in the TCA cycle, which is involved in energy
metabolism and energy supply to the body (42). The variation of alanine and
N-acetyl-β-alanine may be ascribed to the dysfunction of TCA.
Through the analysis of urine metabolite spectrum in rats, it was
demonstrated that the content of N-acetyl-β-alanine was reduced in
the model rats, which may be associated with disturbance of energy
metabolism.
Compared with the control group, there was an
increase of hippuric acid in the model group. Hippuric acid is
produced by combining glycine with benzoic acid during cytochrome
P450 catalysis (43). Consequently,
changes in hippuric acid content in the model group may occur
following changes in cytochrome P450, which is closely related to
the formation of liver fibrosis.
The content of 2-hydroxy butyric acid in the model
group is increased compared with in the control group. 2-hydroxy
butyric acid is a type of organic acid derived from α-butanone acid
and is involved in the synthesis and metabolism of glutathione
(44). Changes in glutathione
synthesis consequently result in the content of 2-hydroxy butyric
acid. It has been demonstrated that glutathione can protect the
liver from oxidative stress damage, which is closely associated
with liver disease (45).
Cytosine is one of the pyrimidine bases in nucleic
acids and participates in complementary base pairing, which forms
cytidine, synthesizes cytidylic acid at a nucleoside triphosphate
level and participates in nucleic acid synthesis and metabolism
(46). The liver is the area of
nucleoside synthesis within the body. Therefore, consistent with
the results of the present study, a number of reasons including
injury, inflammation and fibrosis lead to the loss of liver
function and nucleic acid synthesis insufficiency. In urine, the
content of cytidine in the model group is lower than in the control
group, which may relate to a disturbance of nucleic acid
metabolism.
The content of corticoid in the model group was
increased compared with the control group. Corticoid includes
glucocorticoid and mineralocorticoid, while aldosterone is a
primary mineralocorticoid that is primarily regulated by the
renin-angiotensin-aldosterone system (RAAS), sodium and potassium
in the blood, which in turn is regulated by water-electrolyte
metabolism (47). It has been
indicated that RAAS locally exists in the liver (48). When hepatic fibrosis occurs, the
level of inactivated aldosterone decreases depending on how much
the liver function subsides, thus RAAS emerges at a high activity
and is closely associated with the formation of liver fibrosis.
Therefore, the change of corticoid content in the model group may
be a reaction to the change in water-electrolyte metabolism.
In conclusion, the present study demonstrated that
exposure to CCl4 induced liver damage and significantly
altered a number of metabolic pathways. Histological results
indicated that the model of liver fibrosis induced by
CCl4 in rats was successful. Pattern recognition with
multivariate statistical analysis indicated that the metabolic
profile of CCl4-induced liver fibrosis was clearly
separated from the control group. Potential biomarkers were
identified, seven metabolites in serum and five metabolites in
urine, which may be associated with the disturbance of energy,
amino acid, carbohydrate, cytochrome P450, glutathione synthesis,
fatty acid, nucleic acid and water-electrolyte metabolisms. The
current study provided novel drug targets and demonstrated that
metabonomic methods based on GC/MS maybe a useful tool for
determining the pathogenesis of diseases.
Acknowledgements
The present study was financially supported by
National Natural Science Foundation of China (grant no. 81102874).
We are grateful to Ms. Jie Xu and Dr Junliang Deng (Biotree
Bio-technology Co., Ltd., Shanghai, China) for providing help with
data analysis.
Glossary
Abbreviations
Abbreviations:
|
CCl4
|
carbon tetrachloride
|
|
GC/MS
|
gas chromatography-mass
spectrometry
|
|
PCA
|
principal component analysis
|
|
OPLS
|
orthogonal projections to latent
structures
|
|
DA
|
discriminant analysis
|
|
ECM
|
extracellular matrix
|
|
H&E
|
hematoxylin and eosin
|
|
BSTFA
|
bis-(trimethylsilyl)
trifluoroacetamide
|
|
SPSS
|
Statistic Package for Social
Science
|
|
TIC
|
total ion current
|
|
VIP
|
variable importance projection
|
|
KEGG
|
Kyoto Encyclopedia of Genes and
Genomes
|
|
TCA
|
triglycerides
|
|
acetyl-CoA
|
acetyl-coenzyme A
|
|
RAAS
|
renin-angiotensin-aldosterone
system
|
References
|
1
|
Zira A, Kostidis S, Theocharis S, Sigala
F, Engelsen SB, Andreadou I and Mikros E: 1H NMR-based metabonomics
approach in a rat model of acute liver injury and regeneration
induced by CCl4 administration. Toxicology. 303:115–124. 2013.
View Article : Google Scholar : PubMed/NCBI
|
|
2
|
Zheng J, Wu C, Lin Z, Guo Y, Shi L, Dong
P, Lu Z, Gao S, Liao Y, Chen B and Yu F: Curcumin up-regulates
phosphatase and tensin homologue deleted on chromosome 10 through
microRNA-mediated control of DNA methylation-a novel mechanism
suppressing liver fibrosis. FEBS J. 281:88–103. 2014. View Article : Google Scholar : PubMed/NCBI
|
|
3
|
Zhang S, Wu J, Wang H, Wang T, Jin L, Shu
D, Shan W and Xiong S: Liposomal oxymatrine in hepatic fibrosis
treatment: Formulation, in vitro and in vivo assessment. AAPS
PharmSciTech. 15:620–629. 2014. View Article : Google Scholar : PubMed/NCBI
|
|
4
|
Sun LL, Chang W, Jiao LQ, Cui X and Dong
G: Hepatic fibrosis and supersonic shear imaging in patients with
different etiological chronic hepatic diseases. J Biol Regul
Homeost Agents. 30:761–765. 2016.PubMed/NCBI
|
|
5
|
Seo KW, Sohn SY, Bhang DH, Nam MJ, Lee HW
and Youn HY: Therapeutic effects of hepatocyte growth
factor-overexpressing human umbilical cord blood-derived
mesenchymal stem cells on liver fibrosis in rats. Cell Biol Int.
38:106–116. 2014. View Article : Google Scholar : PubMed/NCBI
|
|
6
|
Lee JE, Lee JM, Lee KB, Yoon JH, Shin CI,
Han JK and Choi BI: Noninvasive assessment of hepatic fibrosis in
patients with chronic hepatitis B viral infection using magnetic
resonance elastography. Korean J Radiol. 15:210–217. 2014.
View Article : Google Scholar : PubMed/NCBI
|
|
7
|
Ozkurt H, Keskiner F, Karatag O, Alkim C,
Erturk SM and Basak M: Diffusion weighted MRI for hepatic fibrosis:
Impact of b-Value. Iran J Radiol. 11:e35552014.PubMed/NCBI
|
|
8
|
Lu Q, Luo Y, Yuan CX, Yan LN, Wu H and
Zhang ZW: Ultrasound imaging of bridge vessel transplant used to
reconstruct the tributary of middle hepatic vein in living donor
liver transplantation. Sichuan Da Xue Xue Bao Yi Xue Ban.
38:529–531. 2007.(In Chinese). PubMed/NCBI
|
|
9
|
Duan J, Hu C, Luo S, Zhao X and Wang T:
Microcomputed tomography with diffraction-enhanced imaging for
morphologic characterization and quantitative evaluation of
microvessel of hepatic fibrosis in rats. PLoS One. 8:e781762013.
View Article : Google Scholar : PubMed/NCBI
|
|
10
|
Razek AA, Khashaba M, Abdalla A, Bayomy M
and Barakat T: Apparent diffusion coefficient value of hepatic
fibrosis and inflammation in children with chronic hepatitis.
Radiol Med. 119:903–909. 2014. View Article : Google Scholar : PubMed/NCBI
|
|
11
|
Leeming DJ, Byrjalsen I, Jiménez W,
Christiansen C and Karsdal MA: Protein fingerprinting of the
extracellular matrix remodelling in a rat model of liver fibrosis-a
serological evaluation. Liver Int. 33:439–447. 2013. View Article : Google Scholar : PubMed/NCBI
|
|
12
|
Manna SK, Thompson MD and Gonzalez FJ:
Application of mass spectrometry-based metabolomics in
identification of early noninvasive biomarkers of alcohol-induced
liver disease using mouse model. Adv Exp Med Biol. 815:217–238.
2015. View Article : Google Scholar : PubMed/NCBI
|
|
13
|
Huang X, Shao L, Gong Y, Mao Y, Liu C, Qu
H and Cheng Y: A metabonomic characterization of CCl4-induced acute
liver failure using partial least square regression based on the
GC/MS metabolic profiles of plasma in mice. J Chromatogr B Analyt
Technol Biomed Life Sci. 870:178–185. 2008. View Article : Google Scholar : PubMed/NCBI
|
|
14
|
Gou X, Tao Q, Feng Q, Peng J, Zhao Y, Dai
J, Wang W, Zhang Y, Hu Y and Liu P: Urine metabolic profile changes
of CCl4-liver fibrosis in rats and intervention effects of Yi Guan
Jian Decoction using metabonomic approach. BMC Complement Altern
Med. 13:1232013. View Article : Google Scholar : PubMed/NCBI
|
|
15
|
Ressom HW, Xiao JF, Tuli L, Varghese RS,
Zhou B, Tsai TH, Ranjbar MR, Zhao Y, Wang J, Di Poto C, et al:
Utilization of metabolomics to identify serum biomarkers for
hepatocellular carcinoma in patients with liver cirrhosis. Anal
Chim Acta. 743:90–100. 2012. View Article : Google Scholar : PubMed/NCBI
|
|
16
|
Wu H, Liu T, Ma C, Xue R, Deng C, Zeng H
and Shen X: GC/MS-based metabolomic approach to validate the role
of urinary sarcosine and target biomarkers for human prostate
cancer by microwave-assisted derivatization. Anal Bioanal Chem.
401:635–646. 2011. View Article : Google Scholar : PubMed/NCBI
|
|
17
|
Sun S, Dai J, Fang J, Gou X, Cao H, Zheng
N, Wang Y, Zhang W, Zhang Y, Jia W and Hu Y: Differences of excess
and deficiency zheng in patients with chronic hepatitis B by
urinary metabonomics. Evid Based Complement Alternat Med.
2013:7382452013. View Article : Google Scholar : PubMed/NCBI
|
|
18
|
Feng B, Wu S, Liu F, Gao Y, Dong F and Wei
L: Metabonomic analysis of liver tissue from BALB/c mice with
D-galactosamine/lipopolysaccharide-induced acute hepatic failure.
BMC Gastroenterol. 13:732013. View Article : Google Scholar : PubMed/NCBI
|
|
19
|
Yu K, Sheng G, Sheng J, Chen Y, Xu W, Liu
X, Cao H, Qu H, Cheng Y and Li L: A metabonomic investigation on
the biochemical perturbation in liver failure patients caused by
hepatitis B virus. J Proteome Res. 6:2413–2419. 2007. View Article : Google Scholar : PubMed/NCBI
|
|
20
|
Lin B, Zhang H, Lin Z, Fang Y, Tian L,
Yang H, Yan J, Liu H, Zhang W and Xi Z: Studies of single-walled
carbon nanotubes-induced hepatotoxicity by NMR-based metabonomics
of rat blood plasma and liver extracts. Nanoscale Res Lett.
8:2362013. View Article : Google Scholar : PubMed/NCBI
|
|
21
|
Chen J, Wang W, Lv S, Yin P, Zhao X, Lu X,
Zhang F and Xu G: Metabonomics study of liver cancer based on ultra
performance liquid chromatography coupled to mass spectrometry with
HILIC and RPLC separations. Anal Chim Acta. 650:3–9. 2009.
View Article : Google Scholar : PubMed/NCBI
|
|
22
|
Ma J, Yu J, Su X, Zhu C, Yang X, Sun H,
Chen D, Wang Y, Cao H and Lu J: UPLC-MS-based serum metabonomics
for identifying acute liver injury biomarkers in Chinese miniature
pigs. Toxicol Lett. 225:358–366. 2014. View Article : Google Scholar : PubMed/NCBI
|
|
23
|
Chen B, Ye B, Zhang J, Ying L and Chen Y:
RDW to platelet ratio: A novel noninvasive index for predicting
hepatic fibrosis and cirrhosis in chronic hepatitis B. PLoS One.
8:e687802013. View Article : Google Scholar : PubMed/NCBI
|
|
24
|
Frias M, Rodriguez-Cano D, Cuenca-López F,
Macías J, Gordon A, Manzanares-Martín B, Pineda JA, Camacho Á,
Torre-Cisneros J, Peña J, et al: HLA-B18 as risk factor of liver
fibrosis progression in HIV/HCV treatment-experienced patients.
Pharmacogenomics J. Oct 25–2016.(Epub ahead of print). View Article : Google Scholar
|
|
25
|
Chheda TK, Shivakumar P, Sadasivan SK,
Chanderasekharan H, Moolemath Y, Oommen AM, Madanahalli JR and
Marikunte VV: Fast food diet with CCl4 micro-dose induced
hepatic-fibrosis-a novel animal model. BMC Gastroenterol.
14:892014. View Article : Google Scholar : PubMed/NCBI
|
|
26
|
Gou X, Tao Q, Feng Q, Peng J, Sun S, Cao
H, Zheng N, Zhang Y, Hu Y and Liu P: Urinary metabonomics
characterization of liver fibrosis induced by CCl4 in rats and
intervention effects of Xia Yu Xue Decoction. J Pharm Biomed Anal.
74:62–65. 2013. View Article : Google Scholar : PubMed/NCBI
|
|
27
|
Sun H, Zhang AH, Zou DX, Sun WJ, Wu XH and
Wang XJ: Metabolomics coupled with pattern recognition and pathway
analysis on potential biomarkers in liver injury and
hepatoprotective effects of yinchenhao. Appl Biochem Biotechnol.
173:857–869. 2014. View Article : Google Scholar : PubMed/NCBI
|
|
28
|
Giudetti AM, Stanca E, Siculella L, Gnoni
GV and Damiano F: Nutritional and hormonal regulation of citrate
and carnitine/acylcarnitine transporters: Two mitochondrial
carriers involved in fatty acid metabolism. Int J Mol Sci. 17(pii):
E8172016. View Article : Google Scholar : PubMed/NCBI
|
|
29
|
Demiroren K, Dogan Y, Kocamaz H, Ozercan
IH, Ilhan S, Ustundag B and Bahcecioglu IH: Protective effects of
L-carnitine, N-acetylcysteine and genistein in an experimental
model of liver fibrosis. Clin Res Hepatol Gastroenterol. 38:63–72.
2014. View Article : Google Scholar : PubMed/NCBI
|
|
30
|
Muroya Y, Ito O, Rong R, Takashima K, Ito
D, Cao P, Nakamura Y, Joh K and Kohzuki M: Disorder of fatty acid
metabolism in the kidney of PAN-induced nephrotic rats. Am J
Physiol Renal Physiol. 303:F1070–F1079. 2012. View Article : Google Scholar : PubMed/NCBI
|
|
31
|
Manco M and Nobili V: Beta-cell glucose
sensitivity in patients with liver fibrosis. Gut.
57:10232008.PubMed/NCBI
|
|
32
|
Haukeland JW, Konopski Z, Linnestad P,
Azimy S, Løberg E Marit, Haaland T, Birkeland K and Bjøro K:
Abnormal glucose tolerance is a predictor of steatohepatitis and
fibrosis in patients with non-alcoholic fatty liver disease. Scand
J Gastroenterol. 40:1469–1477. 2005. View Article : Google Scholar : PubMed/NCBI
|
|
33
|
Zant R, Melter M, Beck D, Ameres M,
Knoppke B and Kunkel J: Glucose metabolism and associated outcome
after pediatric liver transplantation. Transplant Proc.
48:2709–2713. 2016. View Article : Google Scholar : PubMed/NCBI
|
|
34
|
Haraguchi M, Miyaaki H, Ichikawa T,
Shibata H, Honda T, Ozawa E, Miuma S, Taura N, Takeshima F and
Nakao K: Glucose fluctuations reduce quality of sleep and of life
in patients with liver cirrhosis. Hepatol Int. 11:125–131. 2017.
View Article : Google Scholar : PubMed/NCBI
|
|
35
|
Bala S, Csak T, Saha B, Zatsiorsky J,
Kodys K, Catalano D, Satishchandran A and Szabo G: The
pro-inflammatory effects of miR-155 promote liver fibrosis and
alcohol-induced steatohepatitis. J Hepatol. 64:1378–1387. 2016.
View Article : Google Scholar : PubMed/NCBI
|
|
36
|
Araújo Júnior RF, Garcia VB, Leitão RF,
Brito GA, Ede C Miguel, Guedes PM and de Araújo A: Carvedilol
improves inflammatory response, oxidative stress and fibrosis in
the alcohol-induced liver injury in rats by regulating kuppfer
cells and hepatic stellate cells. PLoS One. 11:e01488682016.
View Article : Google Scholar : PubMed/NCBI
|
|
37
|
Wang H, Zhang Y, Wang T, You H and Jia J:
N-methyl-4-isoleucine cyclosporine attenuates CCl -induced liver
fibrosis in rats by interacting with cyclophilin B and D. J
Gastroenterol Hepatol. 26:558–567. 2011. View Article : Google Scholar : PubMed/NCBI
|
|
38
|
Tajiri K and Shimizu Y: Branched-chain
amino acids in liver diseases. World J Gastroenterol. 19:7620–7629.
2013. View Article : Google Scholar : PubMed/NCBI
|
|
39
|
Britton RS and Bacon BR: Role of free
radicals in liver diseases and hepatic fibrosis.
Hepatogastroenterology. 41:343–348. 1994.PubMed/NCBI
|
|
40
|
Miyake M, Innami T and Kakimoto Y: A
beta-citryl-L-glutamate-hydrolysing enzyme in rat testes. Biochim
Biophys Acta. 760:206–214. 1983. View Article : Google Scholar : PubMed/NCBI
|
|
41
|
Kadotani A, Fujimura M, Nakamura T, Ohyama
S, Harada N, Maruki H, Tamai Y, Kanatani A and Eiki J: Metabolic
impact of overexpression of liver glycogen synthase with
serine-to-alanine substitutions in rat primary hepatocytes. Arch
Biochem Biophys. 466:283–289. 2007. View Article : Google Scholar : PubMed/NCBI
|
|
42
|
Burelle Y, Fillipi C, Péronnet F and
Leverve X: Mechanisms of increased gluconeogenesis from alanine in
rat isolated hepatocytes after endurance training. Am J Physiol
Endocrinol Metab. 278:E35–E42. 2000.PubMed/NCBI
|
|
43
|
Volpe DA, Tobin GA, Tavakkoli F, Dowling
TC, Light PD and Parker RJ: Effect of uremic serum and uremic
toxins on drug metabolism in human microsomes. Regul Toxicol
Pharmacol. 68:297–303. 2014. View Article : Google Scholar : PubMed/NCBI
|
|
44
|
Bouthillier LP, Pushpathadam JJ and
Binette Y: Study of the metabolism of 2-hydroxy-4-amino-butyric
acid, a product of gamma-hydroxyglutamic acid decarboxylation. Can
J Biochem. 44:171–177. 1966. View Article : Google Scholar : PubMed/NCBI
|
|
45
|
Gallagher EP, Gardner JL and Barber DS:
Several glutathione S-transferase isozymes that protect against
oxidative injury are expressed in human liver mitochondria. Biochem
Pharmacol. 71:1619–1628. 2006. View Article : Google Scholar : PubMed/NCBI
|
|
46
|
Cai J, Gong R, Yan F, Yu C, Liu L, Wang W,
Lin Y, Guo M, Li W and Huang Z: ZNF300 knockdown inhibits forced
megakaryocytic differentiation by phorbol and erythrocytic
differentiation by arabinofuranosyl cytidine in K562 cells. PLoS
One. 9:e1147682014. View Article : Google Scholar : PubMed/NCBI
|
|
47
|
Masoumi A, Ortiz F, Radhakrishnan J,
Schrier RW and Colombo PC: Mineralocorticoid receptor antagonists
as diuretics: Can congestive heart failure learn from liver
failure? Heart Fail Rev. 20:283–290. 2015. View Article : Google Scholar : PubMed/NCBI
|
|
48
|
Queisser N, Happ K, Link S, Jahn D, Zimnol
A, Geier A and Schupp N: Aldosterone induces fibrosis, oxidative
stress and DNA damage in livers of male rats independent of blood
pressure changes. Toxicol Appl Pharmacol. 280:399–407. 2014.
View Article : Google Scholar : PubMed/NCBI
|