Introduction
The prevalence of diabetes mellitus is increasing
annually worldwide; it is estimated that by 2030, the global
diabetic population will reach approximately 4.39 billion (1). Diabetic nephropathy (DN), one of the
most common and serious systemic microvascular complications of
diabetes (2). A previous study
reported a prevalence rate of DN among Chinese adults as high as
30.9% in the diabetic population and identified DN as a major cause
of end-stage renal disease (ESRD) worldwide (3). Therefore, it is essential to
implement proactive and early preventative and treatment strategies
for delaying the progression of DN to ESRD (4-6).
The incidence of DN is generally considered to vary based on
genetic background and some associated risk factors (7), and DN is considered to result from
the interaction between hemodynamic and metabolic factors. Its
pathogenesis involves multiple factors and pathways, including
lipid metabolism disorders and renal ectopic lipid accumulation
(8-10).
DN is mainly characterized by glomerular damage and
tubulointerstitial lesions. It has a complex pathogenesis,
involving nephritis, interstitial fibrosis (also known as pulmonary
fibrosis), renal tubular atrophy and abnormal lipid metabolism
(11-14).
There is growing evidence that dyslipidemia plays a crucial role in
the development of DN (11,15).
Patients with DN often present with significant dyslipidemia. In
dyslipidemia, high level of triglycerides, low levels of HDL
cholesterol and lipoproteins with altered composition are
transported and deposited in the kidney. This process activates the
inflammatory responses and causes oxidative stress, mitochondrial
dysfunction and cell death, thereby damaging the kidney (12,16-19).
A previous study has shown that changes in renal triglyceride and
cholesterol metabolism can lead to lipid accumulation in DN, and
there is a highly significant association between renal function,
inflammation and lipid metabolism-related genes (11). Another study explored the role of
annexin A1 (ANXA1) in diabetic mice and proximal tubular epithelial
cells (PTECs) treated with high glucose plus palmitic acid and
found that ANXA1 may regulate lipid metabolism in PTECs, thereby
improving disease progression (20). Disordered lipid metabolism is a key
factor responsible for DN progression. Ectopic lipid deposition is
aggravated in DN, which promotes tubular cell inflammation and
apoptosis. As a result, DN-induced pathological changes are further
aggravated (21-23).
Diacylglycerol, triacylglycerol (TAG), and lysophosphatidylcholine
(LPC) are significantly upregulated in patients with DN (19). Among these,
phosphatidylethanolamine (PE) is an important multifunctional
glycerophospholipid, and its metabolic abnormalities are closely
associated with lipid metabolism disorders in DN (24-27).
but the regulatory role of lipid metabolism-related genes in DN
remains to be elucidated.
Bioinformatics methods are powerful tools for
identifying potential key genes involved in a disease. Therefore,
they have attracted increasing attention in recent years for
analyzing microarray data. The present study investigated the
influence of lipid metabolism on DN by analyzing lipid
metabolism-related genes through machine-learning algorithms and
integrating their potential functional pathways. In addition, it
performed immune infiltration analysis to explore the association
between key genes of lipid metabolism and immune cells. Finally, it
verified these key genes by reverse transcription-quantitative
(RT-q)PCR.
Materials and methods
Data source
Gene expression profiles from the GSE142153 dataset
(28), comprising data from
peripheral blood samples obtained from 23 patients with DN and 10
healthy controls, were downloaded from the Gene Expression Omnibus
database (ncbi.nlm.nih.gov/geo/), which was obtained from the
GPL6480 platform (Table SI). This
dataset included microarray data, which were presented in the form
of raw signal intensities or gene expression levels. In addition,
904 lipid metabolism-related genes were acquired from the Molecular
Signature Database (https://www.gsea-msigdb.org/gsea/msigdb).
Differential expression analysis
The present study employed the R package limma
(29) to analyze the
differentially expressed genes (DEGs) between DN and healthy
samples in the GSE142153 dataset, based on the criteria
|log2FC| >0.5 and P<0.05. Next, the
ggplot2(30) and pheatmap
(31) packages in R (version
4.0.2, 2020, R-project.org/) were used to generate
the volcano plot and heatmap of DEGs, respectively.
Weighted gene co-expression network
analysis (WGCNA)
To find the genes linked with DN, the WGCNA package
in R (32) was performed to
construct a co-expression network based on the 23 DN samples and 10
healthy samples in the GSE142153 dataset. First, to ensure the
accuracy of the analysis, these samples were clustered to remove
the outliers. Next, to ensure the interactions of genes accord with
the scale-free distribution to the maximum extent, the soft
threshold of all data was determined. Subsequently, the
dissimilarity coefficients of genes were calculated and the
systematic clustering tree was obtained. For each gene module, the
minimum module size was set as 150 with the criteria of the dynamic
tree cutting, and similar modules were merged. Ultimately, the
relationships among the modules and clinical traits (DN and
healthy) were calculated to identify the key modules (correlation
coefficient |cor| ≥0.6, P≤0.05). Module membership (MM) correlation
between key module genes and the modules, and the gene significance
(GS) correlation between key module genes and clinical traits were
further calculated to identify the genes in DN (|MM| >0.8 and
|GS| >0.2) (33).
Identification and protein-protein
interaction (PPI) of the lipid metabolism-related genes in DN
The present study intersected DEGs, key module genes
and 904 lipid metabolism-related genes to identify lipid
metabolism-related genes in DN using the Venn Diagram R package
(34). The associations among
these genes were determined. In addition, a PPI network was
constructed using STRING (https://cn.string-db.org/) database (confidence=0.15)
(35) to analyze the interaction
between the proteins of lipid metabolism-related genes in DN.
Functional enrichment analysis
Gene Ontology (GO) and Kyoto Encyclopedia of Genes
and Genomes (KEGG) analyses were performed to investigate the
potential role of lipid metabolism-related genes in DN using the
clusterProfiler R package (36).
The results were visualized using GOplot (37) and the enrichplot package (38).
Screening and Gene Set Enrichment
Analysis (GSEA) of lipid metabolism-related hub genes in DN
To identify the hub genes of lipid metabolism in DN,
two classification models were established using 23 DN and 10
healthy samples: The Least Absolute Shrinkage and Selector
Operation (LASSO) algorithm model in R package glmnet (39) and the Support Vector
Machine-Recursive Feature Elimination (SVM-RFE) algorithm model in
R package e1071(40). The
efficiency of these two models was determined using a 10-fold
cross-validation method. The intersections of the results obtained
using these two models were employed as the lipid
metabolism-related hub genes in DN for the subsequent research. In
addition, the R package clusterProfiler (36) was used to perform GSEA of the hub
genes. The correlations between hub genes and other genes was
determined using the default gene sets in the org. Hs. eg. db
package (version 3.12.0, bioconductor.org/packages/release/data/annotation/html/org.Hs.eg.db.html).
The significance thresholds were |Normalized Enrichment Score
(NES)| >1, P<0.05 and q<0.2.
Immune infiltration evaluation
To investigate discrepancies in immune cell
infiltration between the DN and healthy samples, the present study
evaluated 28 types of immune cell infiltrations in the 23 DN and 10
healthy samples in the GSE142153 dataset using the ‘ssGSEA’ method
in the GSVA R package (41). A
heatmap was plotted of the ssGSEA scores of immune cells for each
sample. The various immune cells between DN and healthy samples
were evaluated using Wilcoxon rank-sum test and the results were
visualized through the Vioplot package (version 0.3.7; github.com/TomKellyGenetics/vioplot).
Ultimately, the Pearson correlation coefficients between each
immune cell, the immune cells and hub genes were calculated and
visualized using corrplot package in R (42).
RT-qPCR
The present study collected peripheral blood
mononuclear cell samples from 10 healthy subjects and 10 patients
with DN from the First People's Hospital of Yunnan Province
(Kunming, China). The patient samples were collected between 1 and
30 March, 2022. All subjects provided written informed consent
before participating in the study. The present study was approved
by the Ethics Committee of The First People's Hospital of Yunnan
Province (approval no. 2022GJ227).
First, RNA was extracted using TRlzol®
(Invitrogen; Thermo Fisher Scientific, Inc.). RT was performed with
SweScript First-Strand cDNA Synthesis Kit (Servicebio, Wuhan,
China) according to the manufacturer's protocols. qPCR) was
performed strictly according to the manufacturer's instructions for
2xUniversal Blue SYBR Green qPCR Master Mix (Servicebio, Wuhan,
China). qPCR reaction mixture comprised 3 µl of cDNA, 5 µl of
2xUniversal Blue SYBR Green qPCR Master Mix (Servicebio, Wuhan,
China) and 1 µl of forward and reverse primer (Tsingke, China) also
at a concentration of 10 µM. qPCR was performed using the CFX96
Real-Time PCR Detection System (Bio-Rad, China) according to the
following steps: pre-denaturation at 95˚C for 1 min, followed by 40
cycles of denaturation at 95˚C for 20 sec, annealing at 55˚C for 20
sec, and extension at 72˚C for 30 sec. GAPDH was used as the
internal reference gene, and the relative expression levels of key
genes were calculated using the 2-ΔΔCq method (43). All systematic analyses were
performed in triplicate. qPCR primer sequences are shown in
Table I.
 | Table IReverse transcription-quantitative
PCR primer sequences. |
Table I
Reverse transcription-quantitative
PCR primer sequences.
| Primer | Sequence,
5'-3') |
|---|
| SAMD8 | F:
CCTTTCATCAGTGCTCTTCAGA |
| | R:
AATCATGCCACATACTTCCGTC |
| CYP51A1 | F:
TAAGGCAATCCAGAAACGCA |
| | R:
CCAAAAAGAAGCCCATCCAA |
| β-actin | F:
GGAAGGTGAAGGTCGGAGT |
| | R:
TGAGGTCAATGAAGGGGTC |
Statistical analysis
All analyses were carried out in R language (version
4.0.2). Differences between groups were analyzed by Wilcoxon
rank-sum test. P<0.05. The Independent-samples t-test was
employed. Assuming normal distribution and equal variances, the
mean and SEM) were calculated for each group. All systematic
analyses were performed in triplicate.
Results
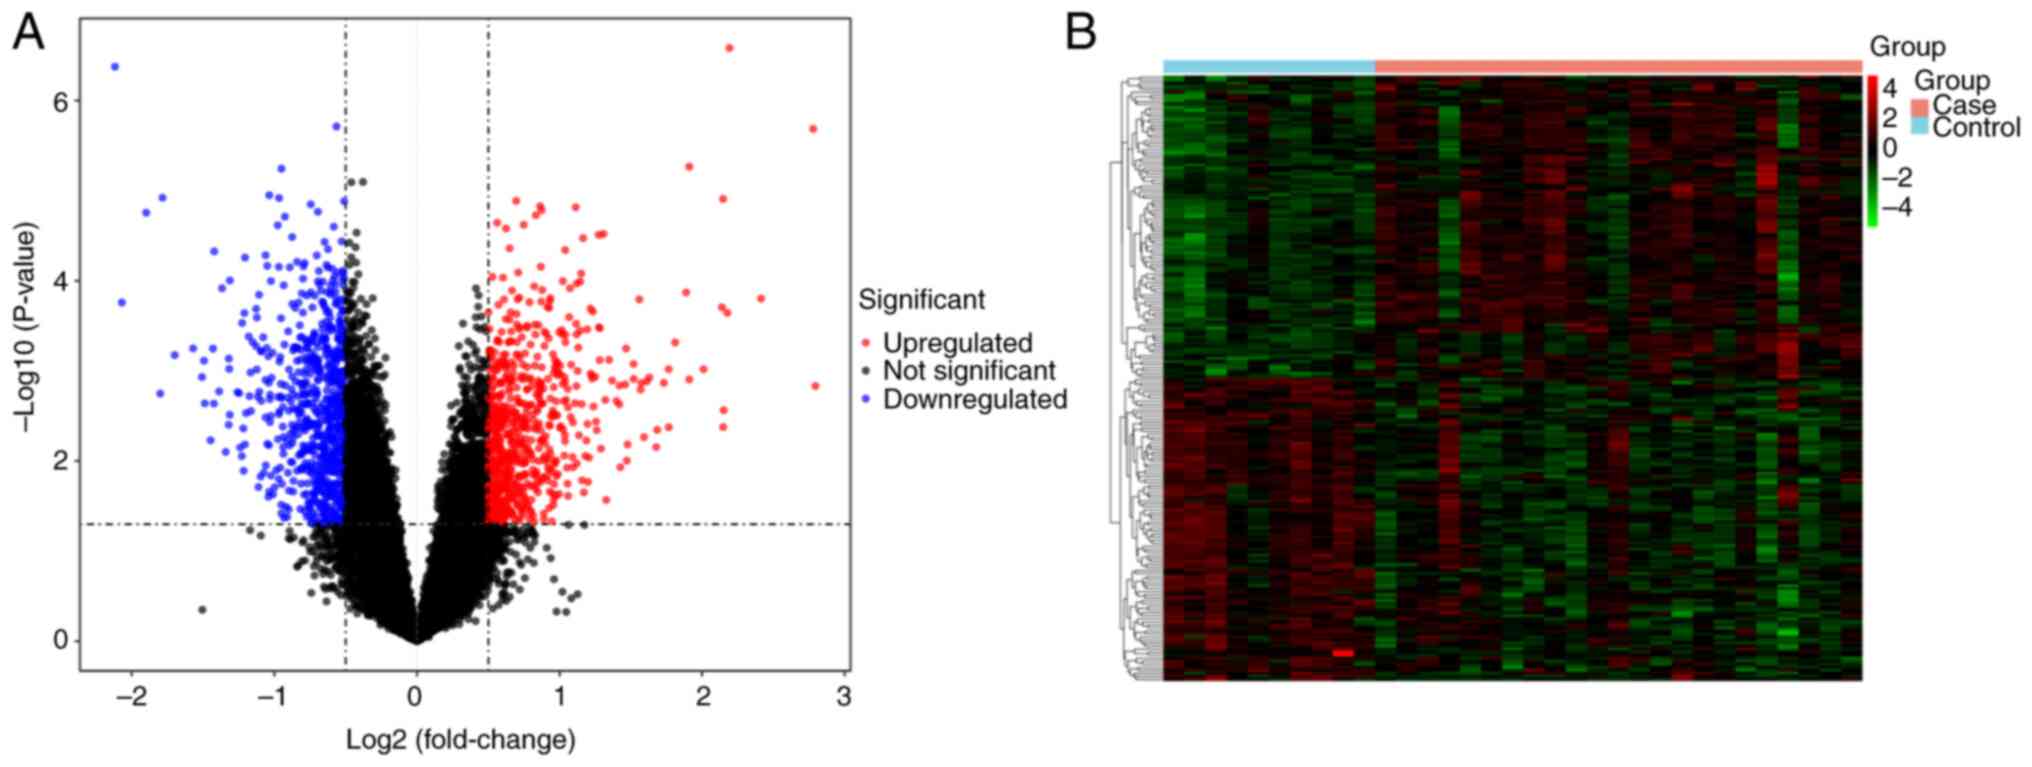
Identification of DEGs
The present study identified 1,445 DEGs between the
DN and healthy samples in the GSE142153 dataset. Among the DEGs
present in DN samples, 707 genes were upregulated and 738 were
downregulated. A volcano plot and a heatmap of these genes are in
Fig. 1.
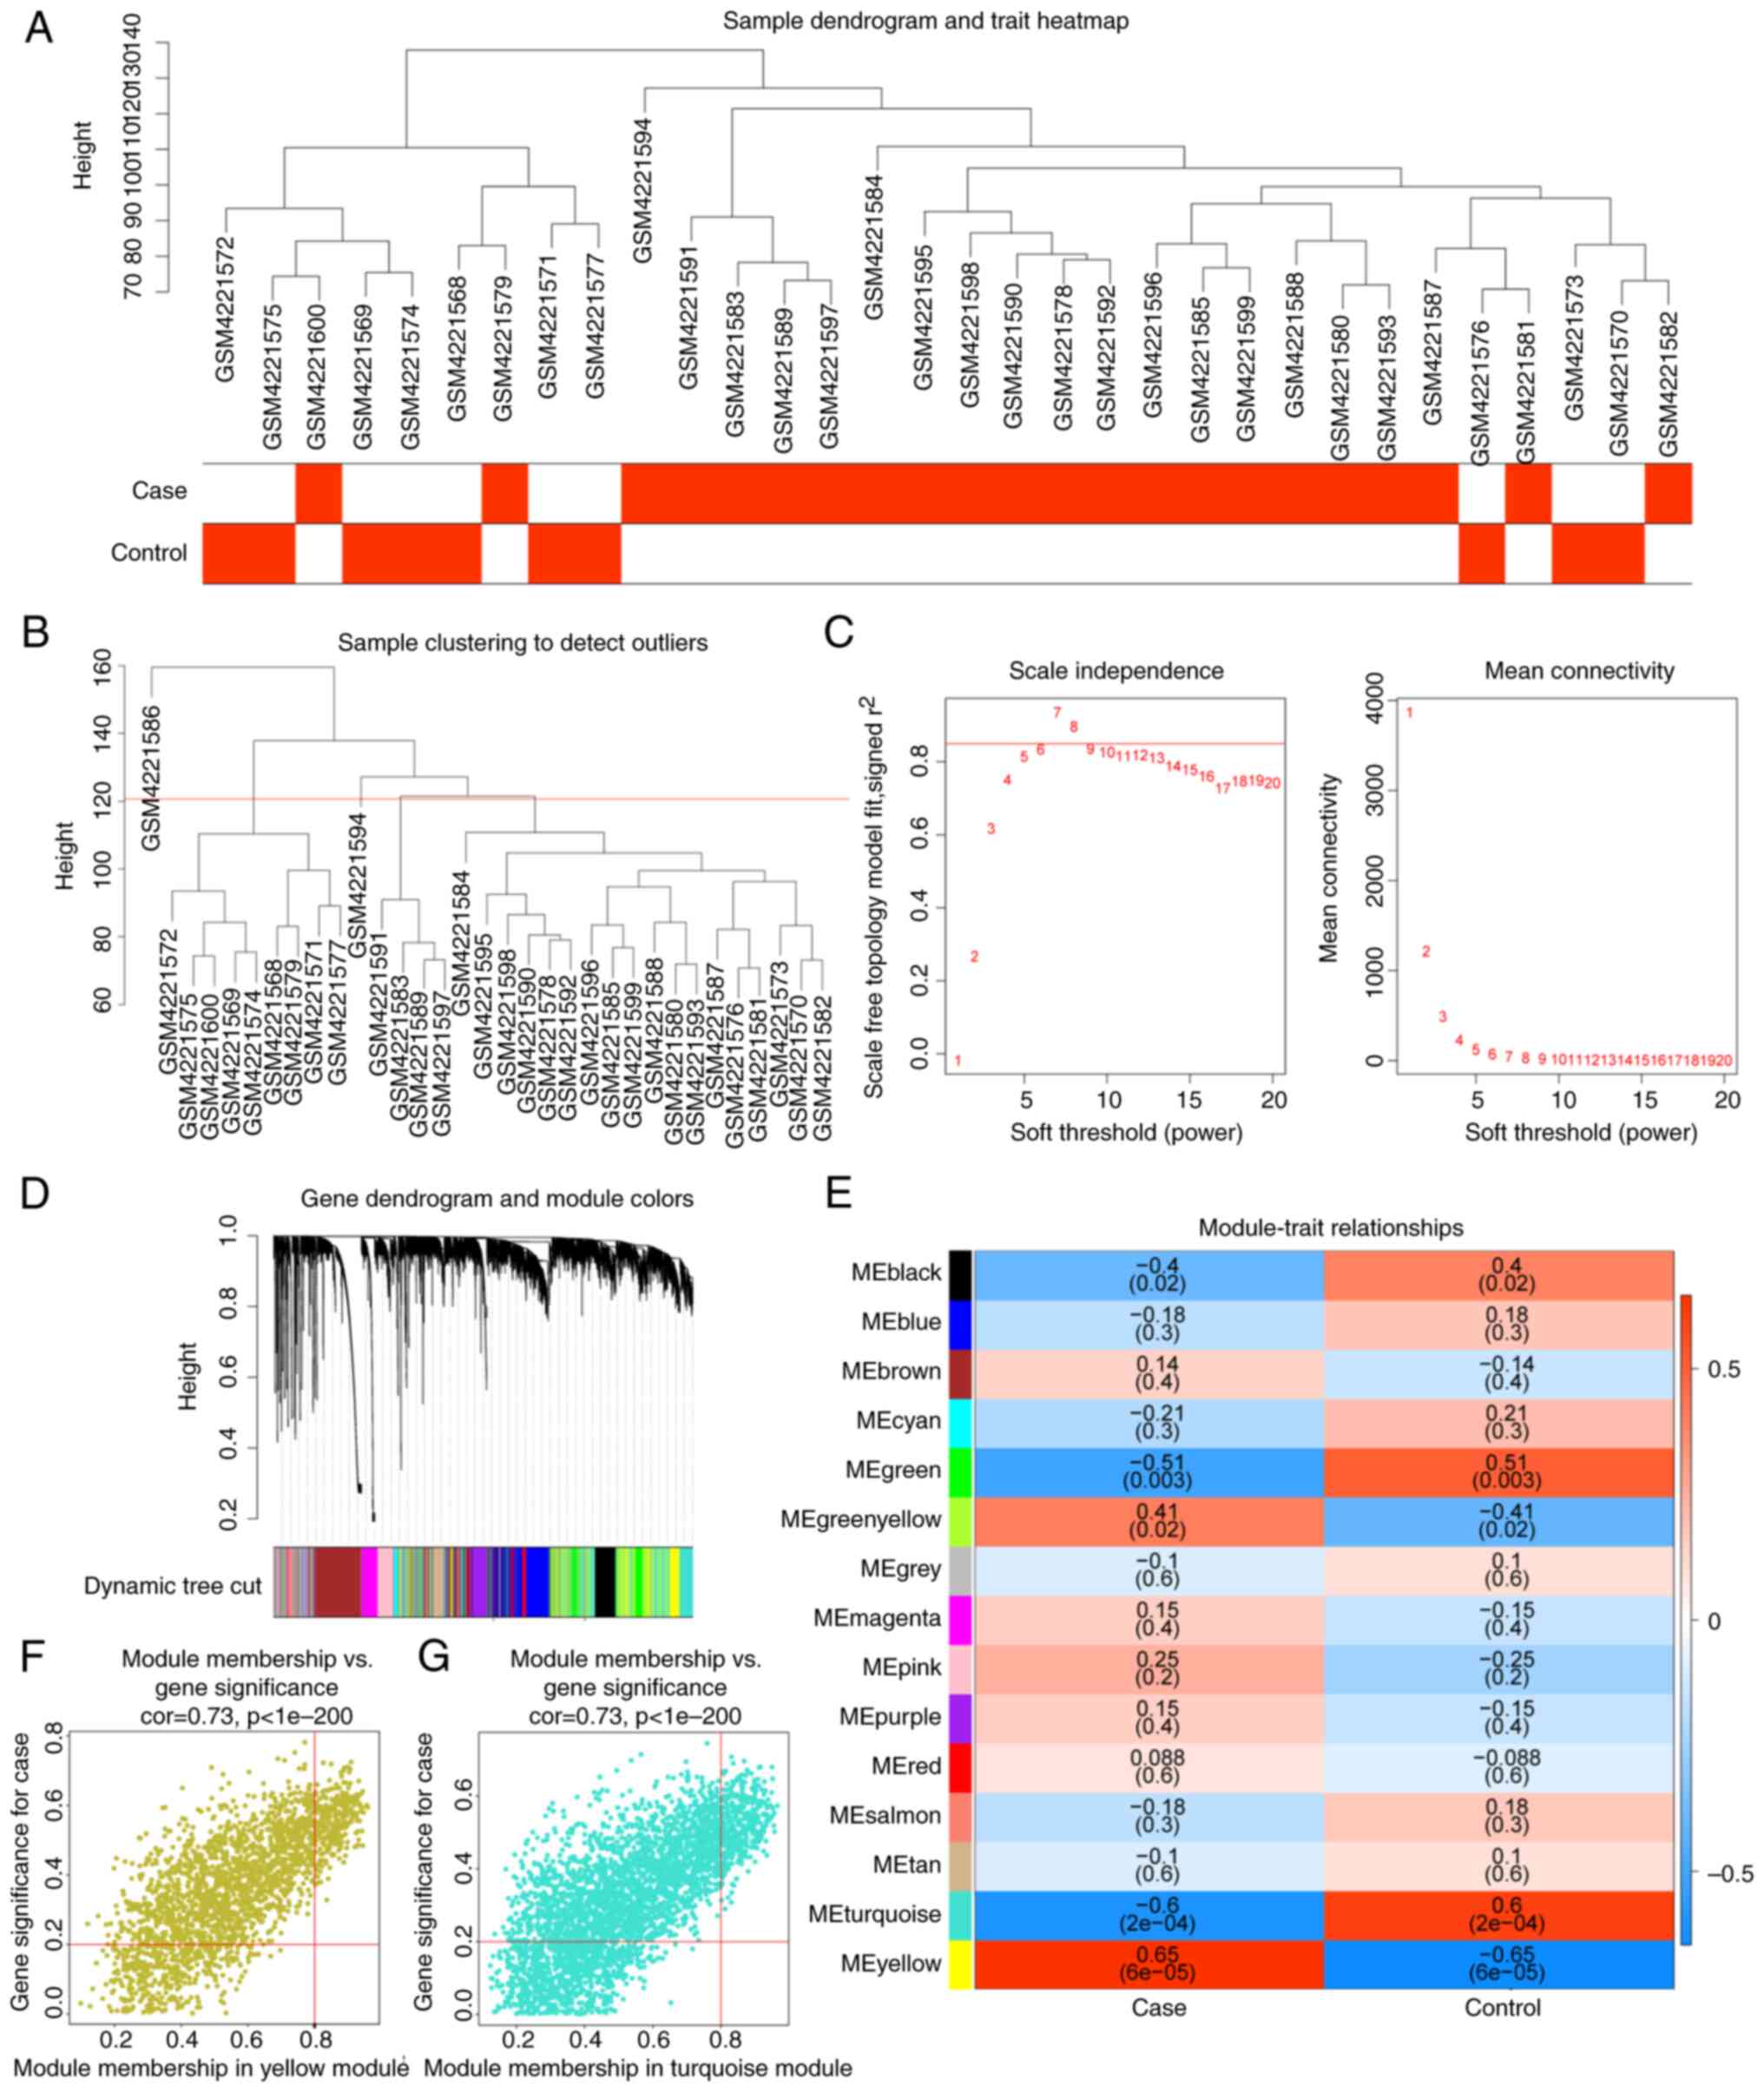
Screening of genes in key modules by
WGCNA
A sample clustering tree after excluding the
outliers (GSM4221586) was plotted (Fig. 2A and B). The network accorded with the
scale-free distribution to the maximum extent possible when the
soft threshold was 7 (Fig. 2C).
After determining the soft threshold, the gene dendrogram was
constructed and 15 co-expression modules were found by setting the
minimum module size at 150 (Fig.
2D). The correlations among the modules and DN and healthy
samples showed that MEyellow was positively correlated with DN,
whereas MEturquoise had a negative correlation with DN (Fig. 2E). Finally, 694 DN-related genes in
MEyellow and MEturquoise with |MM| >0.8 and |GS| >0.2 were
identified (Fig. 2F and G).
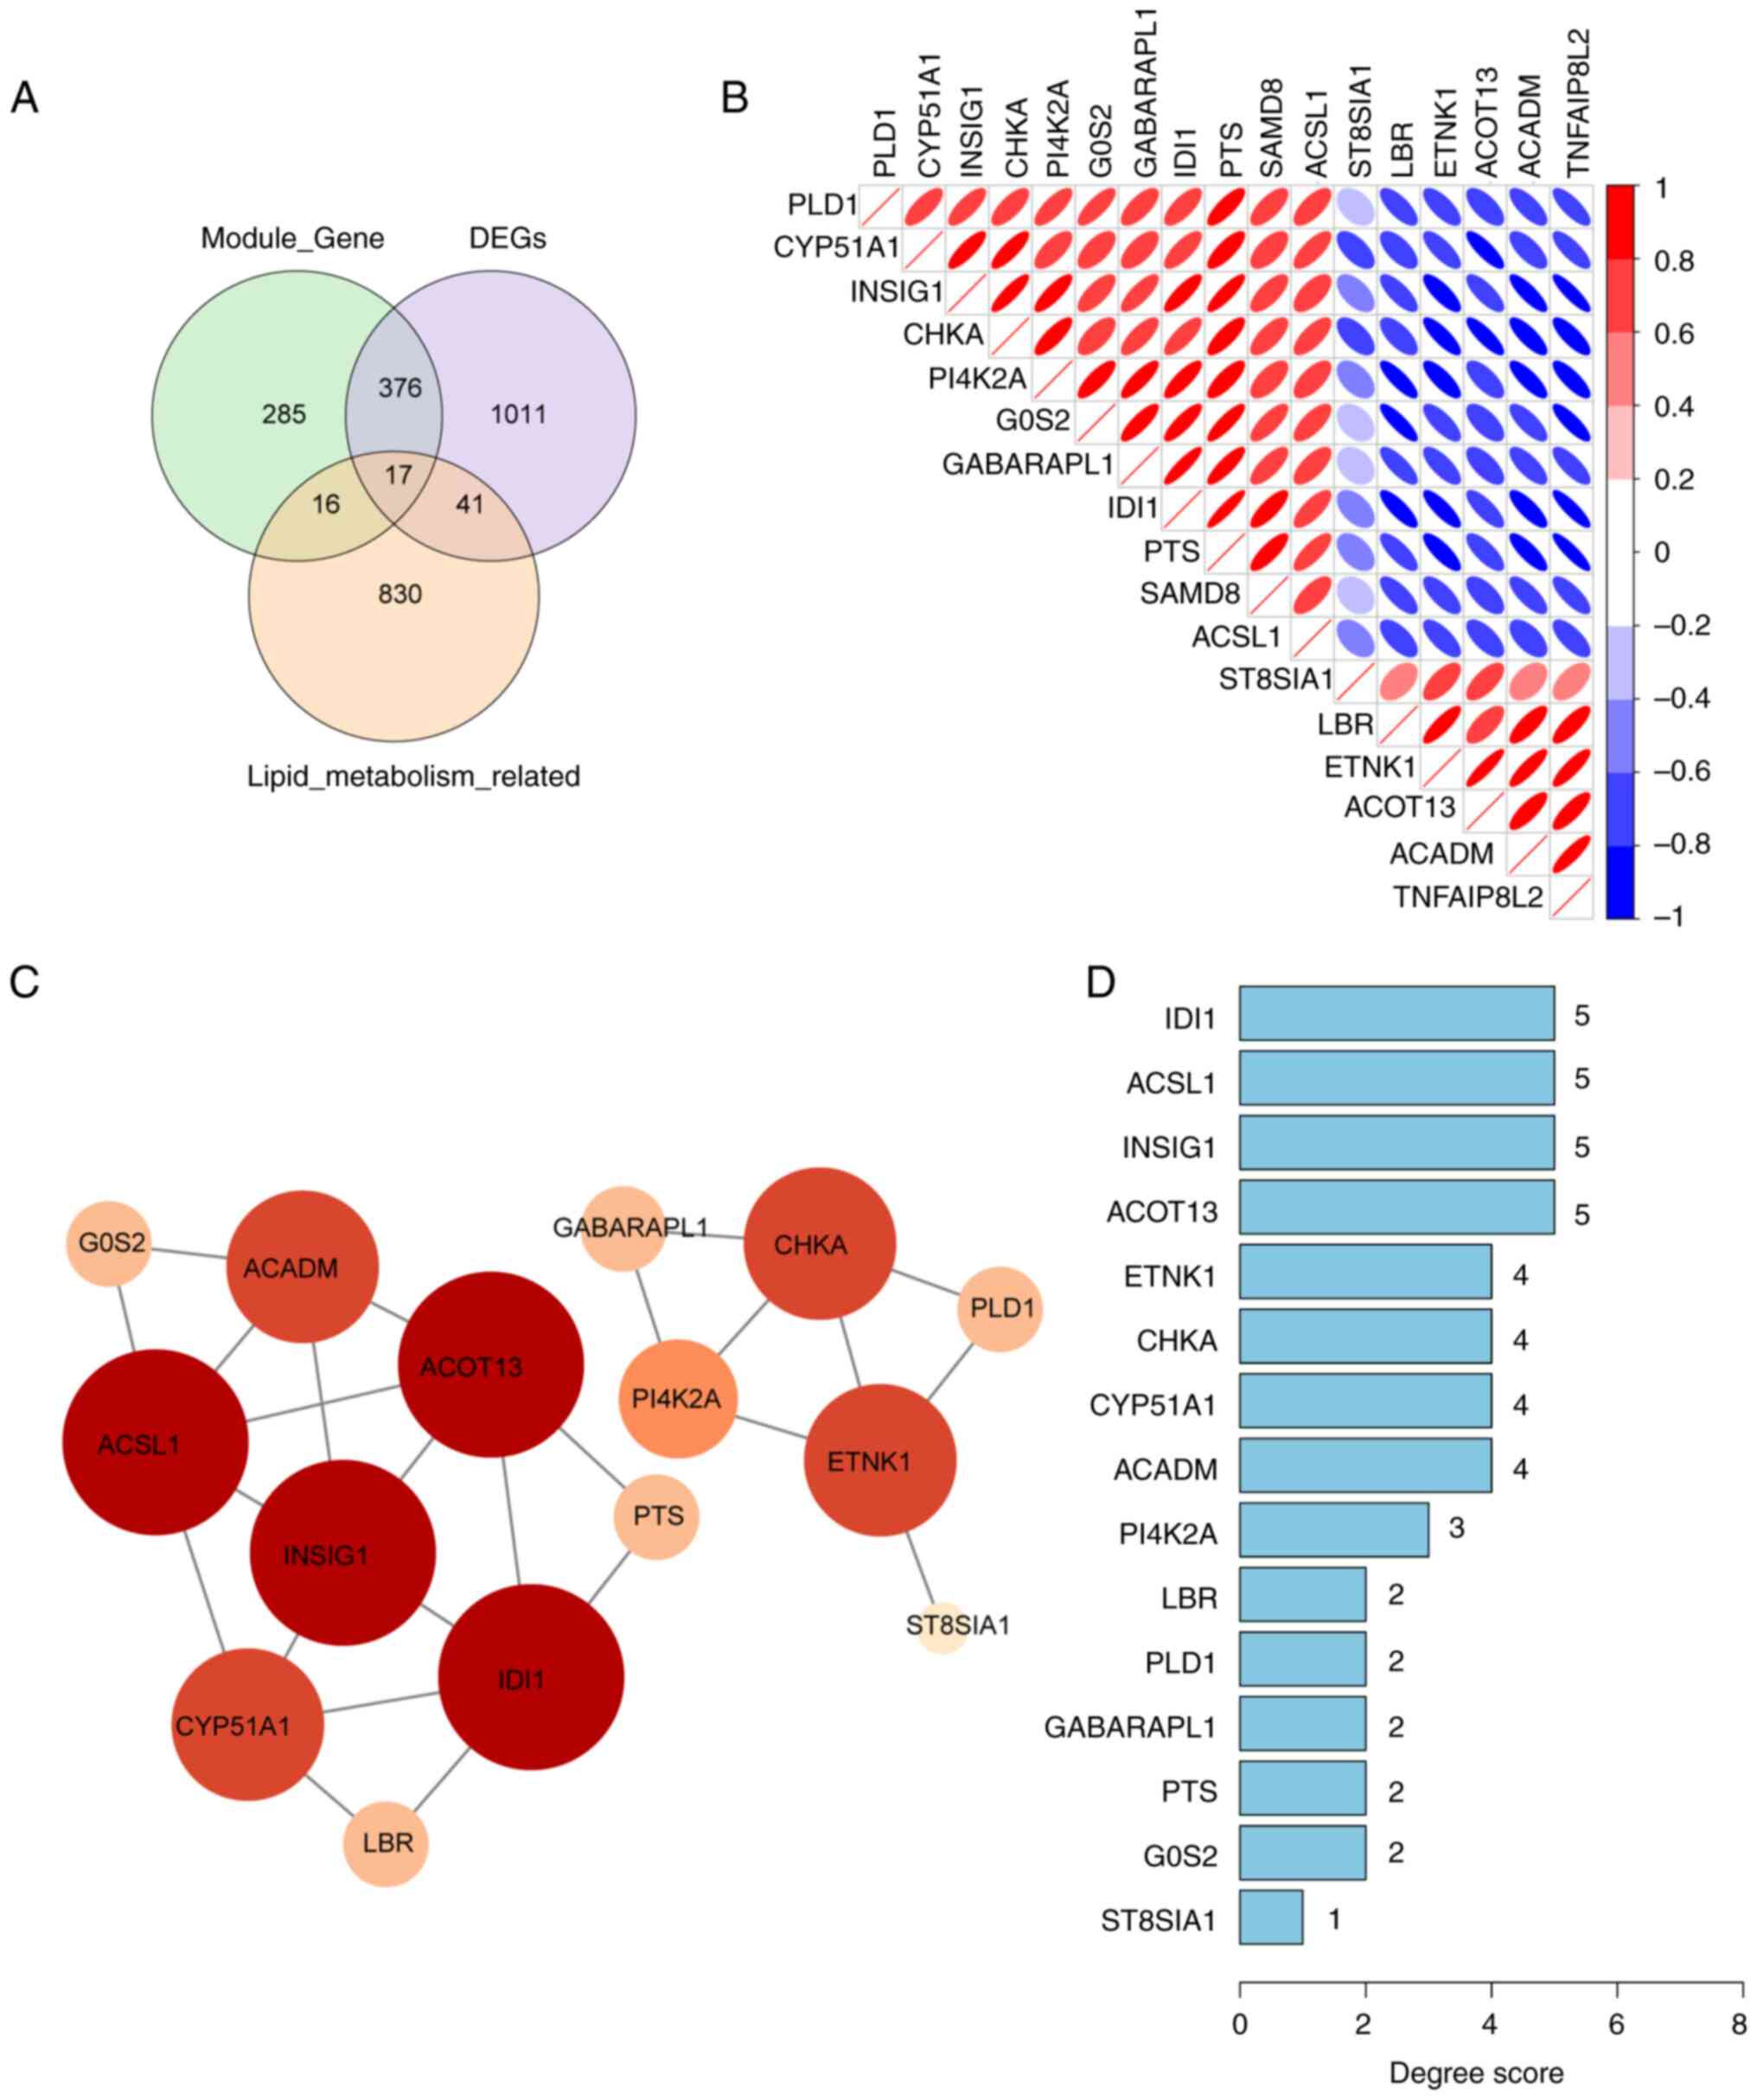
Identification and PPI of the lipid
metabolism-related genes in DN
A Venn diagram was used to identify 17 genes
associated with lipid metabolism in DN through the intersections of
1,445 DEGs, 694 DN-related genes in the MEyellow and MEturquoise
modules, and 904 lipid metabolism-related genes (Fig. 3A). The correlation analysis among
these 17 genes demonstrated a strong correlation between IDI1 and
PTS (Fig. 3B). The aforementioned
17 lipid metabolism-related genes were then uploaded into the
STRING database. However, the SAMD8 and TNFAIP8L2 genes were
excluded from the STRING database as they did not show any
interaction. Next, a PPI network of 15 genes with a confidence of
0.15 was constructed. The degree scores of these 15 genes are shown
in a bar chart (Fig. 3C and
D).
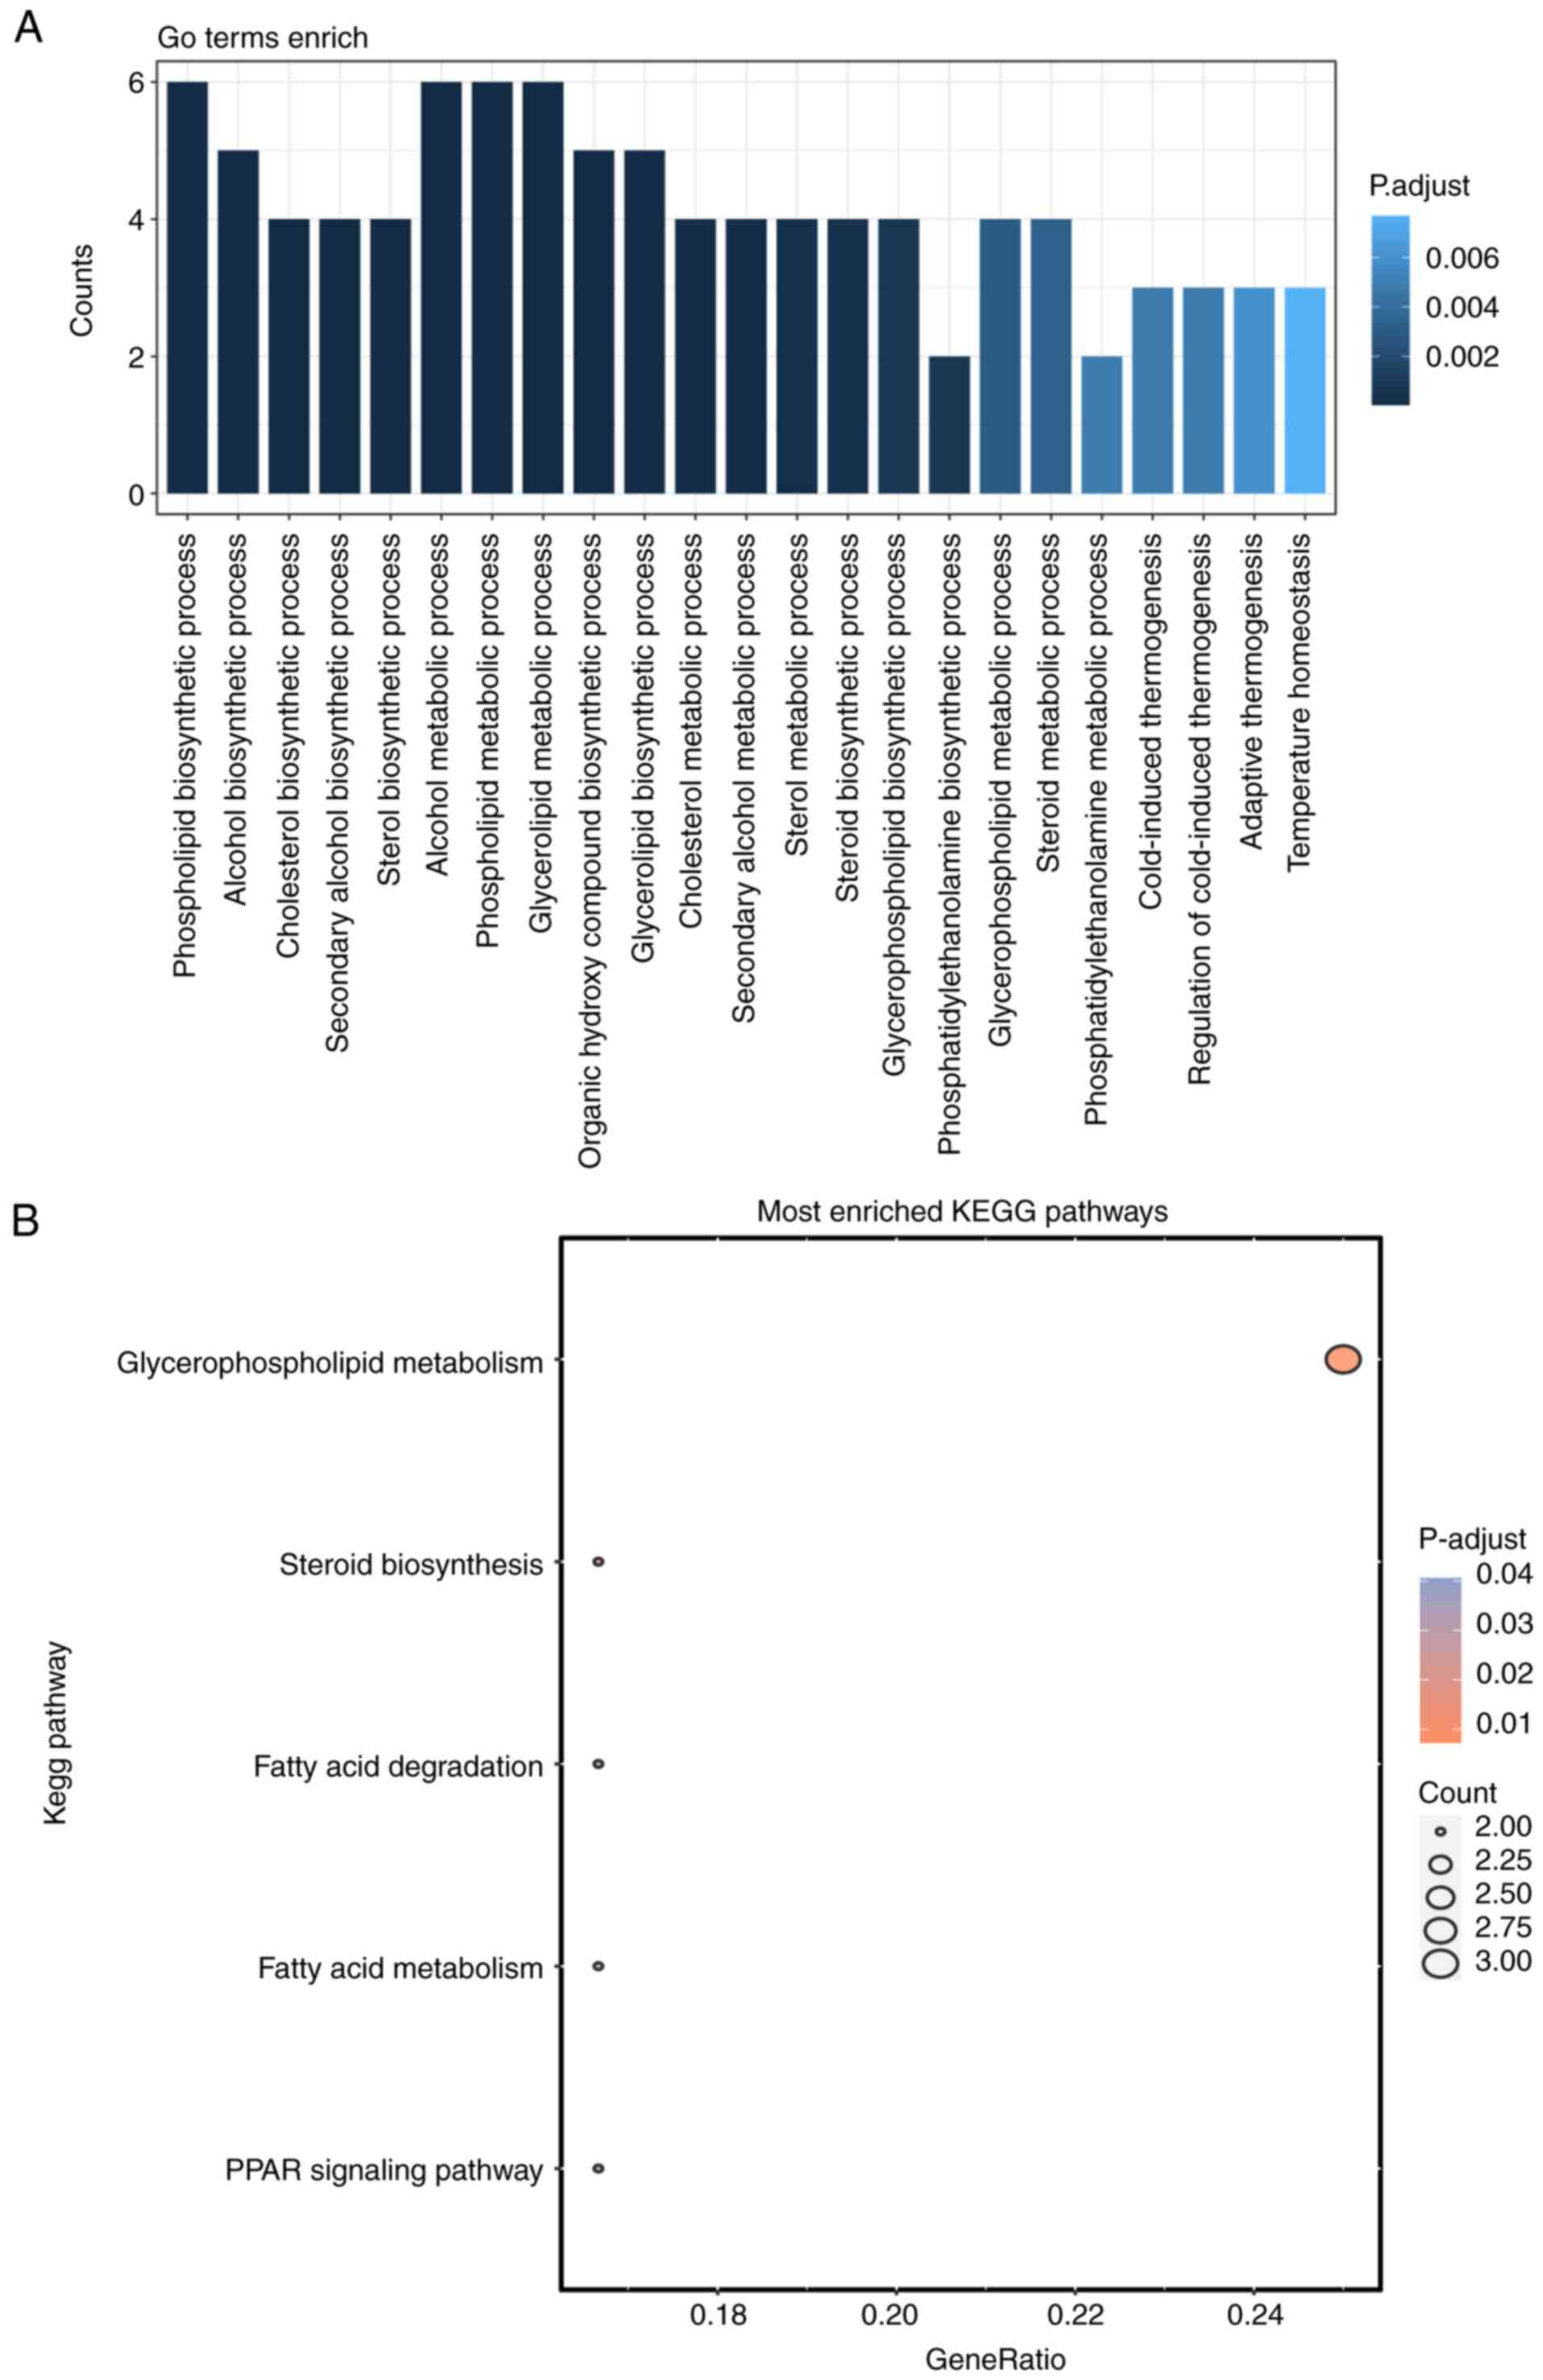
Functional enrichment analyses
GO and KEGG functional enrichment analyses were
conducted to investigate the potential functions of the 17 lipid
metabolism-related genes implicated in DN. Notably, 5 KEGG pathways
and 23 GO entries belonging to the biological process (BP) category
were identified (P.adjust <0.05 and count >2). The BP results
showed that these 17 lipid metabolism-related genes were closely
associated with the ‘phospholipid biosynthetic process’, ‘alcohol
biosynthetic process’ and ‘cholesterol biosynthetic process’
(Fig. 4A). The KEGG analysis
demonstrated that the markedly enriched pathways associated with
these genes included ‘glycerophospholipid metabolism’, ‘steroid
biosynthesis’ and ‘fatty acid degradation’ (Fig. 4B).
Identification and GSEA of hub
genes
To identify hub genes among the aforementioned 17
lipid metabolism-related genes, LASSO and SVM-RFE algorithm models
were established based on the data obtained from 23 DN samples and
10 healthy samples. LASSO algorithm identified four genes as
feature genes (Fig. 5A and
B). Three genes were identified as
feature genes by the SVM-RFE algorithm (Fig. 5C), which are the first three genes
in Table SII. The intersections
of these two algorithm models revealed two overlapping genes, SAMD8
and CYP51A1 (Fig. 5D). The top 10
most important GO and KEGG terms of the GSEA results of SAMD8 and
CYP51A1 were screened. ‘mitochondrial matrix’ and ‘GTPase activity’
were identified as the common markedly enriched GO term in both
SAMD8 and CYP51A1 (Fig. 5E and
G). The following common markedly
enriched KEGG pathways for SAMD8 and CYP51A1 were identified:
‘Alzheimer disease’, ‘IL-17 signaling pathway’, ‘pathways of
neurodegeneration-multiple diseases’ and ‘TGF-beta signaling
pathway’ (Fig. 5F and H).
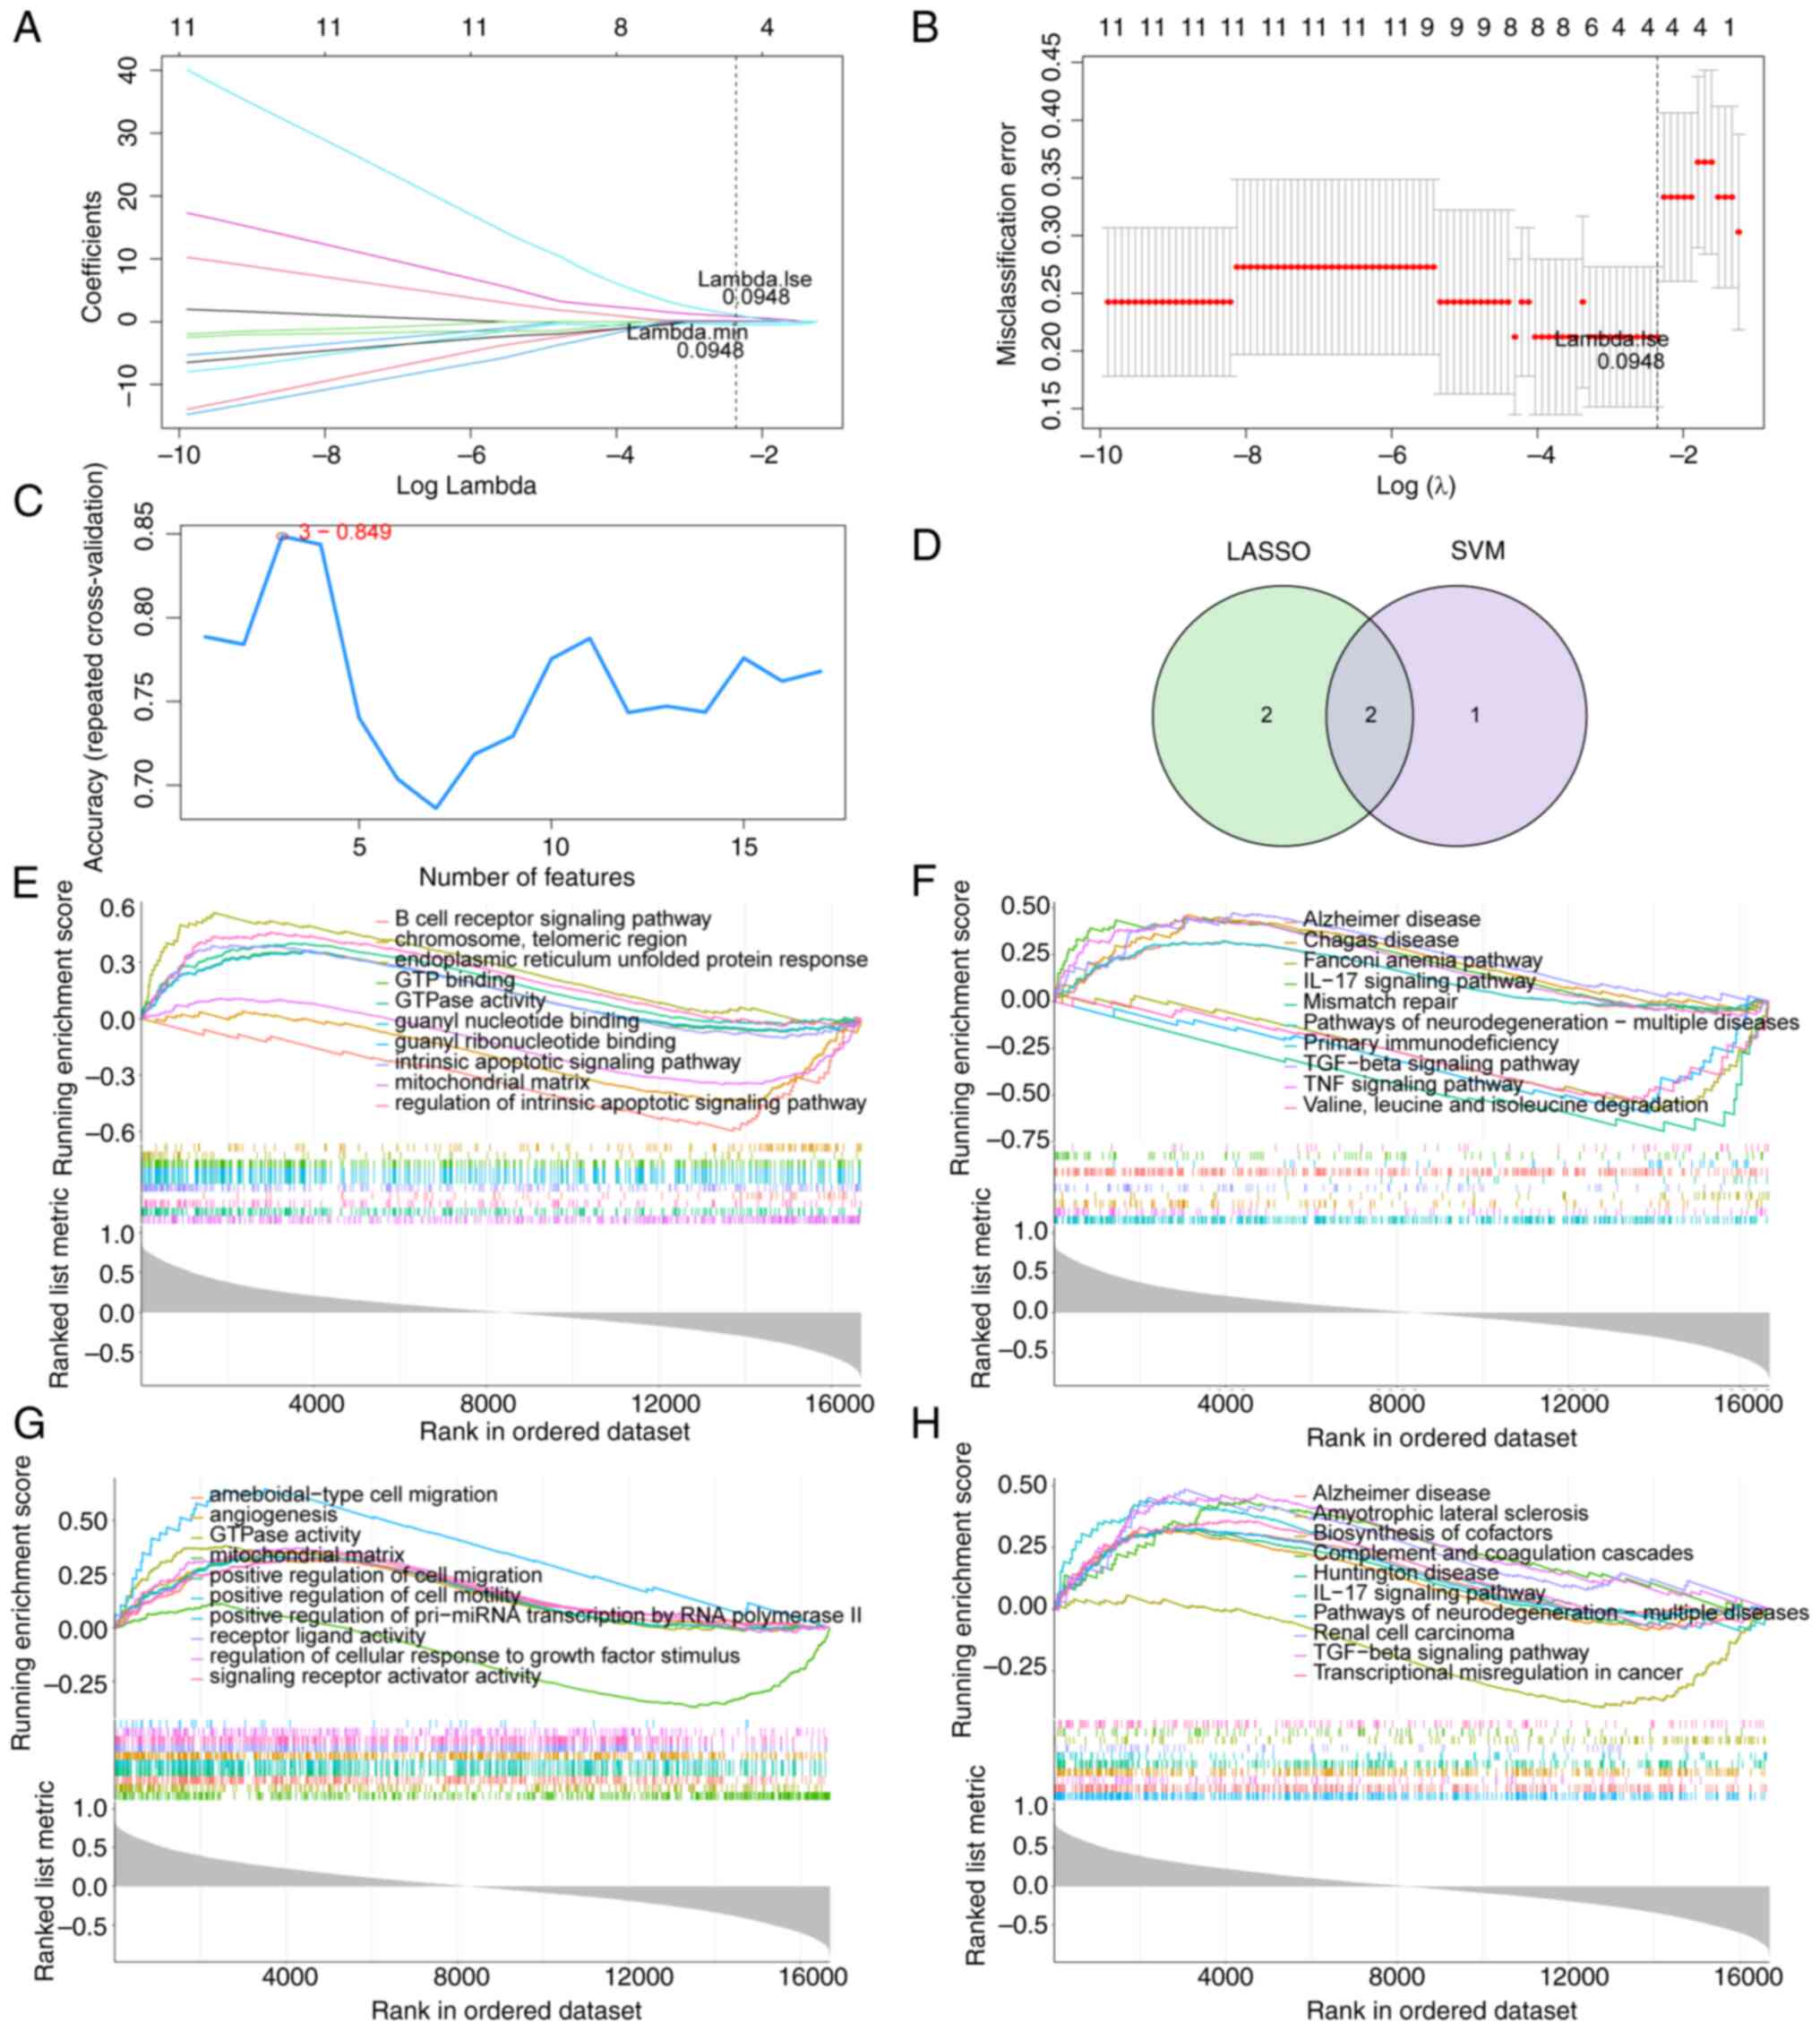 | Figure 5Identification of hub genes. (A)
LASSO logistic coefficient penalty plot. Each curve represents the
change of the coefficient of each independent variable. (B)
Misclassification error plot. The x-axis is log λ and the y-axis is
the cross-validation error. The lowest error rate was achieved when
λ.min=0.0948, four genes were identified as signature genes. (C)
SVM-RFE algorithm, obtaining three signature genes. The y-axis
shows the accuracy under different features. After selecting the
first three features, the model achieved the highest accuracy. (D)
Venn diagram of two overlapping genes (SAMD8 and CYP51A1) obtained
through the intersections of LASSO and SVM models. (E) GSEA, the
top 10 most important GO terms in SAMD8. (F) GSEA, the top 10 most
important KEGG pathways of SAMD8. (G) GSEA, the top 10 most
important GO terms in CYP51A1. (H) GSEA, the top 10 most important
KEGG pathways of CYP51A1. LASSO, Least Absolute Shrinkage and
Selector Operation; SVM, support vector machines; RFE, recursive
feature elimination; GSEA, Gene Set Enrichment Analysis; GO, gene
ontology; KEGG, Kyoto Encyclopedia of Genes and Genomes. |
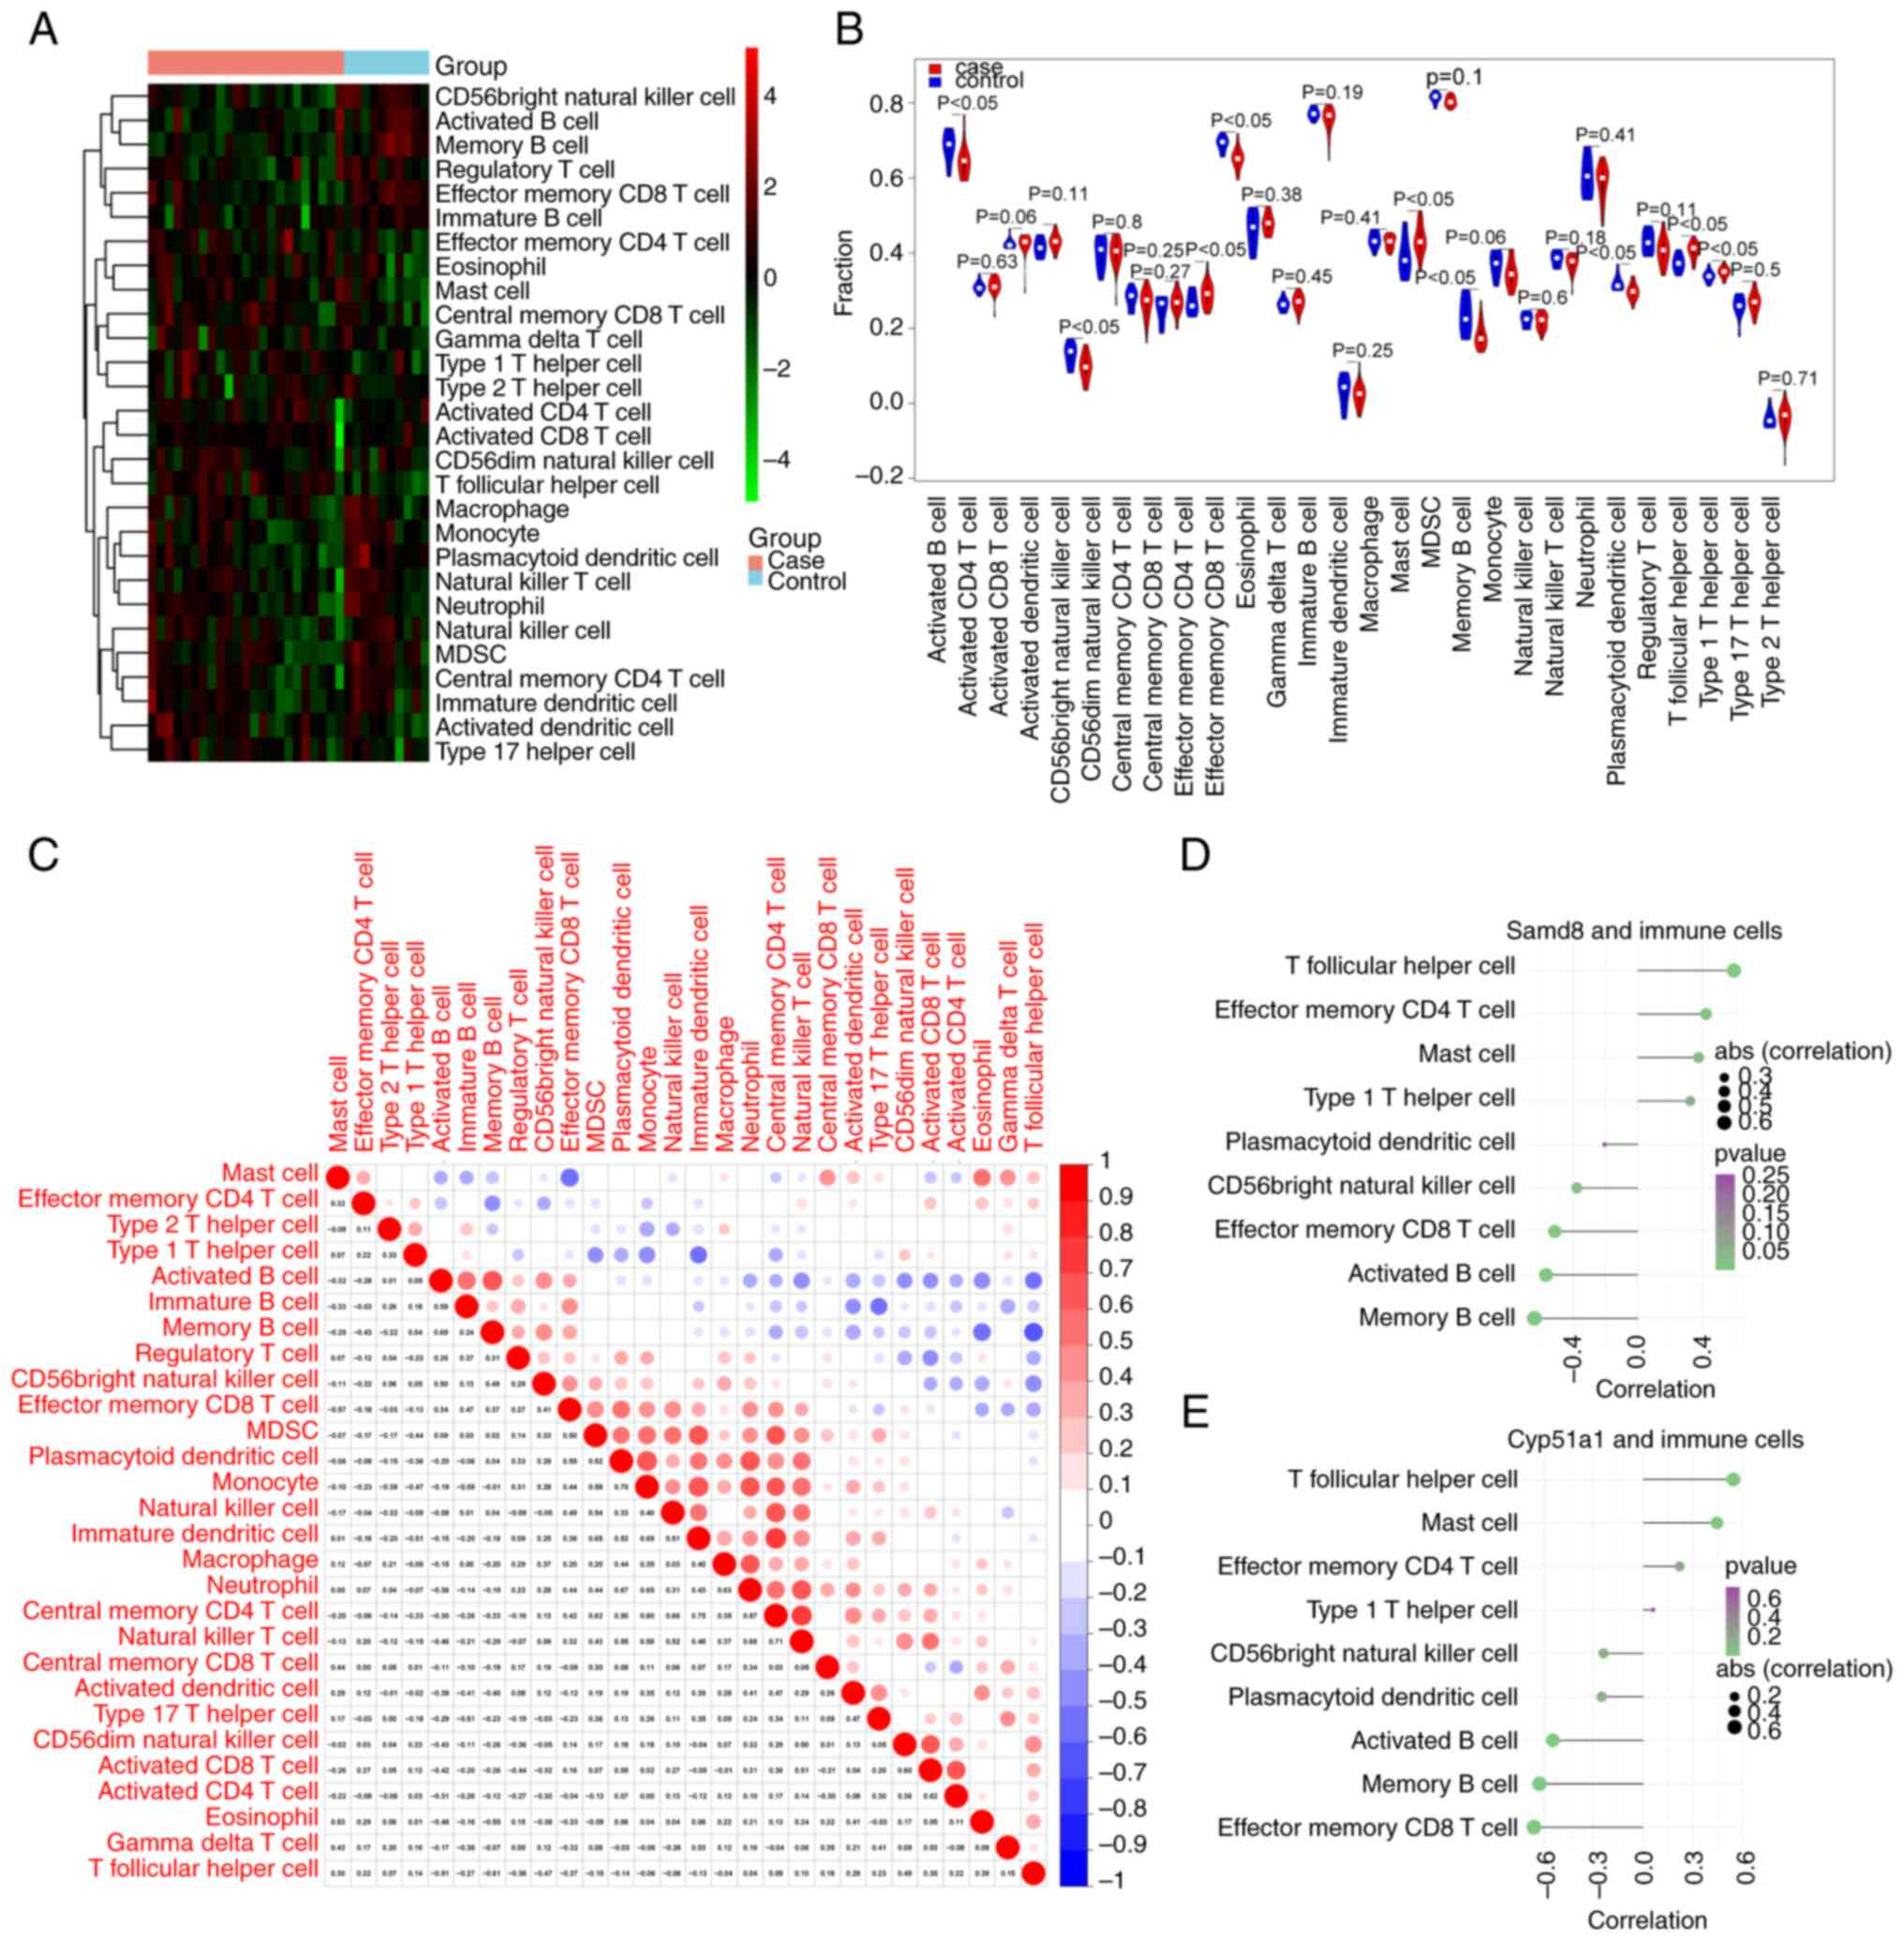
Immune infiltration analysis
The ssGSEA was employed to evaluate the infiltration
levels of 28 immune cell types in both DN and healthy samples. A
heatmap displaying the ssGSEA scores is shown in Fig. 6A. A total of nine immune cell types
were significantly different between DN and healthy samples:
Activated B cells, CD56bright natural killer cells, effector memory
CD4 T cells, effector memory CD8 T cells, mast cells, memory B
cells, plasmacytoid dendritic cells, T follicular helper cells and
type 1 T helper cells. These cell types exhibited significant
differences between the DN and healthy samples, as visualized using
a violin chart (Fig. 6B).
Furthermore, the Pearson correlation coefficients of the immune
cell types showed that monocytes exhibited a markedly positive
correlation with plasmacytoid and immature dendritic cells
(Fig. 6C). Finally, the Pearson
correlation coefficients between immune cells and hub genes (SAMD8
and CYP51A1) were calculated. SAMD8 and CYP51A1 were both
correlated with the activated B cells, effector memory CD8 T cells,
memory B cells and T follicular helper cells (|cor| >0.4;
Fig. 6D and E).
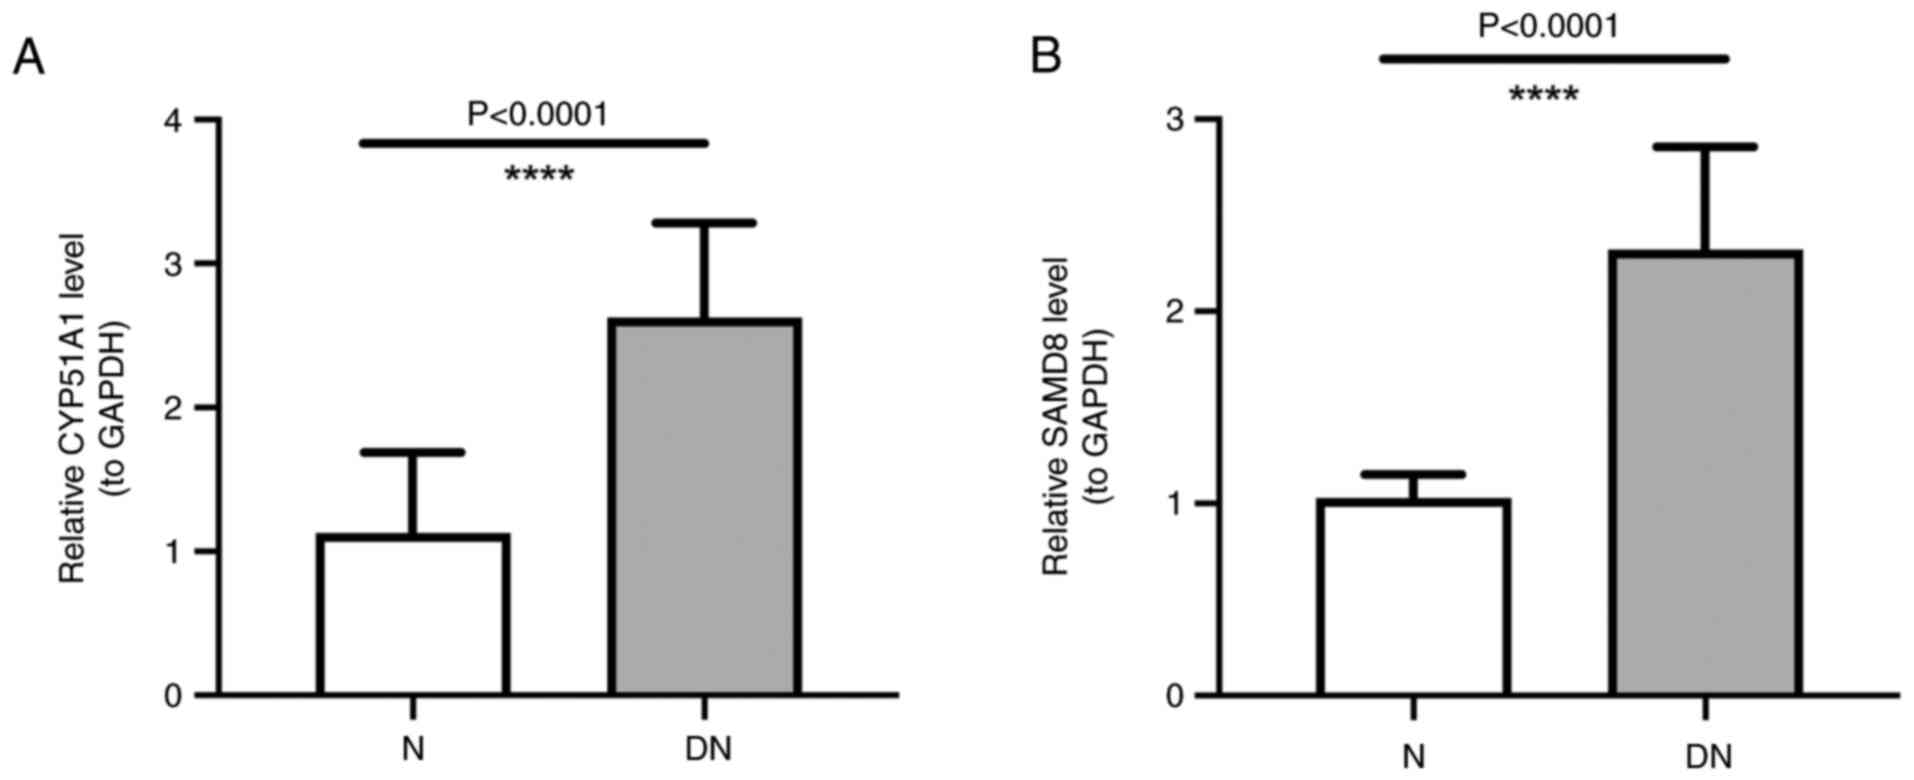
Expression of SAMD8 and CYP51A1
The RT-qPCR analysis showed a higher expression of
SAMD8 and CYP51A1 in DN samples than in those from normal subjects,
which was consistent with the aforementioned results of the present
study (Fig. 7A and B).
Discussion
Lipid metabolism plays an important role in the
progression of DN, but the specific mechanism of action between the
two remains to be elucidated. The present study identified two hub
genes, SAMD8 and CYP51A1, using LASSO and SVM-RFE algorithms.
SAMD8, which encodes sphingomyelin synthase-related protein (SMSr),
is located in the cytosol and endoplasmic reticulum, and acts as a
component of the endoplasmic reticulum membrane (44). SAMD8 can participate in the
regulation of ceramide biosynthesis by activating ceramide choline
phosphotransferase and sphingomyelin synthase activities. Tafesse
et al (45) reported that
SAMD8 acts as a suppressor of ceramide-mediated apoptosis. Notably,
disruption of the catalytic activity of SMSr can increase the
endoplasmic reticulum ceramide levels and mislocalize them to the
mitochondria, triggering the mitochondrial apoptosis pathway
(45). The association between
ceramide and DN has been reported (46). Notably, ceramides are abundant in
the kidney, and they regulate diverse cellular events, including
differentiation, growth arrest and apoptosis (47-49).
Studies on humans and animal models have demonstrated that the
accumulation of lipids and their metabolites in tissues, including
those of the kidney, can cause lipid toxicity (50,51).
Reducing the accumulation of ceramide may improve insulin
resistance, steatohepatitis and other metabolic disorders (52). Therefore, it was hypothesized that
SAMD8 could be implicated in DN by affecting the synthesis of
ceramide.
CYP51A1, a member of the cytochrome P450 superfamily
of enzymes, catalyzes the removal of the 14-methyl group in
lanosterol, a key step in the synthesis of cholesterol (53,54).
Patients with DN are characterized by an increased plasma
concentration of cholesterol (15), reduced expression of lipoprotein
lipase, disruption of reverse cholesterol transport and reduced
number of receptors mediating lipid uptake (8). Therefore, CYP51A1 could be involved
in the development of DN by regulating cholesterol synthesis.
However, to the best of our knowledge, the role of SAMD8 and
CYP51A1 in DN has not been reported, and the present study was the
first to discover the role of two key genes in DN, which may
provide a new target for the treatment of DN.
The KEGG analysis of the 17 lipid metabolism-related
genes identified the following representative pathways:
‘Glycerophospholipid metabolism’, ‘steroid biosynthesis’ and ‘fatty
acid degradation’. Notably, all the terms (‘phospholipid
biosynthetic process’, ‘alcohol biosynthetic process’, and
‘cholesterol biosynthetic process’) identified through GO analysis
are from the BP category. Studies have shown that abdominal
subcutaneous fat deposition and elevated non-esterified fatty acids
(NEFA) in plasma, which are characteristics of patients with type 2
diabetes, contribute to the development and progression of
lipotoxicity (55,56). Dyslipidemia and insulin resistance
can disturb the function of adipose tissue, causing an increase in
the plasma concentrations of NEFA, and an imbalance between pro-
and anti-inflammatory adipokines (57). This process activates intracellular
lipid metabolism-related pathways, thereby promoting the deposition
of fatty acids in non-adipose tissues (58). The resulting micro-inflammatory
state and production of reactive oxygen species can induce lipids
to undergo oxidative stress modification. The modified lipids
participate in intercellular signal transduction and exacerbate
inflammation, oxidative stress and lipid peroxidation (14). This cascade of events can cause
cells to employ adaptive protective mechanisms of mitophagy,
autophagy and apoptosis, thereby damaging the cells (18,59).
In contrast to healthy subjects, various immune cell
types (activated B cells, CD56bright natural killer cells, effector
memory CD4 T cells, effector memory CD8 T, mast cells, memory B
cells, plasmacytoid dendritic cells, T follicular helper cells and
type 1 T helper cells) exhibited different levels in patients with
DN, as shown by the immune infiltration analysis. Previous studies
have demonstrated that patients with DN often present with renal
inflammation, which is closely associated with the onset and
progression of DN (60-63).
Wilson et al (64) reported
immune cell infiltration and abnormal angiogenesis as early
indicators of DN. Elevated monocyte counts and monocyte:HDL ratio
can be detected in patients with DN, suggesting that monocytes play
a key role in the inflammatory response to DN (65-67).
According to the conventional pathological mechanisms of DN, in
addition to altered hemodynamics, factors such as advanced
glycation end products (AGE), oxidized lipids, free radicals and
fatty acids produced from numerous biological mechanisms of
glucotoxicity and lipotoxicity can cause inflammatory responses
(68,69). The presence of AGE receptors in
macrophages, endothelial cells and mesenchymal cells allows
monocyte activation and the subsequent release of inflammatory
cytokines (IL-1, IL-6, IL-18, CRP and TNF-α) (66). Monocyte activation can lead to
chronic inflammation and atherosclerosis in the kidney (70). Long term, these alterations can
change renal hemodynamics, glomerular filtration rate and blood
pressure (71). Notably, the key
genes identified in the present study, SAMD8 and CYP51A1, were
correlated with various immune cell types, such as activated B
cells, effector memory CD8 T cells, memory B cells and T follicular
helper cells. Hence, it may be suggested that these two genes could
influence the development of DN not only through lipid metabolism
but also by mediating the related immune processes.
There were certain limitations in the present study.
Firstly, despite attempts to select a dataset with the largest
possible sample size for analysis, the small sample size remained a
drawback. Subsequently, the expression of SAMD8 and CYP51A1 was
validated using RT-qPCR; however, protein-level validation was not
performed and further investigation into the underlying mechanism
was also lacking. However, the present study has some significance.
It identified the key genes related to lipid metabolism in DN for
the first time, and explored the signaling pathways enriched by
these key genes and their relationship with the immune environment
through enrichment analysis and immune infiltration analysis. The
present study offers valuable insights for elucidating the
relationship between DN and lipid metabolism, and for providing a
new reference point for clinical treatment and diagnosis of DN.
Next, the mechanism of key genes in DN will be further verified
through animal modeling.
In conclusion, the present study demonstrated that
SAMD8 and CYP51A1 were key hub genes responsible for lipid
metabolism in DN. They were markedly upregulated in DN and closely
related to the immune response in DN.
Supplementary Material
GSE142153 clinical dataset
Model feature gene ranking table.
Acknowledgements
Not applicable.
Funding
Funding: The present study was supported by the Kunming Medical
University Basic Research Joint Project (grant no.
202301AY070001-295).
Availability of data and materials
The data analyzed in the present study may be found
in the GEO database under accession number GSE142153 or at the
following URL: https://www.ncbi.nlm.nih.gov/geo/query/acc.cgi. The
other data generated in the present study may be requested from the
corresponding author.
Authors' contributions
MY wrote the manuscript and made substantial
contributions to conception and design. JW and HM were responsible
for data analysis and processing. JX and YX interpreted data. WK
collected clinical samples and performed qPCR experiments. MY and
JW confirm the authenticity of all the raw data. All authors read
and approved the final version of the manuscript.
Ethics approval and consent to
participate
The present study was approved by the Ethics
Committee of The First People's Hospital of Yunnan Province
(approval no. 2022GJ227). Written informed consent was obtained
from all participants.
Patient consent for publication
Not applicable.
Competing interests
The authors declare that they have no competing
interests.
References
|
1
|
Thipsawat S: Early detection of diabetic
nephropathy in patient with type 2 diabetes mellitus: A review of
the literature. Diab Vasc Dis Res.
18(14791641211058856)2021.PubMed/NCBI View Article : Google Scholar
|
|
2
|
Saran R, Robinson B, Abbott KC,
Bragg-Gresham J, Chen X, Gipson D, Gu H, Hirth RA, Hutton D, Jin Y,
et al: US renal data system 2019 annual data report: Epidemiology
of kidney disease in the United States. Am J Kidney Dis. 75 (1
Suppl 1):A6–A7. 2020.PubMed/NCBI View Article : Google Scholar
|
|
3
|
Zhou Y, Echouffo-Tcheugui JB, Gu JJ, Ruan
XN, Zhao GM, Xu WH, Yang LM, Zhang H, Qiu H, Narayan KM and Sun Q:
Prevalence of chronic kidney disease across levels of glycemia
among adults in Pudong New Area, Shanghai, China. BMC Nephrology.
14(253)2013.PubMed/NCBI View Article : Google Scholar
|
|
4
|
Kawanami D, Matoba K and Utsunomiya K:
Signaling pathways in diabetic nephropathy. Histol Histopathol.
31:1059–1067. 2016.PubMed/NCBI View Article : Google Scholar
|
|
5
|
Quan KY, Yap CG, Jahan NK and Pillai N:
Review of early circulating biomolecules associated with diabetes
nephropathy-Ideal candidates for early biomarker array test for DN.
Diabetes Res Clin Pract. 182(109122)2021.PubMed/NCBI View Article : Google Scholar
|
|
6
|
Samsu N: Diabetic Nephropathy: Challenges
in Pathogenesis, Diagnosis, and Treatment. Biomed Res Int.
2021(1497449)2021.PubMed/NCBI View Article : Google Scholar
|
|
7
|
Magee C, Grieve DJ, Watson CJ and Brazil
DP: Diabetic nephropathy: A tangled web to unweave. Cardiovasc
Drugs. 31:579–592. 2017.PubMed/NCBI View Article : Google Scholar
|
|
8
|
Vaziri ND: Disorders of lipid metabolism
in nephrotic syndrome: Mechanisms and consequences. Kidney Int.
90:41–52. 2016.PubMed/NCBI View Article : Google Scholar
|
|
9
|
Cooper ME: Interaction of metabolic and
haemodynamic factors in mediating experimental diabetic
nephropathy. Diabetologia. 44:1957–1972. 2001.PubMed/NCBI View Article : Google Scholar
|
|
10
|
Forbes JM, Fukami K and Cooper ME:
Diabetic nephropathy: Where hemodynamics meets metabolism. Exp Clin
Endocrinol Diabetes. 115:69–84. 2007.PubMed/NCBI View Article : Google Scholar
|
|
11
|
Herman-Edelstein M, Scherzer P, Tobar A,
Levi M and Gafter U: Altered renal lipid metabolism and renal lipid
accumulation in human diabetic nephropathy. J Lipid Res.
55:561–572. 2014.PubMed/NCBI View Article : Google Scholar
|
|
12
|
Yang W, Luo Y, Yang S, Zeng M, Zhang S,
Liu J, Han Y, Liu Y, Zhu X, Wu H, et al: Ectopic lipid
accumulation: Potential role in tubular injury and inflammation in
diabetic kidney disease. Clin Sci (Lond). 132:2407–2422.
2018.PubMed/NCBI View Article : Google Scholar
|
|
13
|
Vallon V and Thomson SC: The tubular
hypothesis of nephron filtration and diabetic kidney disease. Nat
Rev Nephrol. 16:317–336. 2020.PubMed/NCBI View Article : Google Scholar
|
|
14
|
Baum P, Toyka KV, Blüher M, Kosacka J and
Nowicki M: Inflammatory mechanisms in the pathophysiology of
diabetic peripheral neuropathy (DN)-New aspects. Int J Mol Sci.
22(10835)2021.PubMed/NCBI View Article : Google Scholar
|
|
15
|
Kawanami D, Matoba K and Utsunomiya K:
Dyslipidemia in diabetic nephropathy. Ren Replace Ther.
2(16)2016.
|
|
16
|
Lu CC, Ma KL, Ruan XZ and Liu BC: The
emerging roles of microparticles in diabetic nephropathy. Int J
Biol Sci. 13:1118–1125. 2017.PubMed/NCBI View Article : Google Scholar
|
|
17
|
Ferrara D, Montecucco F, Dallegri F and
Carbone F: Impact of different ectopic fat depots on cardiovascular
and metabolic diseases. J Cell Physiol. 234:21630–21641.
2019.PubMed/NCBI View Article : Google Scholar
|
|
18
|
Nishi H, Higashihara T and Inagi R:
Lipotoxicity in kidney, heart, and skeletal muscle dysfunction.
Nutrients. 11(1664)2019.PubMed/NCBI View Article : Google Scholar
|
|
19
|
Xu T, Xu X, Zhang L, Zhang K, Wei Q, Zhu
L, Yu Y, Xiao L, Lin L, Qian W, et al: Lipidomics reveals serum
specific lipid alterations in diabetic nephropathy. Front
Endocrinol (Lausanne). 12(781417)2021.PubMed/NCBI View Article : Google Scholar
|
|
20
|
Wu L, Liu C, Chang DY, Zhan R, Zhao M, Man
Lam S, Shui G, Zhao MH, Zheng L and Chen M: The attenuation of
diabetic nephropathy by annexin A1 via regulation of lipid
metabolism through the AMPK/PPARα/CPT1b pathway. Diabetes.
70:2192–2203. 2021.PubMed/NCBI View Article : Google Scholar
|
|
21
|
Thongnak L, Pongchaidecha A and Lungkaphin
A: Renal lipid metabolism and lipotoxicity in diabetes. Am J Med
Sci. 359:84–99. 2020.PubMed/NCBI View Article : Google Scholar
|
|
22
|
Zhao YH and Fan YJ: Resveratrol improves
lipid metabolism in diabetic nephropathy rats. Front Biosci
(Landmark Ed). 25:1913–1924. 2020.PubMed/NCBI View
Article : Google Scholar
|
|
23
|
Han Y, Xiong S, Zhao H, Yang S, Yang M,
Zhu X, Jiang N, Xiong X, Gao P, Wei L, et al: Lipophagy deficiency
exacerbates ectopic lipid accumulation and tubular cells injury in
diabetic nephropathy. Cell Death Dis. 12(1031)2021.PubMed/NCBI View Article : Google Scholar
|
|
24
|
Patel D and Witt SN: Ethanolamine and
Phosphatidylethanolamine: Partners in health and disease. Oxid Med
Cell Longev. 2017(4829180)2017.PubMed/NCBI View Article : Google Scholar
|
|
25
|
van der Veen JN, Kennelly JP, Wan S, Vance
JE, Vance DE and Jacobs RL: The critical role of
phosphatidylcholine and phosphatidylethanolamine metabolism in
health and disease. Biochim Biophys Acta Biomembr. 1859 (9 Pt
B):1558–1572. 2017.PubMed/NCBI View Article : Google Scholar
|
|
26
|
Ravandi A, Kuksis A and Shaikh NA:
Glucosylated Glycerophosphoethanolamines are the Major LDL
glycation products and increase LDL susceptibility to oxidation
evidence of their presence in atherosclerotic lesions. Arterioscler
Thromb Vasc Biol. 20:467–477. 2000.PubMed/NCBI View Article : Google Scholar
|
|
27
|
Vlassara H and Palace MR: Glycoxidation:
The menace of diabetes and aging. Mt Sinai J Med. 70:232–241.
2003.PubMed/NCBI
|
|
28
|
Sur S, Nguyen M, Boada P, Sigdel TK,
Sollinger H and Sarwal MM: FcER1: A novel molecule implicated in
the progression of human diabetic kidney disease. Front Immunol.
12(769972)2021.PubMed/NCBI View Article : Google Scholar
|
|
29
|
Ritchie ME, Phipson B, Wu D, Hu Y, Law CW,
Shi W and Smyth GK: limma powers differential expression analyses
for RNA-sequencing and microarray studies. Nucleic Acids Res.
43(e47)2015.PubMed/NCBI View Article : Google Scholar
|
|
30
|
Ito K and Murphy D: Application of ggplot2
to Pharmacometric Graphics. CPT Pharmacometrics Syst Pharmacol.
2(e79)2013.PubMed/NCBI View Article : Google Scholar
|
|
31
|
Hu K: Become competent in generating
RNA-Seq heat maps in one day for novices without prior R
experience. Methods Mol Biol. 2239:269–303. 2021.PubMed/NCBI View Article : Google Scholar
|
|
32
|
Chen H and Boutros PC: VennDiagram: A
package for the generation of highly-customizable Venn and Euler
diagrams in R. BMC Bioinformatics. 12(35)2011.PubMed/NCBI View Article : Google Scholar
|
|
33
|
Tang J, Kong D, Cui Q, Wang K, Zhang D,
Gong Y and Wu G: Prognostic genes of breast cancer identified by
gene co-expression network analysis. Front Oncol.
8(374)2018.PubMed/NCBI View Article : Google Scholar
|
|
34
|
Langfelder P and Horvath S: WGCNA: An R
package for weighted correlation network analysis. BMC
Bioinformatics. 9(559)2008.PubMed/NCBI View Article : Google Scholar
|
|
35
|
Szklarczyk D, Gable AL, Nastou KC, Lyon D,
Kirsch R, Pyysalo S, Doncheva NT, Legeay M, Fang T, Bork P, et al:
The STRING database in 2021: Customizable protein-protein networks,
and functional characterization of user-uploaded gene/measurement
sets. Nucleic Acids Res. 49 (D1):D605–D612. 2021.PubMed/NCBI View Article : Google Scholar
|
|
36
|
Wu T, Hu E, Xu S, Chen M, Guo P, Dai Z,
Feng T, Zhou L, Tang W, Zhan L, et al: clusterProfiler 4.0: A
universal enrichment tool for interpreting omics data. Innovation
(Camb). 2(100141)2021.PubMed/NCBI View Article : Google Scholar
|
|
37
|
Walter W, Sanchez-Cabo F and Ricote M:
GOplot: An R package for visually combining expression data with
functional analysis. Bioinformatics. 31:2912–2914. 2015.PubMed/NCBI View Article : Google Scholar
|
|
38
|
Xu Q, Xu H, Deng R, Wang Z, Li N, Qi Z,
Zhao J and Huang W: Multi-omics analysis reveals prognostic value
of tumor mutation burden in hepatocellular carcinoma. Cancer Cell
Int. 21(342)2021.PubMed/NCBI View Article : Google Scholar
|
|
39
|
Zhang M, Zhu K, Pu H, Wang Z, Zhao H,
Zhang J and Wang Y: An immune-related signature predicts survival
in patients with lung adenocarcinoma. Front Oncol.
9(1314)2019.PubMed/NCBI View Article : Google Scholar
|
|
40
|
Sanz H, Valim C, Vegas E, Oller JM and
Reverter F: SVM-RFE: Selection and visualization of the most
relevant features through non-linear kernels. BMC Bioinformatics.
19(432)2018.PubMed/NCBI View Article : Google Scholar
|
|
41
|
Hänzelmann S, Castelo R and Guinney J:
GSVA: Gene set variation analysis for microarray and RNA-seq data.
BMC Bioinformatics. 14(7)2013.PubMed/NCBI View Article : Google Scholar
|
|
42
|
Pei L, Li J, Xu Z, Chen N, Wu X and Chen
J: Effect of high hydrostatic pressure on aroma components, amino
acids, and fatty acids of Hami melon (Cucumis melo L. var.
reticulatus naud.) juice. Food Sci Nutr. 8:1394–1405.
2020.PubMed/NCBI View Article : Google Scholar
|
|
43
|
Strezoska Ž, Licon A, Haimes J, Spayd KJ,
Patel KM, Sullivan K, Jastrzebski K, Simpson KJ, Leake D, van
Brabant Smith A and Vermeulen A: Optimized PCR conditions and
increased shRNA fold representation improve reproducibility of
pooled shRNA screens. PLoS One. 7(e42341)2012.PubMed/NCBI View Article : Google Scholar
|
|
44
|
Cabukusta B, Nettebrock NT, Kol M,
Hilderink A, Tafesse FG and Holthuis JCM: Ceramide
phosphoethanolamine synthase SMSr is a target of caspase-6 during
apoptotic cell death. Biosci Rep. 37(BSR20170867)2017.PubMed/NCBI View Article : Google Scholar
|
|
45
|
Tafesse FG, Vacaru AM, Bosma EF,
Hermansson M, Jain A, Hilderink A, Somerharju P and Holthuis JC:
Sphingomyelin synthase-related protein SMSr is a suppressor of
ceramide-induced mitochondrial apoptosis. J Cell Sci. 127 (Pt
2):445–454. 2014.PubMed/NCBI View Article : Google Scholar
|
|
46
|
Srivastava SP, Shi S, Koya D and Kanasaki
K: Lipid mediators in diabetic nephropathy. Fibrogenesis Tissue
Repair. 7(12)2014.PubMed/NCBI View Article : Google Scholar
|
|
47
|
Woodcock J: Sphingosine and ceramide
signalling in apoptosis. IUBMB Life. 58:462–466. 2006.PubMed/NCBI View Article : Google Scholar
|
|
48
|
Tani M, Ito M and Igarashi Y:
Ceramide/sphingosine/sphingosine 1-phosphate metabolism on the cell
surface and in the extracellular space. Cell Signal. 19:229–237.
2007.PubMed/NCBI View Article : Google Scholar
|
|
49
|
Kuzmenko DI and Klimentyeva TK: Role of
ceramide in apoptosis and development of insulin resistance.
Biochemistry (Mosc). 81:913–927. 2016.PubMed/NCBI View Article : Google Scholar
|
|
50
|
Summers SA: The ART of lowering ceramides.
Cell Metab. 22:195–196. 2015.PubMed/NCBI View Article : Google Scholar
|
|
51
|
Symons JD and Abel ED: Lipotoxicity
contributes to endothelial dysfunction: A focus on the contribution
from ceramide. Rev Endocr Metab Disord. 14:59–68. 2013.PubMed/NCBI View Article : Google Scholar
|
|
52
|
Chavez JA and Summers SA: A
ceramide-centric view of insulin resistance. Cell Metab.
15:585–594. 2012.PubMed/NCBI View Article : Google Scholar
|
|
53
|
Park JW, Byrd A, Lee CM and Morgan ET:
Nitric oxide stimulates cellular degradation of human CYP51A1, the
highly conserved lanosterol 14α-demethylase. Biochem J.
474:3241–3252. 2017.PubMed/NCBI View Article : Google Scholar
|
|
54
|
Kaluzhskiy L, Ershov P, Yablokov E, Shkel
T, Grabovec I, Mezentsev Y, Gnedenko O, Usanov S, Shabunya P,
Fatykhava S, et al: Human Lanosterol 14-Alpha Demethylase (CYP51A1)
is a putative target for natural flavonoid luteolin 7,3'-Disulfate.
Molecules. 26(2237)2021.PubMed/NCBI View Article : Google Scholar
|
|
55
|
Opazo-Ríos L, Mas S, Marín-Royo G, Mezzano
S, Gómez-Guerrero C, Moreno JA and Egido J: Lipotoxicity and
diabetic nephropathy: Novel mechanistic insights and therapeutic
opportunities. Int J Mol Sci. 21(2632)2020.PubMed/NCBI View Article : Google Scholar
|
|
56
|
Charles MA, Eschwège E, Thibult N, Claude
JR, Warnet JM, Rosselin GE, Girard J and Balkau B: The role of
non-esterified fatty acids in the deterioration of glucose
tolerance in Caucasian subjects: Results of the Paris Prospective
Study. Diabetologia. 40:1101–1106. 1997.PubMed/NCBI View Article : Google Scholar
|
|
57
|
Meex RCR, Blaak EE and van Loon LJC:
Lipotoxicity plays a key role in the development of both insulin
resistance and muscle atrophy in patients with type 2 diabetes.
Obes Rev. 20:1205–1217. 2019.PubMed/NCBI View Article : Google Scholar
|
|
58
|
Gai Z, Wang T, Visentin M, Kullak-Ublick
GA, Fu X and Wang Z: Lipid accumulation and chronic kidney disease.
Nutrients. 11(722)2019.PubMed/NCBI View Article : Google Scholar
|
|
59
|
Jaishy B and Abel ED: Lipids, lysosomes,
and autophagy. J Lipid Res. 57:1619–1635. 2016.PubMed/NCBI View Article : Google Scholar
|
|
60
|
Pérez-Morales RE, Del Pino MD, Valdivielso
JM, Ortiz A, Mora-Fernández C and Navarro-González JF: Inflammation
in diabetic kidney disease. Nephron. 143:12–16. 2019.PubMed/NCBI View Article : Google Scholar
|
|
61
|
Shao BY, Zhang SF, Li HD, Meng XM and Chen
HY: Epigenetics and inflammation in diabetic nephropathy. Front
Physiol. 12(649587)2021.PubMed/NCBI View Article : Google Scholar
|
|
62
|
Wang Y, Zhao M and Zhang Y: Identification
of fibronectin 1 (FN1) and complement component 3 (C3) as immune
infiltration-related biomarkers for diabetic nephropathy using
integrated bioinformatic analysis. Bioengineered. 12:5386–5401.
2021.PubMed/NCBI View Article : Google Scholar
|
|
63
|
Huang M, Zhu Z, Nong C, Liang Z, Ma J and
Li G: Bioinformatics analysis identifies diagnostic biomarkers and
their correlation with immune infiltration in diabetic nephropathy.
Ann Transl Med. 10(669)2022.PubMed/NCBI View Article : Google Scholar
|
|
64
|
Wilson PC, Wu H, Kirita Y, Uchimura K,
Ledru N, Rennke HG, Welling PA, Waikar SS and Humphreys BD: The
single-cell transcriptomic landscape of early human diabetic
nephropathy. Proc Natl Acad Sci USA. 116:19619–19625.
2019.PubMed/NCBI View Article : Google Scholar
|
|
65
|
Onalan E: The relationship between
monocyte to high-density lipoprotein cholesterol ratio and diabetic
nephropathy. Pak J Med Sci. 35:1081–1086. 2019.PubMed/NCBI View Article : Google Scholar
|
|
66
|
Huang Q, Wu H, Wo M, Ma J, Fei X and Song
Y: Monocyte-lymphocyte ratio is a valuable predictor for diabetic
nephropathy in patients with type 2 diabetes. Medicine (Baltimore).
99(e20190)2020.PubMed/NCBI View Article : Google Scholar
|
|
67
|
Efe FK: The association between monocyte
HDL ratio and albuminuria in diabetic nephropathy. Pak J Med Sci.
37:1128–1132. 2021.PubMed/NCBI View Article : Google Scholar
|
|
68
|
Ancuta P, Wang J and Gabuzda D: CD16+
monocytes produce IL-6, CCL2, and matrix metalloproteinase-9 upon
interaction with CX3CL1-expressing endothelial cells. J Leukoc
Biol. 80:1156–1164. 2006.PubMed/NCBI View Article : Google Scholar
|
|
69
|
Tang G, Li S, Zhang C, Chen H, Wang N and
Feng Y: Clinical efficacies, underlying mechanisms and molecular
targets of Chinese medicines for diabetic nephropathy treatment and
management. Acta Pharm Sin B. 11:2749–2767. 2021.PubMed/NCBI View Article : Google Scholar
|
|
70
|
Ji L, Chen Y, Wang H, Zhang W, He L, Wu J
and Liu Y: Overexpression of Sirt6 promotes M2 macrophage
transformation, alleviating renal injury in diabetic nephropathy.
Int J Oncol. 55:103–115. 2019.PubMed/NCBI View Article : Google Scholar
|
|
71
|
Wolf G: New insights into the
pathophysiology of diabetic nephropathy: From haemodynamics to
molecular pathology. Eur J Clin Invest. 34:785–796. 2004.PubMed/NCBI View Article : Google Scholar
|