Introduction
Precise, rapid and comprehensive diagnostics are key
to the effective selection of available procedures and medications
that can significantly improve the quality of life of patients with
cancer. The widespread use of next-generation sequencing (NGS)
technology, which allows for rapid and precise identification of
cancer-specific alterations in a broad range of genes, has refined
this branch of diagnostics and increase the use of personalized
therapies. Based on the available information, clinically relevant
molecular alterations can be divided into the following groups:
Small variants, including single-nucleotide variants (SNVs;
insertions and deletions), splice variants, fusions and copy number
variants (CNVs). An integral part of the diagnostic process is also
the determination of genomic biomarkers such as microsatellite
instability (MSI) and tumour mutational burden (TMB). The TruSight
Oncology 500 (TSO 500; Illumina, Inc.) assay can be used to analyse
small variants in 523 tumour-associated genes, detection of three
types of clinically relevant splice variants, identification of the
presence of fusions in 55 selected genes, CNV analysis of 59 genes
and TMB and MSI detection in formalin-fixed paraffin-embedded
(FFPE) samples (1-3).
Along with the possibility of annotating identified changes using
software such as PierianDx CGW (Pierian), this type of
comprehensive assay represents a unique solution for diagnosing a
wide range of oncological diseases. However, a complex analysis
requires a sufficient quantity and quality of extracted nucleic
acids. Since FFPE samples currently remain the most used type of
material in the diagnostic process, the TSO 500 assay is also
primarily intended for use with FFPE samples (1-6).
The performance of the TSO 500 assay using FFPE
samples has been evaluated by multiple studies that have obtained
comparable results (1-5).
These findings support the rationale for utilising this type of
test for comprehensive genomic profiling across various tumour
types (1-6).
However, the aspect of feasibility of analysis should be
considered. It is not uncommon for the low quality of nucleic acids
to preclude the analysis of a relatively high percentage of FFPE
samples, whether by classic methods such as fluorescence in
situ hybridisation and immunohistochemistry or by NGS-based
assays (7-10).
One way to avoid repeated and potentially unsuccessful attempts at
extracting nucleic acids from low-quality FFPE samples is to use
non-FFPE material.
Several scientific studies have focused on
determining the performance of NGS using non-FFPE material.
However, these studies could not assess the concordance of NGS
quality metrics and performance in detecting alterations of FFPE
vs. non-FFPE tissues due to the absence of paired samples (6,11).
The present study aimed to focus on comparing the
quality control (QC) parameters as well as the concordance of
variant detection methods between findings from FFPE and
fresh-frozen (FF) samples in the detection of clinically relevant
gene alterations identified by the TSO500 assay and annotated using
PierianDx CGW. Paired samples of lung carcinoma of non-small cell
type (LC), breast carcinoma (BC) and colorectal carcinoma (CRC)
that met the required quality criteria were analysed.
Materials and methods
Sample collection
The specimens used in the present study were
prospectively collected to allow complex genomic profiling of the
tumour and tumour-adjacent tissues of patients with LC, BC and CRC
in paired FFPE and FF tissue samples. All patients provided written
informed consent for participation in the study and the study was
approved by the Ethics Committee of the Jessenius Faculty of
Medicine in Martin (approval no. EK 79/2020; Martin, Slovakia).
Patient tissue samples were collected between January 2021 and
March 2022 at the University Hospital Martin (Martin, Slovakia).
The standard operation protocols used at the hospital for each type
of surgical specimen were adapted to ensure routine standard
diagnostic procedures were performed, whilst allowing all tissues
required to be collected for the present study. As the surgical
department was located close to the pathology laboratories, it was
possible to deliver the unfixed resected specimen to the gross
pathology laboratory immediately after completing the surgical
examination.
Processing and storage of FFPE and FF
samples
The responsible pathologists, while reviewing the
delivered unfixed specimens to ensure the required routine
diagnostic procedures, selected the samples to be stored in a FF
state. The tumour tissue had to be of sufficient volume to make two
aliquots. Of these aliquots, one was intended for fixation, and the
other, with a volume of ~3.4 mm3, was used for the
extraction of nucleic acids and was submerged in a volume of
RNAprotect Tissue Reagent (Qiagen GmbH) and banked in ultra-low
temperature freezers at -80˚C at the Biomedical Centre Martin
(Martin, Slovakia). After standard formalin fixation and grossing
of the specimen, where samples were fixed in 10% neutral buffered
formalin (pH 7.2-7.4; formaldehyde 4%) (cat. no. 02170107; BD Bamed
s.r.o) at 25˚C for 24 h, the parallel tissue samples were embedded
in paraffin wax together with all the tissue samples required for
routine oncological biopsy diagnostics. For the present study,
prior to the extraction of DNA and RNA, FFPE blocks were selected
and 20 µm paraffin sections were prepared using a microtome (Microm
HM 400; Zeiss GmbH). The first section(s) were dedicated to nucleic
acid extraction, while the subsequent section was stained with
haematoxylin and eosin to enable the responsible pathologist to
determine the tumour:cell ratio. All FFPE samples were stored under
standardized conditions, with a median age of 17 months, ranging
from 9-25 months. Only samples with a sufficient volume and >20%
tumour cells (TCs) were accepted. Although direct quantification of
the tumour:cell ratio for the FF samples was not performed, the FF
and FFPE tissues originated from adjacent parallel sections.
Therefore, it was assumed that the TC ratio was likely to be
similar.
Nucleic acid extraction and quality
assessment of FFPE samples
For simultaneous DNA and RNA extraction, a total of
four 20 µm sections of FFPE tissue were assayed using the
AllPrep® DNA/RNA FFPE kit (cat. no. 80234; Qiagen GmbH),
according to the manufacturer's instructions. For a gentler
deparaffinization process, deparaffinization solution (Qiagen GmbH)
was used (incubation at 56˚C for 3 min). Quantification of
double-stranded DNA (dsDNA) and RNA was performed using a Qubit 4.0
Fluorometer (Thermo Fisher Scientific, Inc.) with a
Qubit™ dsDNA BR Assay kit (cat. no. Q32853; Thermo
Fisher Scientific, Inc.) and a Qubit™ RNA HS Assay kit
(cat. no. Q32855; Thermo Fisher Scientific, Inc.), respectively.
The quality of DNA was determined with an Illumina FFPE QC kit
(cat. no. WG-321-1001; Illumina, Inc.). Only DNA samples with ∆Cq
≤5 and a concentration ≥10 ng/µl were included. To assess the
quality of extracted RNA, an Agilent 2100 Bioanalyzer with an
Agilent RNA 6000 Nano Kit (cat. no. 5067-1511; Agilent
Technologies, Inc.) was used. The main parameter indicating the
quality of RNA samples was the percentage of RNA fragments >200
nucleotides (DV200). RNA samples with
DV200 >30 % and a concentration >10 ng/µl were
accepted for library preparation.
Nucleic acid extraction and quality
assessment of FF samples
Genomic DNA and total RNA were simultaneously
extracted from FF tissues (volume of FF tissue ~3.4 mm3)
using the AllPrep® DNA/RNA Micro kit (cat. no. 80284;
Qiagen GmbH), according to the manufacturer's instructions.
Quantification of dsDNA and RNA, was performed as aforementioned.
The quality of DNA was determined using an Agilent 2100 Bioanalyzer
with an Agilent DNA 12000 Kit (cat. no. 5067-1508; Agilent
Technologies, Inc.). Samples with an average fragment size ≥4,500
bp and a concentration ≥10 ng/µl were analysed. To assess the
quality of extracted RNA, an Agilent 2100 Bioanalyzer with an
Agilent RNA 6000 Nano Kit (cat. no. 5067-1511; Agilent
Technologies, Inc.) was used. RNA samples with DV200
>30% and concentration >10 ng/µl were accepted for library
preparation.
Library preparation and sequencing of
FFPE and FF samples
Library preparation was performed manually using the
TSO 500 assay (Illumina, Inc.) according to the manufacturer's
instructions. The TSO 500 assay is based on hybrid-capture
chemistry and therefore requires a relatively large amount of input
material with higher quality compared with amplicon-based
chemistry. For library preparation, 70 ng DNA and 80 ng RNA were
used. The first step in the process of DNA library preparation was
DNA shearing using the Covaris® ML 230 instrument
(Covaris, LLC) to obtain DNA fragments with an average length of
~150 bp. RNA library preparation began with denaturation, annealing
and two-step reverse transcription resulting in double-stranded
cDNA. After these initial steps, DNA was sheared, and the
corresponding cDNA was processed simultaneously based on the
manufacturer's instructions. To assess the quantity and quality of
libraries, the Qubit 4.0 Fluorometer was used with the
Qubit™ dsDNA HS Assay kit (cat. no. Q32854; Thermo
Fisher Scientific, Inc.) and the Agilent 2100 Bioanalyzer with the
Agilent DNA 1000 Kit (cat. no. 5067-1505; Agilent Technologies,
Inc.). Final libraries with a concentration >3 ng/µl and a
length of ~260 bp were normalised by bead-based normalisation to
ensure a uniform library representation in the pooled libraries.
The DNA pool consisted of eight DNA libraries and the cDNA pool
contained eight corresponding cDNA libraries. After this process,
the DNA and cDNA pools were mixed at a 4:1 ratio and diluted to the
final loading concentration (1.5 pM). The paired-end sequencing
runs were performed on the NextSeq 550 Dx (Illumina, Inc.) in
research mode with a read length of 2x101 bp.
Bioinformatic processing, tertiary
analysis and post-processing
A custom script was used to prepare a sample sheet
in the format required by PierianDx CGW (Pierian) based on the
initial sequencing sample sheet. The sequencing run, utilizing the
PierianDx-formatted sample sheet, was uploaded to an Amazon S3
bucket (public cloud storage; Amazon Web Services, Inc.) using CGW
RunUploader (version 1.13; Pierian). This initiated the automatic
conversion of bcl files to fastq files.
Subsequently, sample mapping and bulk accessioning
files, required by PierianDx CGW, were generated using a custom
script and uploaded to PierianDx CGW. Bioinformatic processing was
conducted by PierianDx CGW using the LocalApp (version 2.2.0;
Illumina, Inc.). Findings produced by the LocalApp were referred to
as the raw findings. The tertiary analysis was performed using
PierianDx CGW. Findings from the annotation by PierianDx CGW were
referred to as the annotated findings.
Output files from PierianDx CGW processing,
including QC reports for DNA and RNA (pdf files), tertiary analysis
results (json files; report with results and case details) and
variant call format files [vcf; main.vcf containing SNVs, CNVs,
fusions and altered transcripts (AT)], were downloaded using API
access to PierianDx CGW via custom scripts developed in R (version
4.0.5; Posit Software, PBC) (12).
The R library tabulizer (13) was used to create a script for
extracting QC data from the QC pdf reports. Another R script was
developed to extract information on SNVs, CNVs, fusions and AT from
PierianDx CGW json reports, saving this data into csv files, using
the R library jsonlite (14).
Statistical analysis
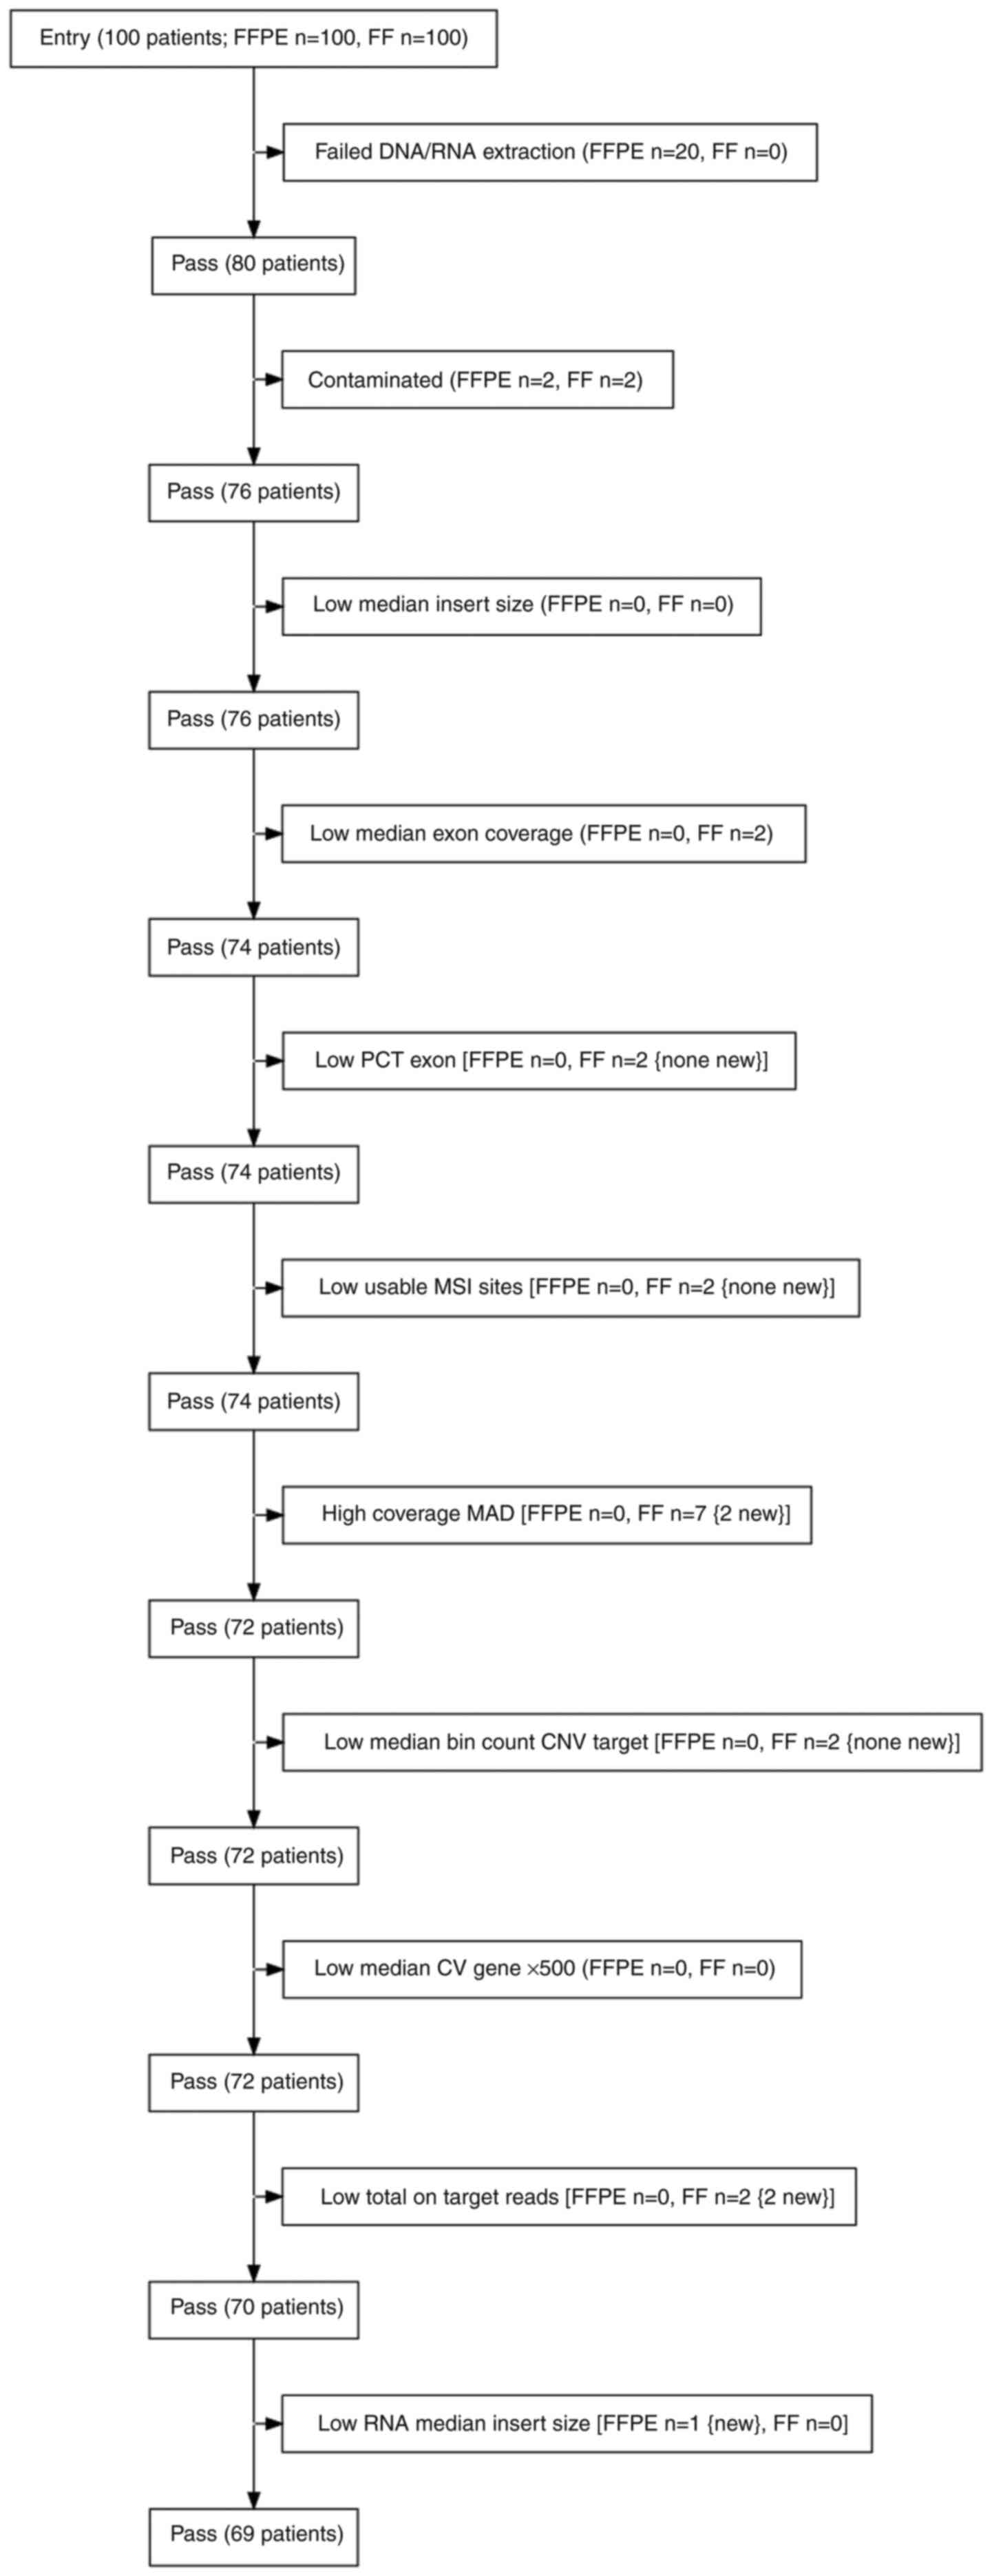
A flowchart illustrating the inclusion/exclusion of
samples based on QC criteria was created using the R library
DiagrammeR (15). The resulting
html widget was saved with the R libraries DiagrammeRsvg (16) and rsvg (17). Small variants, CNVs, fusions and AT
findings from the PierianDx CGW reports were analysed using a
custom R script.
For exploratory data analysis, spaghetti plots were
utilised to visualise the paired values of variant allele frequency
(VAF) and depth for small variants. A Wilcoxon signed rank test was
employed to test the null hypothesis that the median VAF value was
the same in the FFPE subpopulation compared with the FF
subpopulation, and the same test was applied to the depth. These
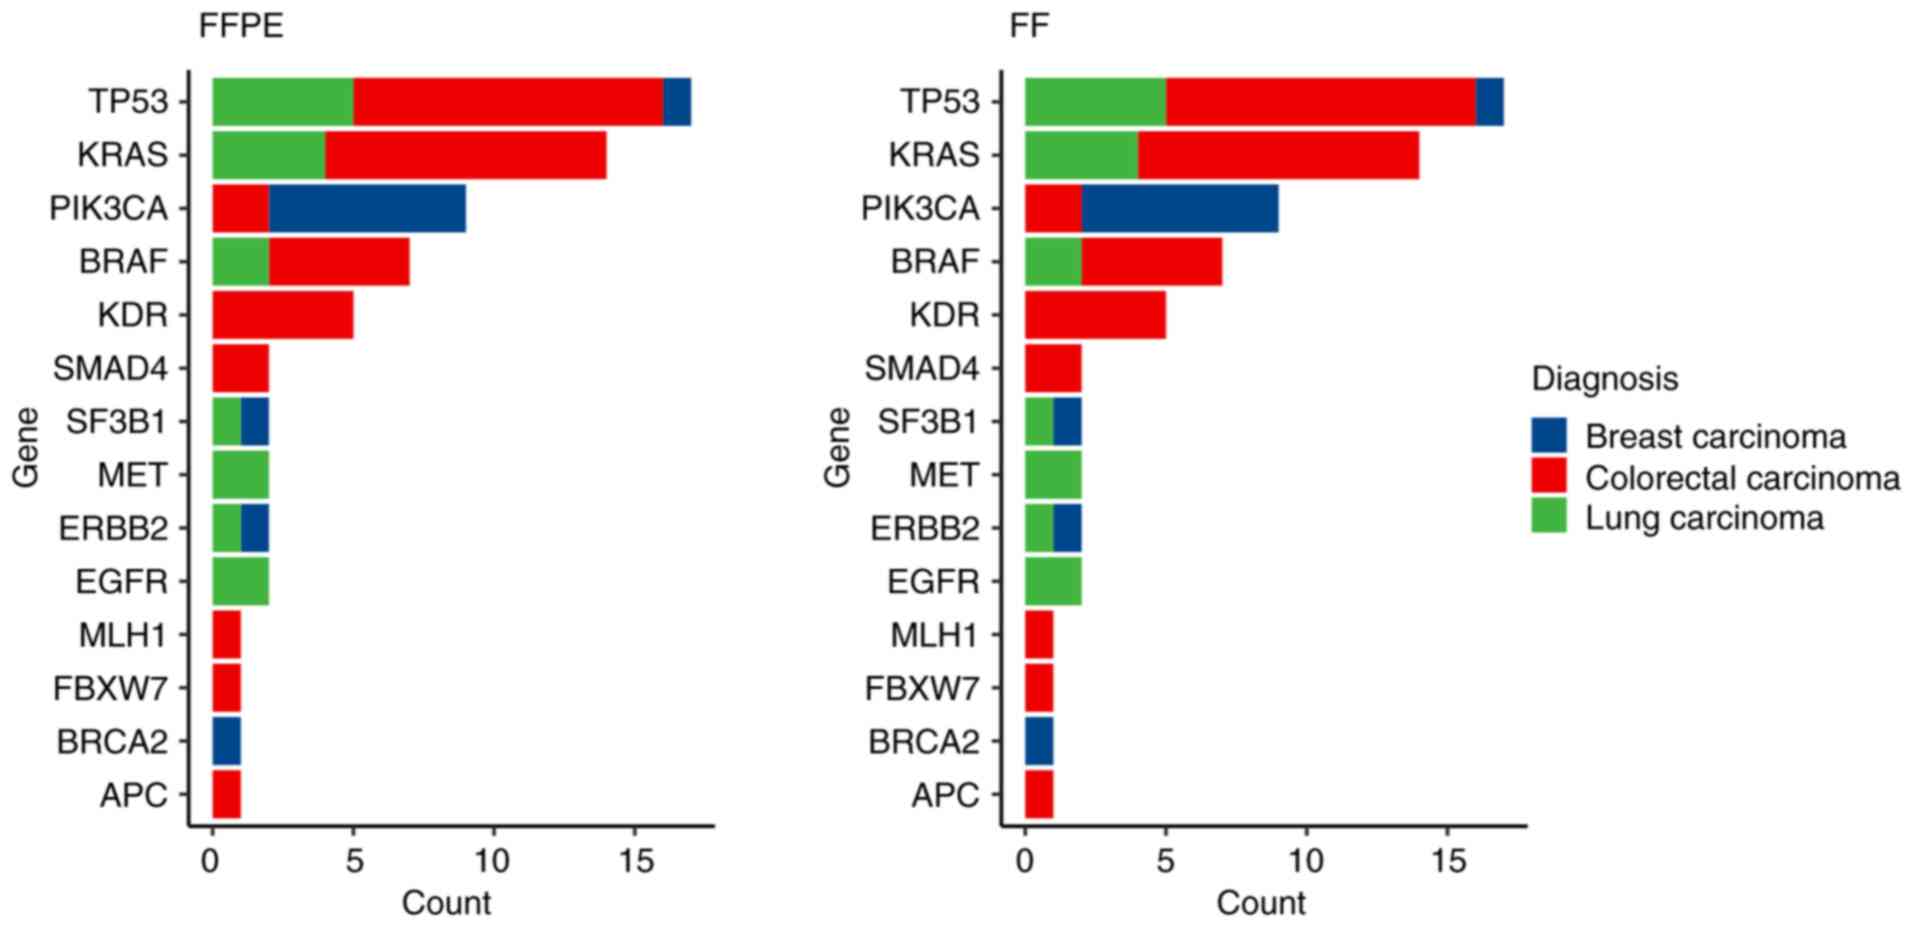
tests were conducted for each diagnosis separately. Bar plots were
used to display the counts of SNVs in FFPE and FF samples,
categorised by type of cancer diagnosis, and the same approach was
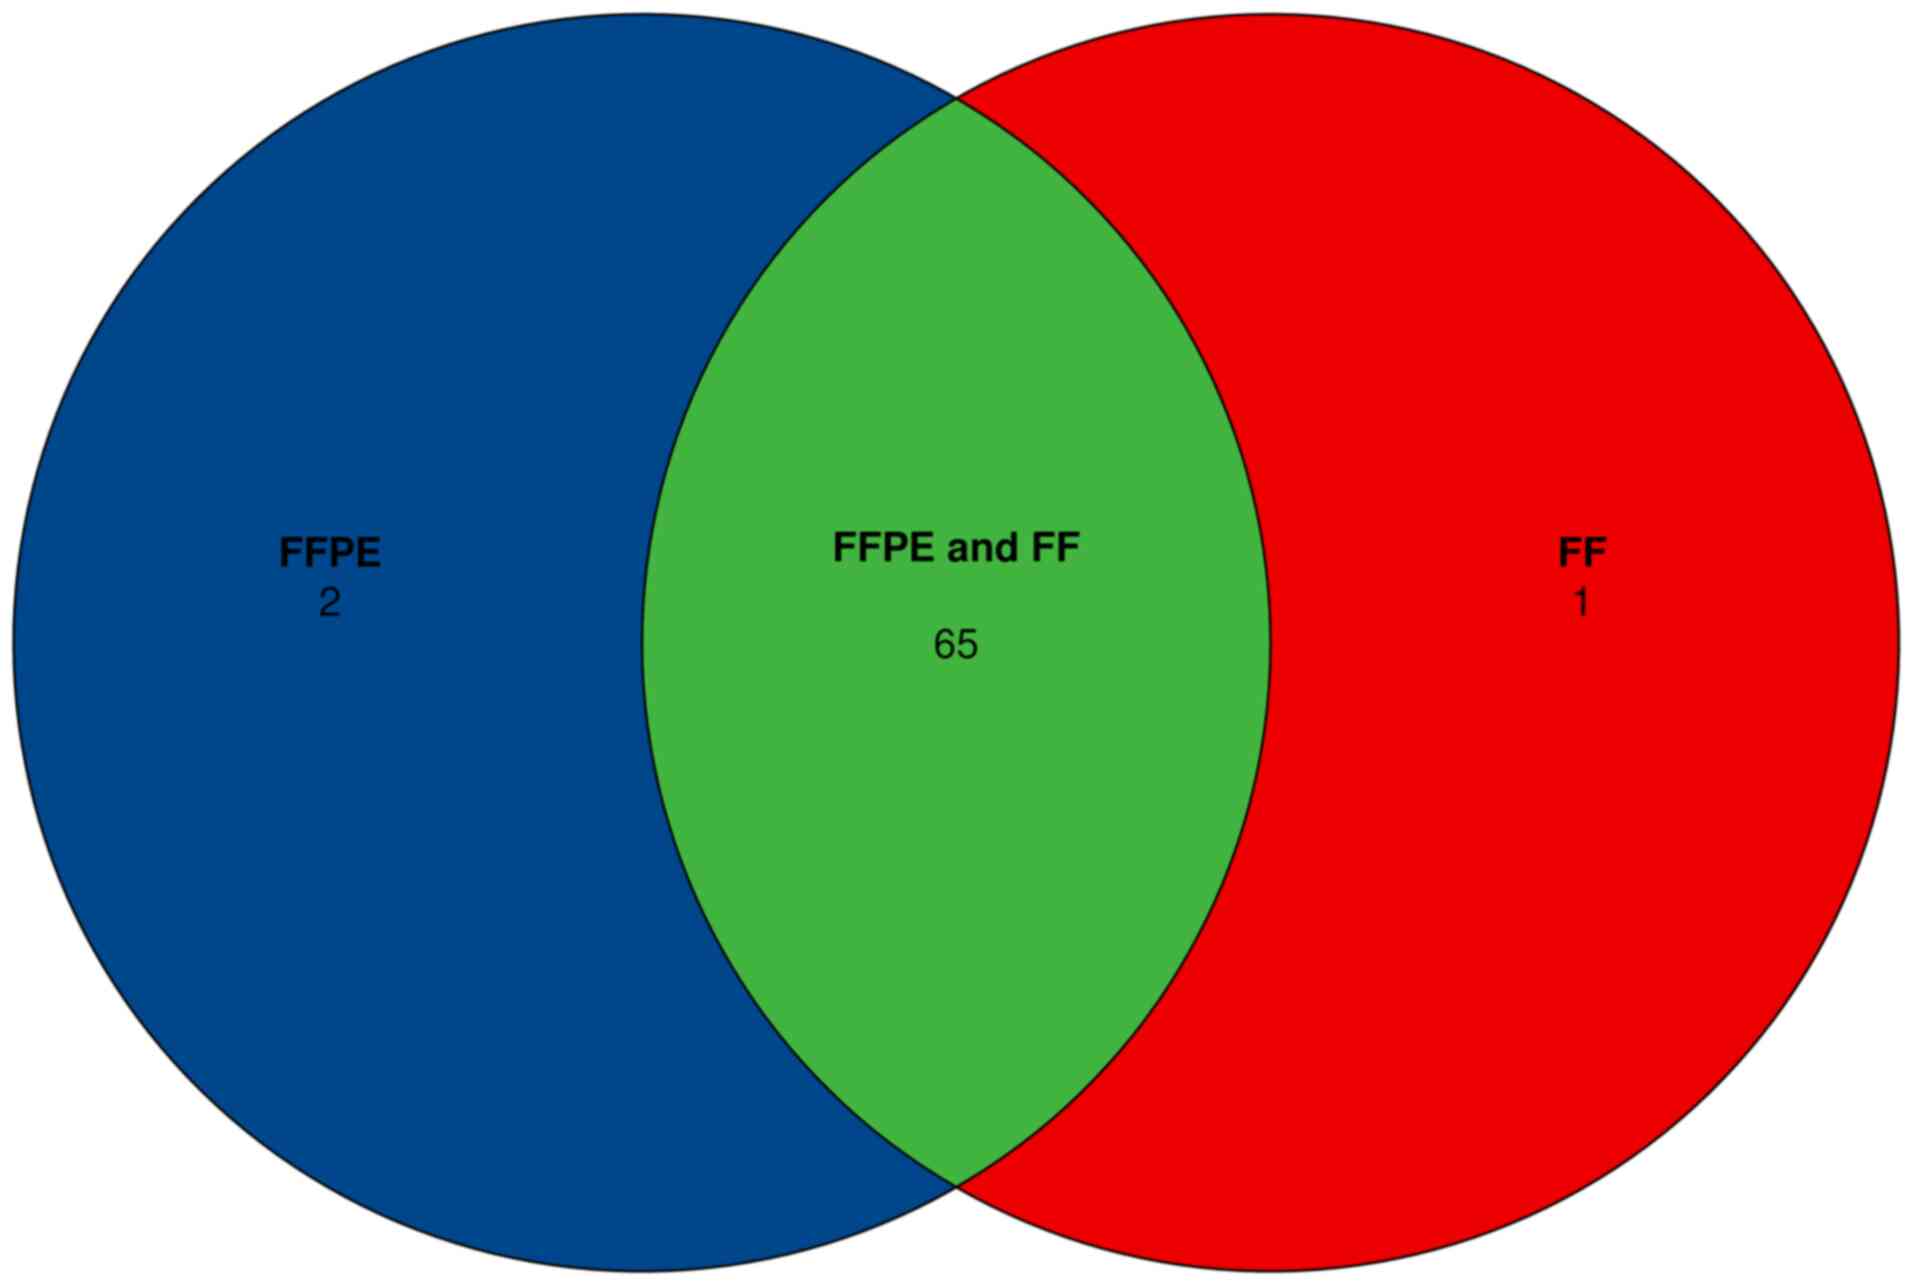
applied to CNVs, fusions and ATs. Venn diagrams were generated
using the R library eulerr (18).
CNVs from the main.vcf files were visualised using
bar plots showing the number of CNVs with fold change (FC) below
the cut-off in both FFPE and FF samples, above the cut-off in FFPE
and below the cut-off in FF tissues and above the cut-off in both
FFPE and FF samples for each gene. The R library vcfR (19) was used to import main.vcf into R.
The bias in FC estimates of FFPE relative to FF (or vice versa) was
explored separately for the four subsets of patients: i1) For which
FC was negative both in FFPE and FF; i2) positive in FFPE and
negative in FF; i3) negative in FFPE and positive in FF; and i4)
positive in both FFPE and FF) regardless of the gene. The FC in i1
(i2, i3 and i4) was explored using the box plot overlaid with
swarmplot, and the null hypothesis of the equality of medians in
the FFPE/FF subpopulations was analysed using a paired Wilcoxon
signed rank test. P<0.05 was used to indicate a statistically
significant difference.
Detailed data analysis reports generated using
in-house R notebooks were uploaded to the following Mendeley
repository: https://data.mendeley.com/datasets/pw4h7zwvzz/1.
Results
DNA and RNA quality metrics and
assessment of NGS quality metrics
In total, DNA and RNA were extracted from a set of
100 FFPE samples and their corresponding FF samples. The median age
of the samples was 17 months, ranging from 9-25 months. Samples
with a portion of TCs >20% were included in the extraction
process. The DNA extraction process from the FFPE tissues failed in
5/100 samples (∆Cq >5), while DNA extraction from FF samples was
successful for all samples. Among the RNA samples extracted from
FFPE tissues, 20/100 did not meet the QC criteria (DV200
<30%). However, preliminary analysis of these samples showed
that the storage period did not markedly impact the quality of the
samples. The quality of RNA samples from paired FF tissues was
lower compared with the high quality FF samples, but still met the
required criteria. This suggested that the fixation process itself,
particularly for tissues of lower quality, contributed to the
degradation of RNA quality, hindering the analysis of FFPE samples.
For the next step of library preparation, only samples that passed
the initial QC for both DNA and RNA were used, resulting in 80
paired samples (Fig. 1).
The input for DNA and RNA library preparation was 70
ng genomic DNA and 80 ng RNA, respectively. The success of TSO 500
DNA and RNA library preparation was assessed based on QC criteria
and thresholds from Appendix B of the Illumina Local Run Manager
TruSight Oncology Comprehensive (EU) Analysis Module Workflow Guide
(document no. 200008661; version 3; published July 2022) (20). DNA libraries were evaluated using
values of contamination score, contamination P-value, median insert
size, median exon coverage, PCT exon 50X, usable MSI sites,
coverage median absolute deviation and median bin count CNV target
(Fig. 2).
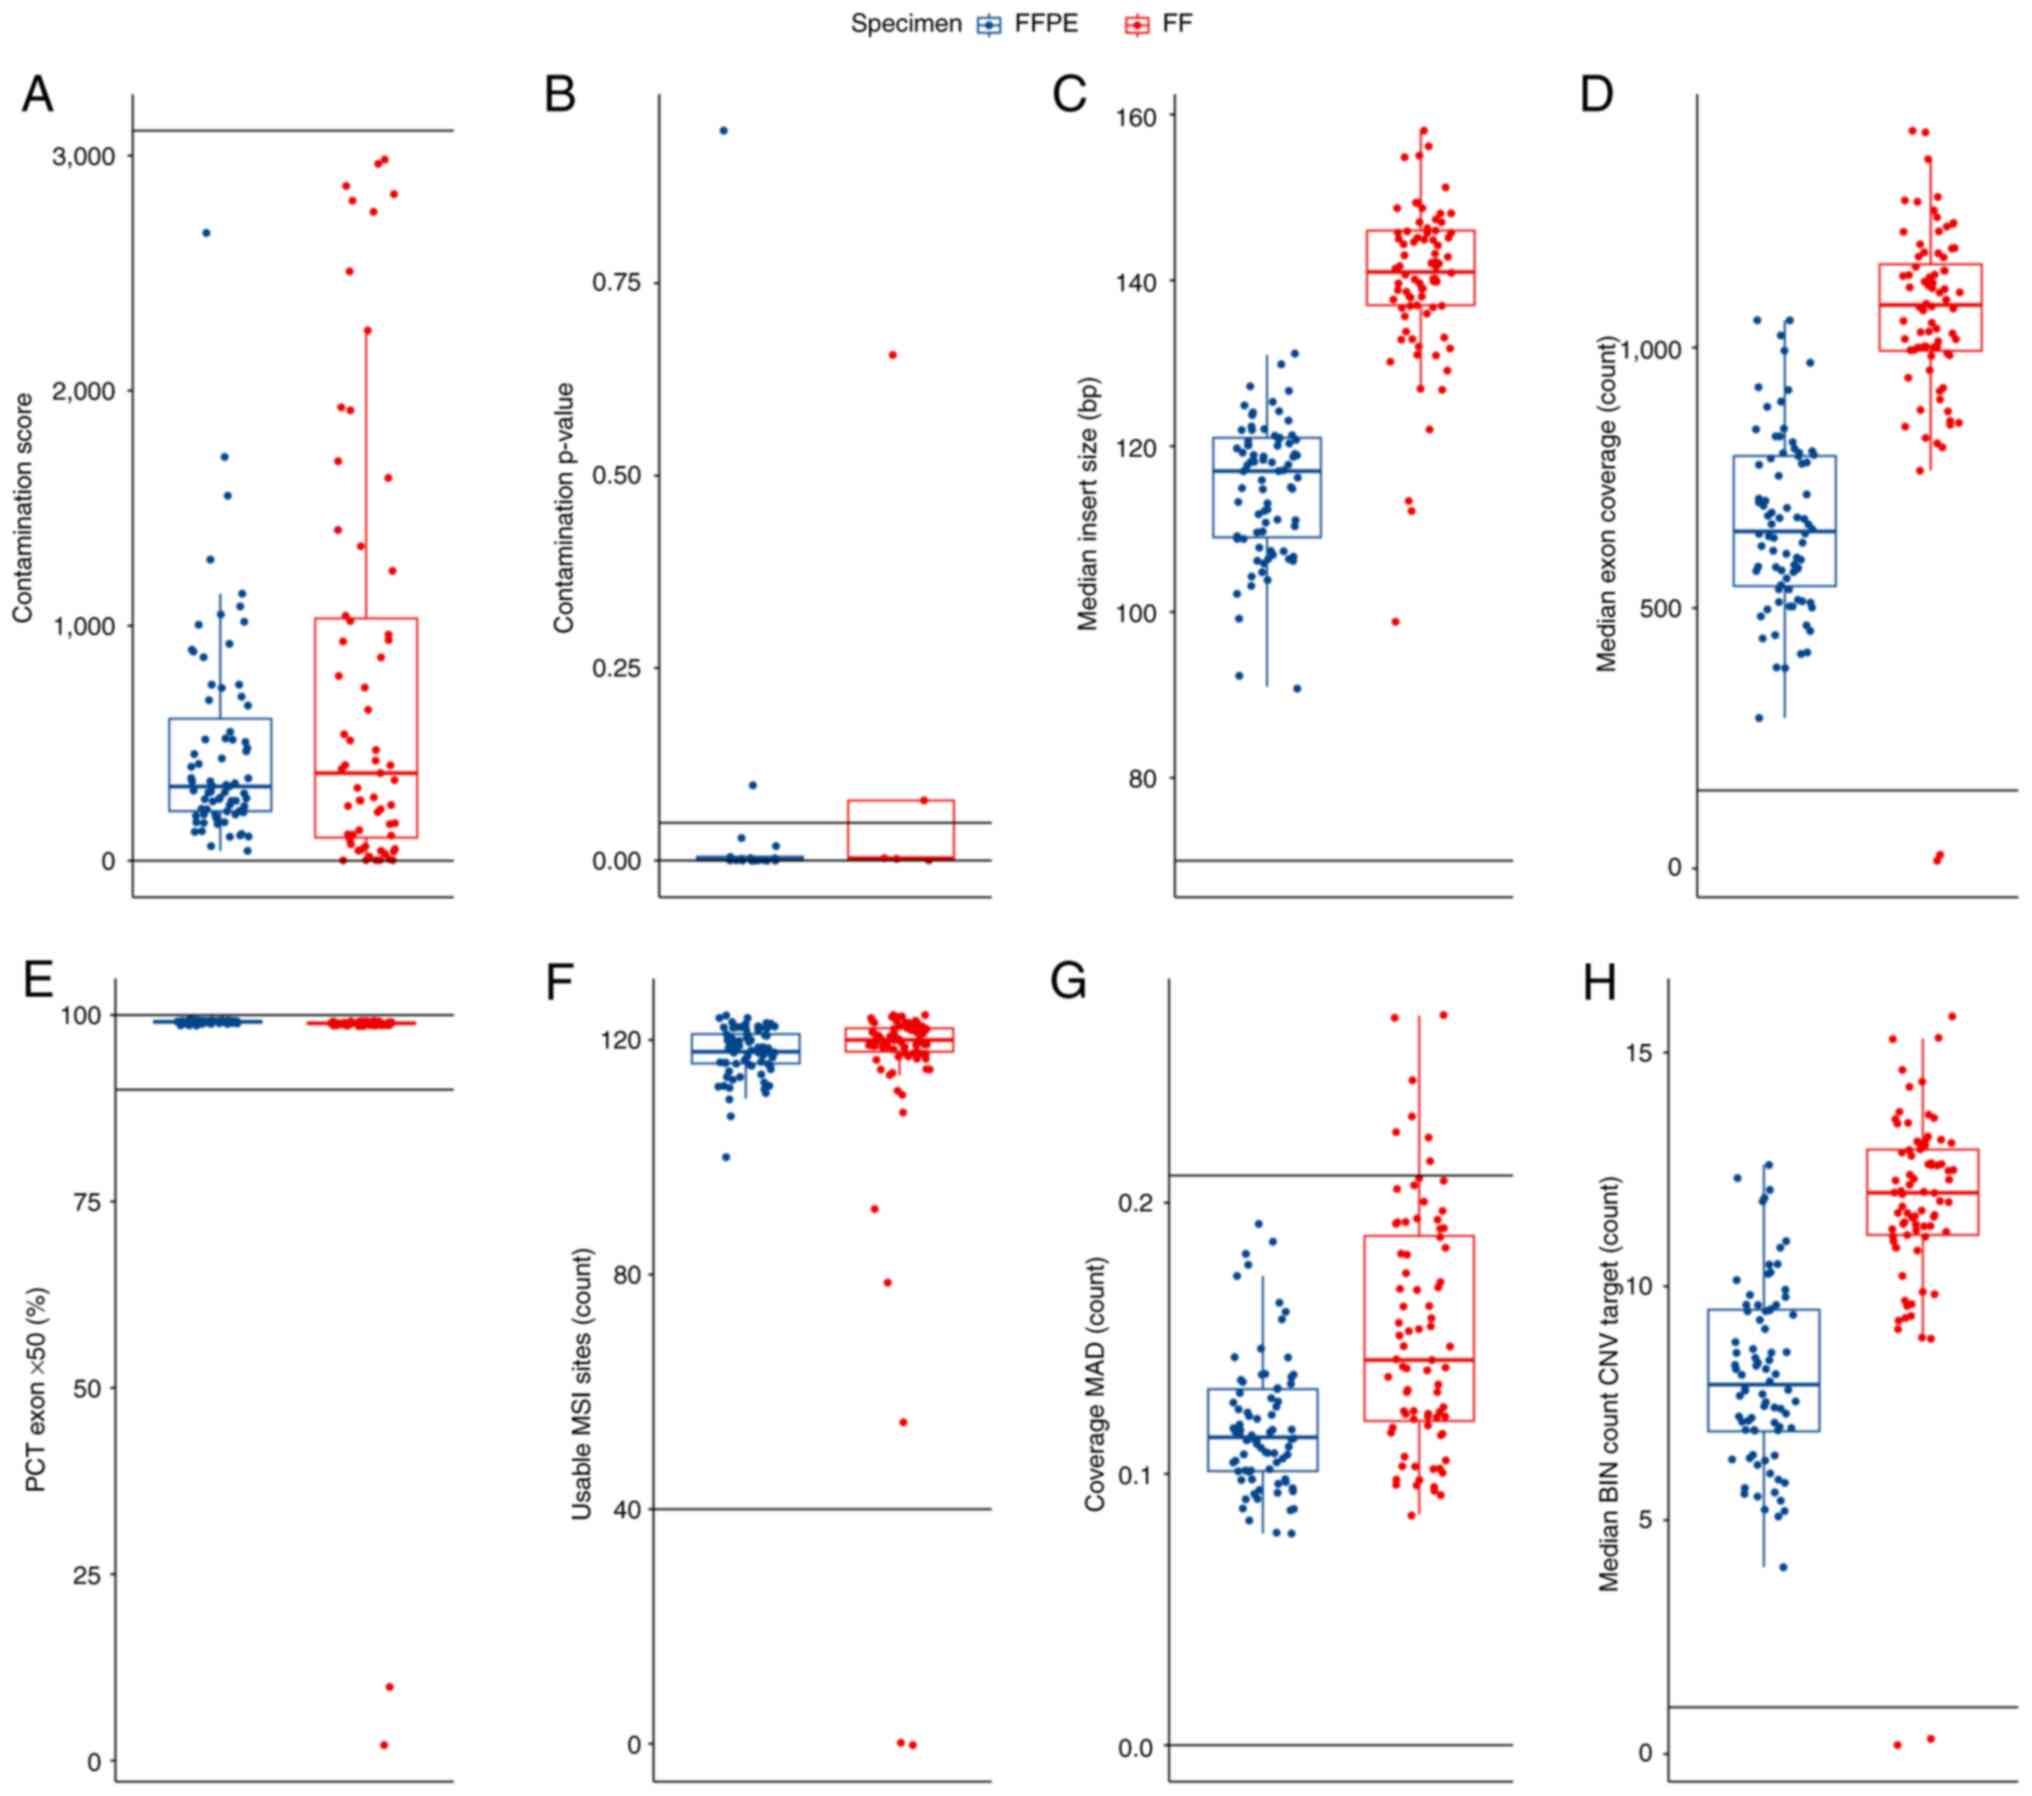 | Figure 2Quality control DNA metrics for the 80
patient samples from the present study that were sequenced. The
data are visualized by boxplot overlaid with swarmplot. In each
panel, the cut-offs delineating the range of acceptable values are
plotted as horizontal lines and the values of the metrics for FFPE
(blue) and FF (red) tissues are presented. (A) Contamination score
of the subset of samples with a value <3106. (B) Contamination
P-values for the samples with a contamination score >3106. (C)
Median insert size. (D) Median exon coverage. (E) PCT exon 50X. (F)
Usable MSI sites. (G) Coverage MAD. (H) Median BIN count CNV
target. The boxplot displays several key statistical measures: The
horizontal line within the box indicates the median (Q2) of the
dataset. The lower and upper edges of the box represent Q1 and Q3,
respectively, encompassing the IQR which contains the central 50%
of the data. The whiskers extend from the box to show variability
outside this range, typically reaching up to 1.5 times the IQR from
Q1 and Q3, while any points beyond this range are plotted as
outliers. FFPE, formalin-fixed paraffin-embedded; FF, fresh frozen;
MAD, median absolute deviation; MSI, microsatellite instability;
PCT, percent; CNV, copy number variation; BIN, interval or region
of the genome into which sequencing data is grouped for analysis;
IQR, interquartile range; Q1, first quartile; Q3, third
quartile. |
For a contaminated sample, both the contamination
score value (3,106) and the contamination P-value (0.005) will be
above their respective thresholds. Based on these values, 2 FFPE
and 2 FF samples were identified as high-risk contaminated samples
and were excluded from further analysis. The QC DNA metrics
parameters low median exon coverage and higher coverage MAD were
also monitored and resulted in the exclusion of 4 additional FF
samples. In summary, based on QC DNA metrics, 8 samples were
excluded (2 FFPE and 6 FF samples) from the analysed set. The
evaluation of QC RNA metrics was then performed.
RNA libraries were evaluated using the values of the
median coefficient of variation of the gene 500x, total target
reads and median insert size. A total of 2 FF samples did not meet
the required number of total on-target reads and 1 FFPE sample did
not exceed the required value for median insert size (Fig. 3).
 | Figure 3Quality control RNA metrics for the 80
patient samples from the present study that were sequenced. The
data are visualized by boxplot overlaid with swarmplot. In each
panel, the cut-offs delineating the range of acceptable values are
plotted as horizontal lines and the values of the metrics for FFPE
(blue) and FF (red) tissues are presented. (A) Median coefficient
of variation of gene 500x, (B) Total on-target reads. (C) Median
insert size. The boxplot displays several key statistical measures:
The horizontal line within the box indicates the median (Q2) of the
dataset. The lower and upper edges of the box represent Q1 and Q3,
respectively, encompassing the IQR which contains the central 50%
of the data. The whiskers extend from the box to show variability
outside this range, typically reaching up to 1.5 times the IQR from
Q1 and Q3, while any points beyond this range are plotted as
outliers. FFPE, formalin-fixed paraffin-embedded; FF, fresh frozen;
IQR, interquartile range; Q1, first quartile; Q3, third quartile;
Q2, median. |
To facilitate a comprehensive comparison of all
monitored parameters and findings across DNA and RNA analyses, only
samples that met all QC values for both DNA and RNA in both FFPE
and FF samples were included for the final comparisons. Through
this selection process, 11 patients were excluded from the initial
set of 80 patients. Therefore, 69 paired samples (23 BC, 22 CRC and
24 LC samples) that passed the filters were included in the
analysis. These 138 samples (69 pairs) were analysed for small
variants, MSI, TMB, fusions, splice variants and CNVs using the TSO
500 panel, with data processed through the Illumina TruSight
Oncology Local App pipeline (version 2.2) and PierianDx CGW. The
median values of QC DNA and RNA metrics, values of recommended
thresholds and P-values from the two-sample paired Wilcoxon test
for samples that passed QC were analysed (Table I). Significantly increased values
for most observed parameters in FF samples were observed, except
for DNA usable MSI sites, RNA total on-target reads and RNA median
insert size. Notably, the DNA median insert size, DNA median exon
coverage and RNA median CV gene 500x indicated higher quality for
both DNA and RNA extracted from FF tissue compared with FFPE
samples.
 | Table IMedian quality control values from
Appendix B of the Illumina Local Run Manager TruSight Oncology
Comprehensive (EU) Analysis Module Workflow Guide (document no.
200008661; version 3; published July 2022). |
Table I
Median quality control values from
Appendix B of the Illumina Local Run Manager TruSight Oncology
Comprehensive (EU) Analysis Module Workflow Guide (document no.
200008661; version 3; published July 2022).
| Characteristic | FFPE, median | FF, median | Recommended
threshold | P-value |
|---|
| DNA contamination
score | 299 | 538 |
0.000-3,106.000 | 0.003 |
| DNA contamination
P-value | 1 | 1 | 0.000-0.049 | <0.001 |
| DNA median insert
size | 118 | 140 | ≥70.000 | <0.001 |
| DNA median exon
coverage | 651 | 1,075 | ≥150.000 | <0.001 |
| DNA percentage exon
50x, % | 99.1 | 98.9 | 90.000-100.000 | <0.001 |
| DNA usable
microsatellite instability sites | 118 | 120 | ≥40.000 | 0.049 |
| DNA coverage median
absolute deviation | 0.11 | 0.14 | 0.000-0.210 | <0.001 |
| DNA median bin
count copy number variant target | 7.8 | 11.8 | ≥1.000 | <0.001 |
| RNA median
coefficient of variation gene 500x | 59.2 | 64.2 | 0.000-93.000 | <0.001 |
| RNA total on-target
reads | 17,895,298 | 18,146,831 |
>9,000,000.000 | 0.500 |
| RNA median insert
size | 114 | 115 | >80.000 | 0.030 |
Small variants
The TSO 500 pipeline enables the detection of small
variants, including SNVs, multi-nucleotide variants (MNVs) up to 3
bp in length and insertions and deletions up to 25 bp in length, in
most of the coding regions of 523 selected genes (20). In the present comparative study,
Tier IA and IB findings were focussed on, as reported by PierianDx
CGW, as these hold the highest diagnostic significance.
In 25 paired samples (36%; 3 BC, 10 LC and 2 CC
pairs) no small variants were detected in Tiers IA or IB. In the
remaining 44 pairs, a total of 133 Tier IA/IB variants were
identified (Fig. 4). A complete
list of detected small variants can be found in the supplementary
file (https://data.mendeley.com/datasets/pw4h7zwvzz/1). A
total of 130 variants were detected in FFPE and paired FF samples.
The discordant cases consisted of 2 FFPE+, FF- and 1 FFPE-, FF+
variants, where + indicates the presence of the variant, and -
indicates the absence of the variant (Fig. 5). In general, longer insert sizes
make it easier for software algorithms to align reads. Therefore,
longer DNA and RNA insert sizes are often correlated with better
performance, mainly due to higher coverage. In the present sample
set, significantly longer DNA insert sizes for FF samples were
observed compared with FFPE samples, with an average of 118 bp for
FFPE and 140 bp for FF samples. This indicated higher quality
inputs from FF samples, as sample quality is a key determinant of
final insert sizes. When high- and low-quality inputs are processed
in parallel, they yield libraries with higher and lower
performance, respectively. However, it was demonstrated that the
TSO 500 assay effectively identified small variants with a high
concordance of 97.7% (130/133) for both FFPE and FF samples,
regardless of the difference in the DNA median insert size.
For a comprehensive evaluation of the performance of
the TSO 500 assay, VAF and depth values were analysed, which are
crucial for identifying small variants (Table II). These results demonstrated
significantly increased values for both VAF and depth parameters in
FF samples across all analysed cancer types compared with FFPE
samples.
| Table IIDescriptive statistics and P-values
of VAF and sequencing depth for small variants in tiers IA and IB,
which are present in both FFPE and FF samples. |
Table II
Descriptive statistics and P-values
of VAF and sequencing depth for small variants in tiers IA and IB,
which are present in both FFPE and FF samples.
| A, Breast
carcinoma |
|---|
| Characteristic | FFPE | FF | P-value |
|---|
| Number of variants,
n | 11 | 11 | - |
| VAF, median %
(IQR) | 20 (18, 29) | 39 (33, 53) | <0.001 |
| Depth, median x
(IQR) | 810 (602,
1,025) | 1,054 (819,
1,144) | 0.042 |
| B, Colorectal
carcinoma |
| Characteristic | FFPE | FF | P-value |
| Number of variants,
n | 38 | 38 | - |
| VAF, median %
(IQR) | 27 (21, 35) | 40 (22, 60) | 0.009 |
| Depth, median x
(IQR) | 524 (432, 630) | 948 (787,
1,087) | <0.001 |
| C, Lung
carcinoma |
| Characteristic | FFPE | FF | P-value |
| Number of variants,
n | 14 | 14 | - |
| VAF, median %
(IQR) | 22 (19, 34) | 49 (28, 52) | 0.002 |
| Depth, median x
(IQR) | 616 (508, 910) | 1,188 (872,
1,404) | <0.001 |
| D, Overall |
| Characteristic | FFPE | FF | P-value |
| Number of variants,
n | 63 | 63 | - |
| VAF, median %
(IQR) | 26 (19, 34) | 41 (25, 58) | <0.001 |
| Depth, median x
(IQR) | 568 (452, 708) | 994 (807,
1,188) | <0.001 |
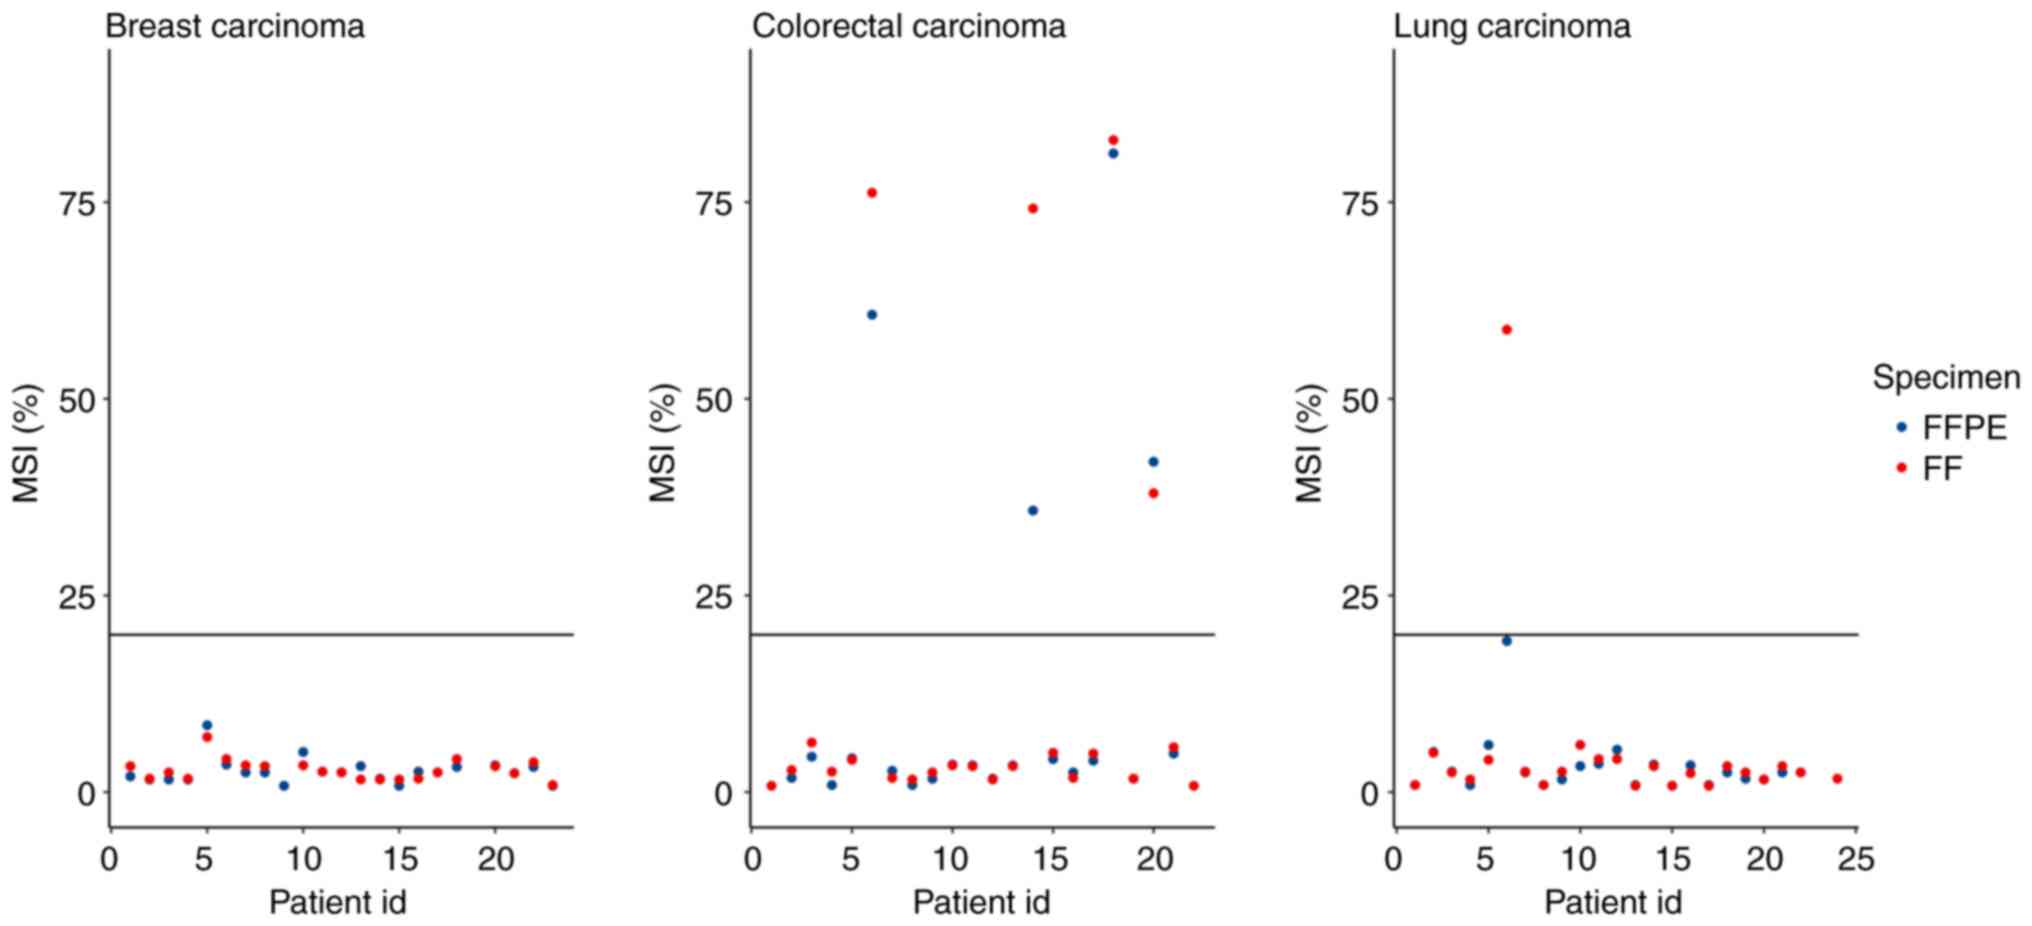
Microsatellite instability
To determine MSI status (MSI-stable vs. MSI-high),
130 homopolymer sites in the non-coding regions are monitored in
the TSO 500 panel. The final MSI score is calculated as the number
of unstable sites divided by the total number of usable sites,
which are sites with sufficient coverage. A sample is considered
MSI-high if its MSI score is ≥20.00% (20). MSI scores were compared for 63
pairs of samples, because the software was unable to determine the
MSI status for some samples and these pairs were subsequently
excluded. FFPE-, FF- accounted for 58 pairs, 0 pairs were FFPE+,
FF-, 1 pair was FFPE-, FF+ and 4 pairs were FFPE+, FF+, where ‘+’
indicated MSI-high status and ‘-’ indicated MSI-stable status
(Fig. 6). All FFPE+,FF+ samples
were CRC, which was consistent with the occurrence of MSI-high
cases in a previously published report (21). The FFPE-,FF+ discordant pair was
from LC samples with 19.2% MSI unstable sites, which was just below
the 20% MSI cut-off point. The concordance of MSI status between
FFPE and FF samples was 98.4%.
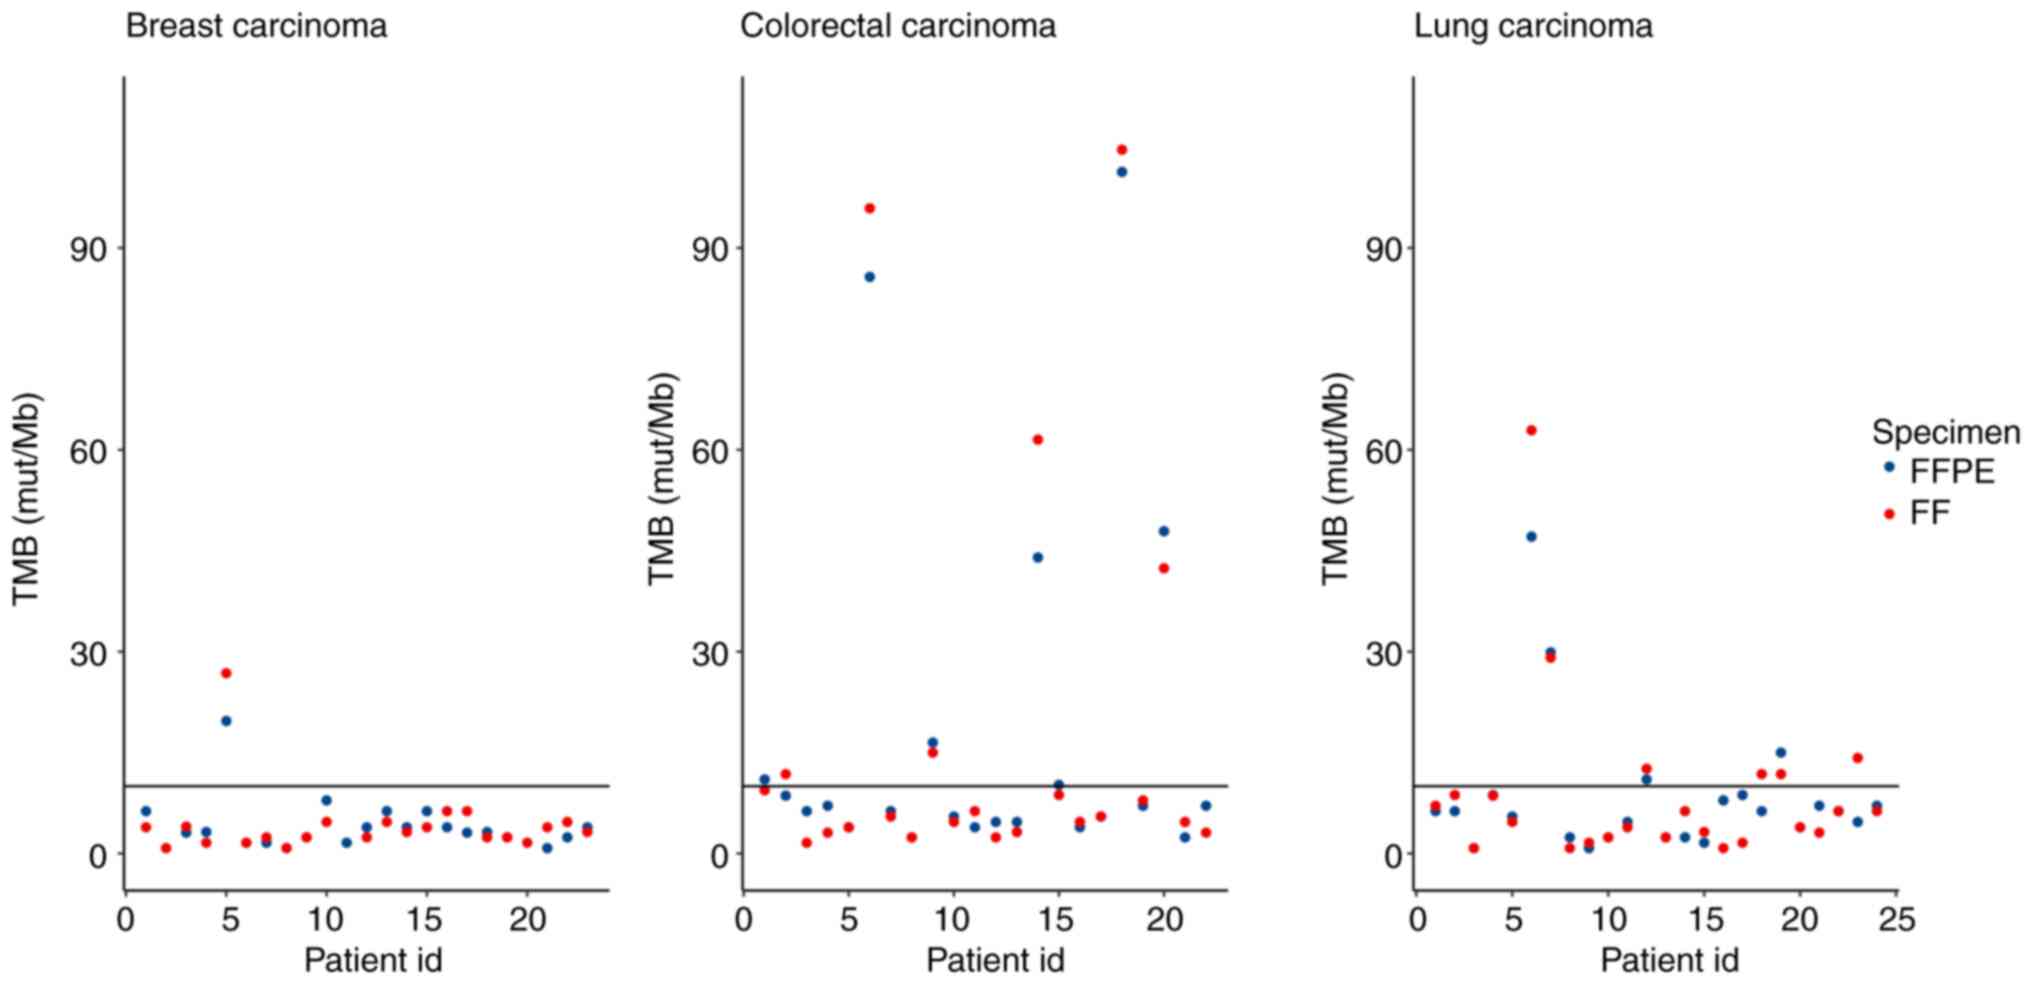
Tumour mutational burden
The TMB score was generated from the gVCF files
based on small variant calling, which included analysis of SNVs,
insertions and deletions with VAF >5%. A crucial step in this
process is the removal of variants with >50 COSMIC annotations
from the analysis. These hotspot mutations, which are under
positive selection during cancer progression, have the potential to
skew the TMB score generated by the TSO 500 pipeline (20). In summary, TMB values were returned
by LocalApp for 66 paired samples with the following results: 51
FFPE-, FF-, 3 FFPE-, FF+, 2 FFPE+, FF- and 10 FFPE+, FF+ pairs,
where ‘+’ indicated TMB high status, and ‘-’ indicated TMB low
status (Fig. 7). Almost all the
discordant samples had TMB values near the cut-off (range,
8.6-9.4), except 1 LC sample which was FFPE-, FF+ with a TMB value
of 4.7, which indicated a high degree of concordance between the
FFPE and FF samples (92.4%).
Fusions
For fusion calling, unique reads were used, with ≥5
unique supporting reads required to filter for high-confidence
variants. ‘Min supporting reads’ was defined as five for samples
with <26 million reads, with an additional read required for
every 10 million reads >16 million. This was performed to
prevent false positives in very high-depth samples (20). In the present sample set, the
following types of fusions were identified from Tiers IA and IB:
ESR1-CCND1, ESR1-HFM1, KIF5B-RET and
EML4-ALK. Of these, 1 pair of samples was FFPE+, FF-, 2
pairs were FFPE+, FF+ and 1 pair was FFPE-, FF+, (concordance 50%),
where ‘+’ indicated the presence of the fusion, and ‘-’ indicated
the absence of the fusion. Due to the low number of detected
fusions, the present analysis subsequently focused on identified
fusions highlighted by PierianDx CGW (including Tiers IIC and IID).
This approach allowed us to determine the concordance more
accurately. A total of three additional types of fusion that
belonged to Tier IIC or IID (EWSR1-BEND2,
RPS6KB1-VMP1 and GPR107-JAK2), with 1 pair of samples
recorded as FFPE-, FF+ and 2 pairs as FFPE+, FF+, which confirmed
the trend of analysis of fusion from Tiers IA and IB.
Splice variants
The analysis of splice variants using TSO 500
focused on the following three variant types: MET Exon 14 skipping,
EGFRvIII and ARv7. A splice variant is detected if it is supported
by at ≥24 reads (20). A total of
two types of splice variants were found in Tiers IA and IB: In gene
AR (n=4, all in BC samples) and one in MET in an LC sample. All
findings belonged to discordant samples: 2 samples were FFPE+,FF-
and 3 samples were FFPE-, FF+, where ‘+’ indicated the presence of
the splice variant and ‘-’ indicated the absence of the splice
variant. These results suggested a lack of concordance in the
detection of clinically relevant splice variants in the present
sample set.
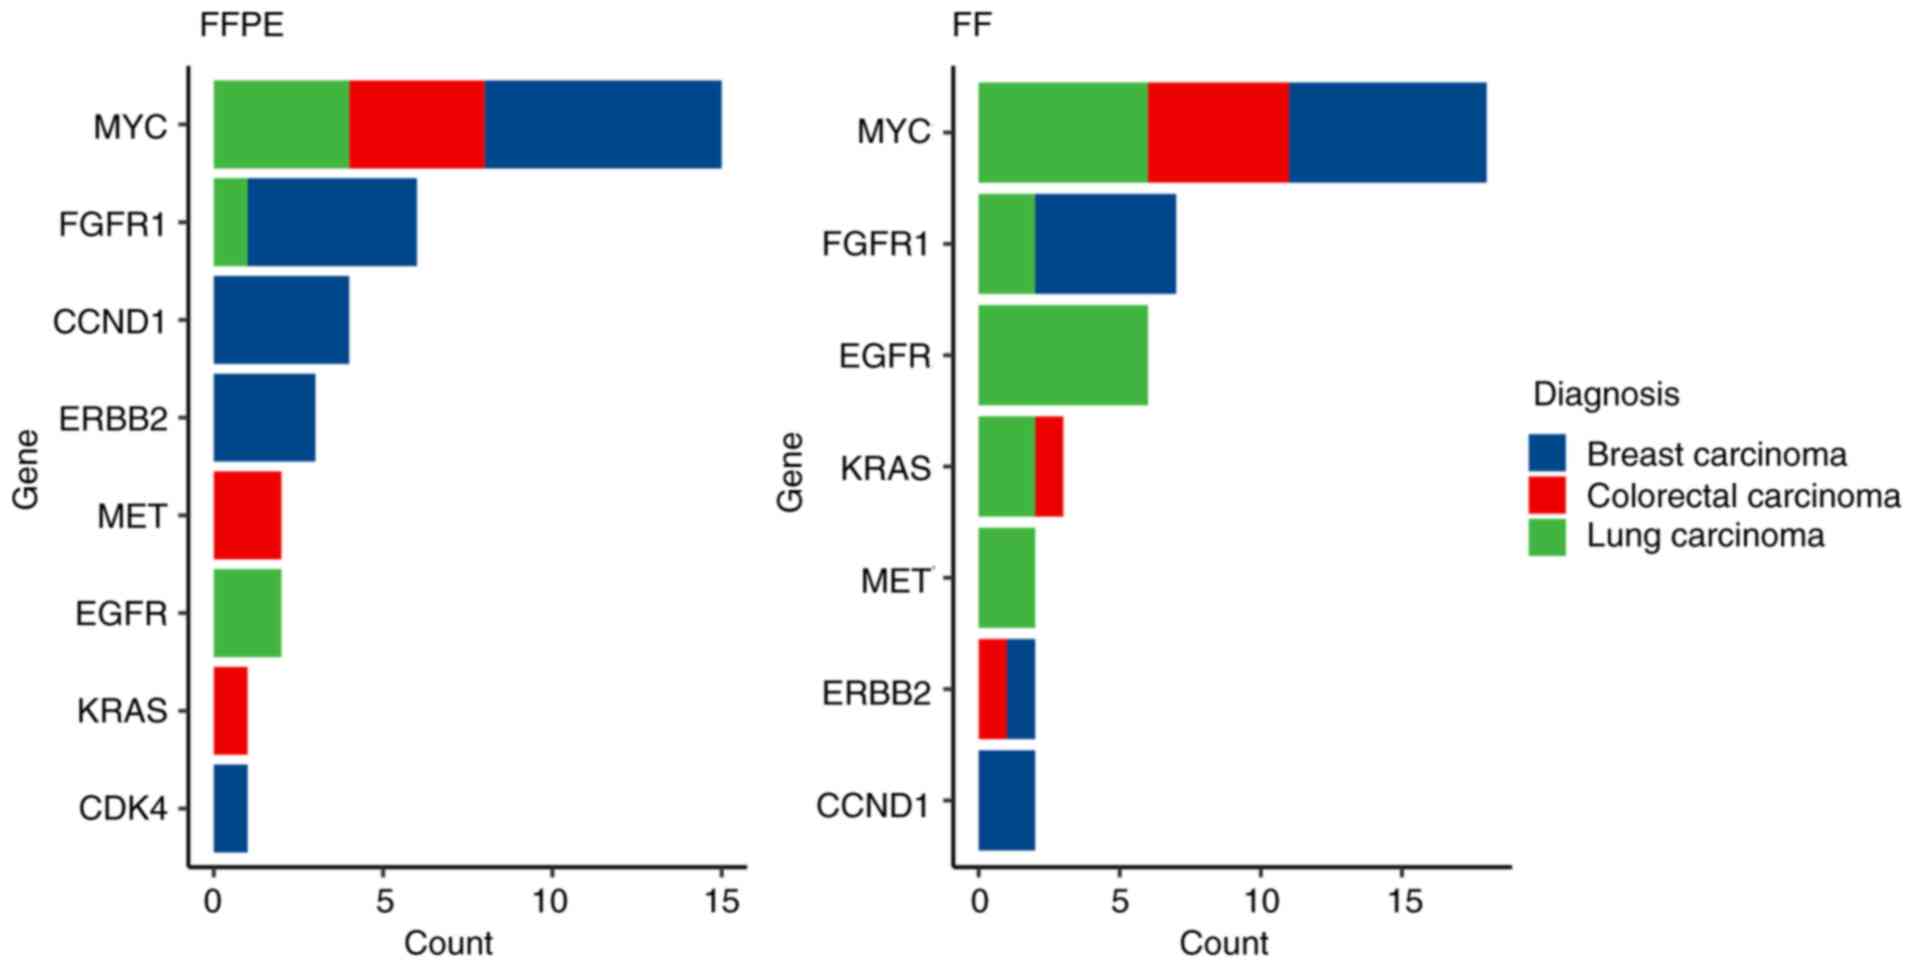
Copy number variations
A total of 59 genes were analysed for CNV calling in
the TSO 500 panel. The amplification and deletion limit of
detection was a 2.2- and 0.5-fold increase and decrease,
respectively. Each gene exhibits a unique noise profile,
necessitating specific thresholds for calling amplifications and
deletions (20). In the first
phase of CNV analysis, CNVs from Tiers IA and IB were analysed. Out
of the total number of detected clinically relevant CNVs (n=74),
all were amplifications (Fig. 8).
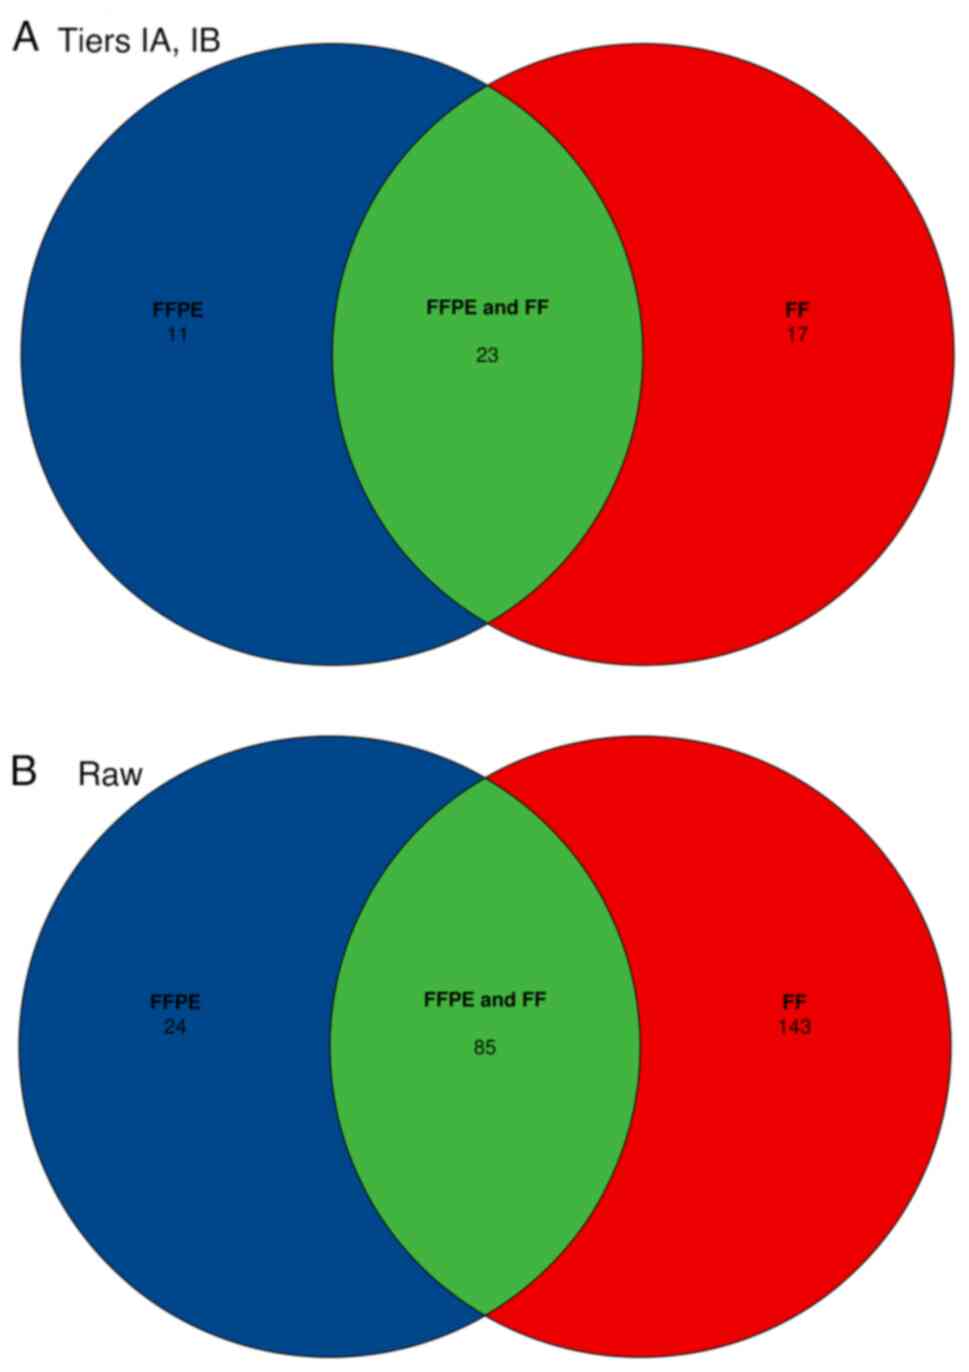
A total of 11 CNVs were in FFPE+, FF- discordant samples, and 17
CNVs were in FFPE-, FF+ discordant samples (Fig. 9A). This represented 62.2%
concordance in the identification of the aforementioned types of
CNVs. Due to the fixed frame of analysis for CNVs per sample, all
CNVs were analysed across the 59 genes (Fig. 9B). A total of 337 amplifications
were detected, which included discordant CNVs and FFPE+, FF- (n=24)
and FFPE-, FF+ (n=143) samples. The remaining amplifications
(n=170) were found in both paired FFPE and FF samples (overall
concordance 50.4%). The counts of the four combinations of
agreement/disagreement between FC of CNVs in FFPE vs. FF for all 69
paired samples were measured (Fig.
10). A different cut-off of the FC was applied for each gene,
following the recommendations of the kit manufacturer. The four
combinations analysed together were FFPE-, FF+, FFPE+, FF+, FFPE+,
FF- and FFPE-, FF-, where ‘+’ indicated that the FC was above the
cut-off, and ‘-’ indicated that it was below the cut-off value.
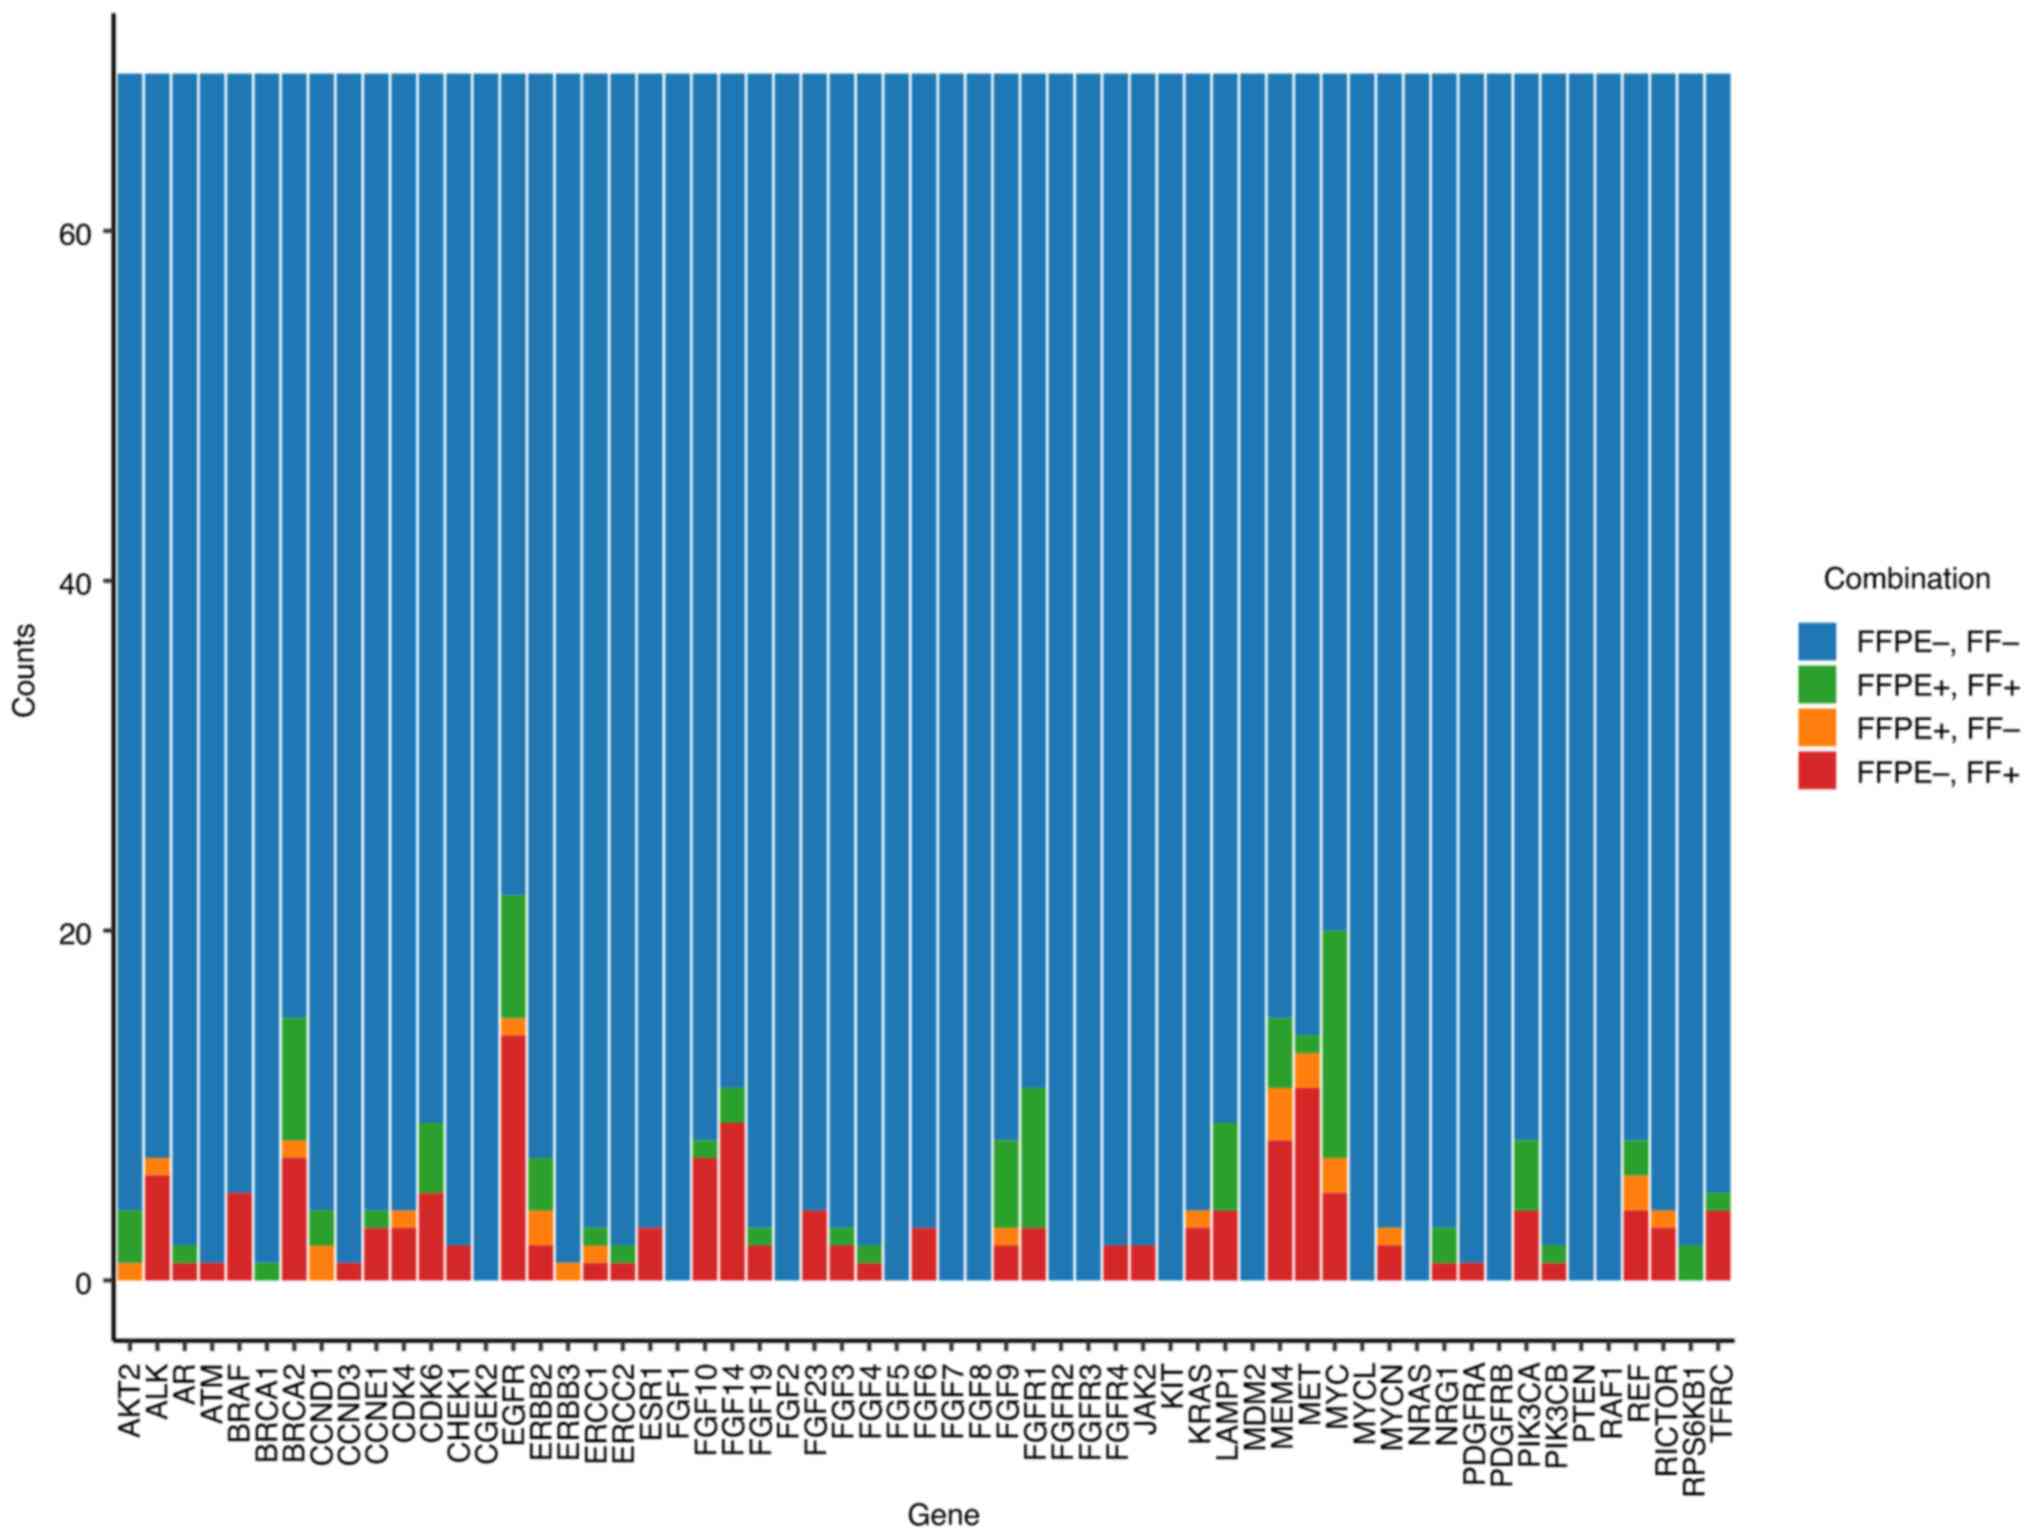 | Figure 10Bar plot of the counts of the four
combinations of agreement and disagreement between the FC of CNVs
in FFPE and FF tissues for 59 genes from TSO 500 and all CNVs from
the 69 pairs of patient samples. For each gene, a different cut-off
on FC was applied. The four combinations are FFPE-, FF- (n=3819),
FFPE+, FF+ (n=85), FFPE+, FF- (n=24) and FFPE-, FF+ (n=143); where
- indicates that FC was under the cut-off and + indicates that FC
was above the cut-off. CNV, copy number variation; FFPE,
formalin-fixed paraffin-embedded; FF, fresh frozen; FC,
fold-count. |
Concordance of raw CNV findings in
paired FFPE and FF samples
To investigate the bias in FC values between FFPE
and FF (or vice versa) from raw findings obtained by LocalApp, four
patient subsets were considered. The subsets (i1-i4) were
identified for each gene, and all patients and genes in each subset
were then analysed together. The data were visualised using boxplot
overlaid with swarmplot (Fig.
11). The median FC in FFPE, median FC in FF, median of paired
differences (FFPE vs. FF) and the P-value from Wilcoxon's paired
test for the four subsets were analysed (Table III). The observed median of the
paired differences (FFPE vs. FF) of FC for subsets i1, i2, i3 and
i4 were -0.022, 0.386, -0.389 and -0.245, respectively. In all four
cases, P<0.0001. Subsets i2 and i3 showed a nearly identical
levels of differences between the FC in FFPE and FF, which was
0.368 and -0.389, respectively. In subsets i1, i3 and i4, the
median of the paired differences (FFPE vs. FF) of FC values was
negative, indicating a systematic occurrence of higher FC values in
FF samples.
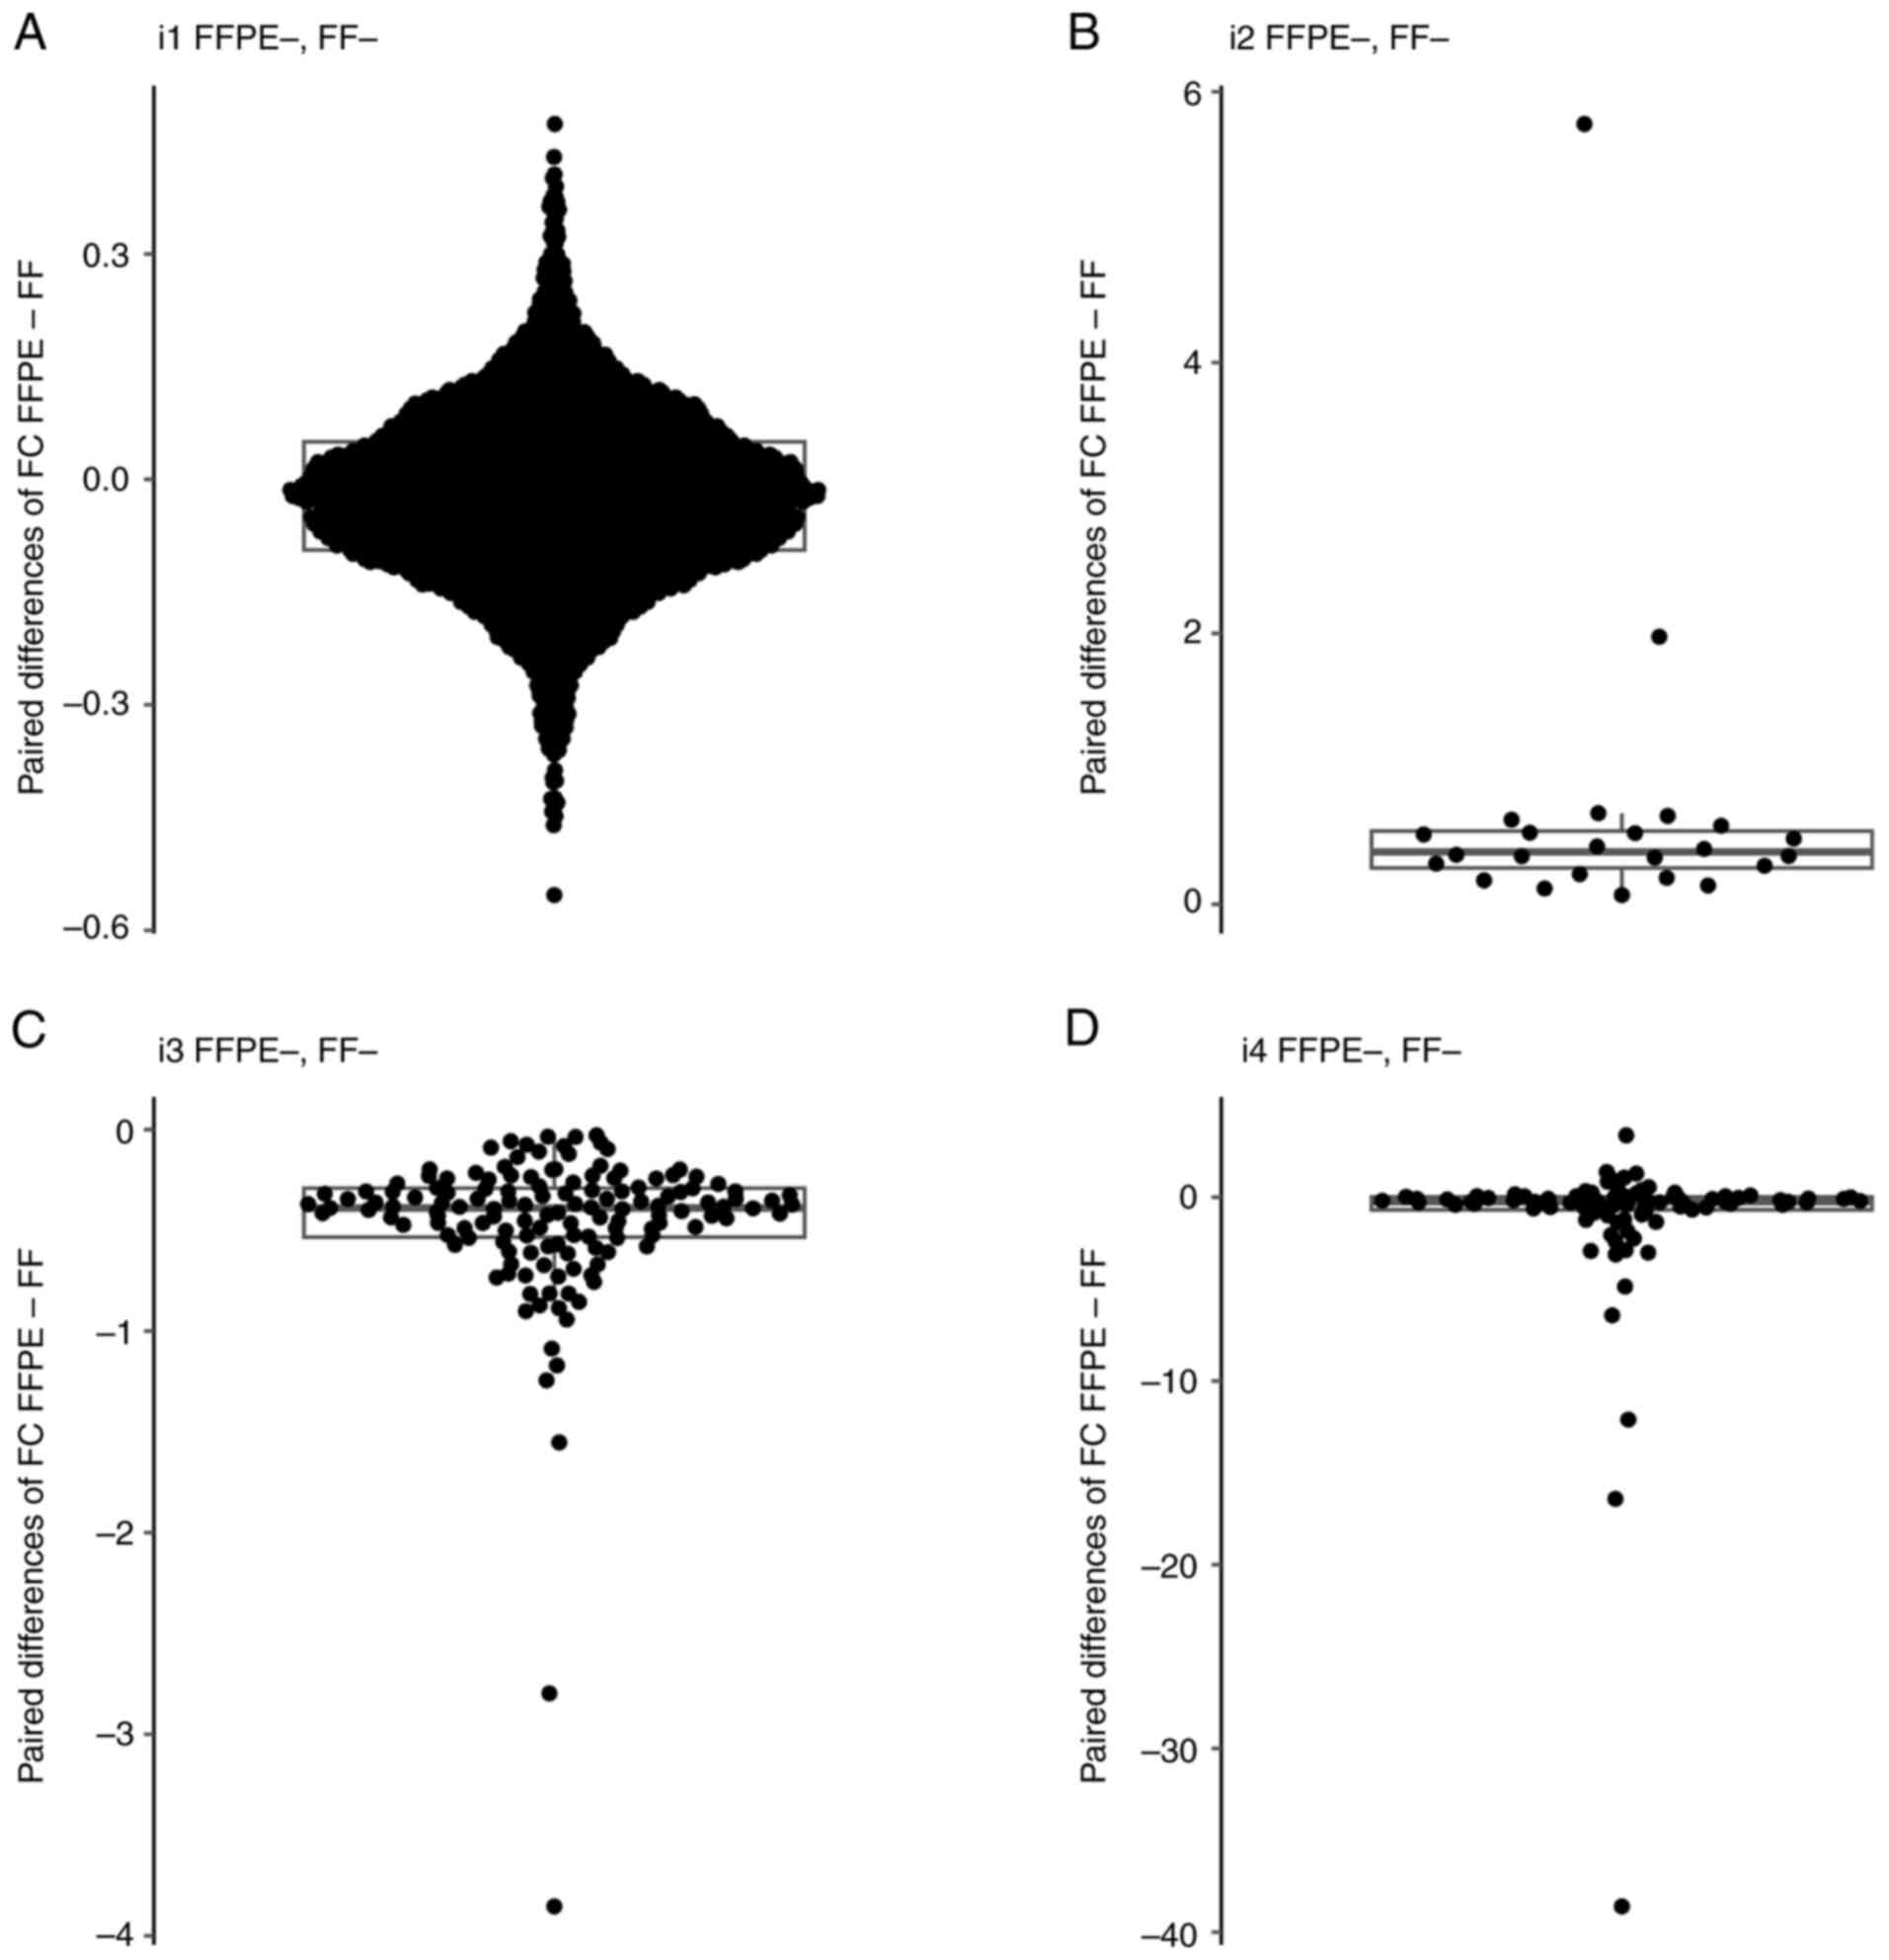 | Figure 11Boxpolots of FC values. (A) Boxplot
overlaid with swarm plot of paired difference of FC values
(FFPE-FF) for the patients and genes in subset i1. (B) Boxplot
overlaid with swarm plot of paired difference of FC values
(FFPE-FF) for the patients and genes in subset i2. (C) Boxplot
overlaid with swarm plot of paired difference of FC values
(FFPE-FF) for the patients and genes in subset i3. (D) Boxplot
overlaid with swarm plot of paired difference of FC values (FFPE-
FF) for the patients and genes in subset i4. The boxplot displays
several key statistical measures: The horizontal line within the
box indicates the median (Q2) of the dataset. The lower and upper
edges of the box represent Q1 and Q3, respectively, encompassing
the IQR, which contains the central 50% of the data. The whiskers
extend from the box to show variability outside this range,
typically reaching up to 1.5 times the IQR from Q1 and Q3, while
any points beyond this range are plotted as outliers. FFPE,
formalin-fixed paraffin-embedded; FF, fresh frozen; FC, fold
change; IQR, interquartile range; Q1, first quartile; Q3, third
quartile; Q2, median. |
| Table IIIPaired comparisons of FC in all four
combinations of CNV findings. |
Table III
Paired comparisons of FC in all four
combinations of CNV findings.
| Type of CNV
finding | Median FC in
FFPE | Median FC in
FF | Median paired
difference (FFPE-FF) | P-value |
|---|
| FFPE-, FF- | 0.989 | 1.016 | -0.022 | <0.0001 |
| FFPE+, FF- | 1.57 | 1.232 | 0.386 | <0.0001 |
| FFPE-, FF+ | 1.203 | 1.564 | -0.389 | <0.0001 |
| FFPE+, FF+ | 1.692 | 1.876 | -0.245 | <0.0001 |
Discussion
The present study focused on a comprehensive
comparison of NGS quality metrics and concordance in the detection
of clinically relevant variants (small variants, indels, splice
variants, TMB, MSI and CNVs) using TSO 500 in paired FFPE and FF
samples. The TSO 500 assay was designed to analyse nucleic acids
(NAs) extracted from FFPE samples at varying quantities and
qualities, while maintaining acceptable sensitivity and specificity
values. However, the extracted NAs, particularly RNA, were not
always of sufficient quality. The present study reported up to 20
FFPE samples that did not meet the required quality parameters of
NAs. Once the quality parameters are met, the success rate in
preparing high-quality libraries using the TSO 500 assay is
typically high as shown by several scientific teams that utilised a
broader range of tissue types for the genomic profiling of tumours
(6,22-25).
These reports also suggest that non-FFPE tissue is a potential
primary source of genetic information for diagnostics; however,
detailed analyses describing the performance of NGS panels, such as
the TSO 500 assay in paired FFPE vs. FF tumour samples, are
currently lacking. The present study aimed to provide further
insight into this matter by comprehensively comparing all relevant
parameters.
The TSO 500 is a hybrid capture NGS panel that
requires a higher quantity and quality of NAs compared with smaller
amplicon-based panels. Based on our pilot testing phase and the
manufacturer's recommendations, only analysed DNA samples with a
∆Cq ≤5 and an input quantity of 70 ng were analysed. RNA samples
were required to meet DV200≥30% and an input quantity of
80 ng. A total of 20/100 archived FFPE samples did not meet the
required criteria and were excluded, along with their corresponding
FF samples. The remaining samples were subsequently used for
library preparation. The sequenced libraries were then evaluated
based on parameters defined by the manufacturer of the TSO 500
assay. A total of 3 FFPE samples and 8 FF samples failed to meet at
least one of the required parameters and were therefore excluded
from further analyses. As a result, 69 paired samples, which passed
all quality criteria (23 BC, 22 CC and 24 LC sample pairs) were
subjected to analysis of the concordance between FFPE and FF.
The values of DNA median insert size (118 vs. 140
bp), DNA median exon coverage (651 vs. 1,075) and RNA median CV
gene 500x (59.2 vs. 64.2%) indicated a higher quality of NAs
extracted from FF tissue compared with that from FFPE tissues.
Similar results have been published in a previous study where TSO
500 libraries were prepared from FFPE and non-FFPE samples
(6).
For the detection of small variants, MSI, TMB,
fusions, splice variants and CNVs using the TSO500 panel, the
Illumina TruSight Oncology Local App pipeline (version 2.2) was
utilised. The results were subsequently annotated using the
PierianDx CGW, which classified small variants, fusions, splice
variants and CNVs into tiers. No small variants from Tier IA or IB
were detected in 25 pairs of samples (36%) (6 BC, 3 LC and 2 CC
samples), which aligned with previous analyses by Ottestad et
al (4) who reported that 37%
of samples exhibited no detectable mutations in the analysed genes.
In the remaining 44 samples, 133 small variants were identified,
with 130 occurring in pairs and 3 classified as discordant
findings. The results demonstrated a high concordance value of
97.7%. For a more comprehensive analysis of small variant results,
VAF and depth values were examined with respect to the type of
tissue used. The depth value was significantly higher in FF samples
compared with FFPE samples, 568 vs. 994x, respectively, which was
related to the higher quality of the input material. The quality of
the material also correlated closely with the VAF value, which
reached almost double in FF samples, 26 vs. 41%. This is because
algorithms investigating the input data can more efficiently align
reads, thereby obtaining a larger set of sequences supporting
variant presence and achieving higher test sensitivity. The
detection capability of TSO 500 of small variants was not affected
in the case of analysing samples with a portion of TCs >20%.
However, if lower-quality samples with a low proportion of
neoplastic cells are used, the advantage of FF samples may be more
apparent. Additional important genomic biomarkers used to identify
patients who may benefit from immune checkpoint inhibitor treatment
are MSI and TMB. High concordance rates were observed for MSI and
TMB, with values of 98.4 and 92.4%, respectively. Additionally,
most of the discordant samples identified in the TMB analysis were
very close to the cut-off value.
A different outcome was observed with the detection
of fusions and splice variants. PierianDx CGW reported a total of
four fusions and five splice variants in Tiers IA and IB. Half of
the samples were evaluated as discordant for fusions, and no
concordance was observed for splice variants. This could
potentially be attributed to the small number of identified
variants. However, even when all findings were analysed, including
the variants from raw findings returned by LocalApp, the results
did not differ substantially.
Within the present sample cohort, no whole-gene
deletions were detected. All the identified CNVs were
amplifications; however, lower concordance rates were observed.
Specifically, a 62.2% concordance for clinically relevant CNVs was
observed from Tiers IA and IB and 50.4% concordance for all
identified CNVs. Giacò et al (1) reported an issue with CNV detection
when using TSO 500. One of the suggested reasons for the
insufficient detection was that the Illumina LocalApp algorithm is
designed for whole-gene analysis and not for exon-level resolution,
which is particularly important for the BRCA1/2 genes. In the case
of BRCA1/2, CNVs also occur at the exon level, not on the whole
gene, which makes it more difficult or even impossible to detect
them using the TSO 500 assay. The study also encountered
coverage-related issues that could impact the detection of small
variants and CNV identification. Similar to previous studies
focusing on whole-exome sequencing (26,27),
Giacò et al observed that low and nonuniform coverage can
compromise the ability to detect this type of genetic variation.
The samples analysed in the present study met the quality criteria
that would indicate coverage-related issues. These parameters
included High Coverage_MAD values (>0.21), which could be due to
poor input DNA quality, poor enrichment during library preparation
or the use of non-FFPE samples and Low Median_BIN_COUNT_CNV_Target
values (<1.0), suggesting low coverage in target regions,
possibly due to poor sample quality, poor library preparation or
insufficient sequencing output (20). Although CNV calling in the Illumina
Local App using CRAFT (28) is
specifically validated for FFPE samples, effective CNV
identification should be achievable for all samples that meet the
aforementioned QC metrics.
To investigate the bias in paired FC values between
FFPE and FF (or vice versa) from raw findings obtained by LocalApp,
4 patient subsets were considered. The subsets i1 (FFPE-, FF-), i2
(FFPE+, FF-), i3 (FFPE-, FF+) and i4 (FFPE+, FF+) were identified
for each gene, and all patients and genes in each subset were
analysed together. In the case of discordant findings (i.e.,
subsets i2 and i3), almost identical medians of paired differences
in FC values between FFPE and FF samples were observed: 0.368 and
-0.389, respectively. In subsets i1, i3 and i4, the medians of
paired differences (FFPE minus FF) in FC values were negative,
indicating a systematic occurrence of higher FC values in FF
samples. Therefore, except for cases of CNVs in the FFPE+, FF-
subset, the FC values were systematically higher in FF samples
compared with those in FFPE samples. The present study was unable
determine whether the systematic bias was due to the algorithm for
CNV calling used in the LocalApp or if it reflected a genuine
difference related to the higher quality of input genetic material.
Repeated analysis of inconsistent results confirmed the previous
findings. To address this, it is therefore necessary to conduct
intra- and inter-laboratory validation of TSO 500 CNV detection in
FF samples on an alternative testing platform to rule out technical
issues. For example, methods such as array comparative genomic
hybridization, digital droplet PCR, or whole-genome sequencing
could be employed.
To the best of our knowledge, the present study is
the first to report the use of the TSO 500 assay in paired FFPE and
FF tumour tissue samples. Comparisons of NGS quality metrics and
the concordance in the detection of clinically relevant variants
were annotated using the Pierian Dx CGW. Based on these results, it
could be suggested that it is more advantageous to use FF tissues
to detect small variants and TMB and MSI biomarkers using the TSO
500 assay, thus reducing the number of no-calls due to low-quality
NAs. For cancer types where accurate detection of CNVs is critical,
intra- and inter-laboratory validation should be considered.
Acknowledgements
Not applicable.
Funding
Funding: This publication was created under the Operational
Programme Integrated Infrastructure for the project: Integrative
strategy in development of personalized medicine of selected
malignant tumours and its impact on quality of life (project code
ITMS 2014+, 313011V446), co-financed by the European Regional
Development Fund.
Availability of data and materials
The raw sequencing data can be found in the Sequence
Read Archive under accession number PRJNA1197108 or at the
following URL: https://www.ncbi.nlm.nih.gov/sra/PRJNA1197108.
Authors' contributions
ZD, MG, EH, DL and LP had substantial contributions
to the conception and design of the work. KT, KL, ZD, KB, EK, TR,
AD, JM, PM and MS processed the samples. DL and AH completed the
molecular analysis. MG, DL and AH analysed the data. DL, MG, AH, LP
and EH prepared the manuscript. DL and EH confirm the authenticity
of all the raw data. All authors read and approved the final
version of the manuscript.
Ethics approval and consent to
participate
Ethics approval for the study was obtained from the
Ethics Committee of the Jessenius Faculty of Medicine in Martin
(no. EK 79/2020; Martin, Slovakia). The study was performed in
accordance with the ethical standards as written in the 1964
Declaration of Helsinki and its later amendments.
Patient consent for publication
Not applicable.
Competing interests
The authors declare that they have no competing
interests.
References
|
1
|
Giacò L, Palluzzi F, Guido D, Nero C,
Giacomini F, Duranti S, Bria E, Tortora G, Cenci T, Martini M, et
al: A computational framework for comprehensive genomic profiling
in solid cancers: The analytical performance of a high-throughput
assay for small and copy number variants. Cancers (Basel).
14(6152)2022.PubMed/NCBI View Article : Google Scholar
|
|
2
|
Froyen G, Geerdens E, Berden S, Cruys B
and Maes B: Diagnostic validation of a comprehensive targeted panel
for broad mutational and biomarker analysis in solid tumors.
Cancers (Basel). 14(2457)2022.PubMed/NCBI View Article : Google Scholar
|
|
3
|
Conroy JM, Pabla S, Glenn ST, Seager RJ,
Van Roey E, Gao S, Burgher B, Andreas J, Giamo V, Mallon M, et al:
A scalable high-throughput targeted next-generation sequencing
assay for comprehensive genomic profiling of solid tumors. PLoS
One. 16(e0260089)2021.PubMed/NCBI View Article : Google Scholar
|
|
4
|
Ottestad AL, Huang M, Emdal EF, Mjelle R,
Skarpeteig V and Dai HY: Assessment of two commercial comprehensive
gene panels for personalized cancer treatment. J Pers Med.
13(42)2022.PubMed/NCBI View Article : Google Scholar
|
|
5
|
Pestinger V, Smith M, Sillo T, Findlay JM,
Laes JF, Martin G, Middleton G, Taniere P and Beggs AD: Use of an
integrated pan-cancer oncology enrichment next-generation
sequencing assay to measure tumour mutational burden and detect
clinically actionable variants. Mol Diagn Ther.
24(505)2020.PubMed/NCBI View Article : Google Scholar
|
|
6
|
Meireles SI, Cruz MV, de Godoy CD and de
Testagrossa L: Performance of non-formalin fixed paraffin embedded
samples in hybrid capture and amplicon next-generation sequencing
panels. Diagn Cytopathol. 52:171–182. 2024.PubMed/NCBI View
Article : Google Scholar
|
|
7
|
Betge J, Kerr G, Miersch T, Leible S,
Erdmann G, Galata CL, Zhan T, Gaiser T, Post S, Ebert MP, et al:
Amplicon sequencing of colorectal cancer: Variant calling in frozen
and formalin-fixed samples. PLoS One. 10(e0127146)2015.PubMed/NCBI View Article : Google Scholar
|
|
8
|
Robbe P, Popitsch N, Knight SJL, Antoniou
P, Becq J, He M, Kanapin A, Samsonova A, Vavoulis DV, Ross MT, et
al: Clinical whole-genome sequencing from routine formalin-fixed,
paraffin-embedded specimens: Pilot study for the 100,000 Genomes
Project. Genet Med. 20:1196–1205. 2018.PubMed/NCBI View Article : Google Scholar
|
|
9
|
De Paoli-Iseppi R, Johansson PA, Menzies
AM, Dias KR, Pupo GM, Kakavand H, Wilmott JS, Mann GJ, Hayward NK,
Dinger ME, et al: Comparison of whole-exome sequencing of matched
fresh and formalin fixed paraffin embedded melanoma tumours:
implications for clinical decision making. Pathology. 48:261–266.
2016.PubMed/NCBI View Article : Google Scholar
|
|
10
|
Kerick M, Isau M, Timmermann B, Sültmann
H, Herwig R, Krobitsch S, Schaefer G, Verdorfer I, Bartsch G,
Klocker H, et al: Targeted high throughput sequencing in clinical
cancer settings: Formaldehyde fixed-paraffin embedded (FFPE) tumor
tissues, input amount and tumor heterogeneity. BMC Med Genomics.
4(68)2011.PubMed/NCBI View Article : Google Scholar
|
|
11
|
Fielding DI, Dalley AJ, Singh M,
Nandakumar L, Lakis V, Chittoory H, Fairbairn D, Patch AM, Kazakoff
SH, Ferguson K, et al: Evaluating diff-quik cytology smears for
large-panel mutation testing in lung cancer-predicting DNA content
and success with low-malignant-cellularity samples. Cancer
Cytopathol. 131:373–382. 2023.PubMed/NCBI View Article : Google Scholar
|
|
12
|
R Core Team (2021) R: A language and
environment for statistical computing. R Foundation for Statistical
Computing, Vienna, 2021.
|
|
13
|
tabulizer: Bindings for Tabula PDF Table
Extractor Library. R package version 0.2.2.
|
|
14
|
Ooms J: The jsonlite Package: A practical
and consistent mapping between JSON data and R Objects 2014.
|
|
15
|
Iannone R and Roy O: DiagrammeR:
Graph/Network Visualization. 2024.
|
|
16
|
Iannone R: DiagrammeRsvg: Export
DiagrammeR Graphviz Graphs as SVG. 2016.
|
|
17
|
Ooms J and Brüggemann S: Render SVG images
into PDF, PNG, (Encapsulated) PostScript, or Bitmap Arrays
2023.
|
|
18
|
Larsson J, Godfrey AJR, Gustafsson P,
Eberly DH, Huber E and Privé F: Area-proportional euler and venn
diagrams with ellipses, 2024.
|
|
19
|
Knaus BJ and Grünwald NJ: vcfr: A package
to manipulate and visualize VCF format data in R. Mol Ecol Resour.
17:44–53. 2017.PubMed/NCBI View Article : Google Scholar
|
|
20
|
Local run manager trusight oncology
comprehensive (EU) analysis module. 2022.
|
|
21
|
Bonneville R, Krook MA, Kautto EA, Miya J,
Wing MR, Chen HZ, Reeser JW, Yu L and Roychowdhury S: Landscape of
microsatellite instability across 39 cancer types. JCO Precis
Oncol. 17(00073)2017.PubMed/NCBI View Article : Google Scholar
|
|
22
|
Baum JE, Zhang P, Hoda RS, Geraghty B,
Rennert H, Narula N and Fernandes HD: Accuracy of next-generation
sequencing for the identification of clinically relevant variants
in cytology smears in lung adenocarcinoma. Cancer Cytopathol.
125:398–406. 2017.PubMed/NCBI View Article : Google Scholar
|
|
23
|
Faber E, Grosu H, Sabir S, Lucas FAS,
Barkoh BA, Bassett RL, Luthra R, Stewart J and Roy-Chowdhuri S:
Adequacy of small biopsy and cytology specimens for comprehensive
genomic profiling of patients with non-small-cell lung cancer to
determine eligibility for immune checkpoint inhibitor and targeted
therapy. J Clin Pathol. 75:612–619. 2022.PubMed/NCBI View Article : Google Scholar
|
|
24
|
Ramani NS, Chen H, Broaddus RR, Lazar AJ,
Luthra R, Medeiros LJ, Patel KP, Rashid A, Routbort MJ, Stewart J,
et al: Utilization of cytology smears improves success rates of
RNA-based next-generation sequencing gene fusion assays for
clinically relevant predictive biomarkers. Cancer Cytopathol.
129:374–382. 2021.PubMed/NCBI View Article : Google Scholar
|
|
25
|
Pepe F, Pisapia P, Gristina V, Rocco D,
Micheli M, Micheli P, Iaccarino A, Tufano R, Gragnano G, Russo G,
et al: Tumor mutational burden on cytological samples: A pilot
study. Cancer Cytopathol. 129:460–467. 2021.PubMed/NCBI View Article : Google Scholar
|
|
26
|
Sanghvi RV, Buhay CJ, Powell BC, Tsai EA,
Dorschner MO, Hong CS, Lebo MS, Sasson A, Hanna DS, McGee S, et al:
Characterizing reduced coverage regions through comparison of exome
and genome sequencing data across 10 centers. Genet Med.
20:855–866. 2018.PubMed/NCBI View Article : Google Scholar
|
|
27
|
Wang Q, Shashikant CS, Jensen M, Altman NS
and Girirajan S: Novel metrics to measure coverage in whole exome
sequencing datasets reveal local and global non-uniformity. Sci
Rep. 7(885)2017.PubMed/NCBI View Article : Google Scholar
|
|
28
|
Chou D, Chen X, Purdy A, Teng L, Luo B,
Zhao C, Ball L, Castaneda A, Clark K, Crain B, et al: Abstract
3732: Analytical performance of TruSight® Tumor 170 on
small nucleotide variations and gene amplifications using DNA from
formalin-fixed, paraffin-embedded (FFPE) solid tumor samples.
Cancer Res. 2017.
|