Introduction
In acute pulmonary embolism (PE), hemodynamic
stability and the burden on the right side of the heart determine
the risk and management approach. Patients with right-sided heart
overload and hemodynamic stability are traditionally classified as
having intermediate-risk PE (1).
Right-sided heart overload can be detected using echocardiography
(ECHO), computerized tomographic pulmonary angiography (CTPA)
imaging, blood markers [brain natriuretic peptide (BNP) or
troponin], and/or electrocardiography (2).
The clinical outcome, risk categorization, and
management of PE depend on acute right ventricular (RV)
dysfunction, which is mostly a consequence of pathological
derangement in the pulmonary vasculature (3). Acute RV pressure overload and the
ensuing increased right ventricular diameter (RVD) due to PE can
lead to myocardial damage and major complications, including
premature death, even in patients with PE who initially present
with normal blood pressure (4).
To provide appropriate treatment within a safe and
reasonable timeframe, accurate diagnosis is crucial and CTPA is the
gold standard for detection of PE, but especially in smaller
community Emergency Departments (EDs) without these resources or
when the transfer of a patient is unsafe, ECHO can be a vital
option for diagnosis and safe treatment. Although ECHO appears to
be more accessible and offers no risk of ionizing radiation with a
repeatable, portable, and non-invasive manner, it is almost
operator-dependent and needs appropriate training (5,6).
There are findings of RV dysfunction on CTPA imaging
that are well-defined in the literature, but the RVD/left
ventricular diameter (LVD) ratio is a robust marker of RV
dysfunction and early death, which may justify its use for
prognostification after PE (7,8).
Using signs of RV disfunction in the decision-making process for
the management of intermediate-risk patients remains controversial,
as does the administration of thrombolytic therapy to
intermediate-risk patients. Hence, the present study aimed to
emphasize the role of the RVD/LVD ratio in decision-making for
treatment of this highly ‘grey’ cohort of patients with PE.
Patients and methods
Patient cohort and study design
The present study was a retrospective single-center
observational study conducted on 127 male and female patients aged
between 19-91 years, with a mean age of 67.8±16.8 years, who
presented to the ED of University of Health Sciences Ankara Dıskapı
Yıldırım Beyazıt Training and Research Hospital (Ankara, Turkey)
with PE between May 31, 2018 and May 31, 2022. The present study
was approved (approval no. 140/23) by the Institutional Review
Board of the University of Health Sciences Ankara Dıskapı Yıldırım
Beyazıt Training and Research Hospital (Ankara, Turkey). A G*Power
analysis, using SPSS (v.23.0; IBM Corp.) performed to determine the
sample size prior to the study, estimated a total of 108 patients
with at least 54 in each group to detect a difference of 0.25 in
the RVD/LVD ratio between the groups with a power of 95% and
α=0.05.
The inclusion criteria were as follows: A diagnosis
of acute PE in patients ≥18 years of age, confirmed by CTPA imaging
and stratified as intermediate risk. Intermediate risk was defined
as hemodynamic stability on admission, with a systolic blood
pressure (SBP) of at least 90 mmHg without hemodynamic support and
RV overload findings on CTPA imaging, or an increased cardiac
troponin level, according to hospital records. In addition,
intermediate risk was sub-stratified as intermediate-high or
intermediate-low risk according to the PE guidelines of the
European Society of Cardiology (ESC) (1) by incorporating the Pulmonary Embolism
Severity Index (PESI) scoring system. Low risk is defined as PESI
class III/IV with or without evidence of RV disfunction on imaging
(CTPA/ECHO) or an elevated RV biomarker (troponin or BNP), while
high risk is defined as PESI class III/IV with imaging evidence of
RVD on imaging (CTPA or ECHO), and an elevated RV biomarker
(troponin or BNP) (2). The
exclusion criteria were as follows: Pregnancy, referral to
University of Health Sciences Ankara Dıskapı Yıldırım Beyazıt
Training and Research Hospital or referred from University of
Health Sciences Ankara Dıskapı Yıldırım Beyazıt Training and
Research Hospital to another facility, high-risk PE,
intermediate-risk PE with missing medical data, no optimally
measured RVD and/or LVD on CTPA images, and anatomical chest
deformity.
Demographic characteristics, laboratory test results
[troponin, proBNP, D-dimer, blood urea nitrogen (BUN), creatinine,
white blood cell (WBC) count, hemoglobin (Hgb), platelet count,
lactate], PESI, simplified PESI (sPESI) scores, RVD/LVD ratio and
PE location from CTPA imaging, treatment modality (oral or
parenteral anticoagulant, thrombolytic, surgical embolectomy, or
direct thrombolysis via percutaneous catheter), hospitalization,
and clinical outcome were recorded on previously prepared data
forms. The patient data were accessed using a hospital automation
system. Blood test results were obtained from the Emergency
Biochemistry Laboratory of the University of Health Sciences Ankara
Dıskapı Yıldırım Beyazıt Training and Research Hospital. Troponin
values were recorded only as positive or negative because they were
determined using different kits and measurement methods between
2018 and 2022.
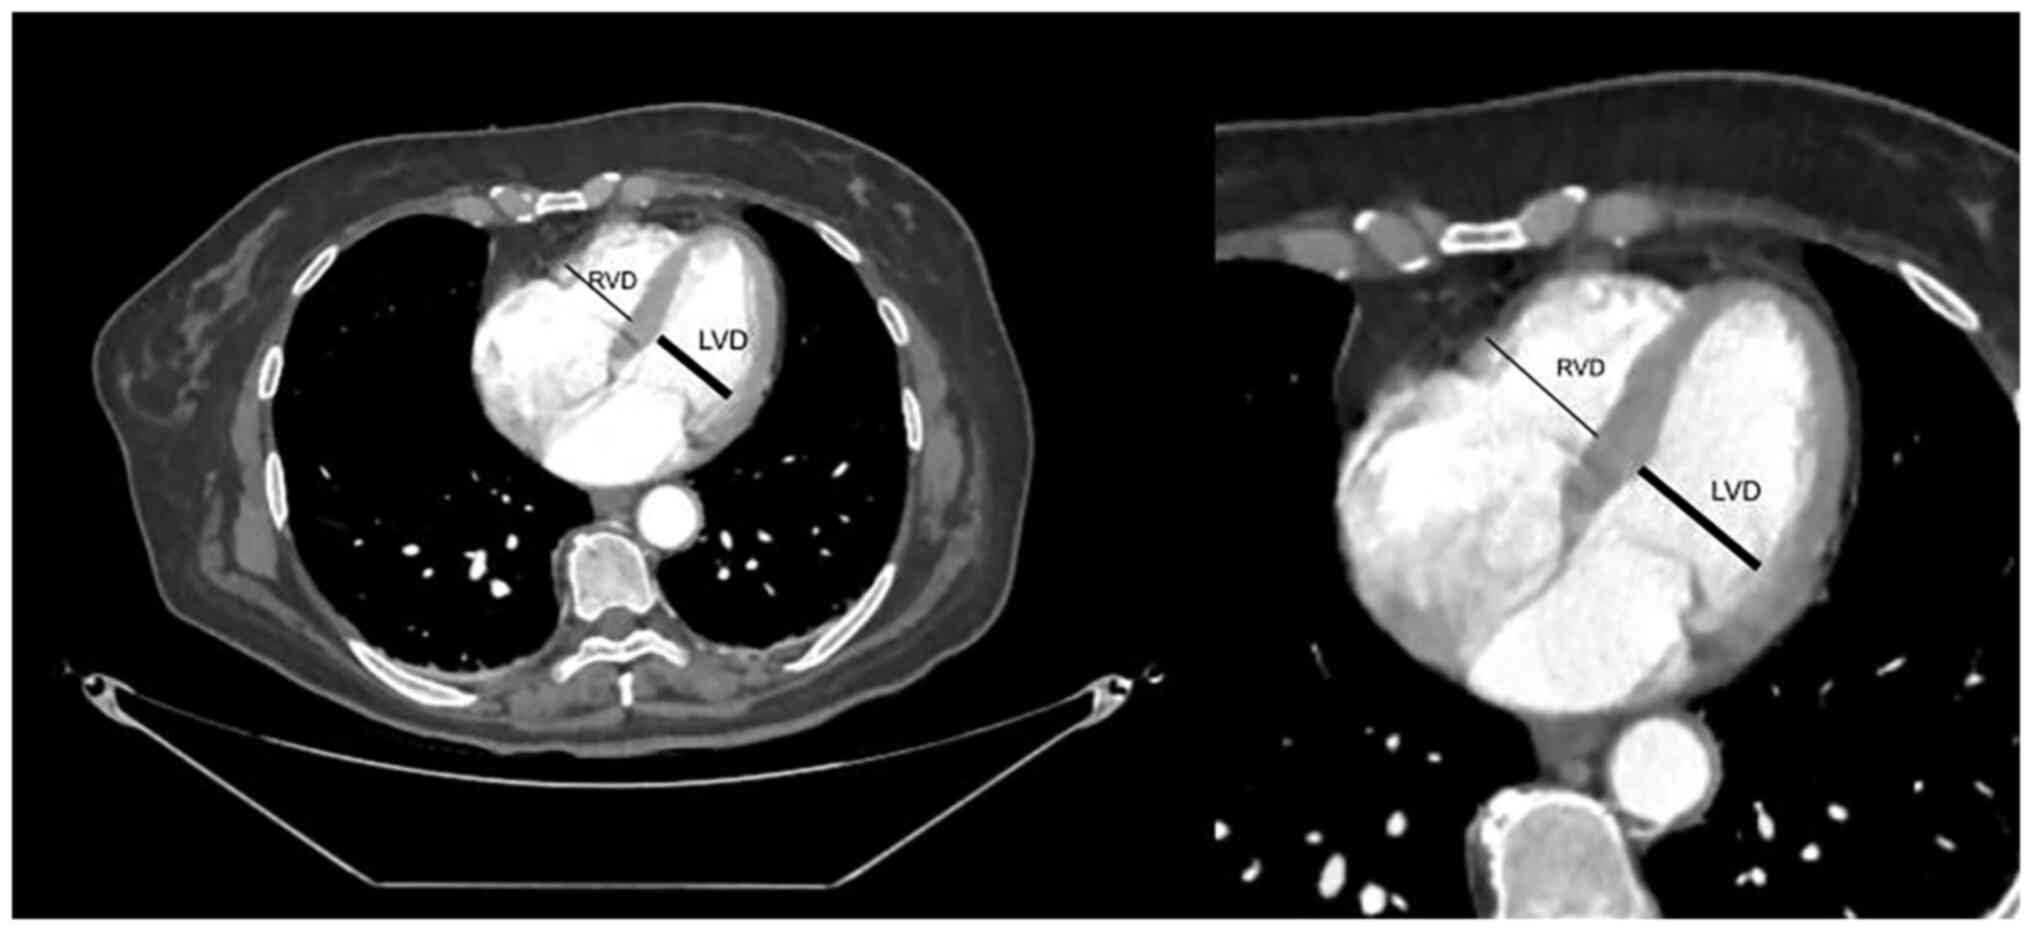
Radiological measurements were performed by a
radiologist, who was experienced in cardiovascular CT imaging using
standard axial plane reconstructions and who was unaware of the
study results. CTPA imaging was performed with the GE Healthcare
G-Optima 660 (128 slices) device with intravenous iohexol
administered to all patients as a contrast agent. Maximum RVD and
LVD were determined by manually marking the maximum distance of the
endocardial border of the right or left ventricle from the
interventricular septum. The largest RVD and LVD values, which were
usually obtained at different craniocaudal cardiac positions
determined by the radiologist, were used for the analysis (Fig. 1).
Based on the treatment modality, the patients were
categorized into the ‘systemic thrombolysis’ group and the ‘other’
(parenteral/oral conventional anticoagulation alone, surgical
embolectomy, or direct thrombolysis via percutaneous catheter)
group.
The primary outcome was all-cause mortality within
the first 30 days after PE. PESI and sPESI scores were calculated
as clinical prediction scores according to the 2019 PE guidelines
of the ESC (1). Mortality time
points were determined to be 24 h, 1-7, and 7-30 days.
Statistical analysis
Statistical analyses were performed using SPSS
(v.23.0; IBM Corp.). Normality of continuous variables was
determined using the Kolmogorov-Smirnov test, and skewness and
kurtosis were used as ancillary descriptive statistics. All
analyses were performed using non-parametric tests because the data
were not normally distributed in at least one group for each
dataset. Descriptive statistics included number (percentage) for
categorical variables, and either mean ± standard deviation or
median (minimum-maximum) for numerical variables. Differences
between numerical variables in the two independent groups were
determined using the Mann-Whitney U test. Comparison of the ratios
between independent groups was performed using the χ2
test. The statistical α significance level was set at
P<0.05.
Results
There was a significant association between patients
who were administered thrombolytic therapy and were in the
intermediate-high risk group (P<0.001). The mean RVD/LVD ratio
was 1.35±0.25 in patients who were administered thrombolytic
therapy and 1.17±0.34 in those who were not. There was a
significant association between a high RVD/LVD ratio and the
administration of thrombolytic therapy (P<0.001). In addition,
there was a similar significant association between both a high
D-dimer level and admission to the intensive care unit, with the
administration of thrombolytic therapy (P<0.001). Comparisons
between demographic information, laboratory data, patient outcomes,
patient risk groups, hospitalization status, and survival status by
the treatment regimen are shown in Table I.
 | Table IComparison of treatment regimen and
variables. |
Table I
Comparison of treatment regimen and
variables.
| Characteristics | Thrombolytic therapy
administered | Thrombolytic therapy
not administered | P-value |
|---|
| Sex, n (%) | | | |
|
Female | 36 (66.7) | 38 (52.1) | 0.099 |
|
Male | 18 (33.3) | 35 (47.9) | |
| Age (years), mean ±
standard deviation/median (min-max) | 67±16.6/69.5
(21-88) | 68.4±17/73
(19-91) | 0.560a |
| Laboratory findings,
n (%) or mean ± standard deviation/median (min-max) | | | |
|
Troponin
(+) | 41 (75.9) | 47 (64.4) | 0.163b |
|
BNP | 5,858.3±8,732.1/2,165
(116-35,000) |
7,996.2±10,560.2/2,290 (196-35,000) | 0.466 |
|
D-dimer | 8,044.5±5,992.5/6,810
(90-20,500) | 4,046.8±3,654.2/2,843
(188-18,200) | <0.001 |
|
RVD/LVD | 1.35±0.25/1.33
(0.88-1.96) | 1.17±0.34/1.14
(0.63-2.74) | <0.001 |
|
BUN | 47.9±27.7/38
(2-132) | 42.6±20.8/38
(8-114) | 0.636 |
|
Creatinine | 1.39±1.1/1.18
(0.57-8.1) | 1.08±0.36/0.99
(0.5-2.49) | 0.038 |
|
WBC | 11.7±4.31/11.17
(3,13-26) | 10.71±5.83/9.8
(1-43) | 0.063 |
|
Hgb | 14.4±12.2/12.8
(8.7-101) | 12.6±2.3/12.7
(7.3-17.1) | 0.655 |
|
Platelets | 200.8±80.7/183.5
(28-431) | 247.9±95.2/235
(12-574) | 0.002 |
|
Lactate | 4.26±3.63/3.2
(1-19) | 2.73±1.83/2.1
(0.7-9.5) | 0.002 |
|
PESI | 119±31.7/115.5
(60-212) | 109.5±30.6/107
(40-203) | 0.065 |
| Risk group, n
(%) | | | |
|
Intermediate-low
risk | 13 (24.1) | 39 (53.4) | 0.001b |
|
Intermediate-high
risk | 41 (75.9) | 34 (46.6) | |
| Hospitalization, n
(%) | | | |
|
Intensive
care unit | 31 (57.4) | 9 (12.3) |
<0.001b |
|
Ward | 23 (42.6) | 64 (87.7) | |
| Survival (days) mean
± standard deviation/median (min-max) | 9±7/7 (0-20) | 11±10/7 (1-29) | 0.758b |
| Mortality | | | |
|
Deceased | 11 (20.4) | 12 (16.4) | 0.569b |
|
Survived | 43 (79.6) | 61 (83.6) | |
Mortality was significantly associated with higher
D-dimer, BUN, lactate levels, WBC count, and a lower Hgb level
(P=0.001, P=0.003, P=0.005, P=0.022 and P=0.023, respectively). A
high PESI score was significantly correlated with mortality
(P<0.001). Comparisons of demographic information, laboratory
data, ED patient outcomes, patient risk groups, and hospitalization
status by mortality status are presented in Table II.
| Table IIComparison of mortality and the
variables. |
Table II
Comparison of mortality and the
variables.
| Characteristics | Deceased | Survived | P-value |
|---|
| Sex, n (%) | | | 0.780b |
|
Female | 14 (60.9) | 60 (57.7) | |
|
Male | 9 (39.1) | 44 (42.3) | |
| Age (years), mean ±
standard deviation/median (min-max) | 74.8±13.7/78
(36-90) | 66.3±17.1/70
(19-91) | |
| Thrombolytic therapy,
n (%) | | | 0.569a |
|
Administered | 11 (47.8) | 43 (41.3) | |
|
Not
administered | 12 (52.2) | 61 (58.7) | |
| Thrombolytic
therapy, n (%) | | | 0.126a |
|
Positive | 19 (82.6) | 69 (66.3) | |
|
Negative | 4 (17.4) | 35 (33.7) | |
| Laboratory results,
mean ± standard deviation/median (min-max) | | | |
|
BNP |
4,157.3±4,566.1/2,100 (116-10,895) |
7,123.5±10,053.6/2,260 (175-35,000) | 0.509a |
|
D-dimer |
8,330.2±4,705.7/7,560 (1,221-20,500) |
5,175.3±5,106.7/3,183.5 (90-20,300) | 0.001a |
|
RVD/LVD | 1.32±0.32/1.21
(0.83-1.95) | 1.23±0.32/1.2
(0.63-2.74) | 0.248a |
|
BUN | 59.7±30.1/57
(23-132) | 41.6±21.2/36.5
(2-121) | 0.003a |
|
Creatinine | 1.32±0.54/1.3
(0.57-2.49) | 1.19±0.82/1.04
(0.5-8.1) | 0.102a |
|
WBC | 13.25±5.62/12.2
(5.13-26) | 10.66±5.07/9.95
(1-43) | 0.022a |
|
Hgb | 11.7±1.9/11.7
(8-15) | 13.7±8.9/13
(7.3-101) | 0.023a |
|
Platelet | 258.3±111.2/250
(95-574) | 221.1±86.4/205.5
(12-492) | 0.130a |
|
Lactate | 4.96±4.24/3.4
(0.7-19) | 3.03±2.3/2.35
(1-17) | 0.005a |
|
PESI | 137.1±31.4/131
(84-212) | 108.4±29/105
(40-203) |
<0.001a |
| Risk category, n
(%) | | | 0.109b |
|
Low
risk | 6 (26.1) | 46 (44.2) | |
|
High
risk | 17 (73.9) | 58 (55.8) | |
| Hospitalization, n
(%) | | | 0.001b |
|
Intensive
care unit | 14 (60.9) | 26 (25.0) | |
|
Ward | 9 (39.1) | 78 (75.0) | |
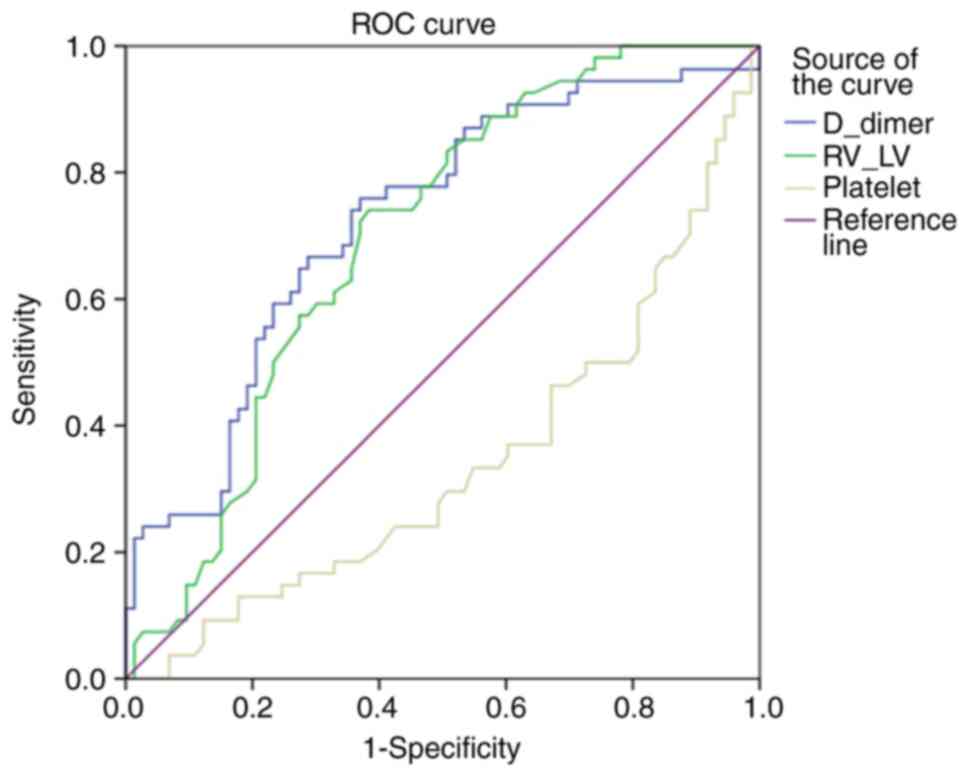
When the sensitivity and specificity of the D-dimer
level, RVD/LVD ratio and platelet count in predicting the
requirement for thrombolytic treatment were evaluated by receiver
operating curve (ROC) analysis, the cut-off values were determined
as 4,394.5 for D-dimer (sensitivity, 66.7%; specificity, 71.2%),
1.21 for RVD/LVD ratio (sensitivity, 64.8%; specificity, 64.4%) and
214.00 for platelet count (sensitivity, 37%; specificity, 39.7%)
(Fig. 2; Table III). Univariate and multivariate
logistic regression analyses were both performed between the
laboratory parameters of patients who were given thrombolytics and
those who were not. D-dimer, platelet and RVD/LVD ratio were
identified to be statistically significant and cut-off values were
determined by logistic regression analysis (Table IV).
| Table IIIPerformances of variables in
predicting the need for thrombolytic treatment. |
Table III
Performances of variables in
predicting the need for thrombolytic treatment.
| | Area under the
curve |
|---|
| | Asymptotic 95%
confidence interval |
|---|
| Test result
variable | Area | Std. error | Asymptotic
sig. | Lower boundary | Upper boundary |
|---|
| D-dimer | 0.725 | 0.046 | 0.000 | 0.635 | 0.814 |
| RVD/LVD | 0.698 | 0.046 | 0.000 | 0.607 | 0.788 |
| Platelets | 0.340 | 0.049 | 0.002 | 0.243 | 0.436 |
| Table IVLogistic regression of variables in
predicting the need for thrombolytic therapy. |
Table IV
Logistic regression of variables in
predicting the need for thrombolytic therapy.
| | Univariate
analysis | Multivariate
analysis |
|---|
| | | 95% CI | | | 95% CI | |
|---|
| Parameter | OR | Lower boundary | Upper boundary | P-value | OR | Lower boundary | Upper boundary | P-value |
|---|
| RVD/LVD | 3.33 | 1.595 | 6.950 | 0.001 | 3.084 | 1.364 | 6.970 | 0.007 |
| D-dimer | 4.952 | 2.317 | 10.585 | <0.001 | 5.298 | 2.319 | 12.101 | <0.001 |
| Platelets | 0.358 | 0.173 | 0.742 | 0.006 | 0.344 | 0.151 | 0.787 | 0.011 |
Discussion
Hemodynamic stability is the cornerstone of PE
management, which is consistent with the results of the present
study showing that intermediate-risk patients with a high RVD/LVD
ratio were administered thrombolytic therapy. Beyond this, while
the RVD/LVD ratio failed to predict 30-day mortality, a decision
can be made regarding the therapeutic approach between low- and
high-risk patients in the intermediate group. In this regard, PE
severity and blood test results must also be considered. On CTPA
images, assessment of the axial plane views is the gold standard
and the most straightforward method to assess RV dysfunction
because the images of the ventricular cavities are noticeably
superior (9). Although the
majority of patients with PE and assessed as intermediate-risk can
be adequately treated with anticoagulants, a sizeable minority may
deteriorate and necessitate reperfusion therapy (10), which is consistent with the results
of the present study (Table
I).
Thrombolytic therapy has several advantages over
anticoagulant therapy alone, such as a more rapid elimination of
thrombus material, and consequently, a more rapid reduction of
pulmonary artery pressure and resistance, as well as a more rapid
improvement of RV function (11).
Therefore, particularly for patients at intermediate-high risk,
there should be close monitoring, and reperfusion therapies should
be considered in cases of hemodynamic deterioration, as reported in
the ESC guidelines (1). One of the
most important indicators of clot burden in the pulmonary arteries
is the D-dimer level, where a higher value is associated with
higher mortality and complications as a result of RV dysfunction
(12). The mean D-dimer values of
patients who received thrombolytic therapy were twice those who did
not receive it, which is likely to be due to an increased afterload
on the right ventricle and the consequences on hemodynamics
(Table I). The areas under the ROC
curves for the D-dimer level and the RVD/LVD ratio (Table III) represent the ability to
distinguish between those who received thrombolytic therapy and
those who did not. The proximity of the metrics indicated that the
results for the RVD/LVD ratio and the D-dimer level were
comparable. The areas under the ROC curve are close to each other
but are not perfectly separated. According to these results, it is
inferred that RVD/LVD ratio is not superior to D-dimer but can be
combined synergistically as a diagnostic marker for thrombolytic
therapy. However, the mode of therapy has been shown not to have
prognostic significance among high- and low-risk patient groups
(12), as also observed in the
present study.
In addition, the odds ratio for the RVD/LVD ratio
(Table IV) indicates that an
increase in the RVD/LVD ratio is associated with an increased
likelihood of receiving thrombolytic therapy. The most commonly
accepted thresholds for the RVD/LVD ratio on CT imaging are 0.9 and
1.0 and an increase in this ratio is a well-known indicator of RV
dysfunction (13). An increased
RVD/LVD ratio is associated with a concomitant LV filling defect
and decreased cardiac output. It is an important indicator of the
severity of PE accompanied by clinical findings such as
hypotension, tachycardia, altered consciousness, syncope, chest
pain due to decreased coronary circulation, and decreased urine
output. It can be used as a surrogate for risk stratification in
patients with acute PE, and aid in deciding a course of treatment
(14). Given the findings of the
present study it is considered that an increased RVD/LVD ratio can
adequately stratify the risk for patients with a PE; therefore,
this imaging modality can be used to assess patients with PE or
individualize their treatment by means of disease severity
assessment. In addition, the difference in the therapeutic approach
between the high- and low-risk groups was associated with a higher
risk of hemodynamic deterioration because patients at
intermediate-high risk were at a higher level on the risk scale, as
expected. Therefore, a treatment approach that considers RVD/LVD
measurements on CTPA imaging without hemodynamic deterioration may
guide ED physicians in decision-making, particularly when
ultrasonography is unavailable (15,16).
Imaging plays an important role in the evaluation
and management of acute PE and CTPA is the imaging modality of
choice in the current standard of care (17,18).
Beyond this, an ECHO is a dynamic evaluation tool for the
assessment of RVD, tricuspid annular plane systolic excursion, RV
systolic pressure, qualitative RV function, pulmonary hypertension,
and McConnell's sign, although none of these can be used with
absolute certainty in diagnosing PE, because some symptoms of RV
dysfunction might manifest in the absence of PE as well as other
cardiac conditions; but it is ideal for prognostication,
identifying high-risk patients for urgent thrombolysis, monitoring
medication response and ruling out other conditions. To evaluate
patients with acute PE, CTPA and ECHO imaging have been employed in
tandem as complementing technologies (18,19).
In the present study, the RVD/LVD ratio was not compared with
ECHO-derived parameters because it was retrospective in nature and
ECHO findings for all patients could not be obtained, but the
CT-derived parameters, particularly the RVD/LVD ratio is a
promising measurement and an area of more recent focus.
The present study did not detect any significant
association between the RVD/LVD ratio and mortality (P=0.248),
which implies that the RVD/LVD ratio indicated the risk of
hemodynamic deterioration and it can be a marker for the prevention
of mortality. However, there was a significant association between
a high PESI score, which calculates 30-day mortality in patients
with PE, and mortality (P<0.001). Mortality can be accurately
predicted using the PESI, particularly for those with a low score
(20). In the ESC 2019 guidelines
(1), patients are categorized into
the intermediate-risk group instead of the low-risk group when they
exhibit signs of RV failure, even though they do not have
sufficiently high PESI and sPESI scores. Since PESI has such
limitations, indicators of RV failure, such as the RVD/LVD ratio,
can be used as ancillary parameters to support PESI.
The major limitation of the present study is the
retrospective design. As there were multiple thrombi in all
patients and a precise classification could not be performed,
thrombus location was not considered. During the study, access to
CT was periodically restricted due to the coronavirus 2019
outbreak, which meant that CTPA imaging could not be performed at
the time of diagnosis in every patient, and this is likely to have
resulted in deviations from the diagnostic algorithm. This, in
turn, unfavourably affected the number of patients likely to be
included in the study. Although the present study yielded results
similar to those of other studies (13,14),
it included a small number of patients, thus the results cannot be
generalized. Beyond this, a lack of inter-rater reliability
resulted in measurement bias. A different major limitation was that
owing to the retrospective nature of the study, access to ECHO data
from all patients was not possible and, therefore, the data could
not be compared with the CTPA results. Prospective studies with
larger sample sizes are required regarding the routine use of
thrombolytic therapy in intermediate-risk patients and the role of
the RVD/LVD ratio measured from CTPA imaging, as well as the use of
cardiac ECHO in decision-making.
In conclusion, although the use of several
parameters obtained from CTPA imaging to risk stratify patients
with acute PE has been studied in detail previously, a definitive
consensus has not yet been reached, warranting future studies on
this subject.
Acknowledgements
Not applicable.
Funding
Funding: No funding was received.
Availability of data and materials
The data generated in the present study may be
requested from the corresponding author.
Authors' contributions
EK was responsible for conceptualization,
investigation and writing the original draft. BMS was responsible
for methodology, project administration, validation, visualization,
supervision and editing the written draft. GÇ made substantial
contributions to conception and design, acquisition of data, and
the analysis and interpretation of data. İS performed data
curation, wrote the original draft and was responsible for
interpretation of the clinical data. İSD performed acquisition,
analysis and interpretation of computer data. EK and İS confirm the
authenticity of all the raw data. All authors read and approved the
final version of the manuscript.
Ethics approval and consent to
participate
All procedures performed in studies involving human
participants were approved (approval no. 140/23) by the
Institutional Review Board of University of Health Sciences Ankara
Dıskapı Yıldırım Beyazıt Training and Research Hospital (Ankara,
Turkey) and were in accordance with the 1964 Helsinki Declaration
and its later amendments or comparable ethical standards.
Patient consent for publication
Informed consent was obtained from all individual
participants included in the present study.
Competing interests
The authors declare that they have no competing
interests.
References
|
1
|
Konstantinides SV, Meyer G, Becattini C,
Bueno H, Geersing GJ, Harjola VP, Huisman MV, Humbert M, Jennings
CS, Jiménez D, et al: 2019 ESC guidelines for the diagnosis and
management of acute pulmonary embolism developed in collaboration
with the European respiratory society (ERS). Eur Heart J.
41:543–603. 2020.PubMed/NCBI View Article : Google Scholar
|
|
2
|
Balakrishna AM, Reddi V, Belford PM,
Alvarez M, Jaber WA, Zhao DX and Vallabhajosyula S:
Intermediate-Risk pulmonary embolism: A review of contemporary
diagnosis, risk stratification and management. Medicina (Kaunas).
58(1186)2022.PubMed/NCBI View Article : Google Scholar
|
|
3
|
Zimmermann L, Laufs U, Petros S and Lenk
K: Outcome after thrombolysis in patients with intermediate
high-risk pulmonary embolism: A propensity score analysis. J Emerg
Med. 62:378–389. 2022.PubMed/NCBI View Article : Google Scholar
|
|
4
|
Meyer G, Vicaut E, Danays T, Agnelli G,
Becattini C, Beyer-Westendorf J, Bluhmki E, Bouvaist H, Brenner B,
Couturaud F, et al: Fibrinolysis for patients with
intermediate-risk pulmonary embolism. N Engl J Med. 370:1402–1411.
2014.PubMed/NCBI View Article : Google Scholar
|
|
5
|
Kagima J, Stolbrink M, Masheti S, Mbaiyani
C, Munubi A, Joekes E, Mortimer K, Rylance J and Morton B:
Diagnostic accuracy of combined thoracic and cardiac sonography for
the diagnosis of pulmonary embolism: A systematic review and
meta-analysis. PLoS One. 15(e0235940)2020.PubMed/NCBI View Article : Google Scholar
|
|
6
|
Thomas SE, Weinberg I, Schainfeld RM,
Rosenfield K and Parmar GM: Diagnosis of pulmonary embolism: A
review of evidence-based approaches. J Clin Med.
13(3722)2024.PubMed/NCBI View Article : Google Scholar
|
|
7
|
Kang DK, Thilo C, Schoepf UJ, Barraza JM
Jr, Nance JW Jr, Bastarrika G, Abro JA, Ravenel JG, Costello P and
Goldhaber SZ: CT signs of right ventricular dysfunction: Prognostic
role in acute pulmonary embolism. JACC Cardiovasc Imaging.
4:841–849. 2011.PubMed/NCBI View Article : Google Scholar
|
|
8
|
Miyagawa M, Okumura Y, Fukamachi D, Fukuda
I, Nakamura M, Yamada N, Takayama M, Maeda H, Yamashita T, Ikeda T,
et al: Clinical implication of the right ventricular/left
ventricular diameter ratio in patients with pulmonary
thromboembolism. Int Heart J. 63:255–263. 2022.PubMed/NCBI View Article : Google Scholar
|
|
9
|
Wang J, Guan W, Chen D, Han Y, Xu Z, Qiang
J, Chen W, Li N and Gao W: The value of CTPA for diagnosing acute
pulmonary thromboembolism and the ensuing right ventricular
dysfunction. Cell Biochem Biophys. 69:517–522. 2014.PubMed/NCBI View Article : Google Scholar
|
|
10
|
Pastré J, Sanchis-Borja M and Benlounes M:
Risk stratification and treatment of pulmonary embolism with
intermediate-risk of mortality. Curr Opin Pulm Med. 28:375–383.
2022.PubMed/NCBI View Article : Google Scholar
|
|
11
|
Tapson VF: Thrombolytic therapy in acute
pulmonary embolism. Curr Opin Cardiol. 27:585–591. 2012.PubMed/NCBI View Article : Google Scholar
|
|
12
|
Keller K, Beule J, Balzer JO and Dippold
W: D-Dimer and thrombus burden in acute pulmonary embolism. Am J
Emerg Med. 36:1613–1618. 2018.PubMed/NCBI View Article : Google Scholar
|
|
13
|
Hu J, Tian X, Liu XW, Liu YZ, Gao BL and
Li CY: Markers of right ventricular dysfunction predict 30-day
adverse prognosis of pulmonary embolism on pulmonary computed
tomographic angiography. Medicine (Baltimore).
102(e34304)2023.PubMed/NCBI View Article : Google Scholar
|
|
14
|
Brunton N, McBane R, Casanegra AI,
Houghton DE, Balanescu DV, Ahmad S, Caples S, Motiei A and Henkin
S: Risk stratification and management of intermediate-risk acute
pulmonary embolism. J Clin Med. 13(257)2024.PubMed/NCBI View Article : Google Scholar
|
|
15
|
Park JR, Chang SA, Jang SY, No HJ, Park
SJ, Choi SH, Park SW, Kim H, Choe YH, Lee KS, et al: Evaluation of
right ventricular dysfunction and prediction of clinical outcomes
in acute pulmonary embolism by chest computed tomography:
Comparisons with echocardiography. Int J Cardiovasc Imaging.
28:979–987. 2012.PubMed/NCBI View Article : Google Scholar
|
|
16
|
Ayöz S, Erol S, Kul M, Kaya AG, Çoruh AG,
Savaş İ, Aydın Ö and Kaya A: Using RV/LV ratio and cardiac
biomarkers to define the risk of mortality from pulmonary embolism.
Tuberk Toraks. 69:297–306. 2021.PubMed/NCBI View Article : Google Scholar
|
|
17
|
Ammari Z, Hasnie AA, Ruzieh M, Dasa O,
Al-Sarie M, Shastri P, Ashcherkin N, Brewster PS, Cooper CJ and
Gupta R: Prognostic value of computed tomography versus
echocardiography derived right to left ventricular diameter ratio
in acute pulmonary embolism. Am J Med Sci. 361:445–450.
2021.PubMed/NCBI View Article : Google Scholar
|
|
18
|
Moore AJE, Wachsmann J, Chamarthy MR,
Panjikaran L, Tanabe Y and Rajiah P: Imaging of acute pulmonary
embolism: An update. Cardiovasc Diagn Ther. 8:225–243.
2018.PubMed/NCBI View Article : Google Scholar
|
|
19
|
Nasser MF, Jabri A, Limaye S, Sharma S,
Hamade H, Mhanna M, Aneja A and Gandhi S: Echocardiographic
evaluation of pulmonary embolism: A review. J Am Soc Echocardiogr.
36:906–912. 2023.PubMed/NCBI View Article : Google Scholar
|
|
20
|
Yamashita Y, Morimoto T, Amano H, Takase
T, Hiramori S, Kim K, Oi M, Akao M, Kobayashi Y, Toyofuku M, et al:
Validation of simplified PESI score for identification of low-risk
patients with pulmonary embolism: From the COMMAND VTE registry.
Eur Heart J Acute Cardiovasc Care. 9:262–270. 2020.PubMed/NCBI View Article : Google Scholar
|