Introduction
Nuclear technology is widely used in various fields,
such as medicine, industry and agriculture. Exposure to radiation
or nuclear leakage is sometimes unavoidable and potentially
catastrophic. Radiation accidents, such as those caused by the
Three Mile Island nuclear power plant in the United States (1979),
Chernobyl, Russia (1986), and Fukushima, Japan (2011), highlight
the potential threats associated with catastrophic nuclear events
(1,2). Since the middle of the 20th century,
more than 400 radiological accidents have occurred (3), causing thousands of injuries.
Ionizing radiation markedly affects individuals, as they are
continuously exposed to radiation from various sources, including
natural background radiation, diagnostic procedures and nuclear
disasters. Radiation therapy, particularly at high doses, can
induce inflammation and increase the risk of autoimmune reactions
(4). The immune system, which is
essential for defending against environmental insults and stress,
is profoundly affected by ionizing radiation (5). Experimental studies have indicated
that high-dose radiation can suppress immune function, whereas
low-dose radiation may have a stimulating effect (6). However, the current evidence
regarding the response of the immune system to ionizing radiation
remains fragmented and contradictory. Therefore, it is imperative
to obtain more comprehensive insights into the effects of ionizing
radiation on the immune system.
Clinically, the consequences of radiation exposure
are categorized into systemic radiation and localized radiation.
Localized irradiation refers to exposure to a relatively limited
area of the body, resulting in restricted damage to the directly
exposed tissues. The harm experienced by organisms subjected to
radiation begins at the skin and progresses towards the tissues in
the internal body. The hands of irradiated patients demonstrate a
unique and profound relationship with ionizing radiation exposure,
as they remain the most affected part of the body. Hand irradiation
is typically accompanied by whole-body radiation, which can induce
changes in the blood system, as evidenced by incidents such as the
Nanjing 192Ir accident (7,8).
Clinically, the earliest symptom of localized injury is transient
erythema and/or oedema, which is caused by telangiectasia and fluid
extravasation within the first week. This may be followed by
pruritus, stiffness, stinging, and tenderness (9). The initial appearance of the skin and
the affected area does not necessarily correlate with the extent of
tissue damage; microcirculatory disturbances often affect much
larger areas than initially perceived. The skin contains a network
of blood vessels and capillaries, and blood circulates throughout
the body via a system composed of arteries, veins, and capillaries.
The hematopoietic system has been identified as particularly
susceptible to radiation-induced damage, affecting both mature
blood cells and hematopoietic stem cells within the bone marrow
niche, which play crucial roles in the replenishment of blood cells
(10).
One component of healthy tissue that is consistently
subjected to irradiation is the circulating peripheral blood
mononuclear cells (PBMCs), which demonstrate heightened sensitivity
to ionizing radiation (11-14).
PBMCs constitute a diverse array of cellular subsets that are
traditionally categorized into myeloid and lymphoid lineages
(15,16). The myeloid lineage includes
monocytes and their progeny, as well as granulocytes, such as
neutrophils and eosinophils. Lymphoid cells predominantly consist
of T cells, B cells, and natural killer (NK) cells (17-19).
RNA is crucial in cellular biological processes, and transcriptomes
provide essential information directly linked to cell phenotypes.
Single-cell RNA sequencing (scRNA-Seq) is a robust technique for
profiling individual cells. The conventional bulk RNA-seq technique
measures average gene expression across cells in a sample and
identifies differences between sample conditions. By contrast,
scRNA-Seq measures the gene expression of individual cells,
allowing for the identification of differences between cells in one
or more samples. While cells have traditionally been characterized
morphologically or by unique molecules, scRNA-Seq facilitates the
automatic classification of cells through clustering of
transcriptomes, enabling the identification of heterogeneous cell
types and molecular states even within groups considered to consist
of only one cell type. scRNA-Seq of heterogeneous cell populations
has become the standard tool for establishing cellular lineages and
tissue compositions in the human body (20,21).
This method amplifies minute transcriptome RNA from individual
cells, enabling high-throughput sequencing to obtain a
comprehensive expression profile of the entire transcriptome at
single-cell resolution. This approach reveals the molecular
regulatory mechanisms underlying specific biological and disease
processes (22-24).
The primary aim of the present study was to
characterize the properties of PBMCs from both irradiated patients
and their healthy counterparts via scRNA-Seq technology. This
approach offered a novel research framework for further
investigations into PBMCs in irradiated patients. By analyzing
single cells from irradiated patients, the present study identified
distinct characteristics of various cell populations and explored
the potential biological functions of PBMCs in response to
radiation exposure, thereby providing insights into therapeutic
possibilities for treating radiation-induced injuries.
Materials and methods
Patient and healthy control blood
sample collection
The irradiated patient was a 30-year-old male. The
hands of the patient accidentally contacted the radioactive source
192Ir for ~30 sec on August 24, 2019. After a few days,
the skin of the hands gradually became red, swollen, painful,
ulcerated and sloughed. In the accident, the activity of the
radioactive source 192Ir was 59 Ci and ~3 weeks later,
the patient was admitted to the hospital for bone marrow
aspiration, which indicated hypoplasia of the bone marrow. The
physical dose estimation results were as follows: Left hand, from
the little finger to the thumb, 2.2, 2.7, 3.4 and 6 Gy; right hand,
from the little finger to the thumb, 3.1, 4.8, 6.7, 9.2 and 11.2
Gy, respectively. The blood samples used for scRNA-Seq were taken
113 days and 631 days after irradiation (Fig. 1B). Fresh PBMCs were isolated from
the circulating blood of the irradiated patient and 10 healthy
controls of matched sex and age (Tables SI, SII and SIII). The patient and the healthy
controls provided informed consent for the present study. All
patients provided written informed consent for their tissues to be
used for scientific research. Ethical approval for the study was
obtained from the Second Affiliated Hospital of Chengdu Medical
College, Nuclear Industry 416 Hospital [Chengdu, China; approval
no.: 2019(25)].
Chromosome aberration analysis
Venous blood (2 ml) was taken from the subject and
placed into a heparin tube. Next, the blood was transferred to a
culture container, gently mixed and placed in an incubator with
RPMI 1640 medium (Gibco; Thermo Fisher Scientific, Inc.) at 37˚C
for 24 h. Subsequently, 20 µl of 10 µg/ml colchicine (cat. no.
ST1173, Beyotime) was added to the culture medium (resulting in a
final concentration of 0.04 µg/ml) and the cells cultured for an
additional 24 h before harvesting. After terminating the culture,
the supernatant was gently removed from the culture bottle using a
pipette. KCl (0.075 mol/l; 8 ml), pre-warmed to 37˚C, was added to
each bottle. The cell clumps were pipetted and transferred to a
10-ml tube. The tube was incubated in a 37˚C constant temperature
water bath for 30 min. The hypotonic centrifuge tubes were removed
and add 5-10 drops of freshly prepared fixative to each tube (with
a volume ratio of methanol to glacial acetic acid of 3:1). They
were mixed by gently blowing with a pipette and centrifugation at
room temperature 200 x g for 10 min. The clear liquid was aspirated
with a pipette, 8 ml of fixative (with a volume ratio of methanol
to glacial acetic acid of 3:1) added and the cell clumps mixed
thoroughly by pipetting. Fixation was at room temperature for 30
min, followed by another centrifugation at room temperature 200 x g
for 10 min twice. After the final centrifugation, the supernatant
was discarded and 3-6 drops of fixative added to adjust the cell
concentration. The cell suspension was dropped from a height of
10-30 cm onto a clean glass slide that had been pre-cooled at 4˚C
and allowed to dry naturally in room temperature. The sample was
stained with 10% Giemsa stain at room temperature for 8 min. The
stain was gently rinsed with distilled water and the slide placed
on a slide rack to dry naturally at room temperature (25). Finally, the chromosomal aberrations
were analyzed under an optical microscope. Under the x10 objective,
each stained chromosome slide is scanned from right to left, column
by column or row by row, to search for analyzable metaphase cells.
After locating the target, the cells are counted and analyzed under
the oil immersion lens (magnification, x100). At least 100
metaphase cells are analyzed for each examination.
Preparation of single-cell suspension
of human PMBC samples
Human peripheral blood (5 ml) was placed in an EDTA
anticoagulant tube and diluted with an equal volume of 1X PBS. An
equal volume of Lymphocyte Separation Solution (Ficoll; cat. no.
P4350; Beijing Solarbio Science & Technology Co., Ltd.) was
added to a 50-ml centrifuge tube, and the diluted blood carefully
layered onto the Lymphocyte Separation Solution. It was then
centrifuged at 20˚C and 400 x g using a horizontal rotor for 20
min, with the brake set to 0. After centrifugation, the middle
buffy coat layer containing the PBMC cells was carefully pipetted
into a new 15 ml centrifuge tube. The buffy coat cells were washed
with 10 ml of 1X PBS and centrifuged at room temperature 300 x g
for 10 min. The supernatant was discarded and the cells resuspended
in 5 ml of 1X PBS. Following another centrifugation at room
temperature 300 x g for 10 min and two additional washes, the
supernatant was discarded and the cells resuspended in 1 ml of
RPMI-1640 medium (Corning, cat. no. 10-040-CVR) supplemented with
0.04% BSA. Cell concentration and viability was assessed using
trypan blue staining (room temperature, 3 min) to obtain a
single-cell suspension.
Single-cell capture, library building
and sequencing
The freshly prepared single-cell suspension was
adjusted to 700-1,200 cell/µl according to the 10X Genomics
Chromium Next GEM Single Cell 3'Reagent Kit v3.1 (10X Genomics,
cat. no. 1000268) operation manual for computer and library
construction. The constructed library was sequenced using Illumina
Nova 6000 PE150 platform (Illumina, Inc.) (26).
ScRNA-Seq bioinformation analysis
process
The library construction, sequencing and data
analysis were conducted by Shanghai OE Biotech Co., Ltd. The raw
data generated from high-throughput sequencing were in FASTQ
format. The official 10X Genomics software, CellRanger (v5.0.0; 10X
Genomics), was used to perform data quality statistics on the raw
data and to compare it with the reference genome (https://cf.10xgenomics.com/supp/cell-exp/refdata-gex-GRCh38-2020-A.tar.gz).
The software identified the barcode markers that distinguished
cells in the sequence, and each unique molecular identifier (UMI)
marker corresponding to different intracellular mRNA molecules is
employed to quantify high-throughput single-cell transcriptome
data, yielding high-quality statistical information such as cell
count, gene median, and sequencing saturation.
Following the preliminary quality control performed
by CellRanger, the Seurat (v3.1.2) (27) software package was employed for
additional quality control processing of the data. Theoretically,
the number of genes expressed by most cells, the number of UMIs,
and the expression proportion of mitochondrial transcripts will
cluster within a specific range. Consequently, low-quality cells
were filtered based on the distribution of three indicators: nUMI,
nGene, and percent.mito. The criteria established were to retain
cells with gene and UMI counts within the median ±2 times the
absolute median absolute deviations (MAD) and with a mitochondrial
transcript ratio of <20%, which were classified as high-quality
cells. Additionally, DoubletFinder (v2.0.2) (28) software was utilized to remove
doublets.
Top variable genes across single cells were
identified using the method described in Macosko et al
(29). The most variable genes
were selected using FindVariableGenes function
(mean.function=FastExpMean, dispersion.function=FastLogVMR) in
Seurat. To remove the batch effects in single-cell RNA-sequencing
data, the mutual nearest neighbors presented by Haghverdi et
al (30) was performed with
the R package batchelor (v1.3.4). Graph-based clustering was
performed to cluster cells according to their gene expression
profile using the FindClusters function in Seurat. Cells were
visualized using a 2-dimensional t-distributed stochastic neighbor
embedding (t-SNE) algorithm with the RunTSNE function in
Seurat.
The SingleR (v0.2.2) (31) package was used for cell type
identification. Based on the single-cell reference expression
quantitative public data set, the correlation between the cell
expression profiles and the reference data were calculated. This
process assigned the cell type with the highest correlation in the
reference data set to the cell to be identified, minimizing human
subjectivity and interference. The identification principle
calculated the Spearman correlation between the expression profile
of each cell in the sample and the annotated cells in the reference
data set. The cell type with the greatest expression correlation
was chosen as the final cell type to be identified.
The FindMarkers function in the Seurat package was
used to perform differential gene screening, screen out
significantly differential genes based on the conditions of
P<0.05 and difference fold >1.5 and Gene Ontology (GO) and
Kyoto Encyclopedia of Genes and Genomes (KEGG) enrichment analysis
of significantly differential genes conducted through the
hypergeometric distribution test. The probability model of the
hypergeometric distribution is used to assess the enrichment of
gene sets in specific biological processes or pathways.
SCENIC analysis
SCENIC analysis was conducted using the RcisTarget
motifs database and GRNboost [SCENIC (32) v1.1.2.2, RcisTarget v1.2.1, and
AUCell v1.4.1; Bioconductor)] with default parameters. The process
involves the following steps: i) Identification of potential target
genes of each transcription factor based on co-expression, ii)
Using the RcisTarget package to ascertain the actual transcription
factors and their corresponding target genes through motif analysis
and iii) Evaluation the activity of each regulator in each cell
using the AUCell package. To assess the cell type specificity of
each regulon, the regulon specificity score (RSS) (33) was calculated based on the
Jensen-Shannon divergence (JSD) using the scFunctions package
(https://github.com/FloWuenne/scFunctions/), along with
the relatedness index (CSI) of all regulators.
Pseudo-time analysis
The Monocle2 (v2.9.0) (34) package was used to infer cell
differentiation trajectories. The specific steps were as follows:
First, the importCDS function of the Monocle2 package was used to
convert the Seurat object into a CellDataSet object, and the
differentialGeneTest function used to filter out the genes used to
sort cells (ordering genes qval<0.01), then the reduceDimension
function was used to perform dimensionality reduction clustering
and, finally, the orderCells function used to infer the
differentiation trajectory.
Gene set variation analysis (GSVA)
enrichment analysis
Gene set files were initially obtained and
structured from the Kyoto Encyclopedia of Genes and Genomes (KEGG)
database via the gene set enrichment analysis base package
(v1.44.0; Kyoto University Bioinformatics Center; https://www.kegg.jp/). Subsequently, the GSVA package
(35) (v1.30.0) was employed for
individual cells to assess pathway activity. The scoring of pathway
activity values was performed, followed by the utilization of the
LIMMA software package (v3.38.3; http://www.R-project.org/) (36) to determine the variance in
signaling pathway activity across distinct groups.
Results
Information on the irradiated
patient
Human PBMCs were collected from an irradiated
patient at different time points (113 and 631 days after
irradiation). The control group included a combination of
peripheral blood samples obtained from 10 healthy individuals. The
irradiated patient had been diagnosed with mild bone marrow acute
radiation sickness. The present study collected peripheral blood
samples from the patient for examination and experimentation.
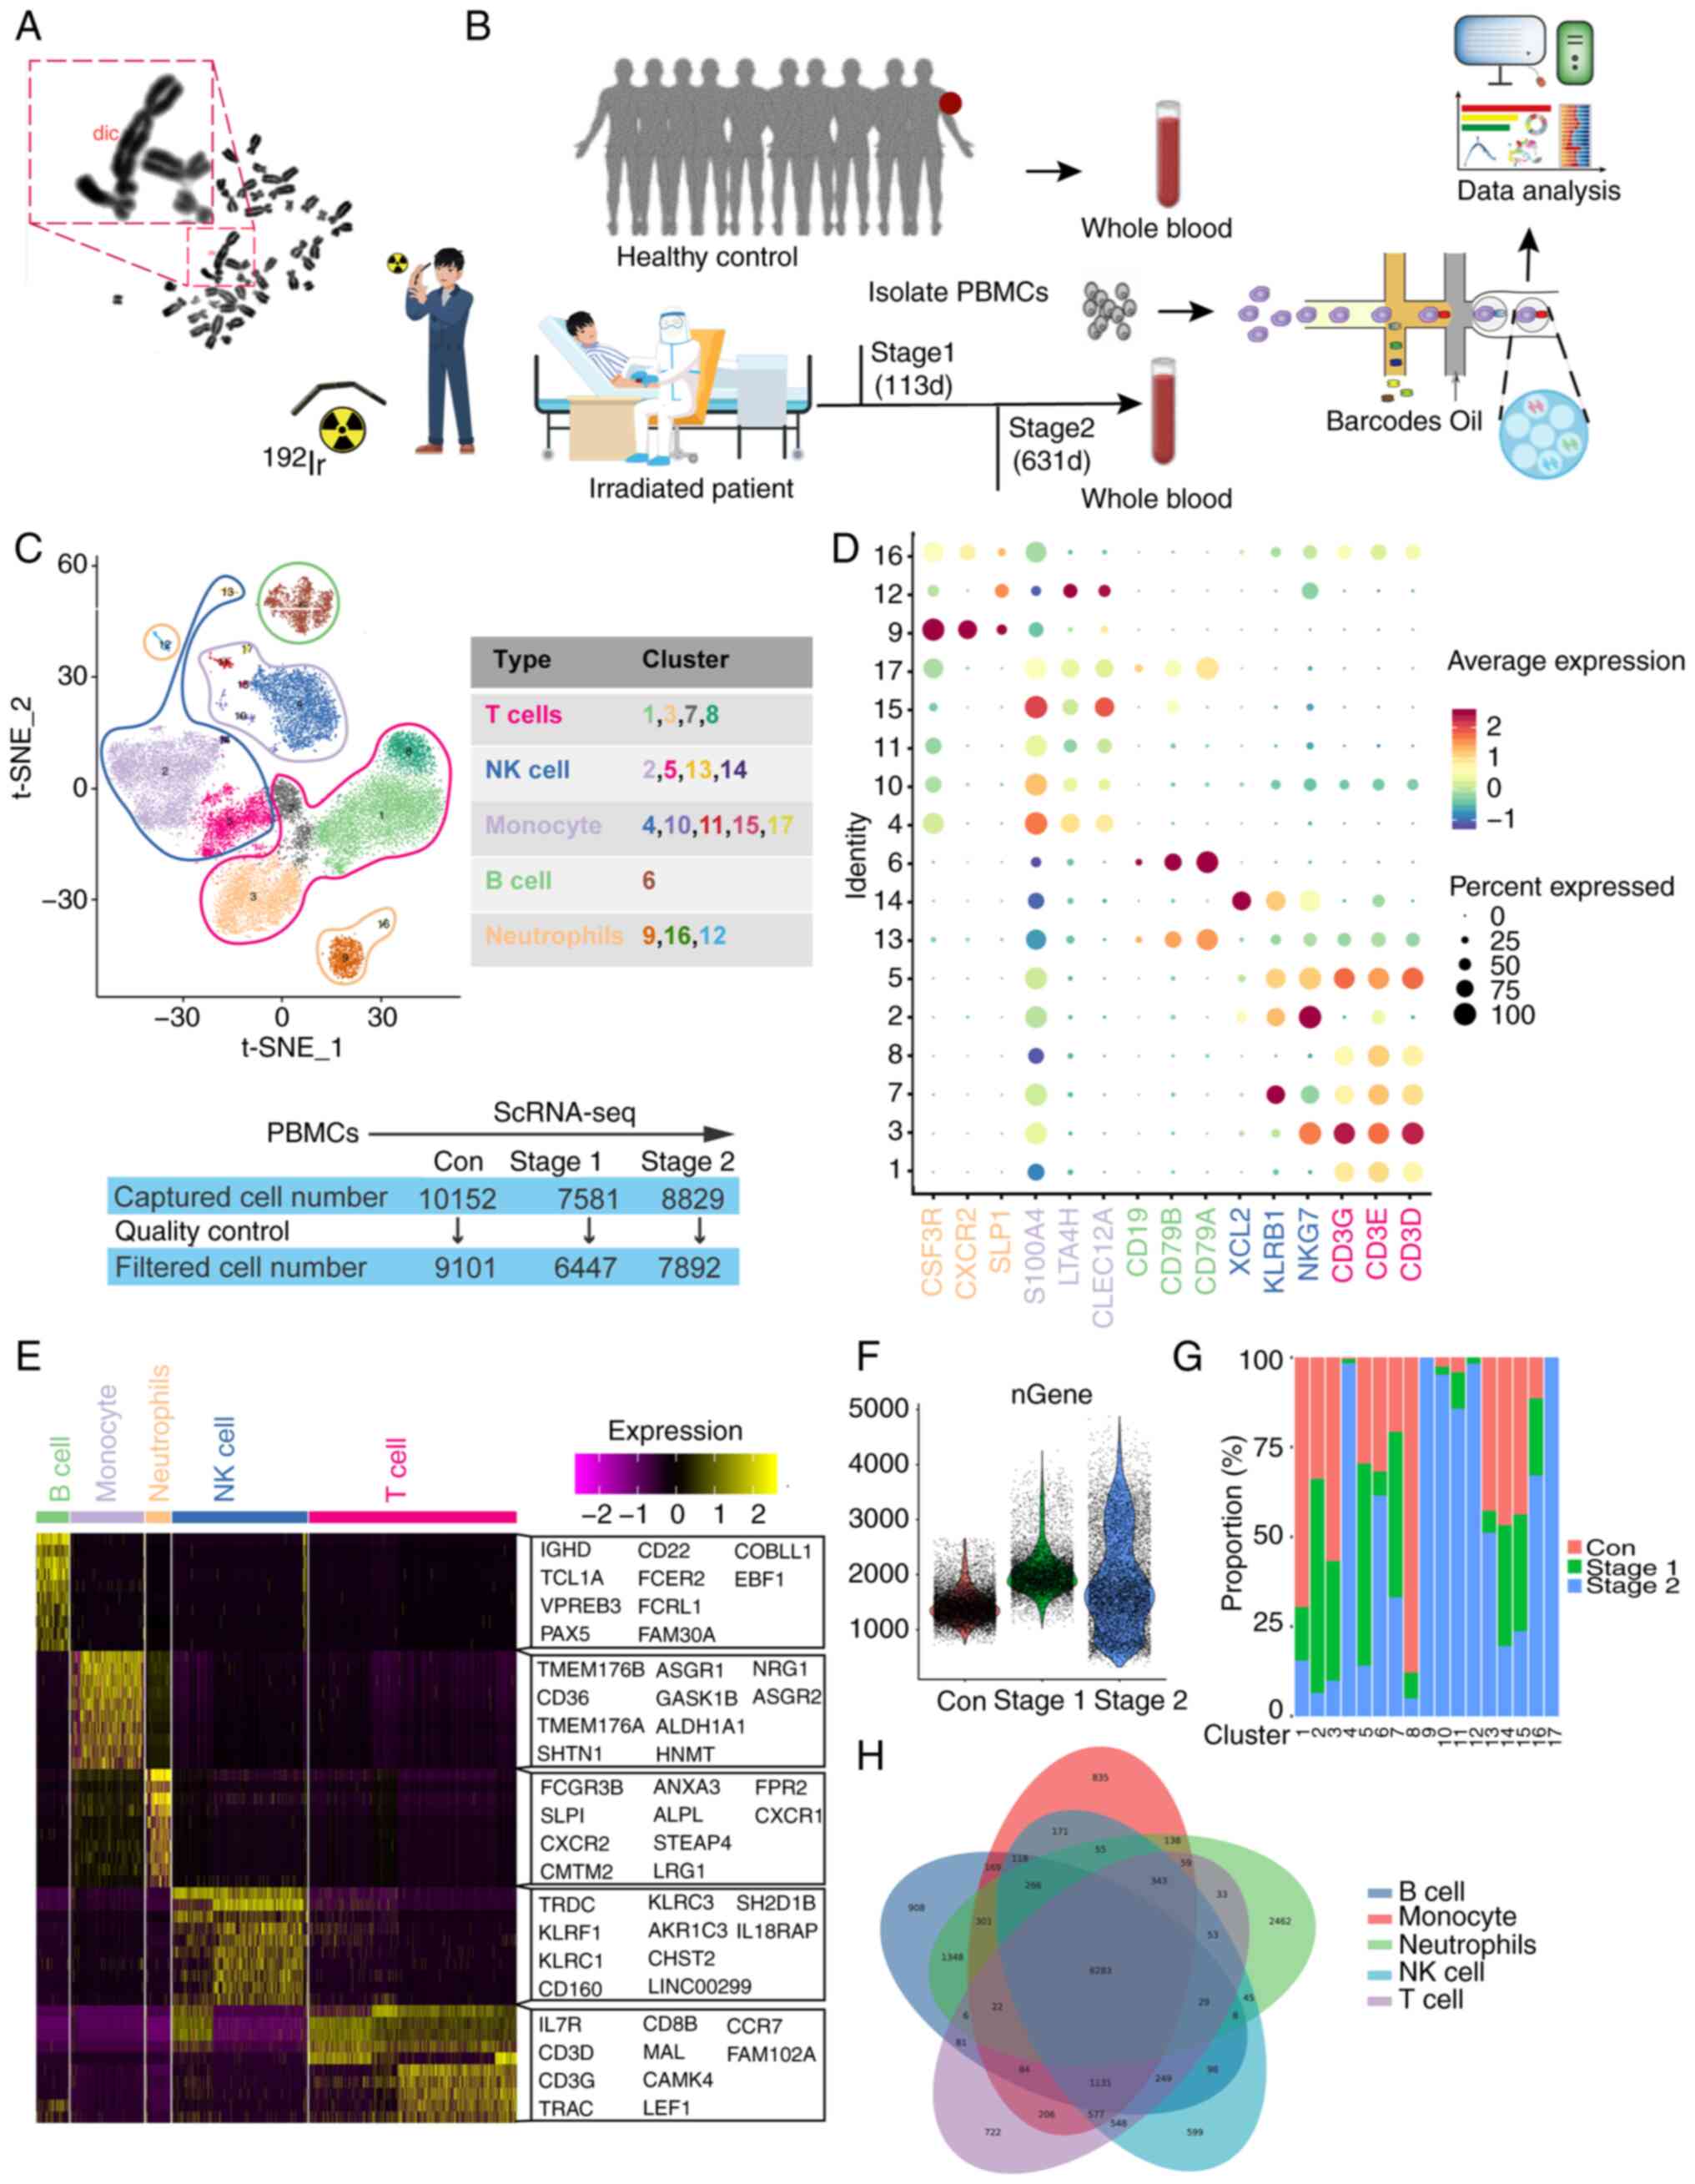
Chromosomal aberrations in peripheral blood lymphocytes were
detected via the peripheral blood lymphocyte culture method. The
overall rate of chromosome abnormalities in patients exposed to
radiation was 0.3%, which was not significantly different from that
in the control group (Fig.
1A).
Analysis of the heterogeneity of PBMC
populations by scRNA-Seq
Subsequently, scRNA-Seq was employed (Fig. 1B) to examine the cellular
transcriptome profile of the PBMCs. Following quality control,
6,447 and 7,892 cells were obtained from the PBMCs of the
irradiated patient on the 113th (Stage 1 ) and 631st (Stage 2) days
post radiation, respectively. Overall, 9.101 cells were acquired
from 10 healthy controls. Visualization analysis via t-distributed
stochastic neighbor embedding (t-SNE) clustering revealed that
23,440 cells from the control, Stage 1, and Stage 2 groups were
categorized into 17 clusters. The results of the subgroup
correlation analysis revealed that the 17 clusters were roughly
separated into 5 major cell types (Fig. 1C), including T cells, NK cells, B
cells, neutrophils and monocytes. The markers for each cluster and
cell type are shown in Fig. 1D
(37). A comparison of each
cluster was conducted to identify distinct gene signatures, and the
heatmap shown in Fig. 1E displays
the top 10 genes that were significantly differentially expressed
(SDE) within each cluster. The cells were all sorted according to
the quantity of genes detected, with an average of ~2,000 genes
recognized in the three samples. In Stage 2, more genes were
detected relative to the remaining samples, as illustrated in
Fig. 1F. Separate analysis of the
two groups revealed the presence of all clusters and comparable
cluster marker gene expression in each group, with significant
differences observed in cell numbers. It was hypothesized that T
cells, B cells and NK cells were the main cells involved in
radiation injury. A statistical analysis of the percentages of the
five types of PBMCs was subsequently conducted (Fig. 1G) and the results revealed that the
percentages of T cells, B cells and NK cells significantly changed
after exposure; thus, these cells may be the main cells involved in
the radiation process.
Ionizing radiation is recognized for its
immunomodulatory properties, which influence both localized and
systemic immune responses. The subsequent investigation focused on
the immune cell distribution among patients in Stage 1 and Stage 2,
in addition to healthy control subjects, as demonstrated in
Fig. 1G. Notably, certain immune
subpopulations, including B cells and NK cells, were found to be
more prevalent in Stage 2 patients and healthy controls than in
Stage 1 patients. This observation suggested a gradual restoration
of the typical circulating levels of these immune cell types in
irradiated patients towards a distribution akin to that of healthy
individuals. T cells were present in the control group but few in
the Stage 1 and Stage 2 patient. Some cell subsets, such as
monocytes and neutrophils, were very few in number between the
control and Stage 1 groups (Fig.
1G). Examinations revealed the existence of two distinct
cellular subsets that were specifically identified in the patient
subjected to irradiation, comprising a B-cell subfraction and an NK
cell contingent. Given the aim of the present study of
radiation-sensitive cell populations of irradiated patients, the
preponderance of the subsequent examinations was directed towards a
detailed evaluation of these particular cell groups.
A Venn diagram revealed the numbers of all expressed
genes for each cell type. Omitting the regions of overlap, a total
of 599 distinct genes were identified in NK cells, 908 genes in B
cells, 835 genes in monocytes, 2,462 genes in neutrophils and 722
genes in T cells (Fig. 1H). As
expected, the KEGG pathway analysis of the variably expressed genes
among disparate groups revealed that the upregulated genes, as
ascertained by scRNA-Seq, were associated with notably increased
pathways, indicative of comprehensive immune system stimulation.
These pathways include pathways related to cell adhesion molecules,
the sphingolipid signaling pathway, platelet activation, the
cytotoxicity mediated by natural killer cells, the signaling
cascade of the T-cell receptor, and the Rap1 signaling pathway
(Fig. S1A and B). The downregulated pathways included
ribosome enrichment. Exposure to high levels of ionizing radiation
has been demonstrated to initiate a profound reorganization of
overall protein synthesis, enabling cellular energy conservation
through the inhibition of unnecessary protein production (38). The process of protein synthesis,
which is inherently energetically costly, results in heightened
sensitivity to external stressors, including exposure to ionizing
radiation (39). Using gene-based
clustering techniques, the analysis identified and stratified the
five cellular subsets within the samples onto a two-dimensional
plane, concurrently illustrating the relative abundance of each
subset across the samples (Fig.
S1C). Overall, the quantitative findings indicated a scarcity
of B cells in Stage 1 and a dearth of NK cells in Stage 2. Among
the PBMCs of Stage 1 - and Stage 2-irradiated patients, the
proportion of T cells was notably lower than that of normal
controls (Fig. S1C).
Analysis of NK cell heterogeneity
NK cells, recognized alternatively as large granular
lymphocytes, constitute a subset of cytotoxic lymphocytes endowed
with the innate capacity to discern and eliminate deleterious
cellular entities in the absence of major histocompatibility
complex molecule participation and antibody mediation, thereby
playing an essential role in innate immune defense mechanisms. The
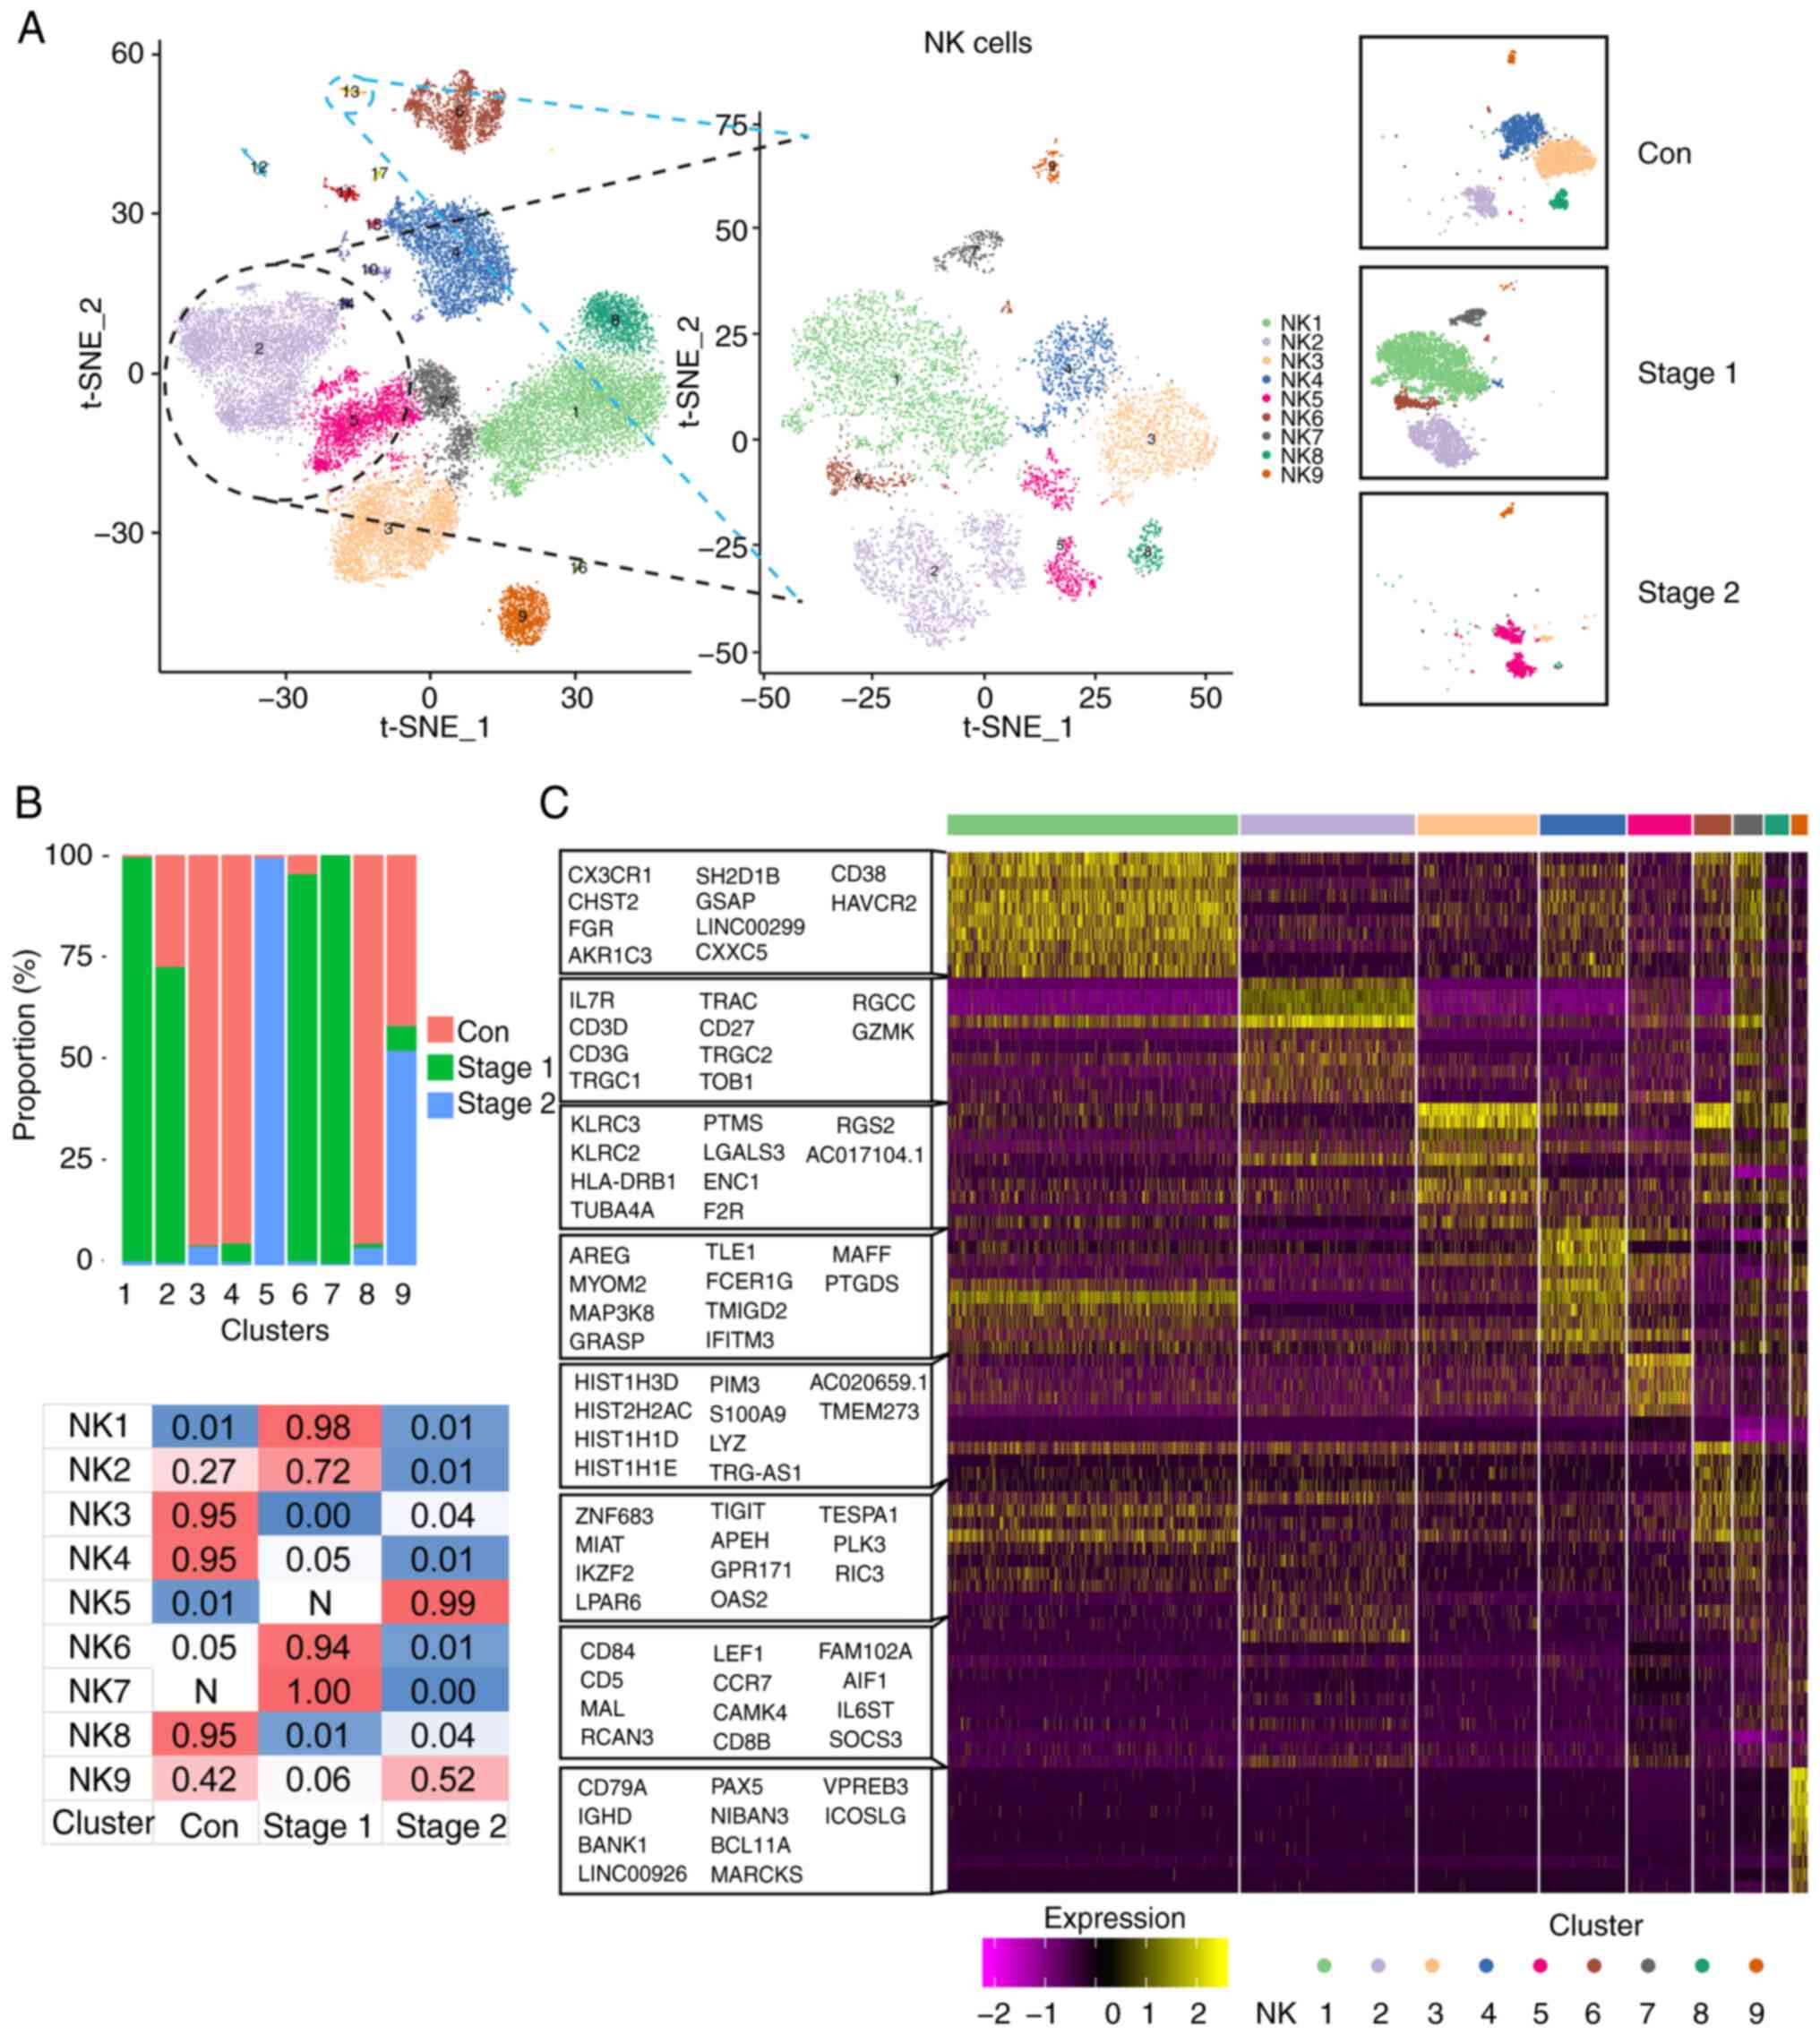
present study further analyzed NK cell clusters by comparing
transcriptome expression patterns between radiation-exposed
patients and control patients. By t-SNE analysis, the participating
NK cells were divided into 9 clusters: NK1 to NK9 (Fig. 2A). The percentage distribution of
each cell subpopulation in each tissue is shown in Fig. 2B. The NK1, NK2, NK6 and NK7 subsets
were present mainly in Stage 1, while the NK5 subsets were present
mainly in Stage 2. To further clarify the characteristics of each
subgroup, the marker genes of each cluster was analyzed and the top
10 genes used to construct a heatmap (Fig. 2C).
The results revealed that the NK2, NK5, NK7, NK8 and
NK9 genes highly expressed IL-7R, CD3D and
CD3G, which are involved in lymphocyte development, T-cell
development and signal transduction. The increased expression of
these genes suggested that these five cell subpopulations may be in
an activated state. KLRC2 and KLRC3 are highly
expressed in NK3 and NK6 cells, which are involved in immune
activation (36).
Functional enrichment analysis of NK
cell subsets
NK cells were most abundant in the Stage 1 subgroup,
mainly in the NK1, NK2, NK6 and NK7 subpopulations. To further
clarify the function and molecular markers of each subpopulation,
the DEGs in each subpopulation were analyzed and further functional
enrichment analysis performed via GSVA (Figs. S2 and 1A). The results revealed that thiamine
metabolism and retinoid metabolism in the NK1 subgroup were
markedly activated. Of intracellular thiamin ~80% is phosphorylated
and most of it is bound to proteins. Most of the thiamine in serum
is bound to proteins, mainly albumin. Thiamin is primarily a
transporter form of vitamins (40), suggesting that the NK1 subgroup is
crucial for energy metabolism. The hematopoietic cell lineage
pathway of the NK2 subpopulation was markedly activated.
Hematopoiesis is initiated by hematopoietic stem cells (HSCs),
which have the potential for self-renewal or progression into
progenitor cells with multilineage potential, such as a common
lymphoid progenitor (CLP) or a common myeloid progenitor (41). A CLP gives rise to the lymphoid
lineage of white blood cells or NK cells and T and B lymphocytes
(42). Staphylococcus
aureus infection and DNA replication pathways were
significantly activated in the NK6 subpopulation. Within the NK7
subpopulation, a multitude of biological pathways exhibited
significant activation. These include the ribosome pathway,
pathways associated with infections by human T-cell leukemia
virus-1, RNA transport mechanisms, thermogenesis, infection by
human immunodeficiency virus-1, the T-cell receptor signaling
pathway, oxidative phosphorylation and infection by Epstein-Barr
virus, among others. The significant activation of viral
infection-related signaling pathways in human blood after radiation
exposure may indicate a possible relationship between human
exposure to irradiation and exposure to infection.
Analysis of the developmental
trajectories of NK cell subsets
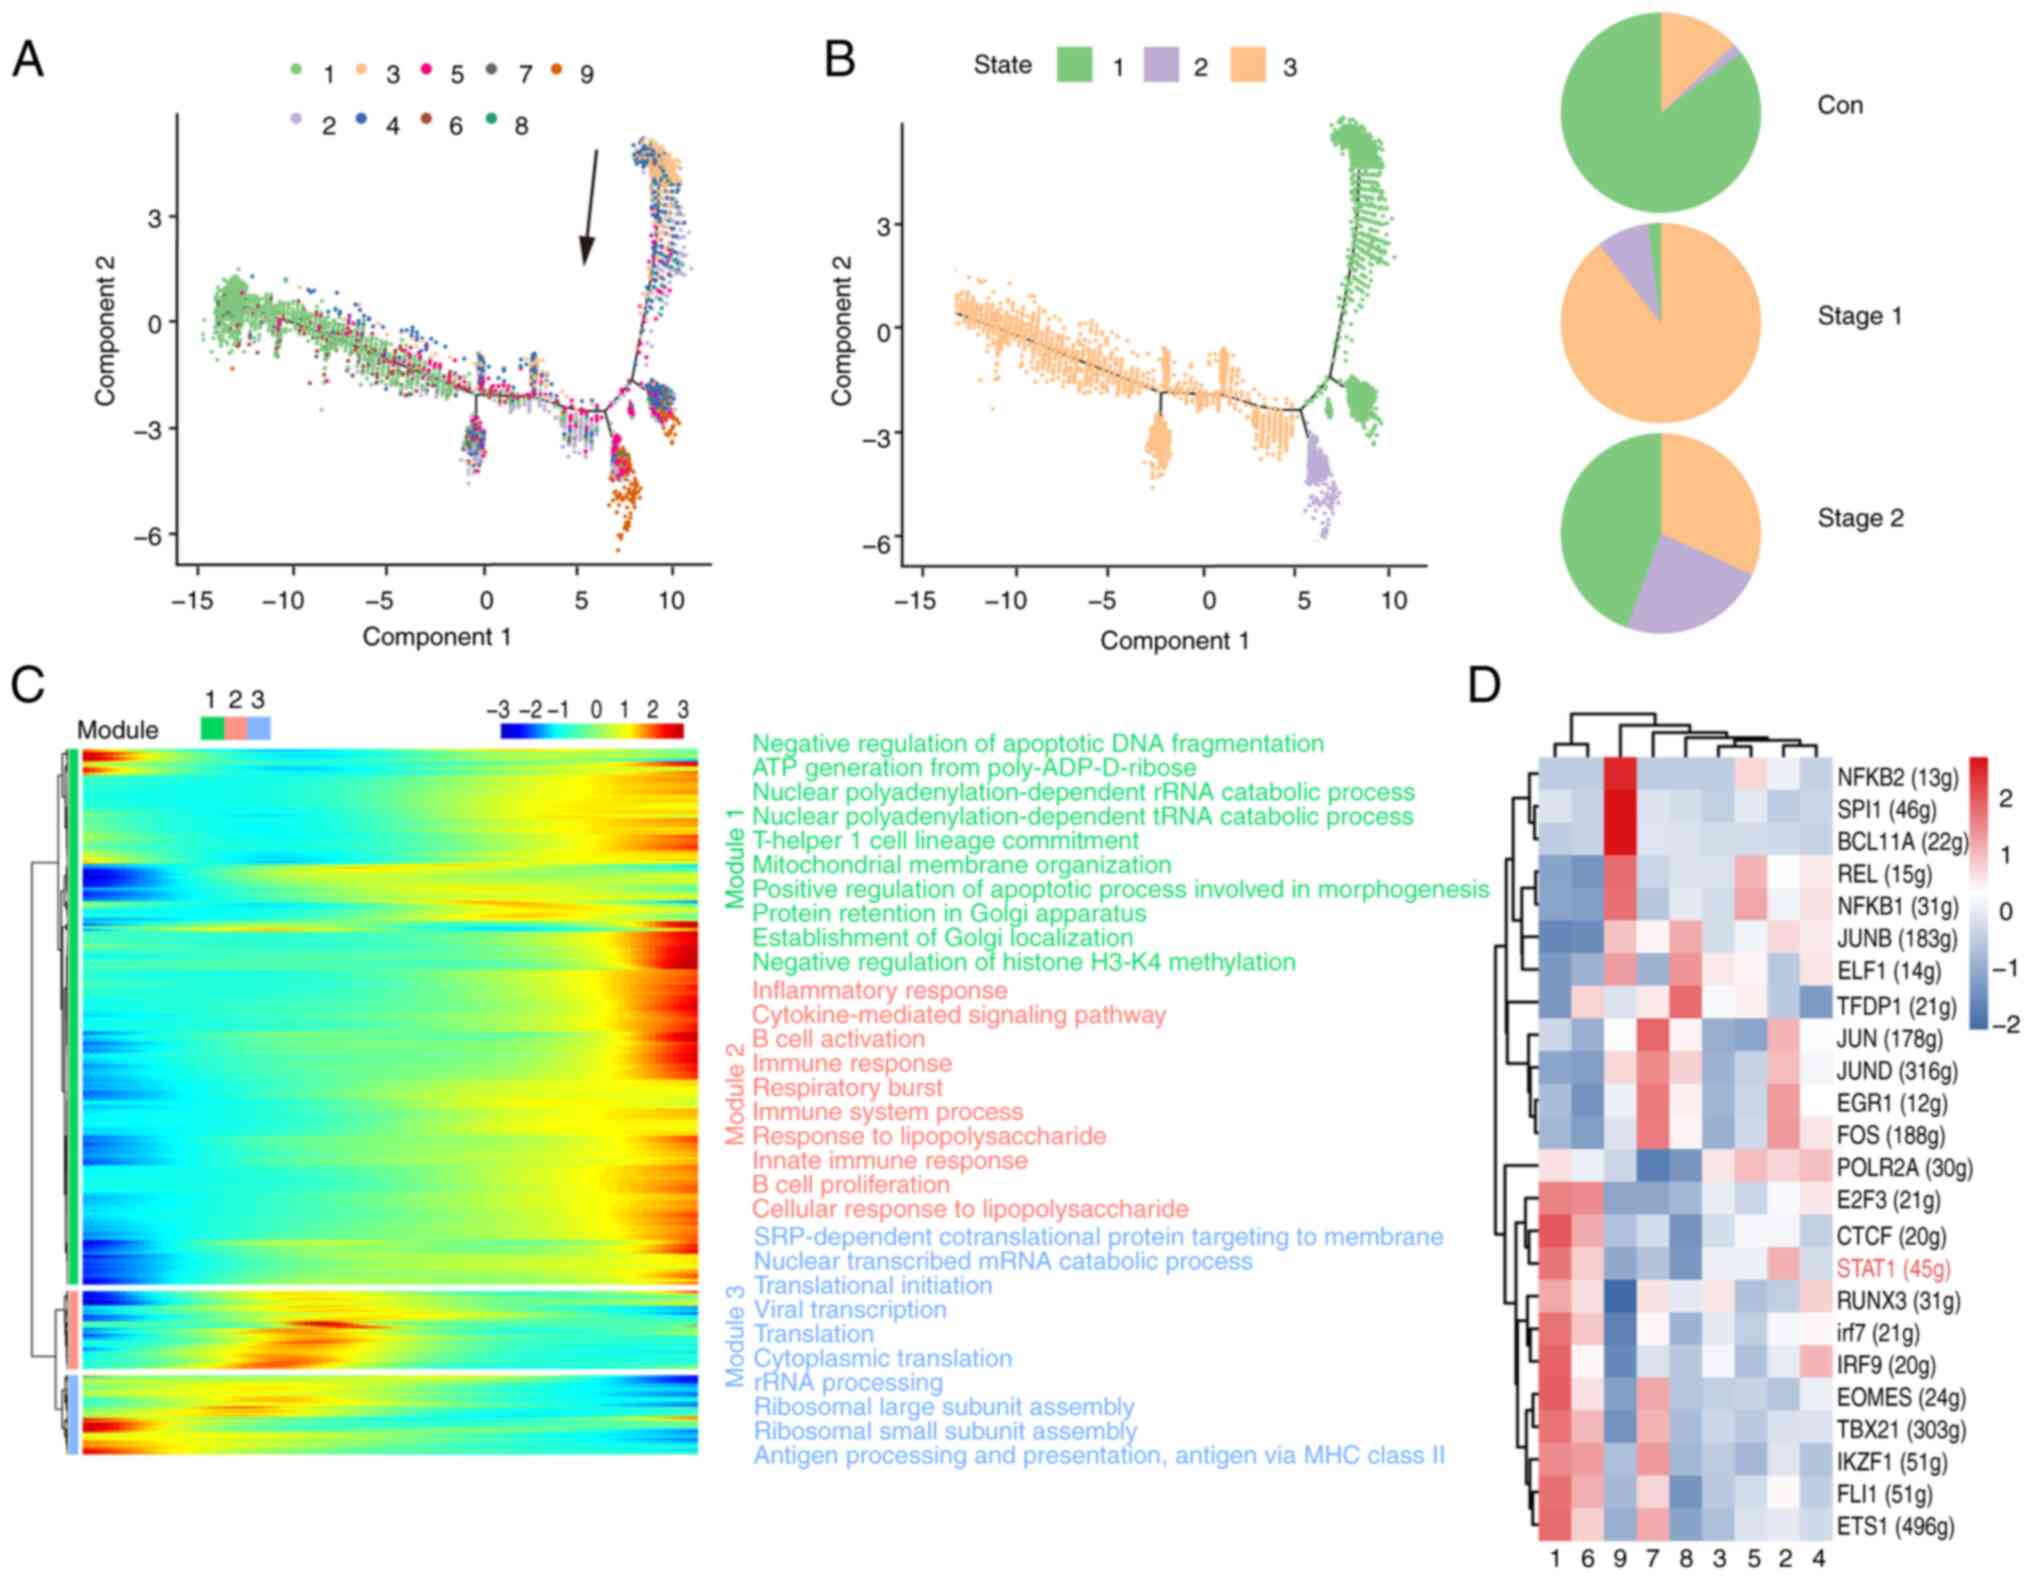
To delve deeper into the developmental trajectory of
cellular subsets, a pseudotime sequence analysis was conducted
utilizing the scRNA-Seq dataset with the Monocle 2 algorithm.
Fig. 3A shows the results of a
trajectory analysis of nine relevant clusters and indicates the
pseudotime direction. The trajectory of pseudotime encompasses
three distinct stages, with various cellular clusters distinctly
positioned along different points of the pseudotemporal continuum
(Fig. 3B). The NK1, NK6 and NK7
subsets were in the late stage. The NK2, NK3, NK4, and NK5 subsets
were identified at divergent stages along the pseudotemporal
trajectory. The NK8 and NK9 subsets were in the early stage. The
control cohort predominantly occupied the initial phase of the
pseudotime trajectory, which was predominantly localized within
State 1. The Stage 1 cohort was predominantly situated at the
terminal stage of the pseudotime trajectory, with the majority of
its distribution concentrated in State 3. The Stage 2 group was in
the whole state of the pseudotime path. NK cells recovered in the
Stage 2 group. For the purpose of examining the pseudotime patterns
of definitive marker genes, a selection comprising the signature
genes characteristic of each respective cluster was made. As shown
in Fig. 3C, the heatmap of
pseudotime can be classified into three modules for the marker
genes. Module 1 is related mainly to apoptosis and transport and
increases gradually with pseudotime. By contrast, module 3
decreased at the end of the pseudotime axis and is related mainly
to ribosome processing, antigen presentation and translation. The
expression of all the marker genes increased and then decreased as
the pseudotime increased in module 2. This is related mainly to the
inflammatory response and immunity. The data of the present study
revealed dynamic gene expression profiles during the different
stages of NK cells.
Transcription factors (TFs) and their regulated
genes form intricate networks that dictate cell identity. The
present study applied single-cell regulatory network inference and
clustering (SCENIC) to deduce the regulon activities of the NK cell
clusters (Fig. 3D), identifying
key regulators and their targets. Fig.
2A shows that the number of cells in the NK1, NK2, and NK6 cell
subpopulations significantly increased in Stage 1. The STAT1
signaling pathway was identified as the most actively regulated
pathway in NK1, NK2 and NK6 cells (Fig. 3D). STAT1 plays a critical role in
the development and functionality of NK cells, influencing various
aspects such as maturation, survival, and proliferation. Activation
of STAT1 can enhance the cytotoxicity and cytokine production
capacity of NK cells (43). These
results suggested that STAT1 may act as an essential driver of
irradiation in NK cells.
Analysis of B cell heterogeneity
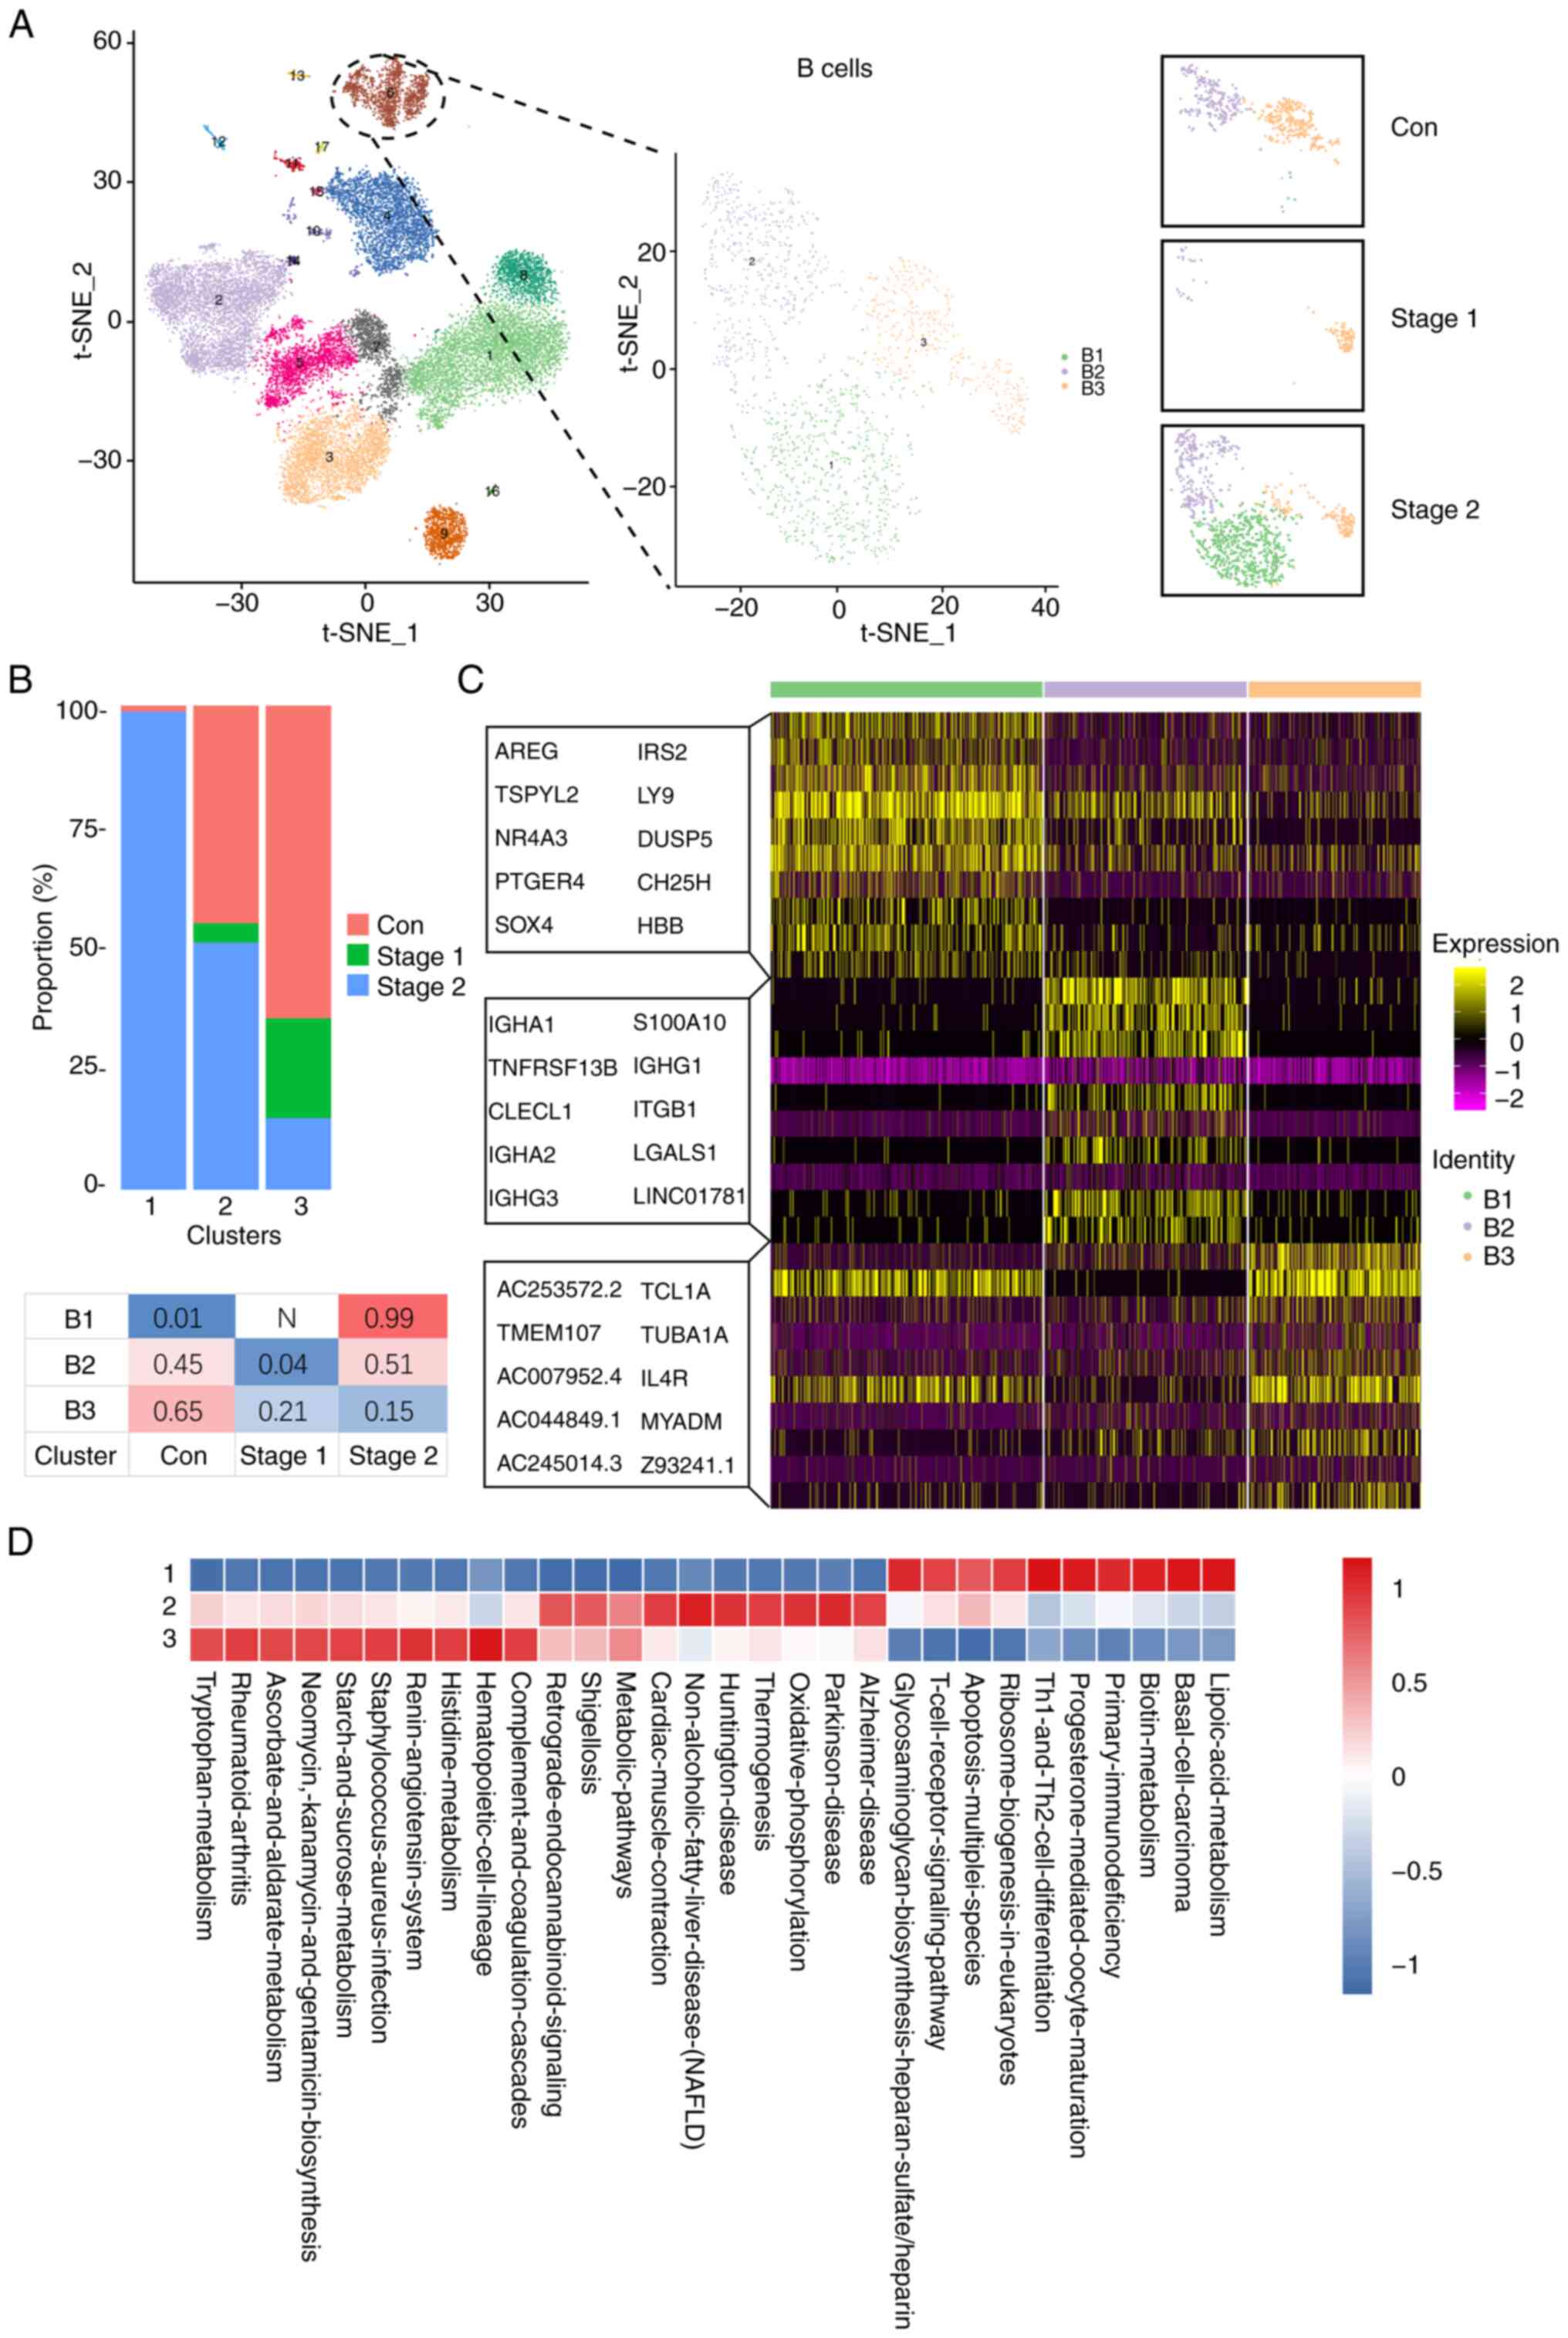
The participating B cells were divided into three
clusters, B1-B3 (Fig. 4A).
Statistical evaluation of B cell cluster proportions revealed a
post irradiation decline followed by recovery to baseline two years
postexposure in the irradiated cohort. The percentage distribution
of each cell subpopulation in each tissue is shown in Fig. 4B. The B1 subset was predominantly
observed in Stage 2. The B2 subset was present mainly in the Stage
2 and the control groups. The B3 subset was present mainly in the
control group, and a lower amount was also present in Stage 1 and
Stage 2. To further clarify the characteristics of each subgroup,
the marker genes of each cluster were analyzed and the top 10 genes
used to construct a heatmap (Fig.
4C). The findings indicated that the B2 and B3 subgroups
presented increased expression of genes associated with
inflammatory and immune response pathways, including IGHA1,
IGHG1, TUBA1A and MYADM. Moreover, the B1
subgroup presented significant upregulation of genes such as
AREG, IRS2, LY9, NR4A3 and DUSP5. These genes
associated with proliferation and differentiation suggest that this
B1 subpopulation is in an activated state. Compared with those in
the control and Stage 1 groups, the number of B cells was greater
in the Stage 2 group, whereas 99% of the B1-cell subpopulation was
present in Stage 2. To further clarify the function of each
subgroup, functional enrichment analysis was conducted via GSVA
with the Gene Ontology (GO) database as a reference (Figs. 4D and S3A). The results revealed that
metabolism, Th1 and Th2 cell differentiation, ribosome biogenesis
and T-cell receptor signaling pathways were significantly activated
in B1-cell subpopulations. Oxidative phosphorylation, thermogenesis
and metabolic pathways were significantly activated in B2 cell
subpopulations. Significant activation of metabolism-related
pathways was observed in the B3 cell subpopulation.
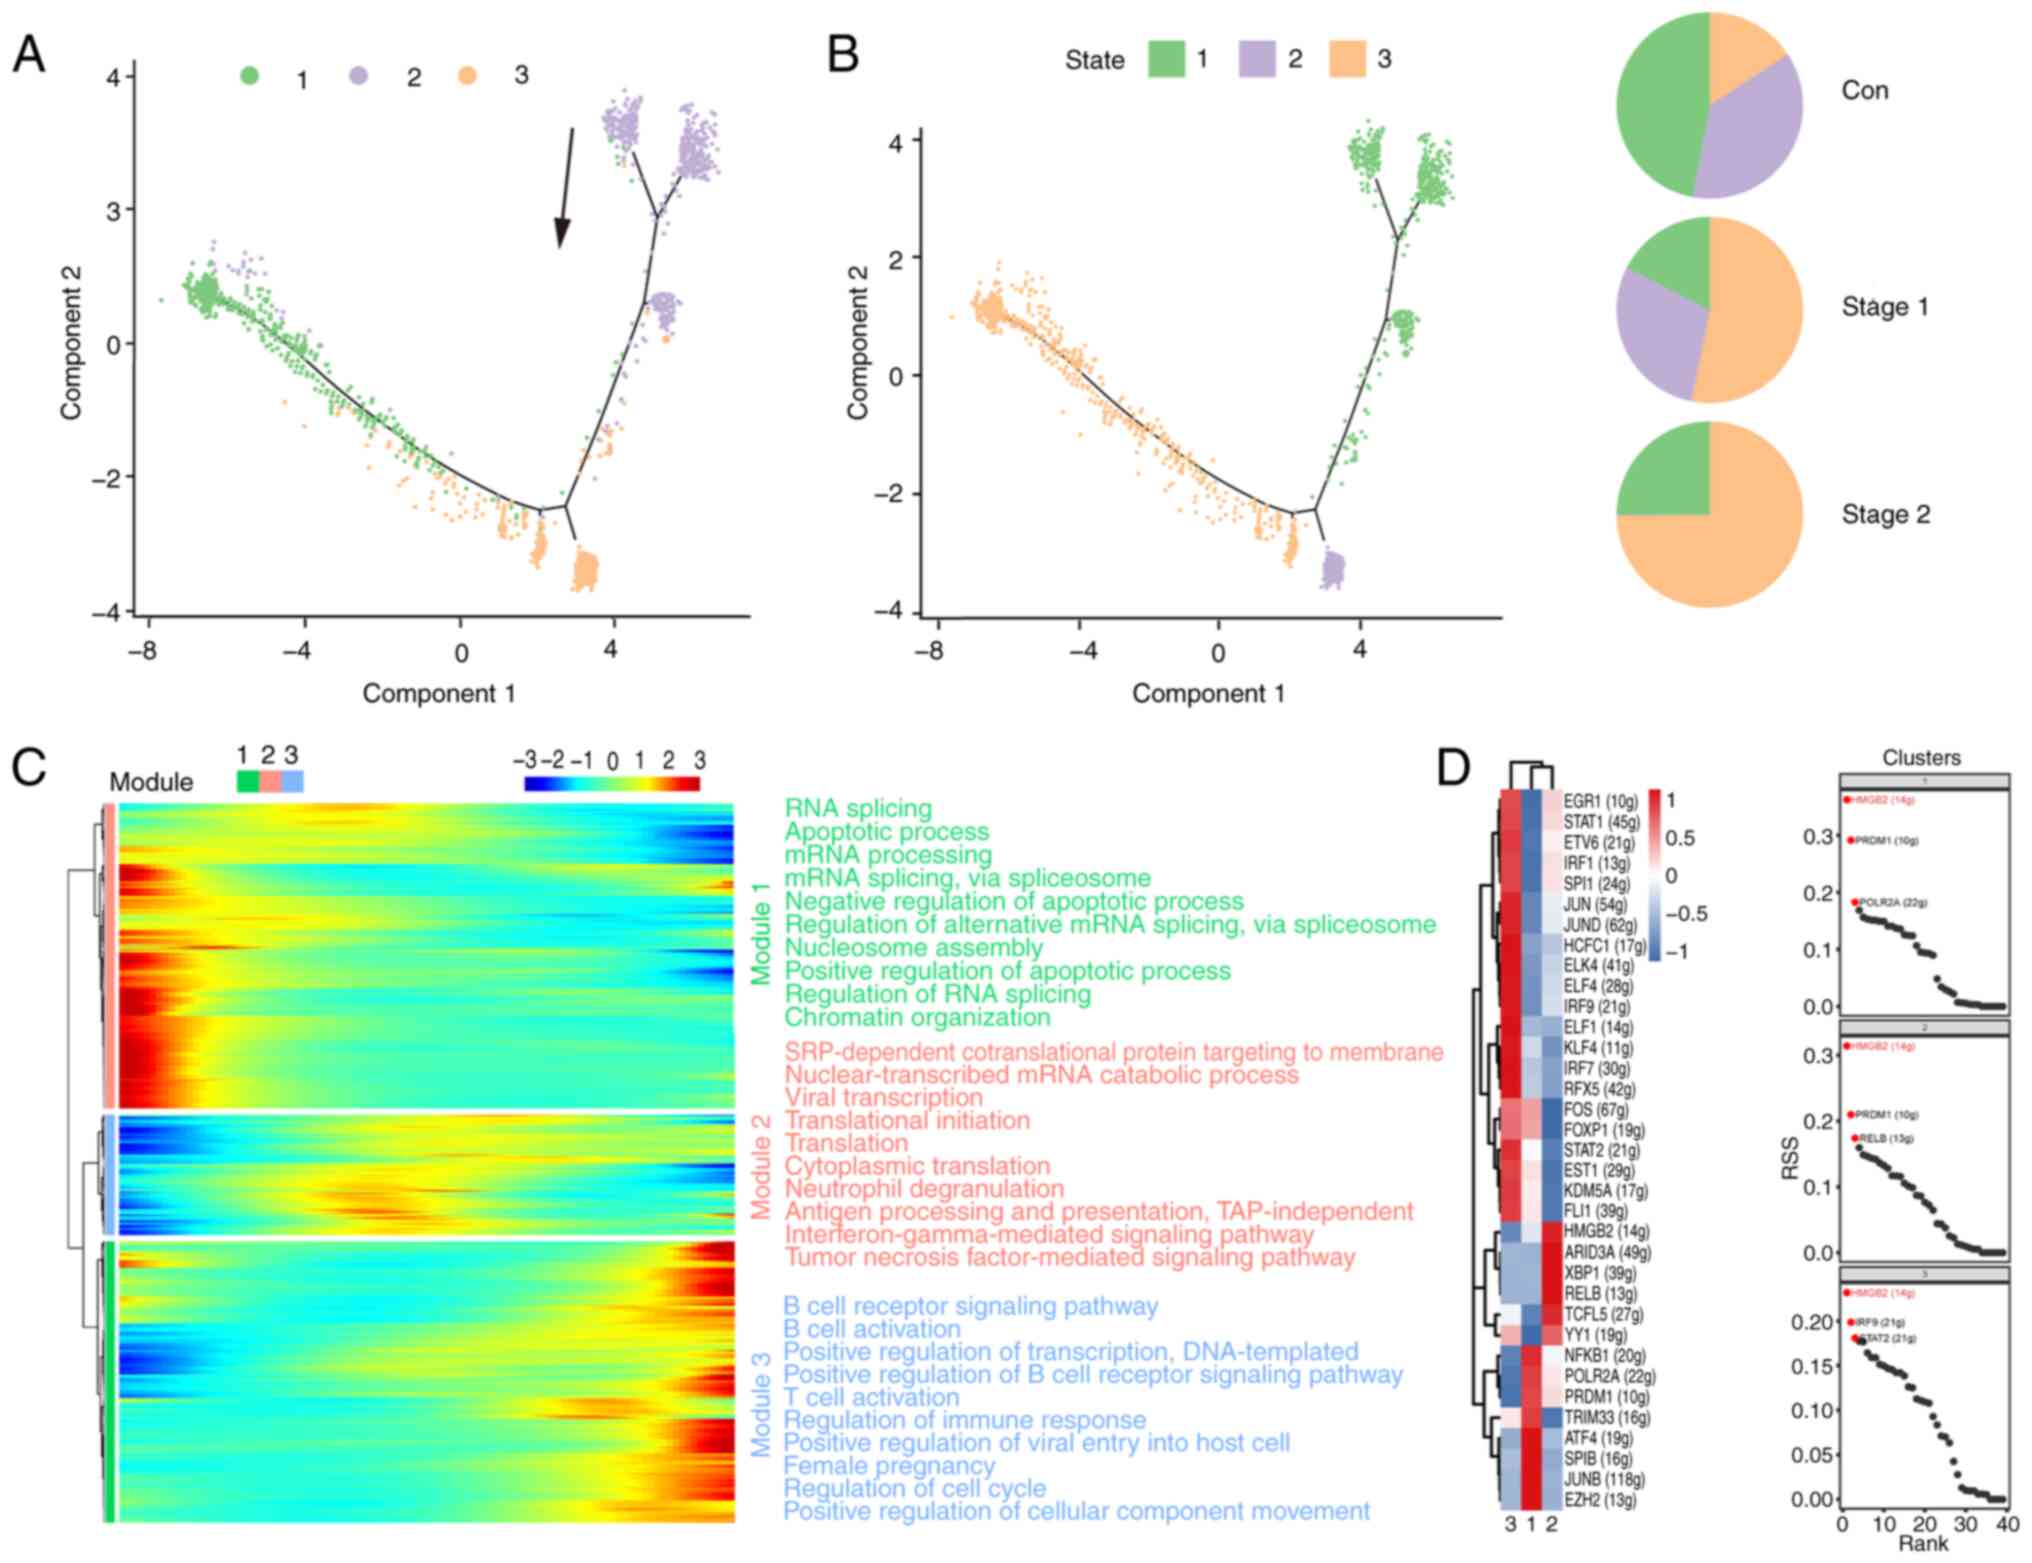
Analysis of the developmental
trajectories of B cell subsets
To further analyze the evolution of the cell
subsets, pseudotime sequence analysis was performed via Monocle 2
software. Fig. 5A shows the
results of trajectory analysis of three relevant clusters, and
Fig. 5B shows the direction of
pseudotime; the black arrow signifies the initiation and
progression direction of the trajectory. The pseudotime trajectory
encompasses three distinct stages, with various cell clusters
distinctly aligned at the corresponding points along the path
(Fig. 5B). The B1 subsets were in
the late stage. The B2 subsets were mostly in the early stage. The
B3 subsets were mostly in the middle stage. The control group was
mainly in the early stage of the pseudotime path and was mainly
distributed in States 1 and 2. The Stage 1 group was mainly in the
last stage of the pseudotime path and was mainly distributed in
State 3. The Stage 2 group was mainly in the last stage of the
pseudotime path and was mainly distributed in State 3. For the
analysis of pseudotime trends among marker genes, key genes were
identified within each cluster. Fig.
5C presents a heatmap indicating that these gene patterns can
be divided into three modules. In module 1, which is associated
with apoptosis and RNA processing, marker gene expression decreases
towards the terminus of the pseudotime axis. Conversely, module 3
displays a gradual increase in marker gene expression with
increasing pseudotime. Module 3 is related mainly to B-cell
activation, B-cell receptor signaling activation and immune
regulation. In the second module, the expression of all marker
genes increased and then decreased as the pseudotime increased.
Module 2 is related mainly to mRNA catabolism, the
interferon-γ-mediated signaling pathway and the tumor necrosis
factor-mediated signaling pathway. The data revealed dynamic gene
expression profiles during different stages of B cell development.
The GO and KEGG analyses revealed enriched functions and pathways
of the SDE genes (Fig. S3B).
These findings showed the dynamic profiling of gene expression at
631 days following radiation exposure and imply that the
deregulation of multiple pathways is related to radiation
exposure.
Transcription factors, along with the genes they
regulate, form a sophisticated network that dictates cell identity.
The present study conducted SCENIC analysis to deduce the activity
levels of regulons within B cell clusters, as depicted in Fig. 5D. The numbers of different B cell
subpopulations changed after irradiation, but the regulon-specific
sorting results shown in Fig. 5D
revealed that HMGB2 was consistently the top protein. HMGB2 is a
member of the high mobility group protein family. HMGB2 is
associated with the activation, differentiation and function of B
cells through multiple mechanisms. Although there are few direct
studies, HMGB2 may play an important role in regulating B
cell-mediated immune responses (44). These results suggested that HMGB2
may act as an essential driver of B cells during radiation
exposure.
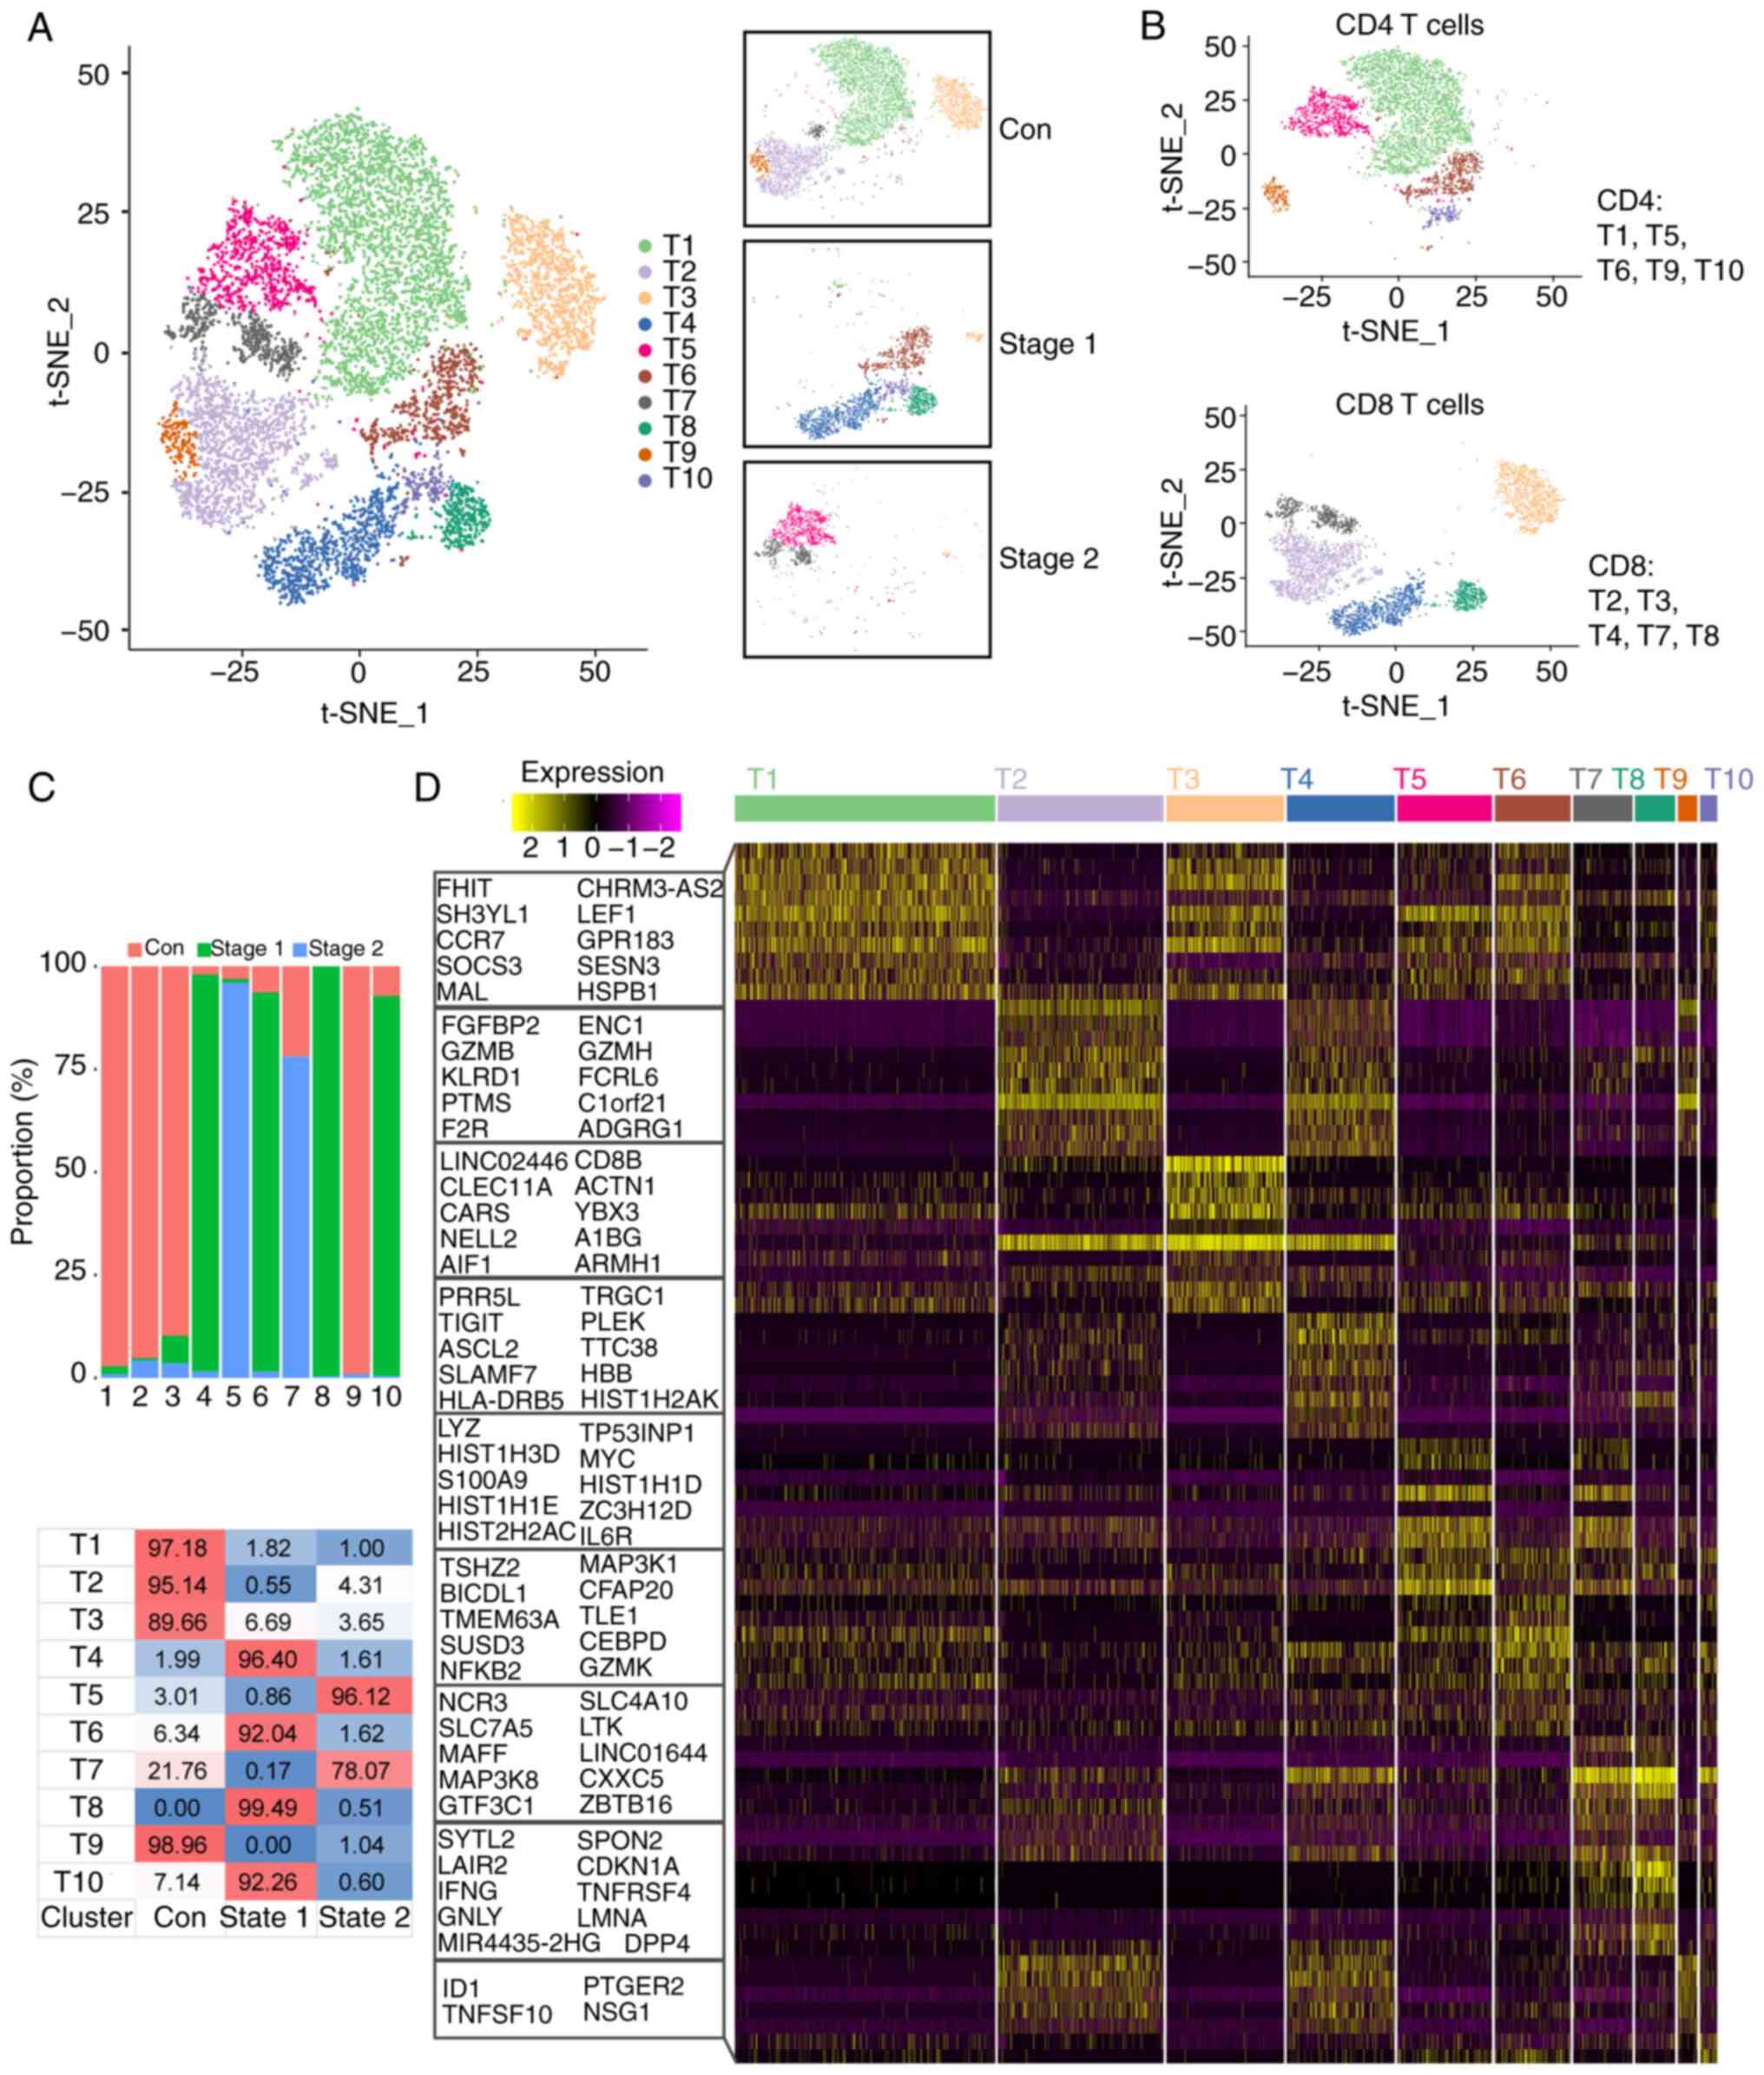
Analysis of T cell heterogeneity
By reanalyzing T cell subsets, the present study
found that T cells could be divided into 10 clusters (T1-T10;
Fig. 6A). The T cells were divided
into CD4+ T cells and CD8+ T cells, as shown
in Fig. 6B. CD4+ T
cells are also part of the adaptive immune system, where they
assist in coordinating the immune response by stimulating other
immune cells, such as macrophages, B cells, and CD8+ T
cells, to fight infection. Statistical analysis was conducted on
the proportion of each cluster of T cells, and the results revealed
that the number of cells in the Stage 1 and Stage 2 groups
decreased after irradiation but did not return to normal levels. In
the control group, the T1, T2, T3 and T9 subsets accounted for a
large proportion. In the Stage 1 group, the T4, T6, T8 and T10
subsets accounted for a large proportion. The T5 and T7 subsets
accounted for a large proportion of the Stage 2 subgroup (Fig. 6C). To further clarify the
characteristics of each subgroup, the present study analyzed the
marker genes of each cluster and used the top 10 genes to construct
a heatmap (Fig. 6D). The results
revealed that CD8B was highly expressed in the T2, T3 and T4
subsets. The T2 cell subpopulation also highly expressed
GZMB. The expression of the CEBPD and NCR3
genes was high in the T7 and T8 subpopulations. MAL and
LEF1 were highly expressed at T1, T3, T5 and T6. LMNA
and GZMK were highly expressed in the T10 subpopulation
(Fig. 6D). These preferentially
expressed genes may be associated with cell differentiation.
Functional enrichment analysis of each
subpopulation of T cells
To further clarify the function of each subgroup,
functional enrichment analysis was conducted via GSVA with the GO
database as a reference (Fig.
S4). The T4 subset significantly activated the hematopoietic
cell lineage pathway, and the T6 subpopulation significantly
activated the RNA transport and HIF-1 signaling pathways. The T8
and T10 cell subpopulations markedly activated the IL-17, MAPK and
TNF pathways. The T5 subpopulation showed significant activation of
DNA replication, ribosome biogenesis, metabolism and mismatch
repair pathways. This subpopulation may be related to cellular
repair. The T7 subpopulation of cells significantly activated
cytotoxicity, the cell cycle and the T-cell receptor signaling
pathway.
Analysis of the developmental
trajectories of T cell subsets
For deeper insight into cell subset evolution, a
pseudotime analysis was conducted with the scRNA-Seq dataset using
Monocle 2. Fig. 7A-B shows the
developmental stage of each subpopulation of CD4+ and
CD8+ T cells. In CD4+ T cells, the pseudotime
trajectory is segmented into three stages, with distinct cell
clusters evident at each stage. The control group was mainly in the
early state of the pseudotime path. The predominant distribution of
cells in the control group at the putative time point was State 1.
The T1 subset was the predominant subgroup. The Stage 1 group was
mainly in the last state of the pseudotime path. The predominant
distribution of cells in the Stage 1 group at the initial time
point was State 3. The T6 and T10 subsets were the predominant
subgroups. The Stage 2 group was mainly in the last State of the
pseudotime path. The predominant distribution of cells in the Stage
2 group at the initial time point was State 3. The number of T6 and
T10 subset cells increased after irradiation. The data revealed the
dynamic gene expression profiles of CD4+ T cells after
radiation exposure (Fig. 7C). GO
and KEGG analyses revealed that post radiation exposure, immune
response, apoptosis, and mRNA processing genes were significantly
perturbed.
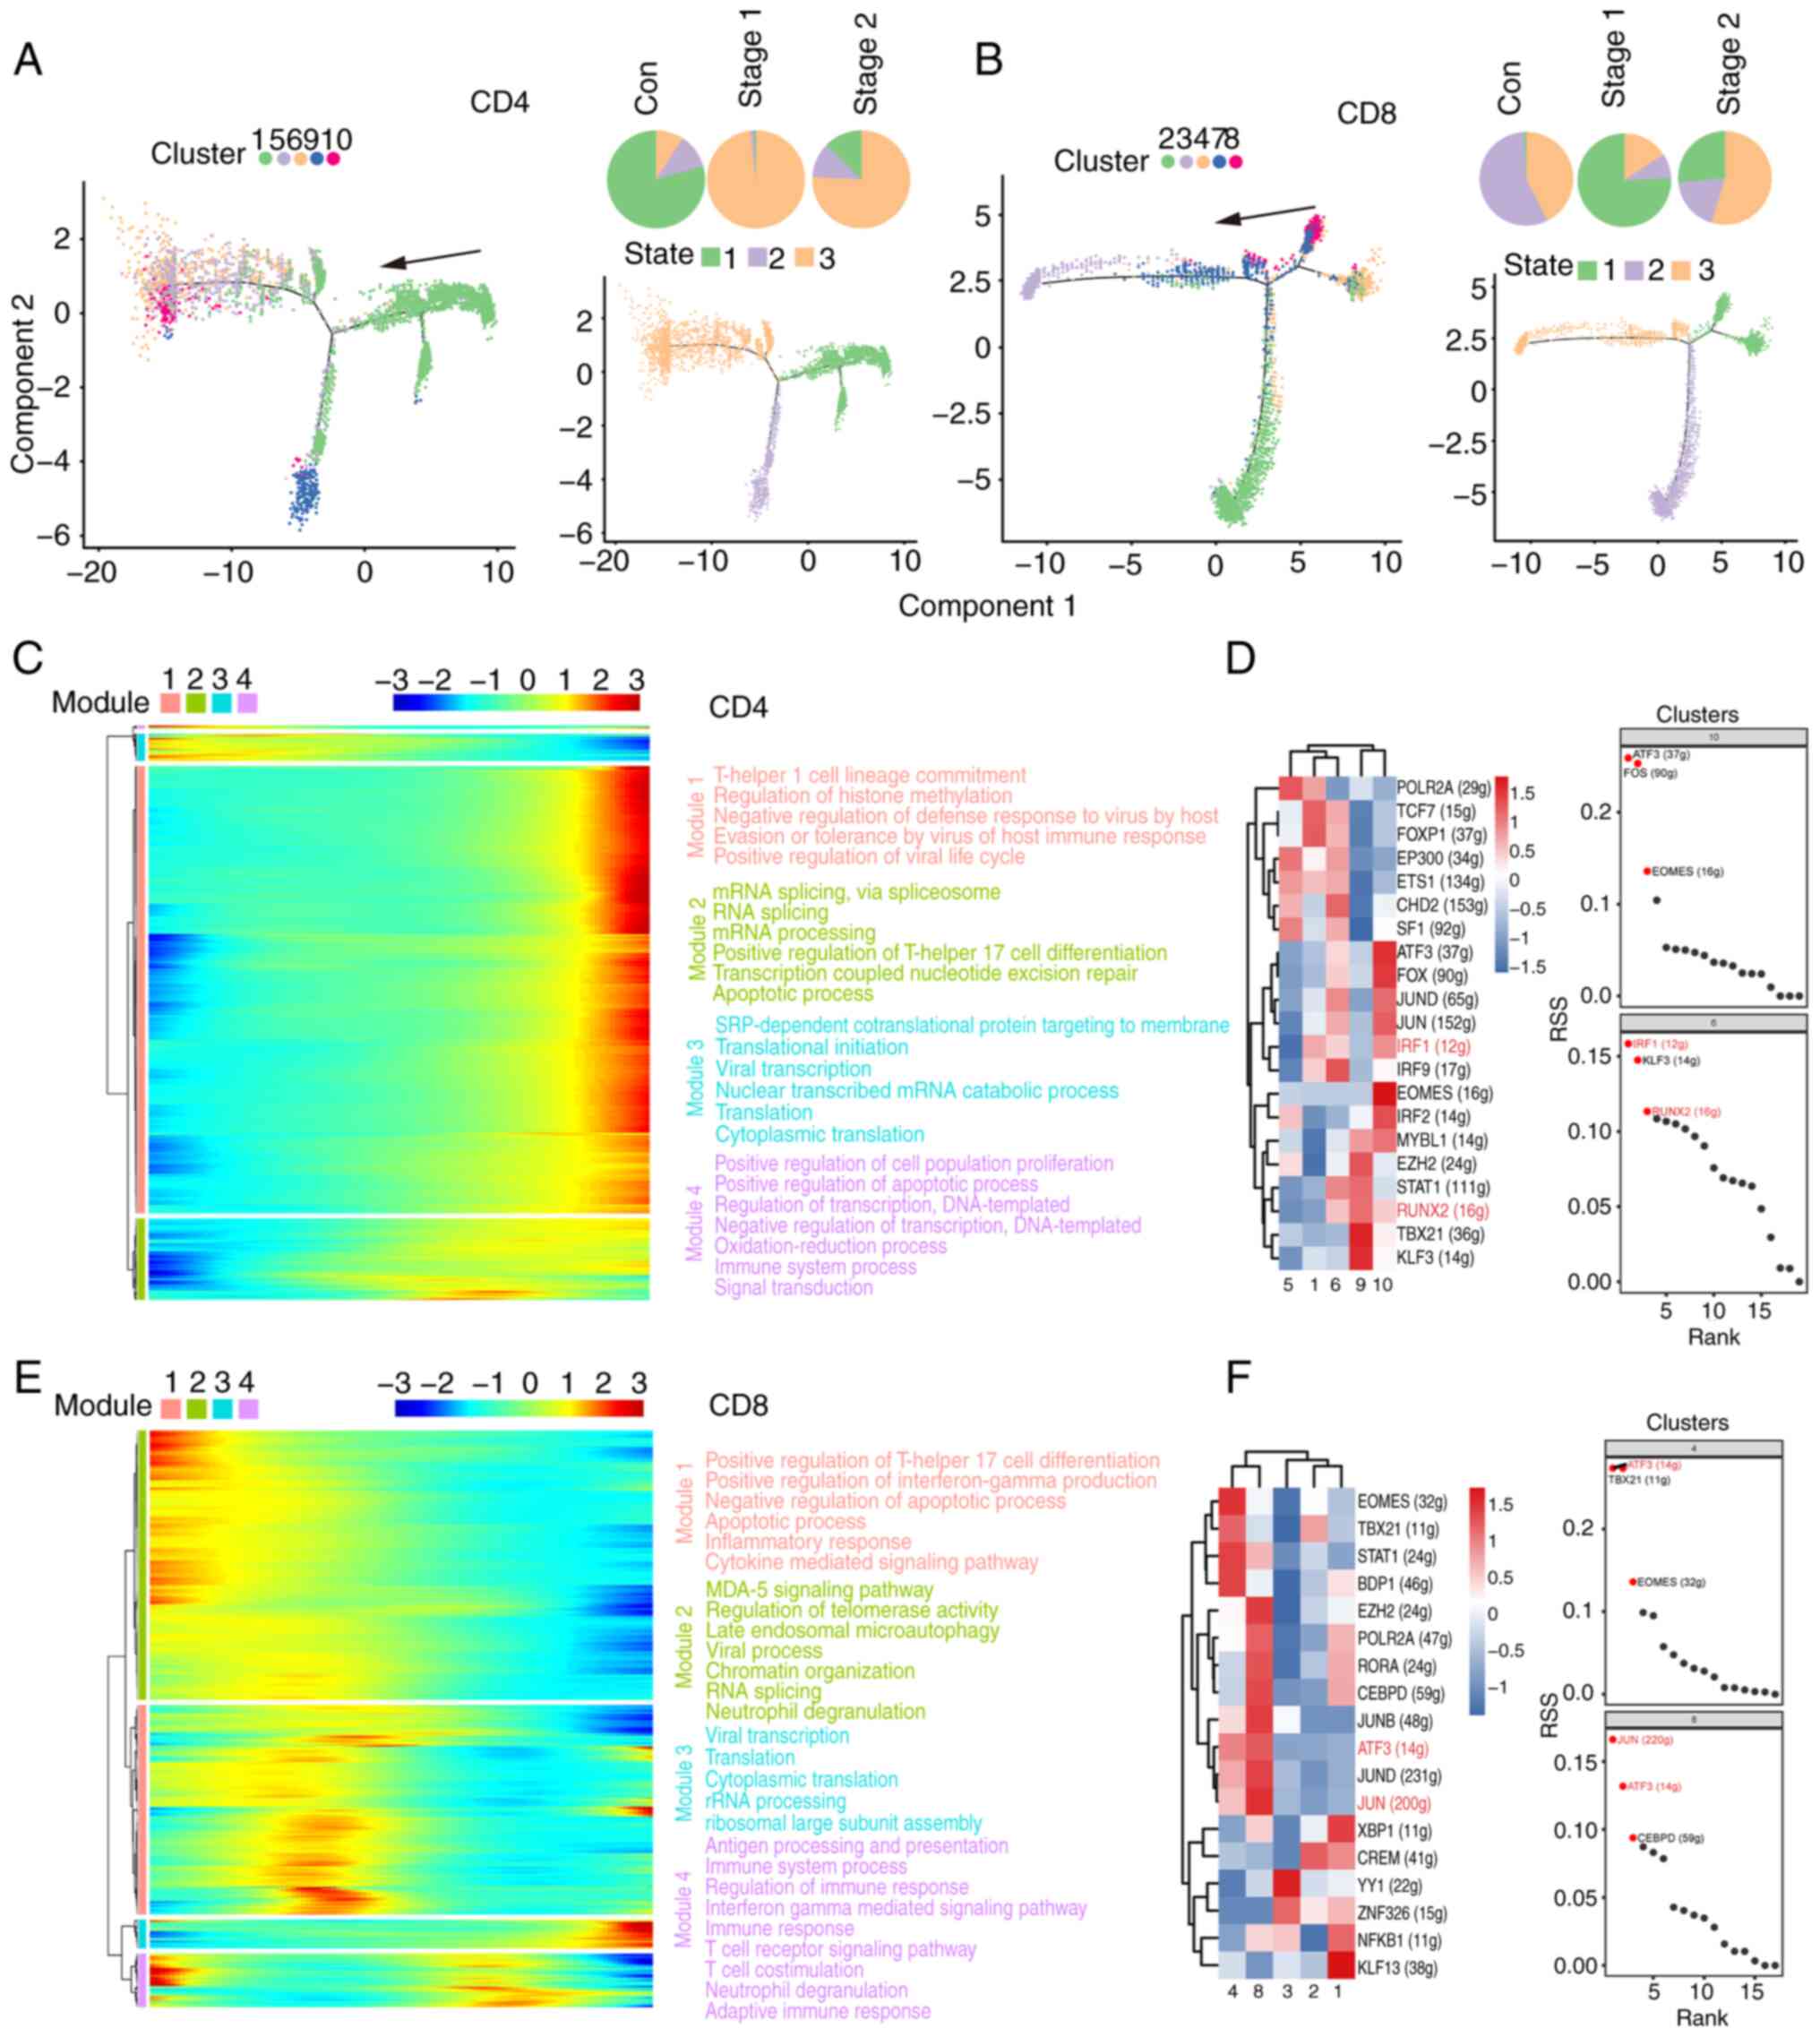 | Figure 7Analysis of developmental pseudo-time
of T cell subsets. (A) Pseudo-time state visualization of CD4 T
cell subclusters, colored by each cluster. Each dot represents a
single cell. The black arrow indicates the start and direction of
the trajectory. Trajectories of CD4 T cells by state, pseudotime
and groups. (B) Pseudo-time state visualization of CD8 T cell
subclusters, colored by each cluster. Each dot represents a single
cell. The black arrow indicates the start and direction of the
trajectory. Trajectories of CD8 T cells by state, pseudotime and
groups. (C) Heatmap displays the SDE genes during progression of
CD4 T cells. Color key from blue to red indicates relative
expression levels from low to high. The GO and KEGG analyses reveal
enriched functions and pathways of the SDE genes. (D and F) Heat
map of RAS activity of regulons in each cell population. Rows
indicate different regulons and columns indicate different cell
populations. The color changes from blue to red indicating a low to
high RAS activity score, with higher RAS scores indicating stronger
regulon activity in that cell population. Regulon specificity
ranking graph. The horizontal coordinates indicate the ranking and
the vertical coordinates indicate the RSS score. Higher RSS may be
associated with regulon specificity in this cell population. (E)
Heatmap displays the SDE genes during progression of CD8 T cells.
Color key from blue to red indicates relative expression levels
from low to high. The GO and KEGG analyses reveal enriched
functions and pathways of the SDE genes. SDE, differentially
expressed; GO, Gene Ontology; KEGG, Kyoto Encyclopedia of Genes and
Genomes; RAS, regulon activity score; RSS, regulon specificity
score; Con, control. |
The intricate gene regulatory network, which is
composed of transcription factors and their regulated genes, is
vital for preserving cell identity (45). SCENIC analysis was applied to
ascertain the regulon activities within CD4+ T cell
clusters, as illustrated in Fig.
7D. CD4+ T cells were increased in the T6 and T10
subsets after irradiation, and the regulon-specific sorting results
in Fig. 7D revealed that IRF1 and
RUNX2 were strongly active in both subsets. IRF1 enhances STAT1 DNA
binding through the promotion of STAT1 phosphorylation, indicating
a potential involvement of IRF1 in a positive feedback mechanism
within JAK-STAT signaling. The RUNX transcription factor family
plays a significant role in T cell development by both positively
and negatively influencing the progression of T cells from double
negative to double positive to single positive stages. IRF1 and
RUNX2 are both crucial in T cell development and functionality,
affecting T cell differentiation and immune responses through the
modulation of gene expression and involvement in signaling pathways
(46). These results suggested
that IRF1 and RUNX2 may act as essential drivers of CD4+
T cells following irradiation.
The CD8+ T cell pseudotime trajectory is
characterized by three phases, with discrete clusters delineated
along its course (Fig. 7B). The
predominant distributions of cells in the control group at the
putative time points were State 2 and State 3. The predominant
distribution of cells in the Stage 1 group at the putative time was
State 1. The number of T4 and T8 subset cells increased after
irradiation. The T4 and T8 subsets were the predominant subgroups.
The predominant distribution of cells in the Stage 2 group at the
initial time point was State 3. The data of the present study
revealed dynamic gene expression profiles of CD8+ T
cells following radiation exposure (Fig. 7E). GO and KEGG analyses highlighted
significant disruptions in the immune response, apoptosis, and
cytokine signaling pathways among genes with dynamic expression
following radiation exposure.
A complex gene regulatory network, which is critical
for cell identity, is formed by TFs and their downstream genes
(47). SCENIC analysis revealed
regulon activities across CD8+ T cell clusters, as shown
in Fig. 7F. CD8+ T
cells were increased in the T4 and T8 subsets after irradiation,
and the regulon-specific sorting results in Fig. 7F revealed that ATF3 and JUN were
strongly active in both subsets. ATF3 and JUN act as transcription
factors that govern the expression of various genes through
heterodimer formation (48). Their
influence on AML cell response to endoplasmic reticulum stress, via
UPR signaling modulation, affects cell viability. These findings
suggested a potential parallel impact of ATF3 and JUN on stress
response and survival in T cells. These two transcription factors
are probably capable of modulating the expression of the identified
genes associated with inflammation. These results suggested that
ATF3 and JUN may act as essential drivers of CD8+ T
cells after irradiation.
Discussion
Over the past few years, the revolution in scRNA-Seq
has enabled unbiased quantification of gene expression in thousands
of individual cells, which provides a more efficient tool to
decipher the progression of human diseases (49). The present study collected PBMCs
and analyzed their profiles via the scRNA-Seq platform (22). It subsequently isolated NK, T, and
B cells from the transcriptomic data and conducted subcluster
analyses to explore their properties. scRNA-Seq revealed
significant heterogeneity in the profiles of these cell subsets
between the irradiated cohort and healthy controls. Following
radiation exposure, the host immune cells exhibited an imbalance,
with reductions observed in certain T cells, neutrophils, and
monocytes. As shown in Fig. S1C,
the numbers of monocytes and neutrophils in the control and Stage 1
groups were notably low, whereas there was a sharp increase in the
numbers of these cells in Stage 2. Conventionally, the blood
half-life of human neutrophils is considered brief, ranging from
4-8 h (50). These cells are
highly susceptible to apoptosis with any manipulation outside the
body. Given the short lifespan of neutrophils in the bloodstream,
the present study suggested that neutrophil precursors nearing
maturation may be more sensitive to radiation, whereas those
further along the lineage demonstrate greater radioresistance. It
has been reported that monocyte chemotactic protein-1 increases in
the serum of individuals exposed to radiation. Additionally, the
reduction in T cell numbers after irradiation is consistent with
the findings of previous studies (39).
NK cells serve as frontline defenders against
infections and malignancies, initiating inflammation through the
release of cytokines and chemokines (50). A notable increase in NK cell
populations is typically observed following irradiation; however,
the dynamics of circulating NK cells after exposure remain poorly
understood. The present study revealed an increase in NK cell
populations (Stage 1) and a decrease in B cells (Stage 2) among
irradiated patients, as confirmed by both transcriptomic profiling
and cell surface marker analysis. Using scRNA-Seq technology, a
transcriptome analysis of PBMCs was conducted and revealed that T
cells, B cells and NK cells may markedly contribute to the immune
response following radiation exposure. Through tSNE analysis,
differential gene enrichment analysis, and other comprehensive
evaluations of PBMCs, it was determined that B cells and NK cells
are the key subsets involved in the radiation response.
Although radiation induces a dose-dependent
reduction in hematopoietic and peripheral immune cells, the
specific phenotypic changes in the cellular and molecular pathways
of PBMCs that persist following radiation injury are less well
understood. The TRGC1 constant region of the T cell receptor
(TR) γ chain plays a role in antigen recognition (51). Γ-δ TRs are capable of recognizing a
diverse array of self- and foreign nonpeptide antigens, which are
frequently expressed at the epithelial interfaces between the host
and the external environment. This antigen recognition triggers
rapid, innate-like immune responses that are crucial for pathogen
clearance and tissue repair (52,53).
AREG is an autocrine growth factor as well as a mitogen for
astrocytes, Schwann cells and fibroblasts. It is related to
epidermal growth factor (EGF) and transforming growth factor alpha
(TGF-α). The protein interacts with the EGF/TGF-α receptor to
promote the growth of normal epithelial cells, and it inhibits the
growth of certain aggressive carcinoma cell lines (54-56).
A previous study indicated that blockade of AREG signaling
is a promising therapeutic strategy to mitigate radiation-induced
kidney fibrosis (57).
Compared with that in nonirradiated individuals, the
number of B cells in PBMCs decreased markedly after exposure to
radiation. For example, NR4A3 plays a role in the regulation
of the proliferation, survival and differentiation of a number of
different cell types and in metabolism and inflammation. By binding
to an NBRE site, SKP2 mediates the proliferation of vascular smooth
muscle, myeloid progenitor cells and type B pancreatic cells and
promotes mitogen-induced vascular smooth muscle cell proliferation
through transactivation of the SKP2 promoter (58,59).
NR4A3 induces apoptosis and inhibits cell proliferation by
increasing intracellular ROS levels. NR4A3 is critical for
increasing the efficacy of radiotherapy in combination with
hyperthermia (60).
Delving into PBMCs provides a clearer understanding
of a patient's immune status, with both diagnostic and therapeutic
value. In PBMCs from the irradiated patient, a significant decrease
in T cell and B cell populations was observed. It was found that
the numbers of CD4+ T cells and CD8+ T cells
were lower in the patient who received radiation. Lower levels of T
cells suggest a role for dysregulated immune responses in radiation
pathogenesis. T cells, especially CD4+ T cells and
CD8+ T cells, play important roles in the immune
response following radiation (7).
Dose-dependent decreases in CD4+ and CD8+ T
cells have been recorded (58).
Ionizing radiation is known to have an immune modulatory effect on
the skin by inducing a T cell response. Low-dose radiation-induced
quantitative and functional alterations in immune parameters were
reported by Ilienko et al (61), who reported decreased
CD4+/CD8+ ratios in those exposed to low-dose
radiation (62). At present, the
enrichment of GO and KEGG genes differentially expressed in B
cells, T cells and NK cells was analyzed in the present study, and
the results indicated a number of similarities between radiation
exposure processes and viral infections and that the underlying
mechanism still needs to be further studied.
Human blood lymphocytes are crucial components of
the immune system and are markedly affected by radiation exposure.
Among cell groups, lymphocytes are particularly sensitive to
radiation and serve as important markers for the early detection of
radiation injury and assessment of exposure levels. Radiation can
alter the radiosensitivity of different lymphocyte subsets,
influencing immune response dynamics. In general, B cells are more
susceptible to radiation than are T cells, whereas NK cells
demonstrate greater resistance (63). These findings are consistent with
the present study. Individuals such as nuclear accident victims,
those exposed to radiation over an extended period, or patients
receiving radiotherapy for tumors often experience severe immune
deficiencies, with changes in lymphocytes playing a key role in
radiation-induced immune damage.
The present study had several limitations, including
a small sample size for scRNA-Seq analysis, which may have affected
the statistical power for differential abundance and expression
analyses. The present study focused on NK, T and B cells without
detailing the transcriptome features of other members (for example,
bone marrow mononuclear cells, neutrophils and monocytes), as well
as changes in inflammatory cytokines. Owing to the specificity of
the samples, the present study lacked flow cytometry results to
verify the clustering of peripheral blood cells together with
single-cell sequencing results. Furthermore, the present study
focused on PBMCs and may not fully represent localized immune
responses. For improved understanding of the relationship between
immune responses of different cell types and radiation, further
research involving a larger and more diverse patient population
with various clinical presentations is necessary.
In conclusion, the present study demonstrated the
differences in several cell subsets between an irradiated patient
and healthy controls via scRNA-Seq technology. Differential cell
subpopulations in PBMCs and preferentially expressed genes in NK
cells and B cells of the irradiated patient were both identified,
which may offer new insights into disease diagnosis and therapeutic
intervention. Limitations exist because longitudinal investigations
to further determine the specific roles of the obtained genes in
the development of irradiation are lacking, which will be addressed
in future clinical and basic research.
Supplementary Material
Verification of the differences in
subsets of PBMCs in irradiated patients. (A) Heat map of
differentially expressed genes in samples from irradiated patient
and normal controls. (B) KEGG analysis of pathways involved in
upregulated genes and downregulated genes. (C) The t.SNE map shows
the different distribution of 6 clusters in Con, Stage 1, and Stage
2. The bars on the right show the number of cells in Con, Stage 1
and Stage 2 for the five cell types. PBMCs, peripheral blood
mononuclear cells; KEGG, Kyoto Encyclopedia of Genes and Genomes;
t.SNE, t.distributed stochastic neighbor embedding; Con,
control.
The potential function of NK cell
subsets. The abscissa represents different cluster information, and
the ordinate is the pathway name. The color from blue to red
indicates the higher enrichment of the pathway in this cluster. The
cell subsets were analyzed by GSVA enrichment. NK, natural killer;
GSVA, gene set variation analysis.
KEGG analysis of differential gene
expression. (A) KEGG analysis of differential gene expression in NK
cells. (B) KEGG analysis of differential gene expression in B
cells. KEGG, Kyoto Encyclopedia of Genes and Genomes; NK, natural
killer.
The potential function of T cell
subsets. The abscissa represents different cluster information, and
the ordinate is the pathway name. The color from blue to red
indicates the higher enrichment of the pathway in this cluster. The
cell subsets were analyzed by GSVA enrichment. GSVA, gene set
variation analysis.
Characteristics of the patient and
healthy controls.
Blood routine examination at Stage
1.
Blood routine examination in Stage
2.
Acknowledgements
Not applicable.
Funding
Funding: The present study was supported by the National Natural
Science Foundation of China (grant nos. 82473574 and 82373523),
Science and Technology Project of Sichuan Province (grant nos.
20YYJC035 2023NSFSC0648 and 2024ZYD0126), Chengdu Innovation
Project (grant no. 2021-YF05-01603-SN), NHC Key Laboratory of
Nuclear Technology Medical Transformation (Mianyang Central
Hospital; grant no. 2023HYX022) and Natural Science Project of
Chengdu Medical College (grant no. CYZYB23-02).
Availability of data and materials
The data generated in the present study may be found
in the National Center for Biotechnology Information (NCBI) Gene
Expression Omnibus (GEO) (https://www.ncbi.nlm.nih.gov/geo/) and are accessible
through GEO Series under accession numbers GSE166902 (https://www.ncbi.nlm.nih.gov/geo/query/acc.cgi?acc=GSE166902)
and GSE190439 (https://www.ncbi.nlm.nih.gov/geo/query/acc.cgi?acc=GSE190439).
Authors' contributions
DY, HZ and SZ designed and supervised the present
study. ZJ, WT and KF collected the clinical samples and clinical
measurement information. ZJ and WH analyzed the clinical data. TY,
WT and XX conducted scRNA-Seq analyses. WH, JC, ZJ, SZ and DY
interpreted the data. TY, WT and ZJ wrote the manuscript. DY, SZ,
HZ, JC, XX and WH edited the manuscript. SZ, WT and DY confirm the
authenticity of all the raw data. All authors read and approved the
final manuscript.
Ethics approval and consent to
participate
The present study was approved by the Ethics
Committee of the Second Affiliated Hospital of Chengdu Medical
College, Nuclear Industry 416 Hospital [approval number:
2019(25)]. Written informed
consent was obtained from all participants.
Patient consent for publication
Not applicable.
Competing interests
The authors declare that they have no competing
interests.
References
|
1
|
Fushiki S: Radiation hazards in
children-lessons from chernobyl, three mile island and fukushima.
Brain Dev. 35:220–227. 2013.PubMed/NCBI View Article : Google Scholar
|
|
2
|
Ohnishi T: The disaster at Japan's
Fukushima-Daiichi nuclear power plant after the March 11, 2011
earthquake and tsunami, and the resulting spread of radioisotope
contamination. Radiat Res. 177:1–14. 2012.PubMed/NCBI View Article : Google Scholar
|
|
3
|
Densow D, Kindler H, Baranov AE, Tibken B,
Hofer EP and Fliedner TM: Criteria for the selection of radiation
accident victims for stem cell transplantation. Stem Cells. 15
(Suppl 2):S287–S297. 1997.PubMed/NCBI View Article : Google Scholar
|
|
4
|
Schaue D: A century of radiation therapy
and adaptive immunity. Front Immunol. 8(431)2017.PubMed/NCBI View Article : Google Scholar
|
|
5
|
Kusunoki Y and Hayashi T: Long-lasting
alterations of the immune system by ionizing radiation exposure:
Implications for disease development among atomic bomb survivors.
Int J Radiat Biol. 84:1–14. 2008.PubMed/NCBI View Article : Google Scholar
|
|
6
|
Hekim N, Cetin Z, Nikitaki Z, Cort A and
Saygili EI: Radiation triggering immune response and inflammation.
Cancer Lett. 368:156–163. 2015.PubMed/NCBI View Article : Google Scholar
|
|
7
|
Zhou Y, Yu N, Wang J, Chen W and Cai P:
Review of the 5·7 nanjing 192Ir source radiological accident.
Radiat Med Protect. 3:190–195. 2022.
|
|
8
|
Fielder E, Weigand M, Agneessens J,
Griffin B, Parker C, Miwa S and von Zglinicki T: Sublethal
whole-body irradiation causes progressive premature frailty in
mice. Mech Ageing Dev. 180:63–69. 2019.PubMed/NCBI View Article : Google Scholar
|
|
9
|
Berger ME, Hurtado R, Dunlap J, Mutchinick
O, Velasco MG, Tostado RA, Tostado RA, Valenzuela J and Ricks RC:
Accidental radiation injury to the hand: Anatomical and
physiological considerations. Health Phys. 72:343–348.
1997.PubMed/NCBI View Article : Google Scholar
|
|
10
|
Shao L, Luo Y and Zhou D: Hematopoietic
stem cell injury induced by ionizing radiation. Antioxid Redox
Signal. 20:1447–1462. 2014.PubMed/NCBI View Article : Google Scholar
|
|
11
|
Dainiak N, Waselenko JK, Armitage JO,
MacVittie TJ and Farese AM: The hematologist and radiation
casualties. Hematol Am Soc Hematol Educ Program: 473-496, 2003.
|
|
12
|
Paul S and Amundson SA: Development of
gene expression signatures for practical radiation biodosimetry.
Int J Radiat Oncol Biol Phys. 71:1236–1244. 2008.PubMed/NCBI View Article : Google Scholar
|
|
13
|
Dressman HK, Muramoto GG, Chao NJ, Meadows
S, Marshall D, Ginsburg GS, Nevins JR and Chute JP: Gene expression
signatures that predict radiation exposure in mice and humans. PLoS
Med. 4(e106)2007.PubMed/NCBI View Article : Google Scholar
|
|
14
|
Bauer M, Goldstein M, Christmann M, Becker
H, Heylmann D and Kaina B: Human monocytes are severely impaired in
base and DNA double-strand break repair that renders them
vulnerable to oxidative stress. Proc Natl Acad Sci USA.
108:21105–21110. 2011.PubMed/NCBI View Article : Google Scholar
|
|
15
|
Sasaki Y, Darmochwal-Kolarz D, Suzuki D,
Sakai M, Ito M, Shima T, Shiozaki A, Rolinski J and Saito S:
Proportion of peripheral blood and decidual CD4(+) CD25(bright)
regulatory T cells in pre-eclampsia. Clin Exp Immunol. 149:139–145.
2007.PubMed/NCBI View Article : Google Scholar
|
|
16
|
Soto-Peña GA, Luna AL, Acosta-Saavedra L,
Conde P, López-Carrillo L, Cebrián ME, Bastida M, Calderón-Aranda
ES and Vega L: Assessment of lymphocyte subpopulations and cytokine
secretion in children exposed to arsenic. FASEB J. 20:779–781.
2006.PubMed/NCBI View Article : Google Scholar
|
|
17
|
Autissier P, Soulas C, Burdo TH and
Williams KC: Evaluation of a 12-color flow cytometry panel to study
lymphocyte, monocyte, and dendritic cell subsets in humans.
Cytometry A. 77:410–409. 2010.PubMed/NCBI View Article : Google Scholar
|
|
18
|
Corkum CP, Ings DP, Burgess C, Karwowska
S, Kroll W and Michalak TI: Immune cell subsets and their gene
expression profiles from human PBMC isolated by Vacutainer Cell
Preparation Tube (CPT™) and standard density gradient. BMC Immunol.
16(48)2015.PubMed/NCBI View Article : Google Scholar
|
|
19
|
Hromadnikova I, Li S, Kotlabova K and
Dickinson AM: Influence of in vitro IL-2 or IL-15 alone or in
combination with hsp 70 derived 14-mer peptide (TKD) on the
expression of NK cell activatory and inhibitory receptors on
peripheral blood T cells, B cells and NKT cells. PLoS One.
11(e0151535)2016.PubMed/NCBI View Article : Google Scholar
|
|
20
|
Regev A, Teichmann SA, Lander ES, Amit I,
Benoist C, Birney E, Bodenmiller B, Campbell P, Carninci P,
Clatworthy M, et al: The human cell atlas. Elife.
6(e27041)2017.PubMed/NCBI View Article : Google Scholar
|
|
21
|
Tang F, Barbacioru C, Wang Y, Nordman E,
Lee C, Xu N, Wang X, Bodeau J, Tuch BB, Siddiqui A, et al: mRNA-Seq
whole-transcriptome analysis of a single cell. Nat Methods.
6:377–382. 2009.PubMed/NCBI View Article : Google Scholar
|
|
22
|
Papalexi E and Satija R: Single-cell RNA
sequencing to explore immune cell heterogeneity. Nat Rev Immunol.
18:35–45. 2018.PubMed/NCBI View Article : Google Scholar
|
|
23
|
Griffiths JA, Scialdone A and Marioni JC:
Using single-cell genomics to understand developmental processes
and cell fate decisions. Mol Syst Biol. 14(e8046)2018.PubMed/NCBI View Article : Google Scholar
|
|
24
|
Fan X, Zhou Y, Guo X and Xu M: Utilizing
single-cell RNA sequencing for analyzing the characteristics of
PBMC in patients with kawasaki disease. BMC Pediatr.
21(277)2021.PubMed/NCBI View Article : Google Scholar
|
|
25
|
Zhu W, Liu J, Nie J, Sheng W, Cao H, Shen
W, Dong A, Zhou J, Jiao Y, Zhang S and Cao J: MG132 enhances the
radiosensitivity of lung cancer cells in vitro and in
vivo. Oncol Rep. 34:2083–2089. 2015.PubMed/NCBI View Article : Google Scholar
|
|
26
|
Yan T, Yang P, Bai H, Song B, Liu Y, Wang
J, Zhang Y, Tu W, Yu D and Zhang S: Single-cell RNA-Seq analysis of
molecular changes during radiation-induced skin injury: The
involvement of Nur77. Theranostics. 14:5809–5825. 2024.PubMed/NCBI View Article : Google Scholar
|
|
27
|
Butler A, Hoffman P, Smibert P, Papalexi E
and Satija R: Integrating single-cell transcriptomic data across
different conditions, technologies, and species. Nat Biotechnol.
36:411–420. 2018.PubMed/NCBI View Article : Google Scholar
|
|
28
|
McGinnis CS, Murrow LM and Gartner ZJ:
DoubletFinder: Doublet detection in single-cell RNA sequencing data
using artificial nearest neighbors. Cell Syst. 8:329–337.e4.
2019.PubMed/NCBI View Article : Google Scholar
|
|
29
|
Macosko EZ, Basu A, Satija R, Nemesh J,
Shekhar K, Goldman M, Tirosh I, Bialas AR, Kamitaki N, Martersteck
EM, et al: Highly parallel Genome-wide expression profiling of
individual cells using nanoliter droplets. Cell. 161:1202–1214.
2015.PubMed/NCBI View Article : Google Scholar
|
|
30
|
Haghverdi L, Lun ATL, Morgan MD and
Marioni JC: Batch effects in single-cell RNA-sequencing data are
corrected by matching mutual nearest neighbors. Nat Biotechnol.
36:421–427. 2018.PubMed/NCBI View Article : Google Scholar
|
|
31
|
Aran D, Looney AP, Liu L, Wu E, Fong V,
Hsu A, Chak S, Naikawadi RP, Wolters PJ, Abate AR, et al:
Reference-based analysis of lung single-cell sequencing reveals a
transitional profibrotic macrophage. Nat Immunol. 20:163–172.
2019.PubMed/NCBI View Article : Google Scholar
|
|
32
|
Aibar S, González-Blas CB, Moerman T,
Huynh-Thu VA, Imrichova H, Hulselmans G, Rambow F, Marine JC,
Geurts P, Aerts J, et al: SCENIC: Single-cell regulatory network
inference and clustering. Nat Methods. 14:1083–1086.
2017.PubMed/NCBI View Article : Google Scholar
|
|
33
|
Suo S, Zhu Q, Saadatpour A, Fei L, Guo G
and Yuan GC: Revealing the critical regulators of cell identity in
the mouse cell atlas. Cell Rep. 25:1436–1445.e3. 2018.PubMed/NCBI View Article : Google Scholar
|
|
34
|
Trapnell C, Cacchiarelli D, Grimsby J,
Pokharel P, Li S, Morse M, Lennon NJ, Livak KJ, Mikkelsen TS and
Rinn JL: The dynamics and regulators of cell fate decisions are
revealed by pseudotemporal ordering of single cells. Nat
Biotechnol. 32:381–386. 2014.PubMed/NCBI View Article : Google Scholar
|
|
35
|
Hänzelmann S, Castelo R and Guinney J:
GSVA: Gene set variation analysis for microarray and RNA-seq data.
BMC Bioinformatics. 14(7)2013.PubMed/NCBI View Article : Google Scholar
|
|
36
|
Team RC: R: A language and environment for
statistical computing. MSOR connections 1, 2014.
|
|
37
|
Zhang J, Tessier SN, Biggar KK, Wu CW,
Pifferi F, Perret M and Storey KB: Regulation of torpor in the gray
mouse lemur: Transcriptional and translational controls and role of
AMPK signaling. Genomics Proteomics Bioinformatics. 13:103–110.
2015.PubMed/NCBI View Article : Google Scholar
|
|
38
|
Kabilan U, Graber TE, Alain T and Klokov
D: Ionizing radiation and translation control: A link to radiation
hormesis? Int J Mol Sci. 21(6650)2020.PubMed/NCBI View Article : Google Scholar
|
|
39
|
Mabbott NA, Baillie JK, Brown H, Freeman
TC and Hume DA: An expression atlas of human primary cells:
Inference of gene function from coexpression networks. BMC
Genomics. 14(632)2013.PubMed/NCBI View Article : Google Scholar
|
|
40
|
Yu X, Wang Y, Deng M, Li Y, Ruhn KA, Zhang
CC and Hooper LV: The basic leucine zipper transcription factor
NFIL3 directs the development of a common innate lymphoid cell
precursor. Elife. 3(e04406)2014.PubMed/NCBI View Article : Google Scholar
|
|
41
|
Nwabo Kamdje AH, Tagne Simo R, Fogang
Dongmo HP, Bidias AR and Masumbe Netongo P: Role of signaling
pathways in the interaction between microbial, inflammation and
cancer. Holistic Integrative Oncol. 2(42)2023.
|
|
42
|
Gou M, Zhang Y, Wang Z and Qian N: Changes
in the neutrophil-to-lymphocyte ratio (NLR) as predictive values
for metastatic gastric cancer patients with PD-1 inhibitors.
Holistic Integrative Oncol. 3(5)2024.
|
|
43
|
Min JY, Kim HM, Lee H, Cho MY, Park HS,
Lee SY, Park MS, Ha SK, Kim D, Jeong HG, et al: STAT1 as a tool for
non-invasive monitoring of NK cell activation in cancer. Commun
Biol. 7(1222)2024.PubMed/NCBI View Article : Google Scholar
|
|
44
|
Neubert EN, DeRogatis JM, Lewis SA,
Viramontes KM, Ortega P, Henriquez ML, Buisson R, Messaoudi I and
Tinoco R: HMGB2 regulates the differentiation and stemness of
exhausted CD8(+) T cells during chronic viral infection and cancer.
Nat Commun. 14(5631)2023.PubMed/NCBI View Article : Google Scholar
|
|
45
|
Tian S, Zheng N, Zu X, Wu G, Zhong J,
Zhang J, Sheng L, Liu W, Wang C, Ge G, et al: Integrated hepatic
single-cell RNA sequencing and untargeted metabolomics reveals the
immune and metabolic modulation of Qing-Fei-Pai-Du decoction in
mice with coronavirus-induced pneumonia. Phytomedicine.
97(153922)2022.PubMed/NCBI View Article : Google Scholar
|
|
46
|
Zenke K, Muroi M and Tanamoto KI: IRF1
supports DNA binding of STAT1 by promoting its phosphorylation.
Immunol Cell Biol. 96:1095–1103. 2018.PubMed/NCBI View Article : Google Scholar
|
|
47
|
Lopes-Ramos CM, Chen CY, Kuijjer ML,
Paulson JN, Sonawane AR, Fagny M, Platig J, Glass K, Quackenbush J
and DeMeo DL: Sex differences in gene expression and regulatory
networks across 29 human tissues. Cell Rep.
31(107795)2020.PubMed/NCBI View Article : Google Scholar
|
|
48
|
Sykes SM, Di Marcantonio D, Martinez E,
Huhn J, Gupta A and Mistry R: JUN and ATF3 regulate the
transcriptional output of the unfolded protein response to support
acute myeloid leukemia. Blood. 132(1327)2018.
|
|
49
|
Zhou Y, Zhao L, Cai M, Luo D, Pang Y, Chen
J, Luo Q and Lin Q: Utilizing sc-linker to integrate single-cell
RNA sequencing and human genetics to identify cell types and driver
genes associated with non-small cell lung cancer. BMC Cancer.
25(130)2025.PubMed/NCBI View Article : Google Scholar
|
|
50
|
Lahoz-Beneytez J, Elemans M, Zhang Y,
Ahmed R, Salam A, Block M, Niederalt C, Asquith B and Macallan D:
Human neutrophil kinetics: Modeling of stable isotope labeling data
supports short blood neutrophil half-lives. Blood. 127:3431–3438.
2016.PubMed/NCBI View Article : Google Scholar
|
|
51
|
Lefranc MP: Immunoglobulin and T cell
receptor genes: IMGT(®) and the birth and rise of
immunoinformatics. Front Immunol. 5(22)2014.PubMed/NCBI View Article : Google Scholar
|
|
52
|
Nielsen MM, Witherden DA and Havran WL: γδ
T cells in homeostasis and host defence of epithelial barrier
tissues. Nature reviews Immunology. 17:733–745. 2017.PubMed/NCBI View Article : Google Scholar
|
|
53
|
Vantourout P and Hayday A:
Six-of-the-best: Unique contributions of γδ T cells to immunology.
Nat Rev Immunol. 13:88–100. 2013.PubMed/NCBI View Article : Google Scholar
|
|
54
|
Willmarth NE and Ethier SP: Autocrine and
juxtacrine effects of amphiregulin on the proliferative, invasive,
and migratory properties of normal and neoplastic human mammary
epithelial cells. J Biol Chem. 281:37728–37737. 2006.PubMed/NCBI View Article : Google Scholar
|
|
55
|
Ishikawa N, Daigo Y, Takano A, Taniwaki M,
Kato T, Hayama S, Murakami H, Takeshima Y, Inai K, Nishimura H, et
al: Increases of amphiregulin and transforming growth factor-alpha
in serum as predictors of poor response to gefitinib among patients
with advanced non-small cell lung cancers. Cancer Res.
65:9176–9184. 2005.PubMed/NCBI View Article : Google Scholar
|
|
56
|
Jing C, Jin YH, You Z, Qiong Q and Jun Z:
Prognostic value of amphiregulin and epiregulin mRNA expression in
metastatic colorectal cancer patients. Oncotarget. 7:55890–55899.
2016.PubMed/NCBI View Article : Google Scholar
|
|
57
|
Son B, Kim TR, Park JH, Yun SI, Choi H,
Choi JW, Jeon C and Park HO: SAMiRNA targeting amphiregulin
alleviate total-body-irradiation-induced renal fibrosis. Radiat
Res. 197:471–479. 2022.PubMed/NCBI View Article : Google Scholar
|
|
58
|
Prince LR, Prosseda SD, Higgins K,
Carlring J, Prestwich EC, Ogryzko NV, Rahman A, Basran A, Falciani
F, Taylor P, et al: NR4A orphan nuclear receptor family members,
NR4A2 and NR4A3, regulate neutrophil number and survival. Blood.
130:1014–1025. 2017.PubMed/NCBI View Article : Google Scholar
|
|
59
|
McMorrow JP and Murphy EP: Inflammation: A
role for NR4A orphan nuclear receptors? Biochem Soc Trans.
39:688–693. 2011.PubMed/NCBI View Article : Google Scholar
|
|
60
|
Son B, Jeon J, Lee S, Kim H, Kang H, Youn
H, Jo S and Youn B: Radiotherapy in combination with hyperthermia
suppresses lung cancer progression via increased NR4A3 and KLF11
expression. Int J Radiat Biol. 95:1696–1707. 2019.PubMed/NCBI View Article : Google Scholar
|
|
61
|
Ilienko IM, Golyarnik NA, Lyaskivska OV,
Belayev OA and Bazyka DA: Expression of biological markers induced
by ionizing radiation at the late period after exposure in a wide
range of doses. Probl Radiac Med Radiobiol. 23:331–350.
2018.PubMed/NCBI View Article : Google Scholar
|
|
62
|
Kusunoki Y, Kyoizumi S, Hirai Y, Suzuki T,
Nakashima E, Kodama K and Seyama T: Flow cytometry measurements of
subsets of T, B and NK cells in peripheral blood lymphocytes of
atomic bomb survivors. Radiat Res. 150:227–236. 1998.PubMed/NCBI
|
|
63
|
Paganetti H: A review on lymphocyte
radiosensitivity and its impact on radiotherapy. Front Oncol.
13(1201500)2023.PubMed/NCBI View Article : Google Scholar
|