Introduction
Lipid metabolism disorders refer to the abnormal
changes in lipids and their metabolites in the blood and other
tissues and organs, resulting from congenital or acquired factors.
Such disorders are associated with the development of various
diseases, including diabetes, hyperlipidemia, atherosclerosis, and
even certain neurodegenerative diseases and tumors (1,2).
Non-alcoholic fatty liver disease (NAFLD) is a clinical syndrome in
which the diffuse bulla fat of hepatocytes exhibits excessive
accumulation of lipids in hepatocytes but excludes liver
pathologies caused by excessive alcohol consumption and other
definitive liver damage factors. The prevalence of NAFLD is
increasing annually, as is the trend of incidence in younger
individuals (3,4). However, there are currently no
FDA-approved drugs available to treat NAFLD. Given the critical
role of lipid metabolism disorders in the occurrence and
development of NAFLD (5,6), it is important to explore methods
to alleviate lipid metabolism disorders of the hepatocytes in
patients with fatty liver disease to reduce the incidence of NAFLD
(7,8).
Salusin-α, one of the products of selective splicing
of the dystonia-associated gene (TOR2A), is a biologically active
peptide consisting of 28 amino acid residues with hemodynamic and
mitogenic activity (9). It is
widely found in tissues and the body fluids of humans, rats and
mice, such as in the vascular endothelium, kidneys, brain, plasma,
urine and other secretions (10-12). Previous studies have demonstrated
that Salusin-α can reduce lipid accumulation and is associated with
improved lipid profiles, which inhibit coronary artery disease
(13-15). Animal experiments have shown that
Salusin-α can also inhibit liver steatosis and reduce plasma TG
levels in mice (16). The
authors' research group previously established a new method of
targeting the delivery of EGFP-Salusin-α plasmid to the arterial
endothelia and demonstrated that Salusin-α can reduce
atherosclerosis in rabbits (17), and it was also demonstrated that
Salusin-α may inhibit hepatocyte lipid synthesis through the
PPARα/ApoA5/sterol regulatory element binding protein-1c (SREBP-1c)
pathway (18). Nevertheless, the
exact mechanism by which Salusin-α affects hepatocyte lipid
metabolism remains incompletely understood. Exploring the potential
mechanism of the regulation of Salusin-α for lipid metabolism in
hepatocytes may provide a potential target for NAFLD treatment.
Accordingly, in the present study, the related
factors and signaling pathways by which Salusin-α may exert its
effects on lipid metabolism in hepatocytes were assessed using
lentiviral vectors to overexpress or knockdown Salusin-α expression
into HepG2 cells and then inducing their steatosis. This model
provides a practical basis for studying the potential mechanism of
Salusin-α to prevent lipid metabolism disorders and provides a
potential target for the treatment of NAFLD.
Materials and methods
Lentivirus packaging and establishment of
hepatocyte steatosis model
Cell culture and lentivirus
packaging
HepG2 and 293T cells were purchased from SUNNCELL
(sunncell.com.cn; cat. nos. SNL-083 and SNL-015).
HepG2 is a liver cancer cell line exhibiting epithelial-like
morphology that was isolated from a hepatocellular carcinoma in
white male patient with liver cancer and 293T is an epithelial-like
cell that was isolated from the kidney of a patient. Both cell
lines were authenticated using short tandem repeat, and they
matched the HepG2 (cat. no. ACC-180) and 293T (cat. no. ACC-635)
cells in the DSMZ database. Both cells were cultured in DMEM high
glucose medium (cat. no. PM150210; Procell Life Science &
Technology Co., Ltd.) supplemented with 10% (v/v) fetal bovine
serum, 100 U/ml penicillin and 100 µg/ml streptomycin (cat.
no. MA0110; Dalian Meilun Biology Technology Co., Ltd.). Cells were
maintained in a humidified incubator at 37°C and supplied with 5%
CO2 air. The construction and packaging of lentiviral
vectors containing the recombinant plasmids of Salusin-α
overexpression and interference, including pHAGE-Salusin-α and
pLKO.1-shSalusin-α, was performed as previously described (18). The sense and antisense sequences
of short hairpin (sh)RNA are as follows: shSalusin-α sense,
5′-CCGGGCCCTTCCTCCCGCTCCAGCGCTCGAGCGCTGGAGCGGGAGGAAGGGCTTTTTG-3′
and antisense,
5′-AATTCAAAAAGCCCTTCCTCCCGCTCCAGCGCTCGAGCGCTGGAGCGGGAGGAAGGGC-3′;
and shMock,
5′-CCGGCAACAAGATGAAGAGCACCAACTCGAGTTGGTGCTCTTCATCTTGTTGTTTTTG-3′
(cat. no. SHC002; Sigma-Aldrich; Merck KGaA).
Lentiviral vector titer assay and
transmission electron microscopy (TEM) sample preparation
The titer of lentivirus was estimated using the
antibiotic screening method. Firstly, an equal number of HepG2
cells were cultured at 2×10⁵ in a six-well plate, and 0,
5, 10, 15, 20, and 30 µl crude virus was added, followed by
the addition of polybrene at a final concentration of 8
µg/ml (cat. no. BL628A; Beijing Labgic Technology Co.,
Ltd.). After the cell density reached 60-80%, the cells were
collected and evenly divided into two plates, one with a
concentration of 2 µg/ml puromycin dihydrochloride (cat. no.
1299MG025; Biofroxx; neoFroxx) and one without treatment. When all
the cells in the antibiotic-treated plate had died, the two plates
were stained with Trypan blue (cat. no. C0040; Beijing Solarbio
Science & Technology Co., Ltd.) at 37°C for 3 min and using a
light microscope (Olympus Corporation), the live cells were
counted. The antibiotic-treated plates were defined as 'viable cell
counts', and the non-treated plates were defined as 'control cell
counts'. The activity titer of each viral dose group was calculated
as follows: titer [Infectious units (IFU)/ml=(number of live cells
x number of starting cells)/(number of control cells x viral
volume)], and finally, the mean value of each well was calculated,
which was taken as the final titer of the virus. IFU is the ability
of a virus to infect a host cell.
293T cells were cultured for 72 h, fixed with
pre-cooled 2.5% glutaraldehyde (cat. no. G916054; Shanghai Macklin
Biochemical Co., Ltd.) for 1 h, and then transferred to centrifuge
tubes. Centrifugation was performed at 4°C, at a speed of 500 × g
for 5 min to remove most of the supernatant, and 1 ml of the
supernatant was left to be gently resuspended and transferred to a
1.5 ml centrifuge tube for passive sedimentation for 1 h after
which the supernatant was removed and fresh pre-cooled 2.5%
glutaraldehyde was added, and then stored at 4°C until they were
sent to the Center of Ultramicropathology (People's Hospital of
Wuhan University) for analysis.
Establishment of the hepatocyte
steatosis model
According to a recent study by the authors (19), the free fatty acid (FFA) group
used 200 µM FFAs to construct the cellular steatosis model.
First, a 10 mM oleic acid (OA) stock solution (Shanghai Macklin
Biochemical Co., Ltd.) was prepared by fully dissolving OA with
NaOH. Next, 10% fatty acid-free bovine serum albumin (d-BSA;
MilliporeSigma) was added to the OA solution. Similarly, a 20 mM
palmitic acid (PA) stock solution (Shanghai Macklin Biochemical
Co., Ltd.) was prepared using the same method. Both solutions were
then filtered through a 0.22-µm bacterial filter for
short-term storage at 4°C in a refrigerator. For the induction of
cellular steatosis, 1×10⁶ HepG2 cells/well were
inoculated in six-well plates for 24 h and cultured until they
reached 70% density, after which cells were washed twice with PBS
and next treated with 200 µM of the prepared FFA working
solution (200 µM FFA ready to use, obtained by adding 100
µl of the OA and PA stock solution to 10 ml DMEM high
glucose complete medium, nOA:nPA=2:1). The treated cells were
cultured for a further 24 h. For the control group, equal
concentrations of solvents (10% d-BSA fully dissolved in NaOH) were
used, as aforementioned.
Validation of the impact of Salusin-α on
lipid metabolism in HepG2 cells
Effect of Salusin-α on FFA-induced
HepG2 cells
Once the model had been successfully established,
subsequent experiments were performed. First, 1×10⁶
cells/well were inoculated and cultured in a six-well plate for 24
h until they reached 70% density. Next the overexpression pHAGE
null virus, pHAGE-Salusin-α virus, shMock null virus, or
pLKO.1-shSalusin-α virus was added, and 160 µl 8
µg/ml Polybrene was co-incubated at 37°C for 15 min. Next,
the media was topped up to 2 ml per well. After transfection for 24
h, 200 µM FFA was added to each well for another 24 h. The
control group was left untreated.
Oil red O staining
The degree of lipoatrophy of HepG2 cells after
induction was detected by oil red O staining. Cells were washed
with PBS, then fixed with tissue fixative (cat. no. G1101; Wuhan
Servicebio Technology Co., Ltd.) at room temperature for 25 min,
and washed for 1 min with 60% isopropanol to remove the excess
fixative. Oil red O stain (cat. no. O8010; Beijing Solarbio
Technology Co., Ltd.) was used to detect lipoatrophy. The nuclei
were counterstained with hematoxylin (cat. no. BL700B; Beijing
Labgic Technology Co., Ltd.) for 2 min, and finally, the stained
HepG2 cells were observed using a light microscope (Olympus
Corporation). ImageJ (version 1.8.0.112; National Institutes of
Health) was used to quantify the lipid droplet area.
Biochemical analysis of metabolic and
oxidative stress indicators
Cell homogenates were collected separately after
lysis with RIPA lysate (cat. no. MAO151; Dalian Meilun Biology
Technology Co., Ltd.). The levels of triglyceride (TG), alanine
aminotransferase (ALT), aspartate aminotransferase (AST),
malondialdehyde (MDA) and superoxide dismutase (SOD) were measured
according to the manufacturer's protocol (Nanjing Jiancheng
Bioengineering Research Institute).
Bioinformatics analysis
To determine the related factors and pathway signals
involved in the process of lipid accumulation of hepatocytes, the
differentially expressed genes (DEGs) between healthy individuals
and patients with NAFLD were determined using the GSE31803 dataset
(https://www.ncbi.nlm.nih.gov/geo/query/acc.cgi?acc=GSE31803)
from Gene Expression Omnibus database (https://www.ncbi.nlm.nih.gov/geo/). Next, the DEGs
were analyzed using the DAVID database (https://david.ncifcrf.gov/) to identify the
upregulated and downregulated genes. Gene Ontology (GO) analysis of
the DEGs was performed to obtain the GO terms based on gene
function and classification; similarly, Kyoto Encyclopedia of Genes
and Genomes (https://www.genome.jp/kegg/) pathway enrichment
analysis was performed on the DEGs. Together, the genes and
pathways related to fatty acid oxidative catabolism-related factors
and their signaling pathways were identified.
Validation of associated pathway
factors
Semi-quantitative PCR (SQ-PCR) for
analysis of the mRNA expression levels of relevant pathway
factors
Total RNA was extracted from HepG2 cells using
TRIzol™ lysis reagent (cat. no. 9108; Takara Bio, Inc.). Reverse
transcription was then performed following the protocol of the
reverse transcription kit (cat. no. D7170M; Beyotime Institute of
Biotechnology). A total of 2 µl template was reverse
transcribed to cDNA, and then 1.6 µl cDNA template was
amplified into DNA using Taq DNA Polymerase (cat. no. ET101;
Tiangen Biotech Co., Ltd.). To ensure reliable results and minimize
potential variations, the optimal temperature and number of cycles
for each primer were determined in the logarithmic growth phase
using a control group. The primer sequences used are provided in
Table I. The thermocycling
conditions were as follows: Pre-denaturation of Salusin-α at 94°C
for 3 min, followed by 30 cycles of denaturation at 94°C for 30
sec, annealing at 64°C for 30 sec, and extension at 72°C for 30
sec. A final extension step was performed at 72°C for an additional
5 min. For annealing of AMPK, SREBP-1c, acetyl-CoA carboxylase
(ACC), fatty acid synthase (FASN), monocyte chemoattractant
protein-1 (MCP-1) and transforming growth factor β (TGF-β), a
temperature of 58°C was used for 36 cycles. In comparison, liver
kinase B1 (LKB1) was annealed at 59°C for 36 cycles, and GAPDH was
annealed at 60°C for 30 cycles. The remaining steps were consistent
with those used for Salusin-α. Following amplification, the PCR
products were separated on a 1.5% agarose gel electrophoresis and
visualized using the Tanon 1600 Gel Imaging System (Tanon Science
and Technology Co., Ltd.). To quantify the changes in the
expression of each target gene, the optical density (OD) values of
the bands were analyzed using the Tianneng gel analysis software
(biotanon. com). The relative expression levels of each mRNA were
determined by calculating the ratio of the OD value of the target
gene to the OD value of GAPDH. Differences in the amount of target
genes were then compared among the treatment groups.
 | Table ISequences of primers used for
semi-quantitative PCR. |
Table I
Sequences of primers used for
semi-quantitative PCR.
| Gene name | Primer sequence
(5′→3′) | Length (bp) |
|---|
| Salusin-α | F:
CAGGATCCAGTGGTGCCCTTCCTCCCG | 101 |
| R:
CATCTCGAGCTTGGCTCCAGGCCCAGC |
| GAPDH | F:
GTCTCCTCTGACTTCAACAGCG | 131 |
| R:
ACCACCCTGTTGCTGTAGCCAA |
| MCP-1 | F:
CAGCCAGATGCAATCAATGCC | 190 |
| R:
TGGAATCCTGAACCCACTTCT |
| TGF-β | F:
CTAATGGTGGAAACCCACAACG | 209 |
| R:
TATCGCCAGGAATTGTTGCTG |
| AMPK | F:
TCCGAGGAAATCAAGGCACC | 297 |
| R:
GCCAAGCTGGCTGGTTACTA |
| LKB1 | F:
CATGACTGTGGTGCCGTACT | 140 |
| R:
CATTGTGACTGGCCTCCTCT |
| SREBP-1c | F:
CACCGTTTCTTCGTGGATGG | 116 |
| R:
GTCACACAGTTCAGTGCTCGCTC |
| ACC | F:
TGGTAATGCGGTATGGAAGTCG | 309 |
| R:
TGTATGTTGTCCCTAAGGATTGTGC |
| FASN | F:
CAAATTCGACCTTTCTCAGAACCAC | 293 |
| R:
CCCCCTTCAACACTGCCTCC |
Western blot analysis to detect
changes in pathway factor protein levels
Cells washed with PBS were lysed using RIPA lysis
buffer for 30 min on ice, and then the cells were collected and
resuspended until the solution was as clear as possible. The
supernatant was centrifuged at 4°C, 13,400 × g, for 10 min, and
subsequently, the protein concentration was calculated using a BCA
kit (cat. no. E-BC-K318-M; Elabscience Biotechnology, Inc.) to
calculate protein concentration. Proteins were diluted with saline
to adjust the concentration of each sample, then mixed with 5X SDS
sample buffer in a 4:1 ratio and denatured at 95°C for 10 min. The
protein samples were separated by electrophoresis on a 10% SDS gel
(cat. no. G2043; Wuhan Servicebio Technology Co., Ltd.) by
SDS-PAGE, and subsequently transferred to a PVDF membrane (cat. no.
IPVH00010l; MilliporeSigma). The membranes were blocked with 5%
skimmed milk powder (cat. no. GC310001; Wuhan Servicebio Technology
Co., Ltd) or 5% bovine serum albumin [used explicitly for
phosphorylated (p-) protein blocking, cat. no. GC305010; Wuhan
Servicebio Technology Co., Ltd.] at room temperature for 1.5 h.
Next, the membranes were incubated with anti-Salusin-α rabbit
polyclonal antibodies (1:1,000; cat. no. ab232928; Abcam),
anti-AMPK-α rabbit polyclonal antibodies (1:1,000; cat. no. AF6423;
Affinity Biosciences), anti-phospho-AMPK-α (Thr172) rabbit
polyclonal antibodies (1:1,000; cat. no. AF3423; Affinity
Biosciences), anti-LKB1 rabbit polyclonal antibodies (1:500;
cat.no. A2122; ABclonal Technology), anti-p-LKB1(Ser 428) rabbit
polyclonal antibodies (1:1,000; cat. no. AP0602; ABclonal Biotech
Co., Ltd.), antiSREBP1 rabbit polyclonal antibodies (1:1,000; cat.
no. ab28481, Abcam), anti-FASN rabbit polyclonal antibodies
(1:1,000; cat. no. FNab03019; Wuhan Fine Biotech Co., Ltd.), or
anti-GAPDH rabbit monoclonal antibodies (1:10,000; cat. no.
ab181602; Abcam) at 4°C overnight. After washing the membranes with
TBST (containing 0.1% Tween 20) they were incubated on a shaker
with horseradish peroxidase (HRP)-labeled goat anti-rabbit IgG
antibodies [1:10,000; cat. no. E-AB-1102; Elabscience
Biotechnology, Inc.)] for 40 min. Subsequently, the membrane was
treated with an ECL Ultra-sensitive Chemiluminescence kit (cat. no.
MA0186; Dalian Meilun Biology Technology Co., Ltd.) and visualized
using a chemiluminescence imaging system. The grayscale values of
each group's target proteins and reference proteins were calculated
using ImageJ for densitometric analysis.
Inhibitor induction
Dorsomorphin (Compound C, 10 µM; cat. no.
GC17243; GLPBIO), an inhibitor of AMPK (20), was used to treat cells alongside
transfection with the lentiviral vectors. Cells were inoculated in
two six-well plates at a density of 1×10⁶ cells/well for
24 h until they reached 70% density, and cells in one plate were
transfected with the virus following, as aforementioned. By
contrast, cells in the other plate were co-treated with the
inhibitor in addition to the virus. After 24 h, 200 µM FFA
was added to all wells except for the control group. After a
further 24 h of culturing, the cells were examined as
aforementioned.
Statistical analysis
Statistical analysis was performed using GraphPad
Prism version 9.5 (GraphPad Software, Inc.; Dotmatics) and SPSS
version 26.0 (IBM Corp), and data are presented as the mean ± SD of
three repeats. First, a normality test was performed. When the
variances were homogeneous, A paired Student's t-test was used to
compare differences between any two groups and one-way analysis of
variance (ANOVA) followed by Tukey's multiple comparisons test was
used to compare multiple sets of data. When the variances were not
homogeneous, a Kruskal-Wallis H rank sum test was used to compare
differences between multiple groups. All tests were two-tailed, and
P<0.05 was considered to indicate a statistically significant
difference.
Results
Successful establishment of the cell
steatosis model
All the cells in the antibiotic-only group died
after 3 days, and the average titer of the virus was finally
obtained as 0.86×10⁶ IFU/ml after counting the number of
viable cells in the control and antibiotic-treated groups. The
optimal Multiplicity of infection (MOI) of HepG2 was determined to
be 10 in a previous study (18);
based on the average titer of the virus and the MOI, the amount of
viral fluid added per well was calculated to be 1 ml. TEM images
confirmed that lentiviral particles could be observed in the
pHAGE-Salusin-α and pLKO.1-shSalusin-α groups, while no viral
particles were observed in the control group, indicating successful
lentiviral packaging (Fig. 1A).
SQ-PCR was used to determine the expression of Salusin-α mRNA in
HepG2 cells transfected with the overexpression or interference
Salusin-α vectors. pHAGE group was significantly different from
pHAGE-Salusin-α group and shMock group was significantly different
from shSalusin-α group (P<0.001). And compared with the control
group, the expression of Salusin-α in the overexpression group
increased, while in the interference group, it decreased
(P<0.001), indicating successful transfection of the virus
(Fig. 1B and C). Moreover, the
protein content of Salusin-α detected after transfection also
showed significant differences between the overexpression and
knockdown groups compared with the corresponding viral vectors
(Fig. S1). Red lipid droplets
were observed following oil red O staining in the FFA group
(Fig. 1D), while the levels of
TG, ALT and AST in the FFA group were all increased (Fig. 1E) (P<0.01). The results
indicated that the fatty model of hepatocytes was successfully
constructed.
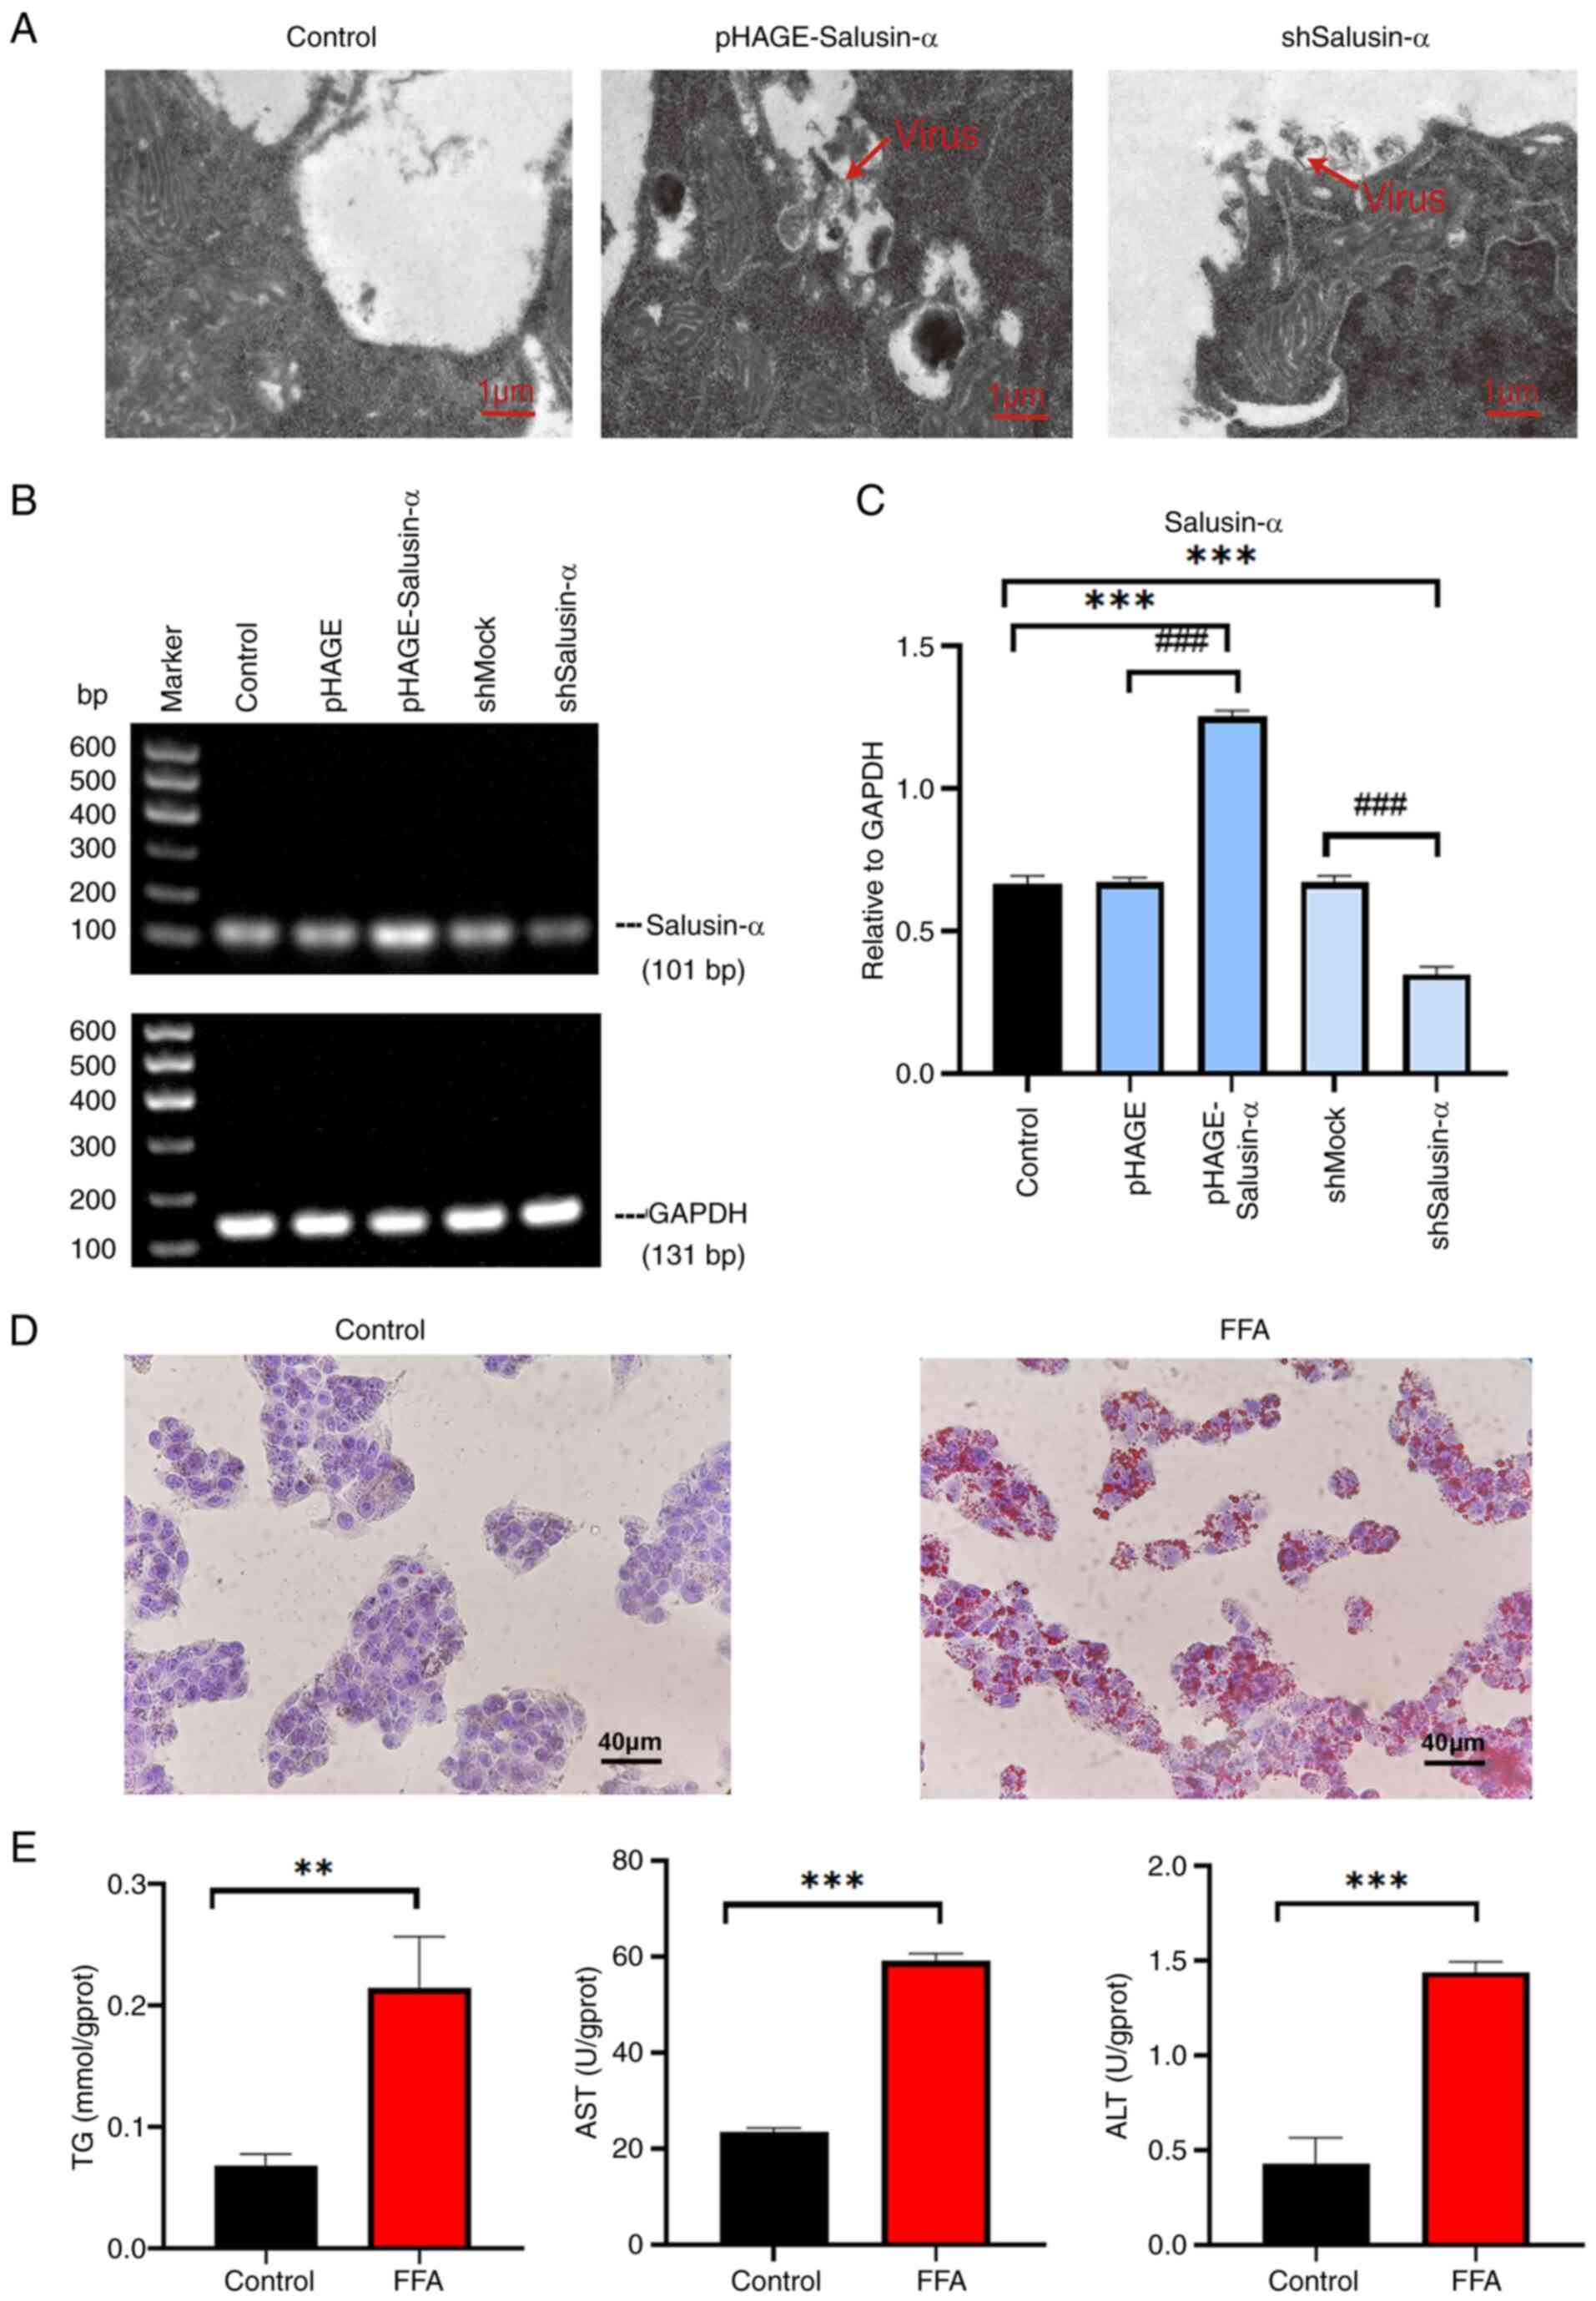 | Figure 1Construction of the lentivirus and
establishment of the cell steatosis model. (A) Transmission
electron microscopy of 293T cells in the control, pHAGE-Salusin-α
and shSalusin-α groups 72 h after plasmid transfection. Red arrows
indicate lentiviral particles. No viral particles were observed in
the Control group. Scale bar, 1 µm. (B) Electrophoresis
result graphs of the viral fluids of each group following RNA
extraction, reverse transcription and PCR. The size of the
Salusin-α sequence was 101 bp. (C) The results were analyzed using
semi-quantitative PCR, and the relative expression of Salusin-α was
indicated by comparing the ratio of Salusin-α/GAPDH. (D) Oil red
O-stained cytogram of the Control and FFA groups. Scale bar, 40
µm. (E) Levels of TG, AST and ALT in the HepG2 cells in each
group. Data are presented as the mean ± SD of three independent
repeats. **P<0.01 and ***P<0.001 vs.
control; ###P<0.001 vs. pHAGE or shMock. shRNA, short
hairpin RNA; pHAGESalusinα, Salusinα overexpression; TEM,
transmission electron microscopy, FFA, free fatty acids; TG,
triglyceride; AST, aspartate aminotransferase; ALT, alanine
aminotransferase; sh-, short hairpin; ns, not significant. |
Overexpression of Salusin-α alleviates
lipid accumulation, oxidative stress and inflammation in HepG2
cells, while knockdown of Salusin-α has the opposite effect
To observe whether Salusin-α could reduce
FFA-induced lipid accumulation in HepG2 cells, oil red O staining
was used to assess the degree of lipid accumulation. The results of
oil red O staining following the different treatments are shown in
Fig. 2A. The lipid content in
the FFA group was significantly increased compared with that of the
control group (P<0.001), and the lipid content in the
overexpression Salusin-α group was significantly lower than that of
the FFA group, whereas the staining in the Salusin-α knockdown
group was the largest (Fig. 2B;
P<0.01). The levels of TG, AST and ALT in the FFA group
increased significantly compared with that in the control group; in
the Salusin-α overexpression group, the levels decreased to varying
degrees compared with the FFA group, and in the Salusin-α knockdown
group, they increased to different degrees (Fig. 2C and D).
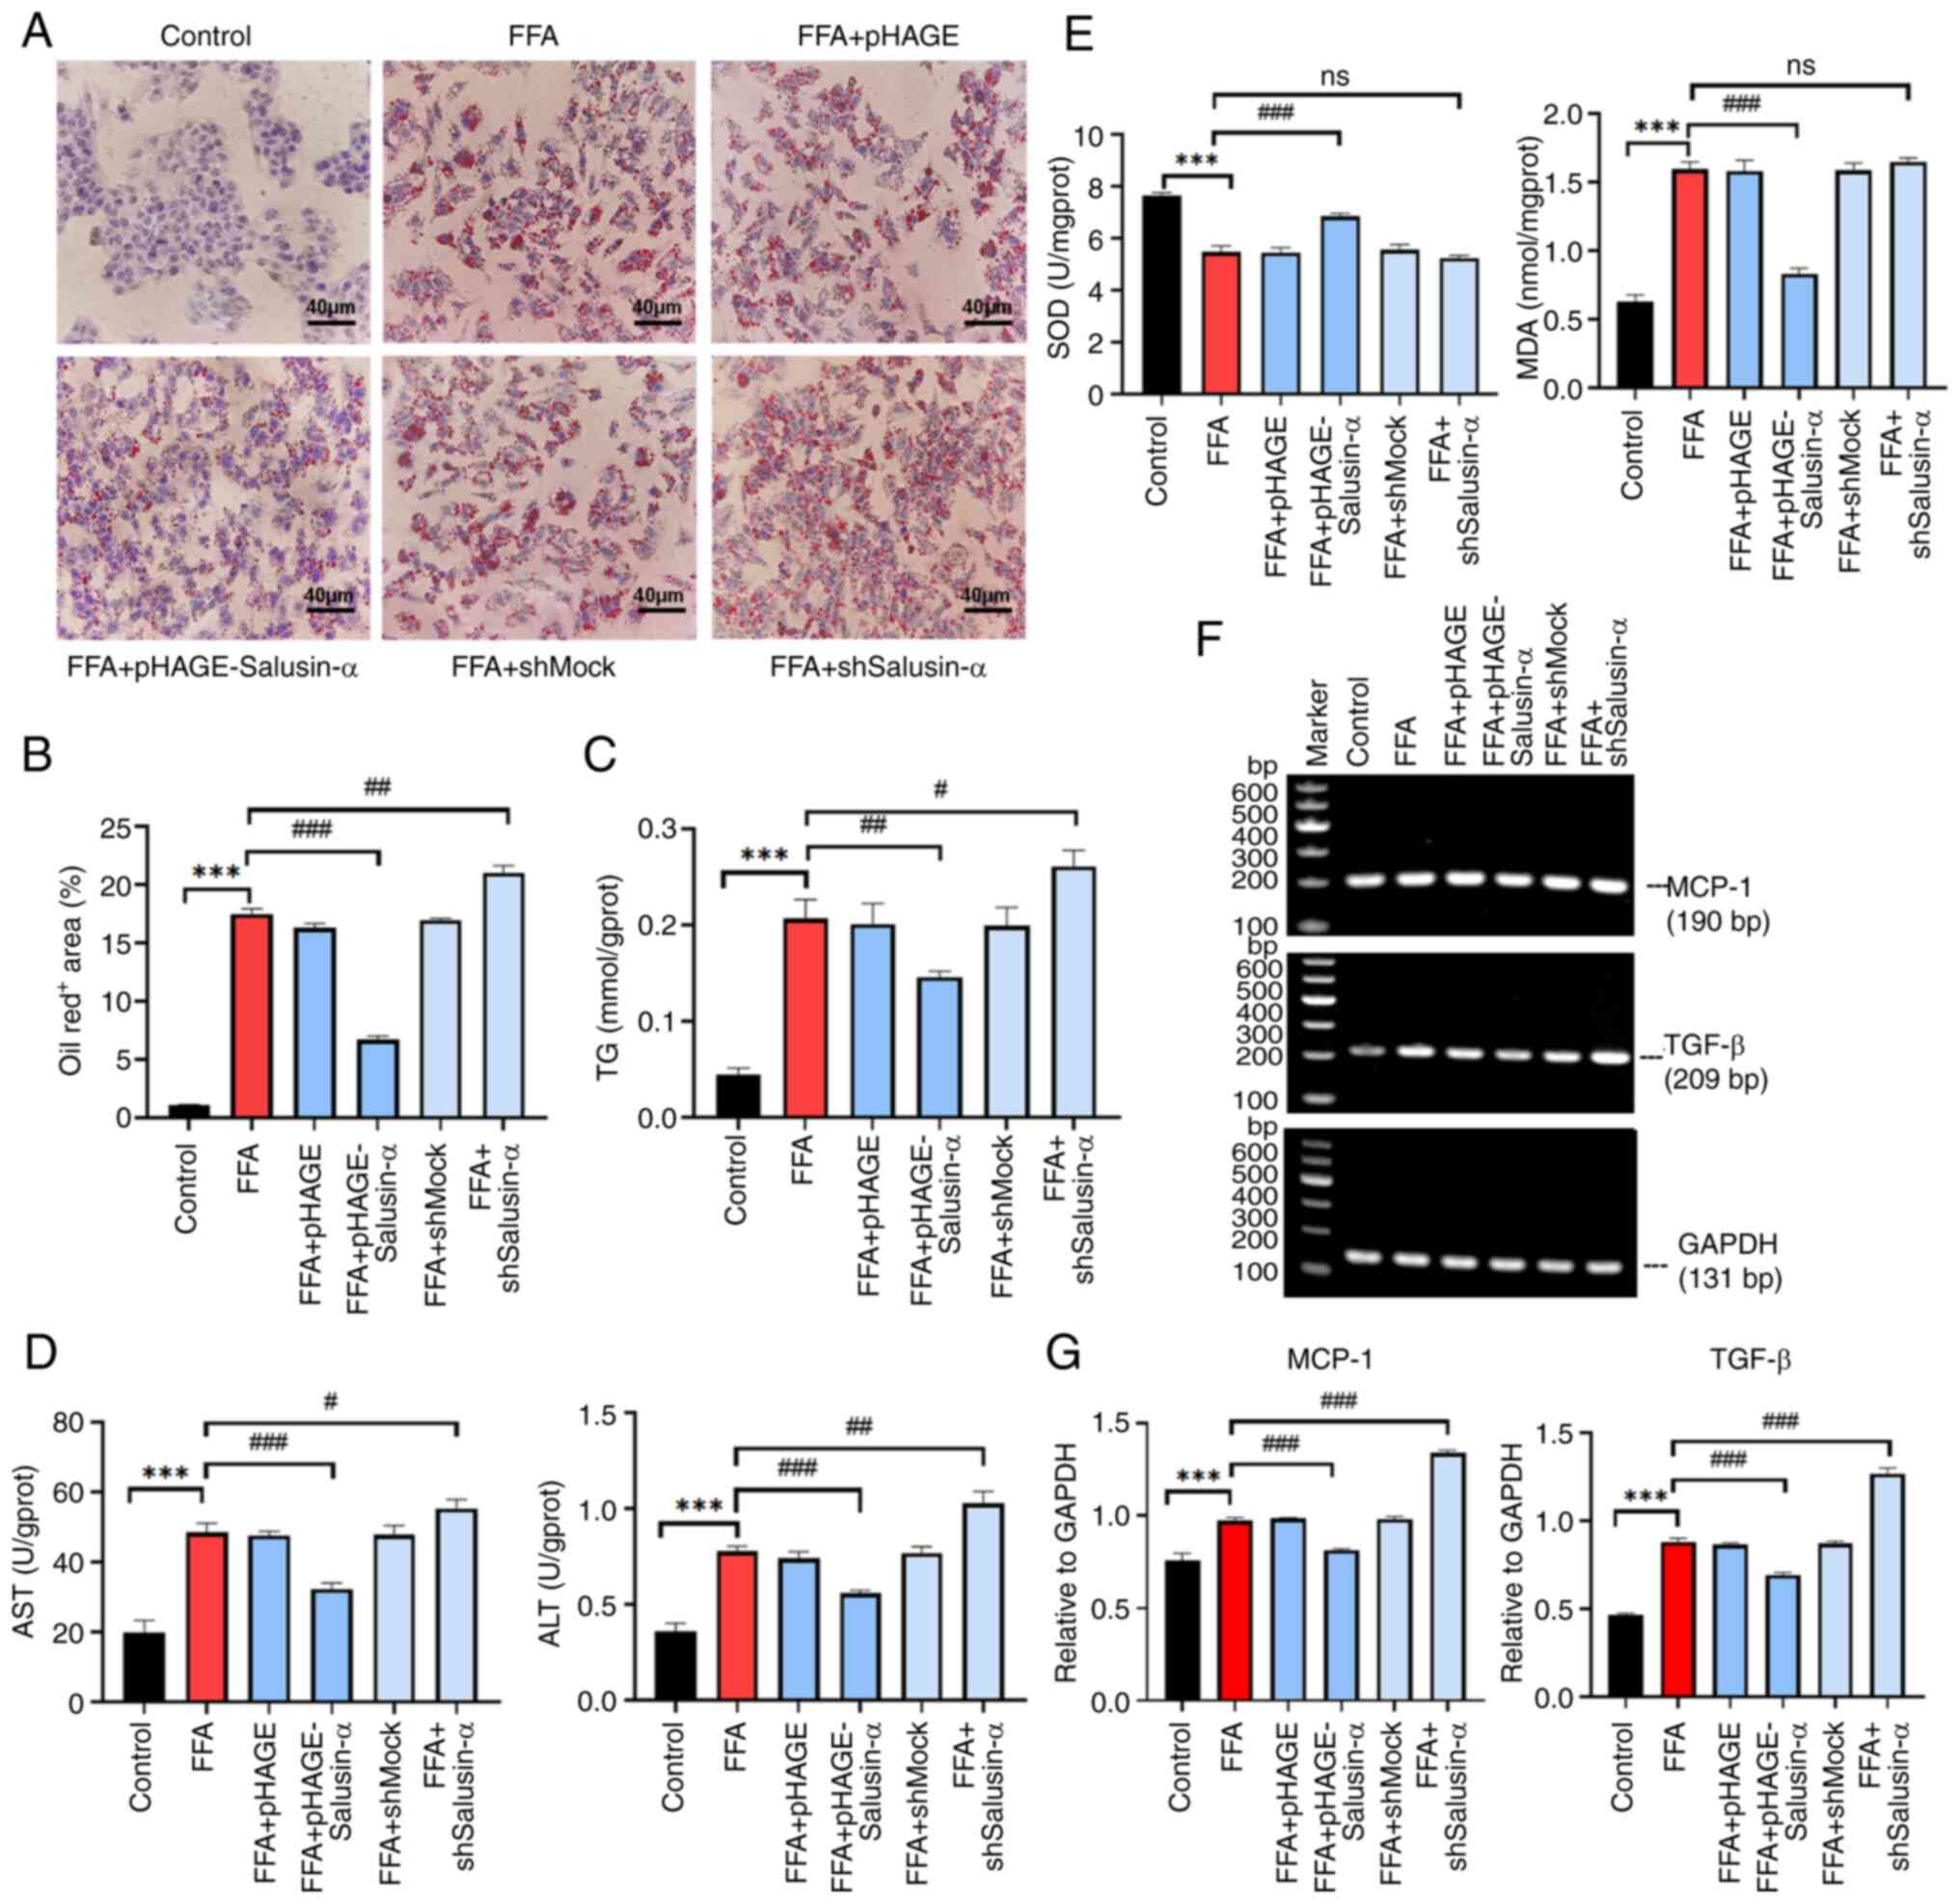 | Figure 2Effects of overexpression and
knockdown of Salusin-α on lipid accumulation, oxidative stress, and
inflammation. (A) Oil red O-stained cell maps of the control group,
FFA group, FFA + pHAGE group, FFA + pHAGE-Salusin-α group, FFA +
shMock group and FFA + shSalusin-α group. Scale bar, 40 µm.
(B) Quantification of lipid content in the oil red O-stained cells
by calculating the intracellular lipid droplet area. (C and D)
Intracellular (C) TG and (D) AST and ALT levels were detected using
biochemical kits. (E) Determination of the expression levels of SOD
and MDA in HepG2 cells. (F) Graphs showing the electrophoretic
results of PCR analysis of the inflammatory factors MCP-1 and TGF-β
as well as GAPDH with sequence sizes of 190, 209, and 131 bp. (G)
Results were analyzed using semi-quantitative PCR relative to
GAPDH. Data are presented as the mean ± SD of three independent
repeats. ***P<0.001 vs. Control; #P<0.05,
##P<0.01 and ###P<0.001 vs. FFA group.
FFA, free fatty acids; TG, triglyceride; AST, aspartate
aminotransferase; ALT, alanine aminotransferase SOD, superoxide
dismutase, MDA, malondialdehyde; MCP-1, monocyte chemoattractant
protein-1; TGF-β, transforming growth factor-β; sh-, short hairpin;
ns, not significant. |
The excess inflammatory response caused by NAFLD
also induces oxidative stress in cells, further damaging liver
cells. To further explore whether Salusin-α could delay or reduce
the extent of this damage, the levels of SOD and MDA in the cells
were determined. The MDA levels in the FFA group were higher than
that of the control group, whereas the SOD levels were lower
(P<0.001). Following overexpression of Salusin-α, the levels of
MDA decreased, whereas those of SOD increased (Fig. 2E). The specific values of these
biochemical indicators are shown in Table II. SQ-PCR was used to detect the
mRNA expression levels of MCP-1 and TGF-β. It was also found that
the levels of these inflammatory factors in the FFA group were
higher than that in the control group (P<0.001), and the levels
of these two inflammatory factors in the Salusin-α overexpression
group were reduced compared with that in the FFA group. By
contrast, the levels in the knockdown group were significantly
increased (P<0.001) (Fig. 2F and
G). These results suggested that the overexpression of
Salusin-α can help to alleviate the inflammatory damage response
caused by the disorder of lipid metabolism, and the effect is
opposite after knockdown.
| Table IISpecific values for each biochemical
index. |
Table II
Specific values for each biochemical
index.
| Group | Index
|
|---|
| TG
(mmol/gprot) | ALT (U/gprot) | AST (U/gprot) | SOD (U/mgprot) | MDA
(nmol/mgprot) |
|---|
| control | 0.04±0.01 | 0.36±0.04 | 19.81±3.41 | 7.66±0.09 | 0.63±0.05 |
| FFA | 0.21±0.02 | 0.78±0.02a | 48.42±2.69a | 5.48±0.22a | 1.60±0.05a |
| FFA + pHAGE | 0.20±0.02 | 0.74±0.04 | 47.57±1.19 | 5.45±0.19 | 1.58±0.04 |
| FFA +
pHAGE-Salusin-α | 0.16±0.01c | 0.56±0.02d | 32.27±1.74d | 6.84±0.11d | 0.83±0.04d |
| FFA + shMock | 0.20±0.02 | 0.77±0.03 | 47.86±2.57 | 5.56±0.20 | 1.59±0.05 |
| FFA +
shSalusin-α | 0.26±0.02b | 1.03±0.06c | 55.25±2.62b | 5.24±0.10 | 1.65±0.03 |
Bioinformatics analysis shows that the
LKB1/AMPK pathway is involved in lipid metabolism
Given that Salusin-α may play a crucial role in the
lipid metabolism pathway in NAFLD, bioinformatics analysis was
performed using data on patients with NAFLD obtained from GEO. The
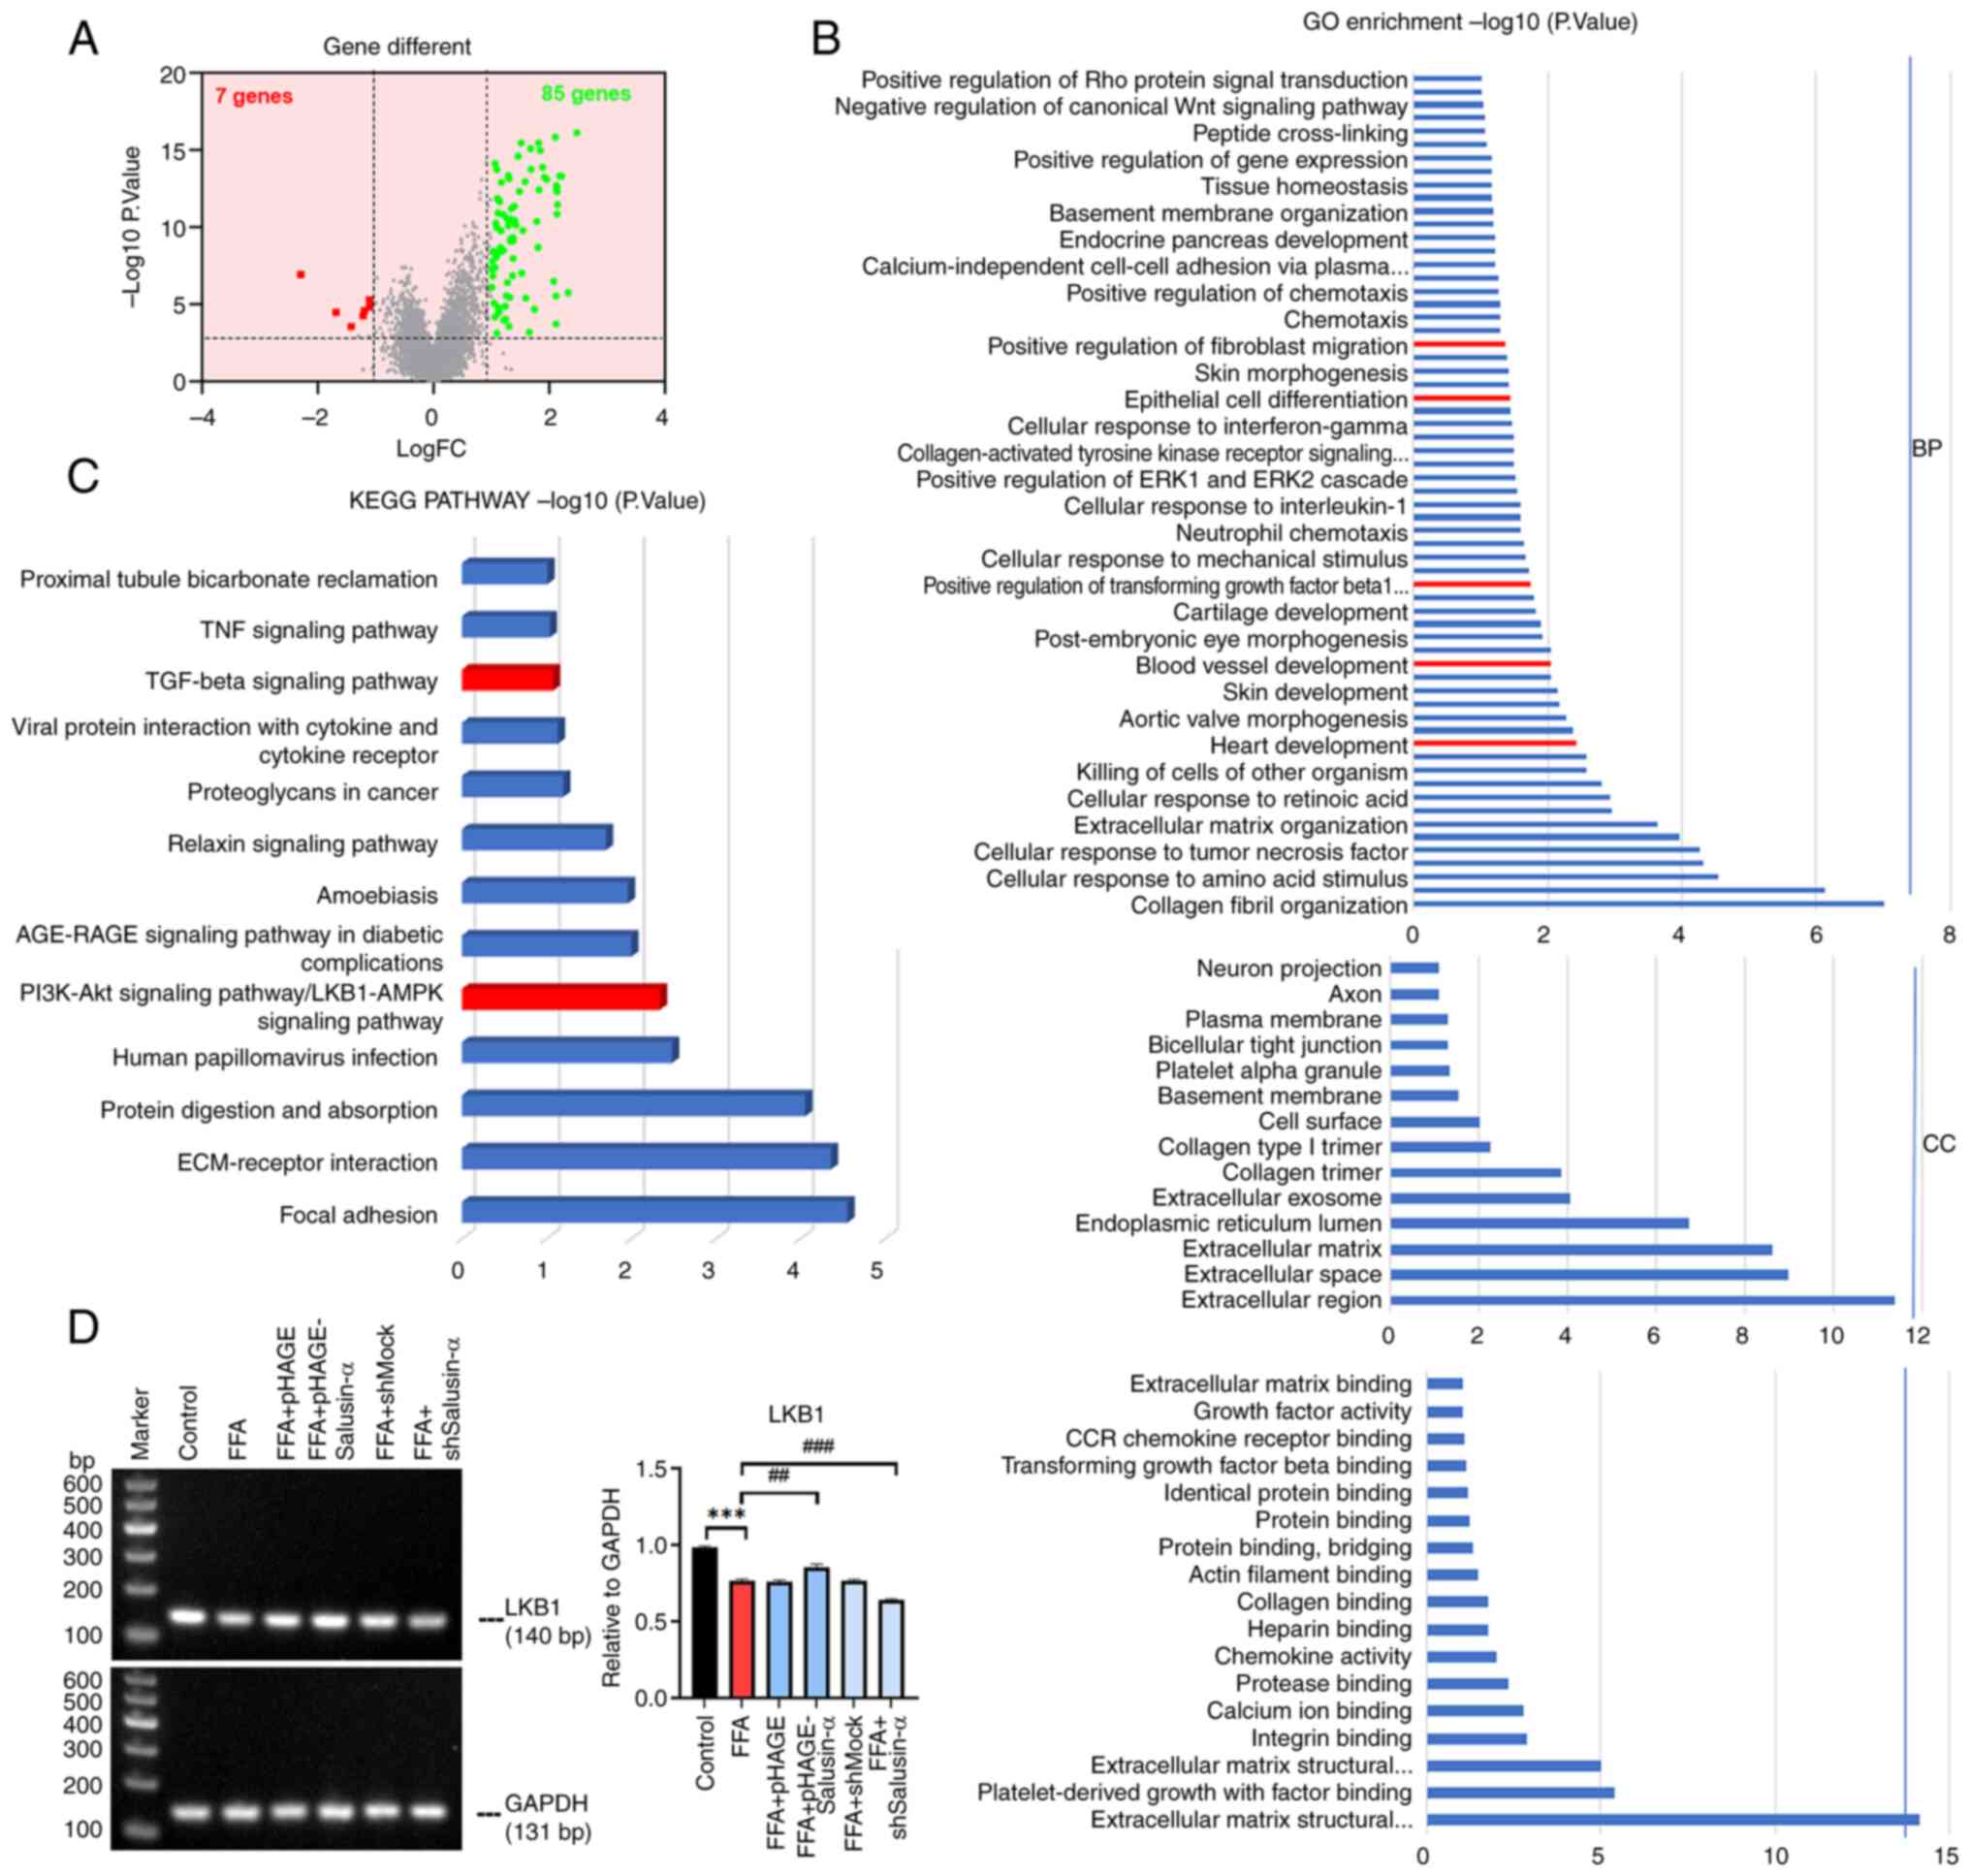
volcano map demonstrated that there were 85 upregulated genes and 7
downregulated genes in 72 patients with severe NAFLD compared with
normal as well as patients with mild NAFLD (Fig. 3A). GO enrichment analysis showed
that a series of changes such as inflammation, vascular
development, cell migration and immune response occurred during
steatosis with regard to biological processes, cellular component
and molecular function (Fig.
3B). The GO enrichment analysis of DEGs revealed that NAFLD
activated genes associated with the 'TGF-β signaling' pathway. In
addition, 11.7% of the genes were involved in the PI3K-Akt and
LKB1-AMPK signaling pathway (Fig.
3C). Pre-experiments on both pathway genes and the SQ-PCR
results revealed that the LKB1 levels in the FFA + pHAGE-Salusin-α
group were higher than that in the FFA group, while in the FFA +
shSalusin-α group, the levels were reduced. At the same time, it
was found that there was no significant difference in the change of
PI3K content (data not shown), thus the LKB1/AMPK pathway was
chosen to continue the experiment (Fig. 3D).
Overexpression and knockdown of Salusin-α
regulates lipid degeneration in HepG2 cells via the LKB1/AMPK
pathway
To determine whether Salusin-α exerted an inhibitory
effect on lipid accumulation in HepG2 cells via the LKB1/AMPK
signaling pathway, the mRNA expression levels of LKB1, AMPK,
SREBP-1c, ACC and FASN (all of which are members of this pathway),
as well as the protein expression levels of p-LKB1, LKB1, p-AMPK,
AMPK, SREBP1 and FASN, were assessed. In the FFA + pHAGE-Salusin-α
group, the expression of LKB1 and AMPK was slightly higher than
that in the FFA group, whereas in the FFA + shSalusin-α group, the
levels were reduced. SREBP-1c, FASN and ACC expression in the FFA +
pHAGE-Salusin-α group was reduced. By contrast, in the FFA +
shSalusin-α group, their expression levels were increased (Fig. 4A). This indicated that the levels
of LKB1 and AMPK in the FFA + pHAGE-Salusin-α group increased
slightly compared with the FFA group and were closer to those in
the control group; and SREBP-1c, ACC, as well as FASN expression
levels, were reduced. By contrast, the FFA + shSalusin-α group
exhibited more pronounced changes, aligning with the observed trend
in the FFA group (Fig.
4B-F).
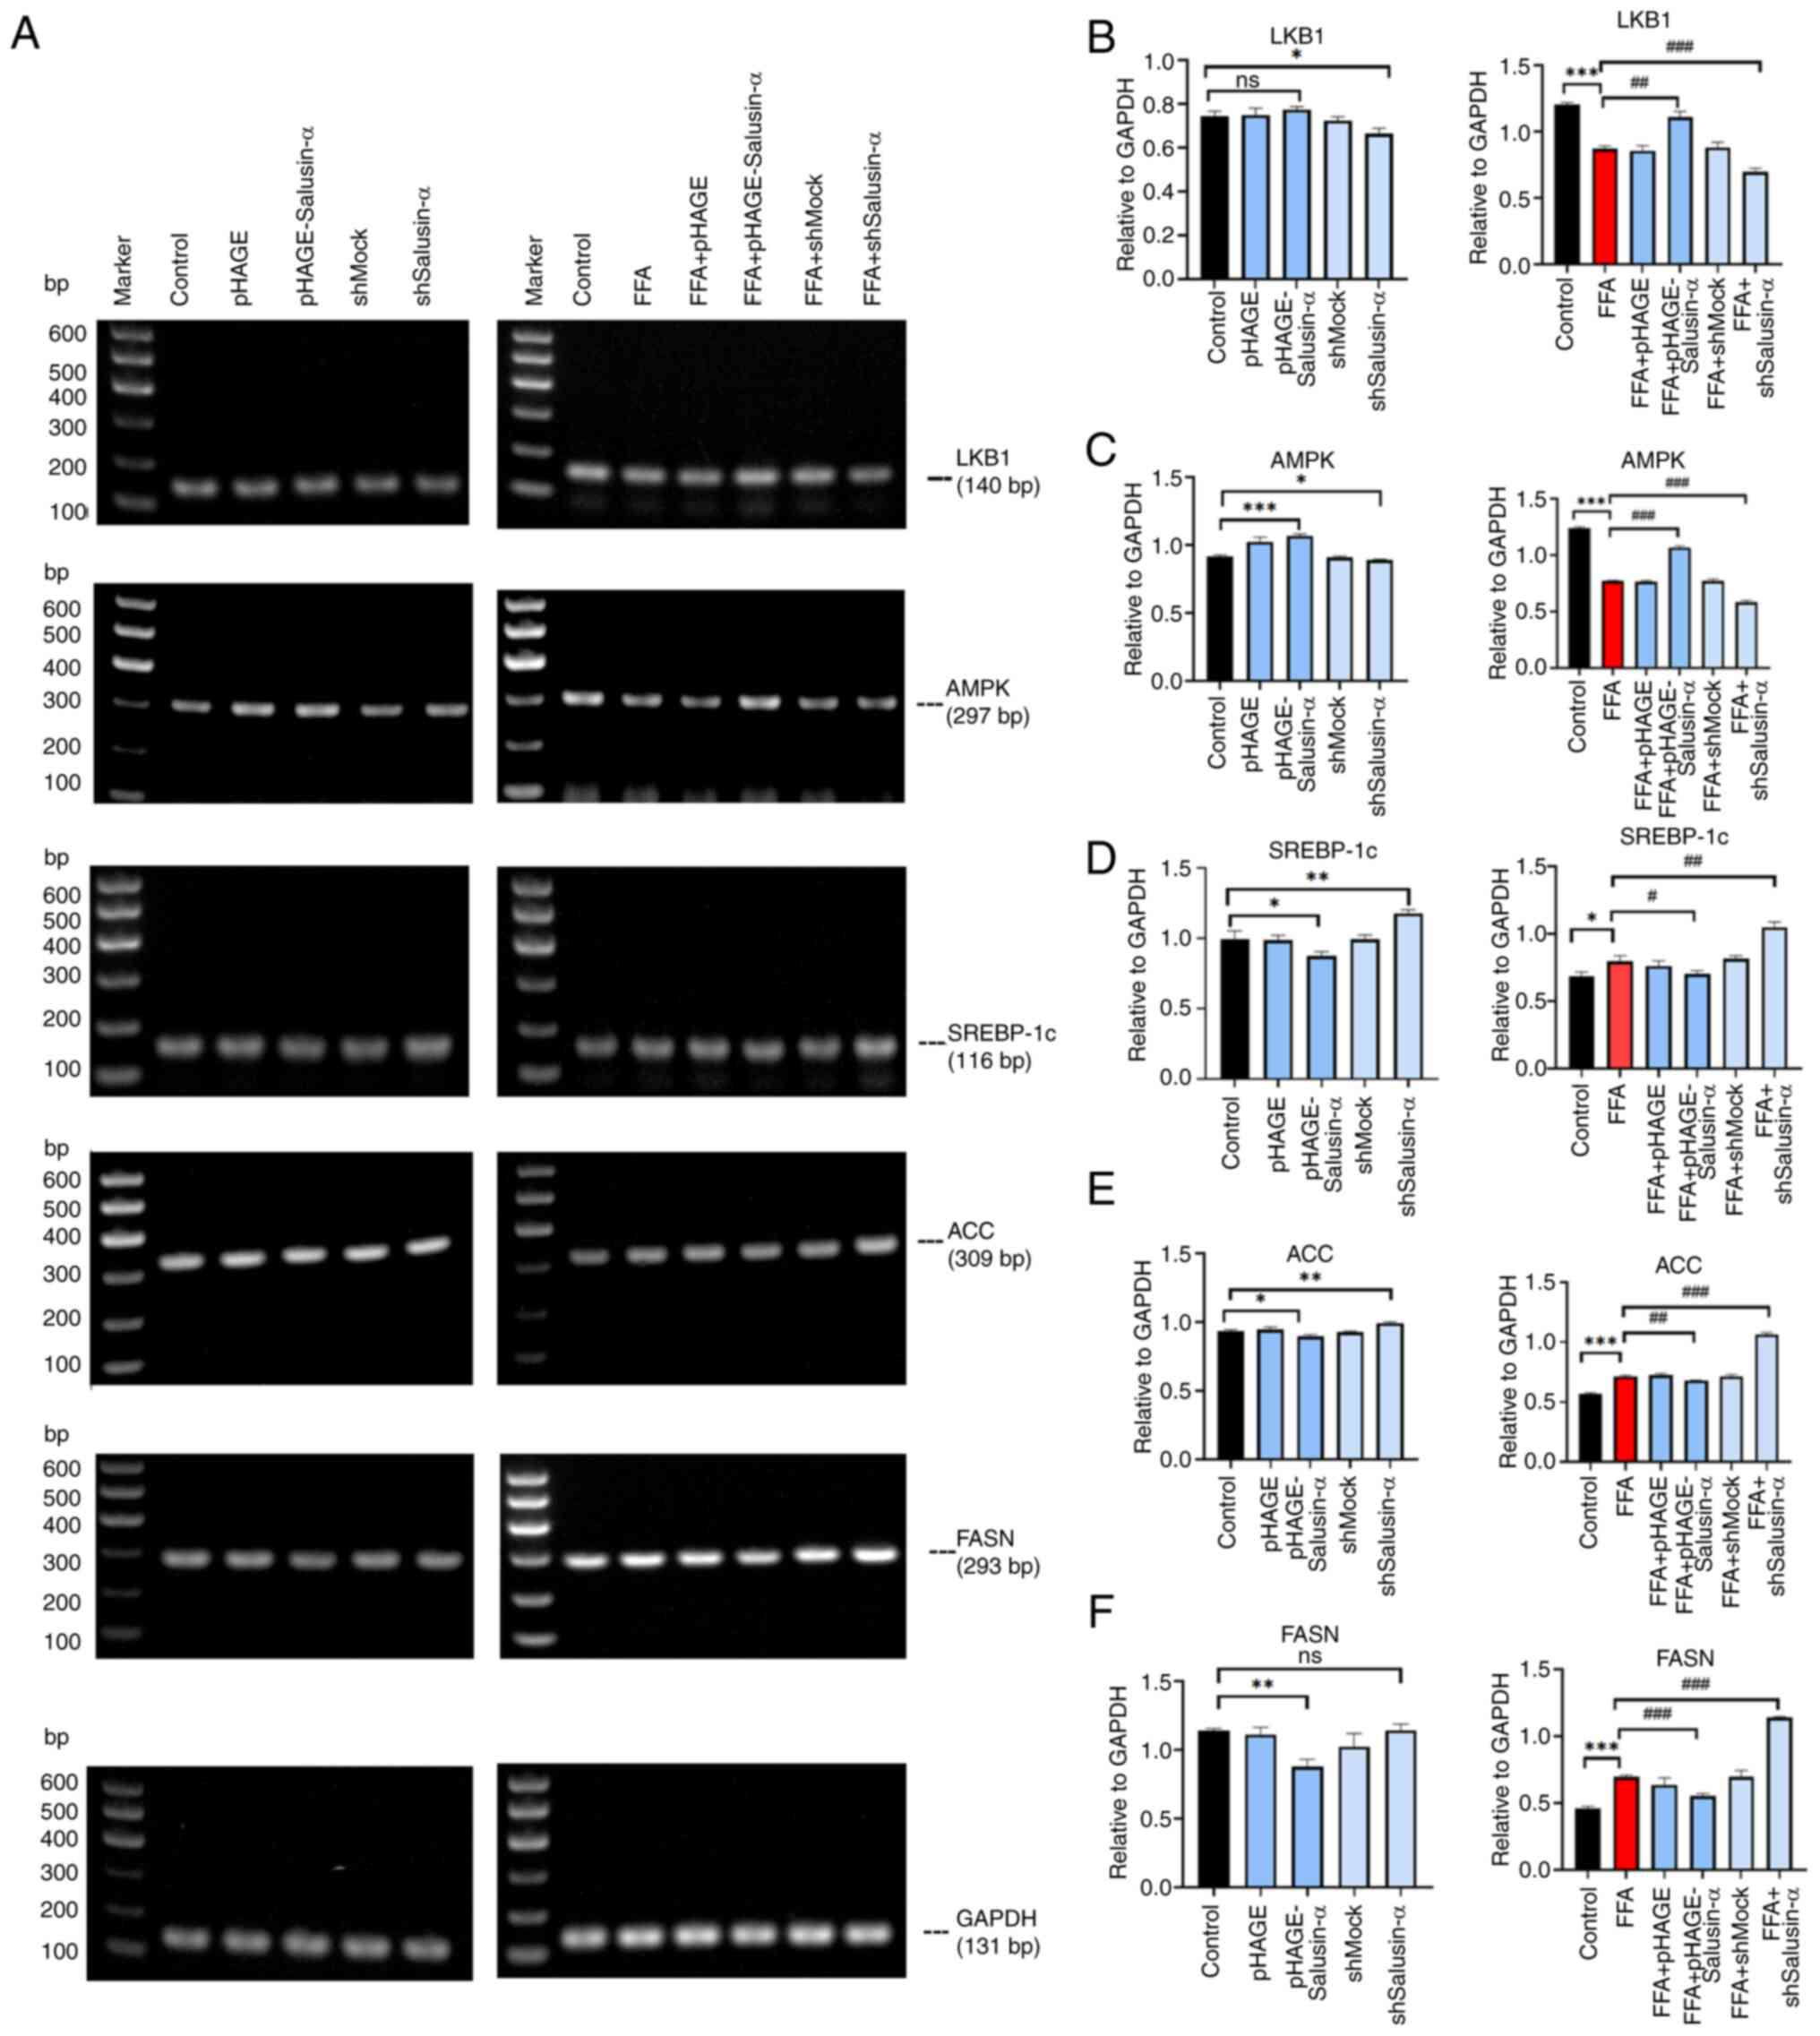 | Figure 4Effects of overexpression and
knockdown of Salusin-α on downstream molecules. (A) LKB1, AMPK,
SREBP-1c, ACC and FASN PCR electrophoresis results. The first
column shows the molecular changes of each group after transfecting
virus for 24 h. The second column shows the molecular changes after
24 h of virus transfection followed by 24 h of FFA induction. (B-F)
Relative expression of (B) LKB1, (C) AMPK, (D) SREBP-1c, (E) ACC
and (F) FASN in the different groups. Data are presented as the
mean ± SD. *P<0.05, **P<0.01 and
***P<0.001 vs. control; #P<0.05,
##P<0.01 and ###P<0.001 vs. FFA group.
LKB1, liver kinase B1; AMPK, adenosine 5′-monophosphate
(AMP)-activated protein kinase; SREBP-1c, sterol regulatory element
binding protein-1c; ACC, acetyl-CoA carboxylase; FASN, fatty acid
synthase; FFA, free fatty acid; sh-, short hairpin; ns, not
significant. |
The levels of each protein were altered following
transfection (Fig. 5A-E). The
levels of p-LKB1 and p-AMPK in the FFA group were lower than those
in the Control group, and the levels in the FFA + shSalusin-α group
were lower than those in the FFA group. The SREBP1 and FASN levels
were higher in the FFA + shSalusin-α group compared with the FFA
group. By contrast, in the FFA + pHAGE-Salusin-α group, they were
lower (Fig. 5F). After
transfecting cells with the Salusin-α overexpression plasmids and
then stimulating cells with FFA, it was found that the
phosphorylation levels of LKB1 and AMPK increased to a certain
extent. The levels of SREBP1 and FASN decreased (P<0.01)
compared with those of the FFA group, and after knockdown of
Salusin-α, the protein levels of p-LKB1 and p-AMPK decreased,
whereas the levels of SREBP1 and FASN were significantly increased
(Fig. 5G-J; P<0.001).
Therefore, it could be preliminarily determined that Salusin-α
regulated the LKB1/AMPK pathway and may thus play a role in
alleviating lipid metabolism disorders through this signaling
pathway.
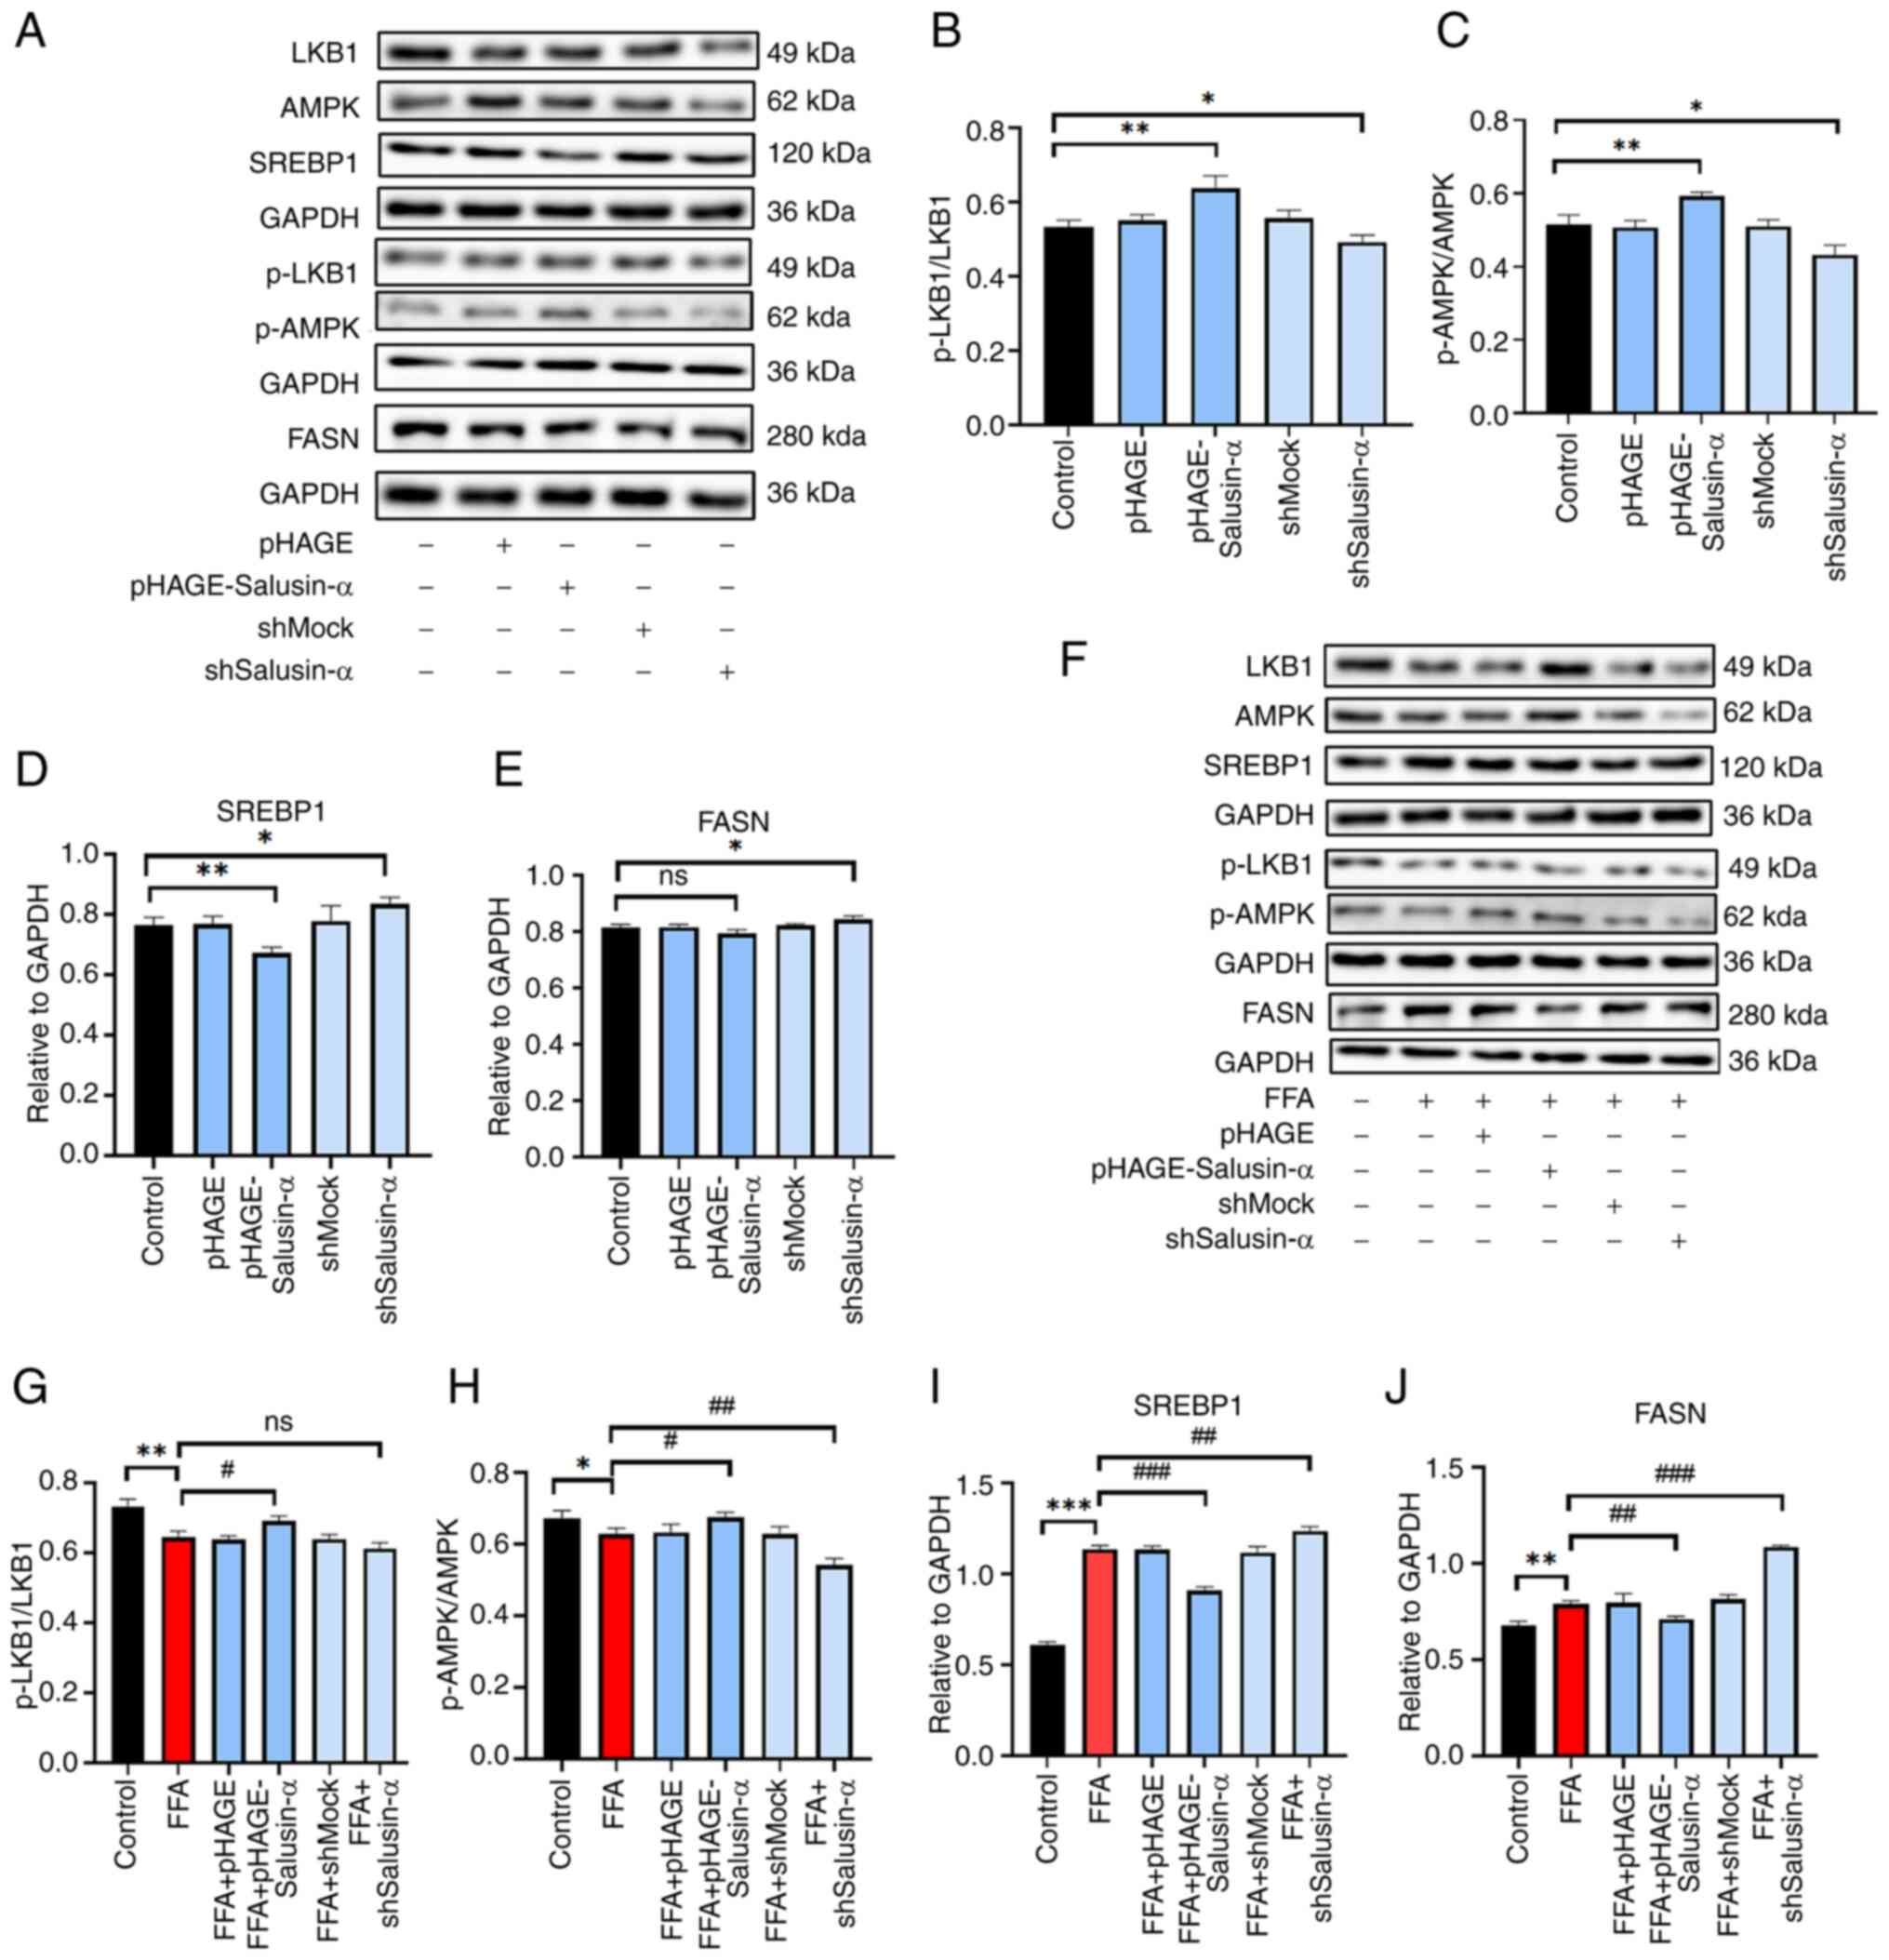 | Figure 5Validation of Salusin-α regulation of
lipid metabolism via the LKB1/AMPK pathway by western blotting. (A)
After lentiviral transfection of HepG2 cells for 24 h, western
blotting was used to detect the expression of several proteins in
the LKB1/AMPK downstream pathway. Expression of (B) p-LKB1/LKB1,
(C) p-AMPK/AMPK, (D) SREBP-1c and (E) FASN in each group. (F)
Lentiviruses were transfected for 24 h and then cells were induced
with FFA for 24 h. The bar graphs show the densitometric analysis
of the western blots. (G-J) Expression of (G) p-LKB1/LKB1, (H)
p-AMPK/AMPK, (I) SREBP-1c and (J) FASN in the different treatment
groups. Data are presented as the mean ± SD. *P<0.05,
**P<0.01 and ***P<0.001 vs. control;
#P<0.05, ##P<0.01 and
###P<0.001 vs. FFA group. LKB1, liver kinase B1;
AMPK, adenosine 5′-monophosphate (AMP)-activated protein kinase;
SREBP-1c, sterol regulatory element binding protein-1c; FASN, fatty
acid synthase; p-, phosphorylated; FFA, free fatty acid; sh-, short
hairpin; ns, not significant. |
Inhibition of AMPK further indicates that
Salusin-α overexpression and knockdown regulate the LKB1/AMPK
pathway
Compound C, an AMPK inhibitor, was used to treat
cells alongside the transfection experiments to evaluate the
alterations in the downstream-related molecules. According to the
proportion of lipid area to cell area, the addition of the
inhibitor to the FFA group resulted in more notable changes to fat
and an increase in lipid area. Following overexpression of
Salusin-α and treatment with Compound C, the lipid droplet area was
larger than that of the group treated with Salusin-α overexpression
alone. This suggested that AMPK was inhibited, and Salusin-α was
unable to exert the effect of alleviating lipid accumulation
through the AMPK pathway. Additionally, the lipid droplet area was
significantly increased following interference of Salusin-α
co-treated with Compound C (Fig. 6A
and B).
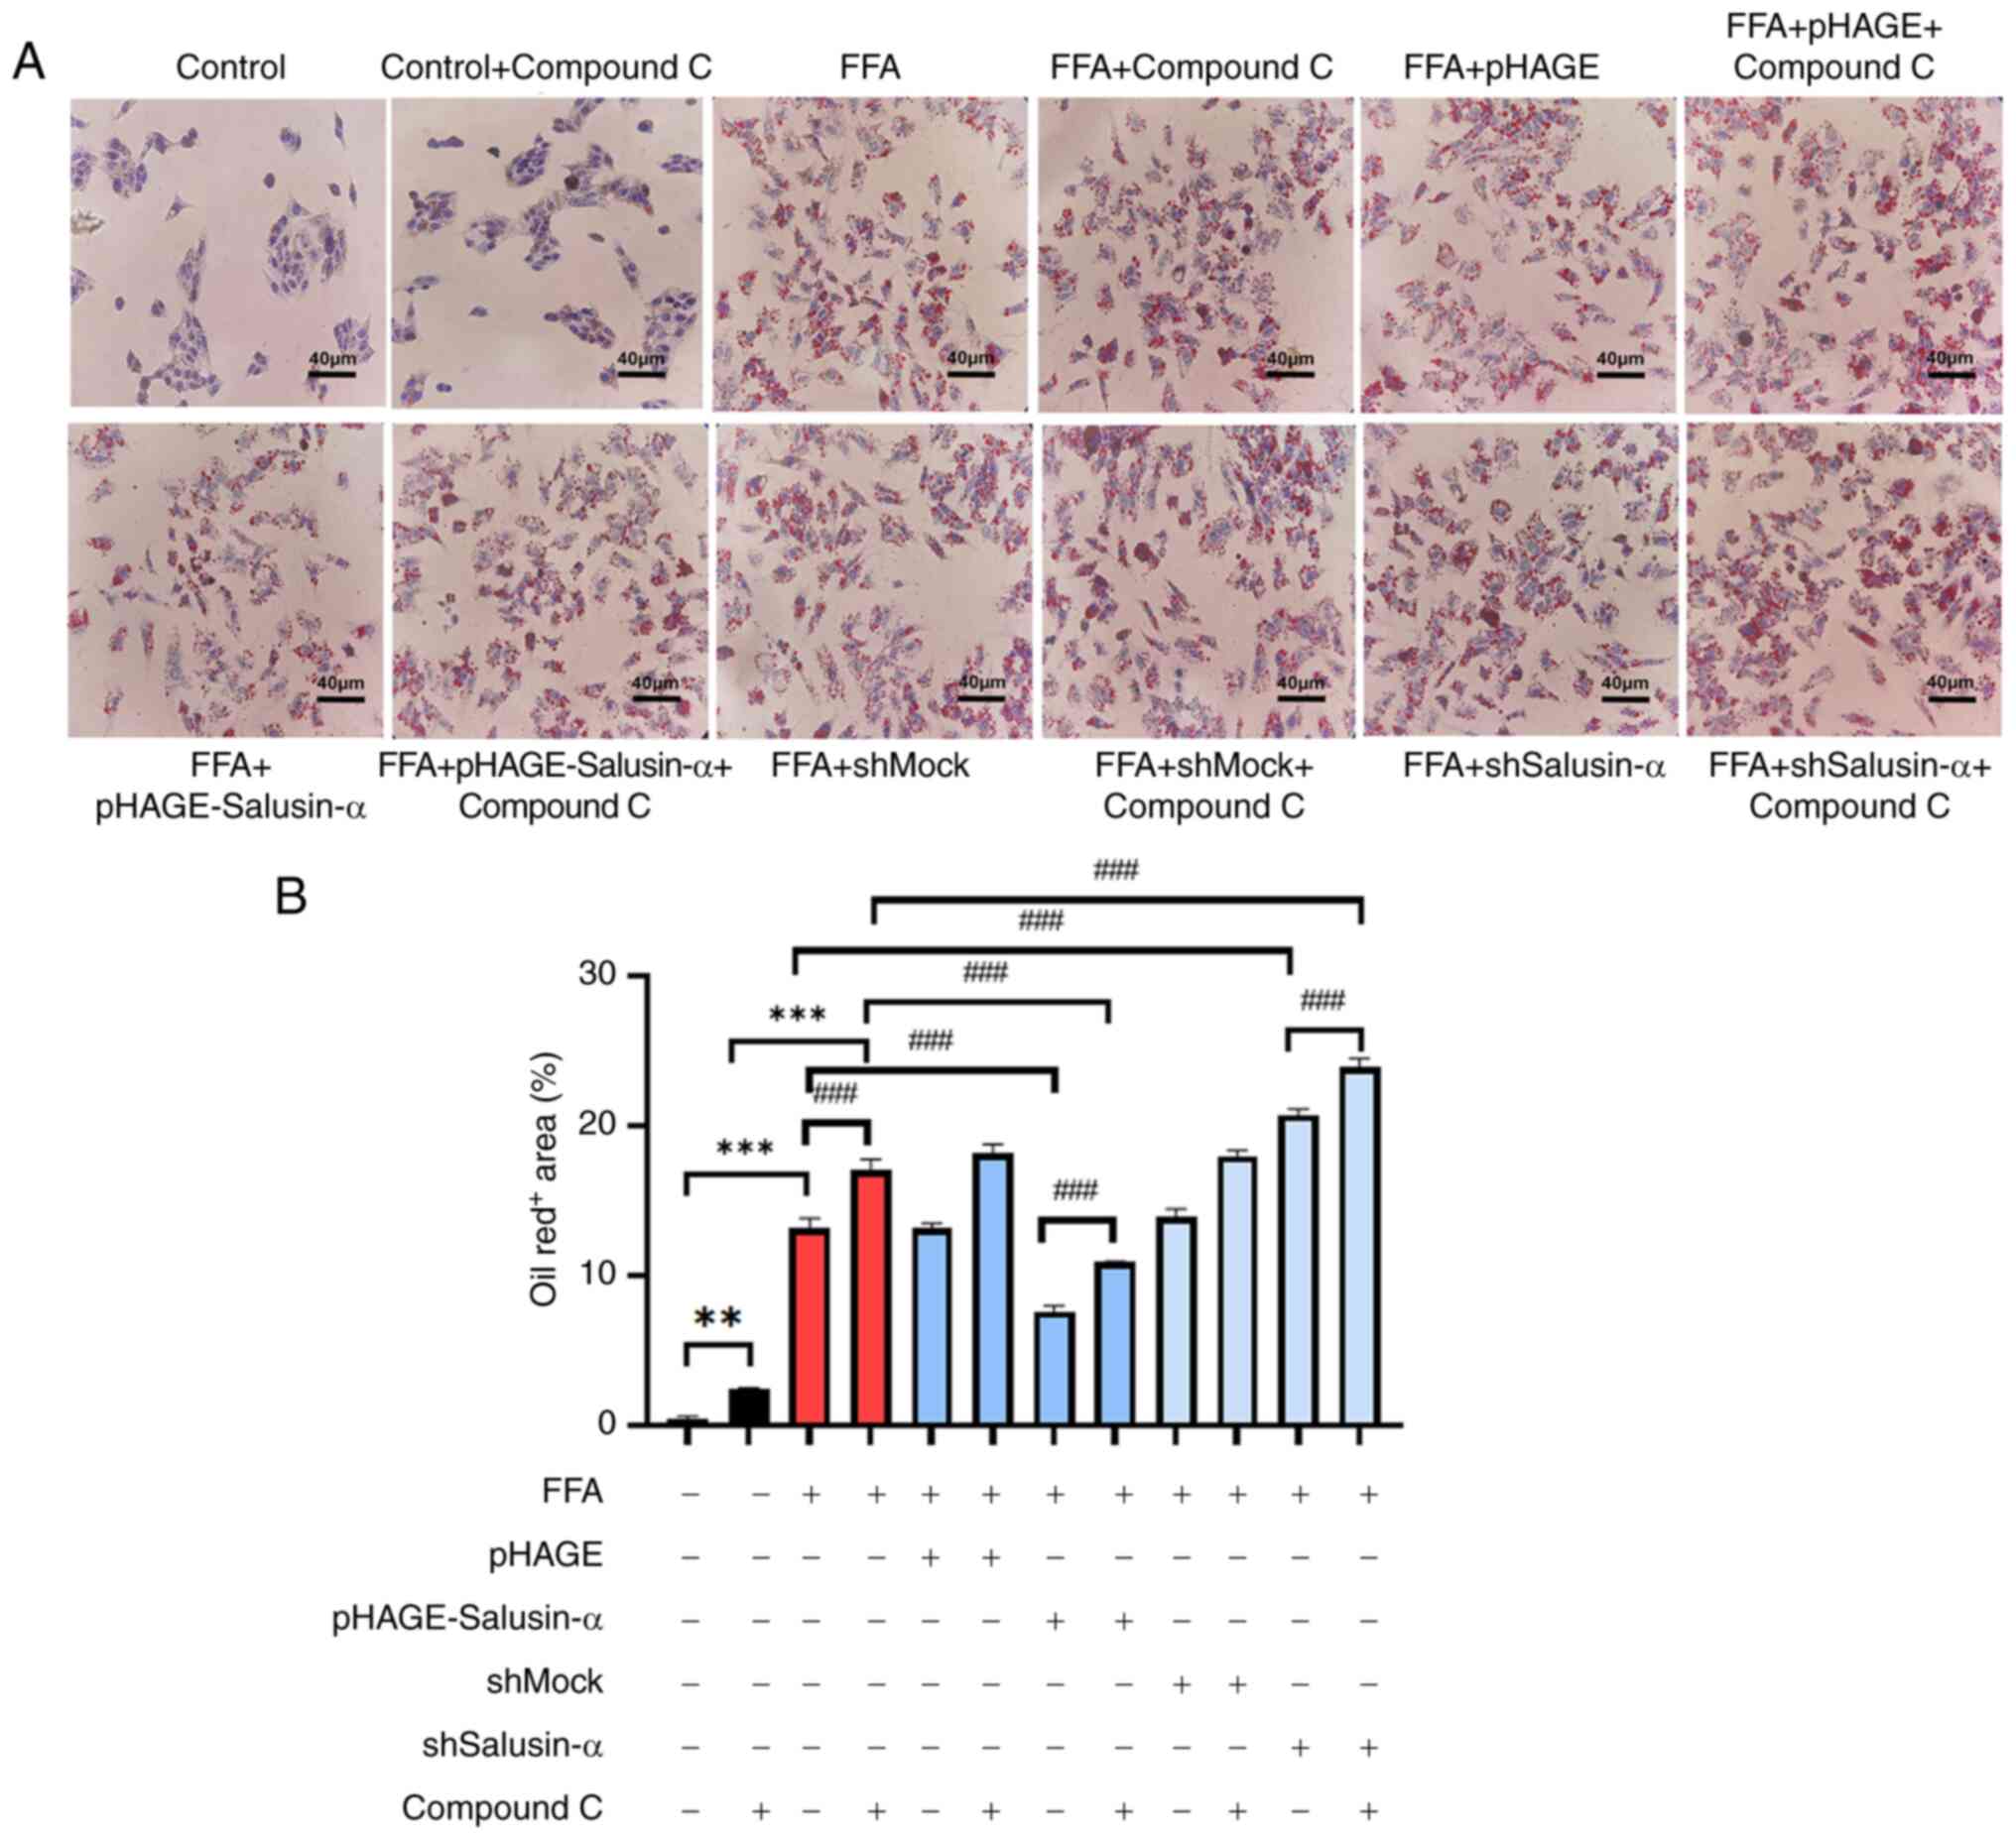 | Figure 6Treatment with an AMPK inhibitor
increased the degree of lipid accumulation. (A) Oil red O staining
of cells in the control group, control + compound C group, FFA
group, FFA + compound C group, FFA + pHAGE group, FFA + pHAGE +
compound C group, FFA + pHAGE-Salusin-α group, FFA + pHAGE-S
alusin-α + Compound C group, FFA + shMock group, FFA + shMock +
compound C group, FFA + shSalusin-α group and FFA + shSalusin-α +
compound C group. Scale bar, 40 µm. (B) Quantification of
lipid content in oil red O-stained cell. Data are presented as the
mean ± SD of three repeats. **P<0.001 and
***P<0.001 vs. control; ###P<0.001 vs.
FFA group. AMPK, adenosine 5′-monophosphate (AMP)-activated protein
kinase; FFA, free fatty acid; sh, short hairpin; ns, not
significant. |
The mRNA expression levels of LKB1 and AMPK in the
FFA + pHAGE-Salusin-α + Compound C group were lower than those in
the FFA + pHAGE-Salusin-α. The mRNA expression levels of SREBP-1c,
FASN and ACC in the FFA + shSalusin-α + Compound C group were
higher than those in the FFA + shSalusin-α group (Fig. 7A). The mRNA expression levels of
SREBP-1c, ACC and FASN content in the FFA group were higher than
that of the control group (P<0.001). The addition of compound C
further exacerbated this upregulation. In addition, compound C
further decreased AMPK expression but had little effect on LKB1
levels (P>0.05). The mRNA levels of SREBP-1c, FASN and ACC in
the Salusin-α overexpression group were lower than those in the FFA
group. The addition of Compound C partially reversed the modulatory
effect of Salusin-α. By contrast, the mRNA expression levels of
SREBP-1c, ACC and FASN were the highest after co-treatment of
Salusin-α knockdown and Compound C (Fig. 7B-F).
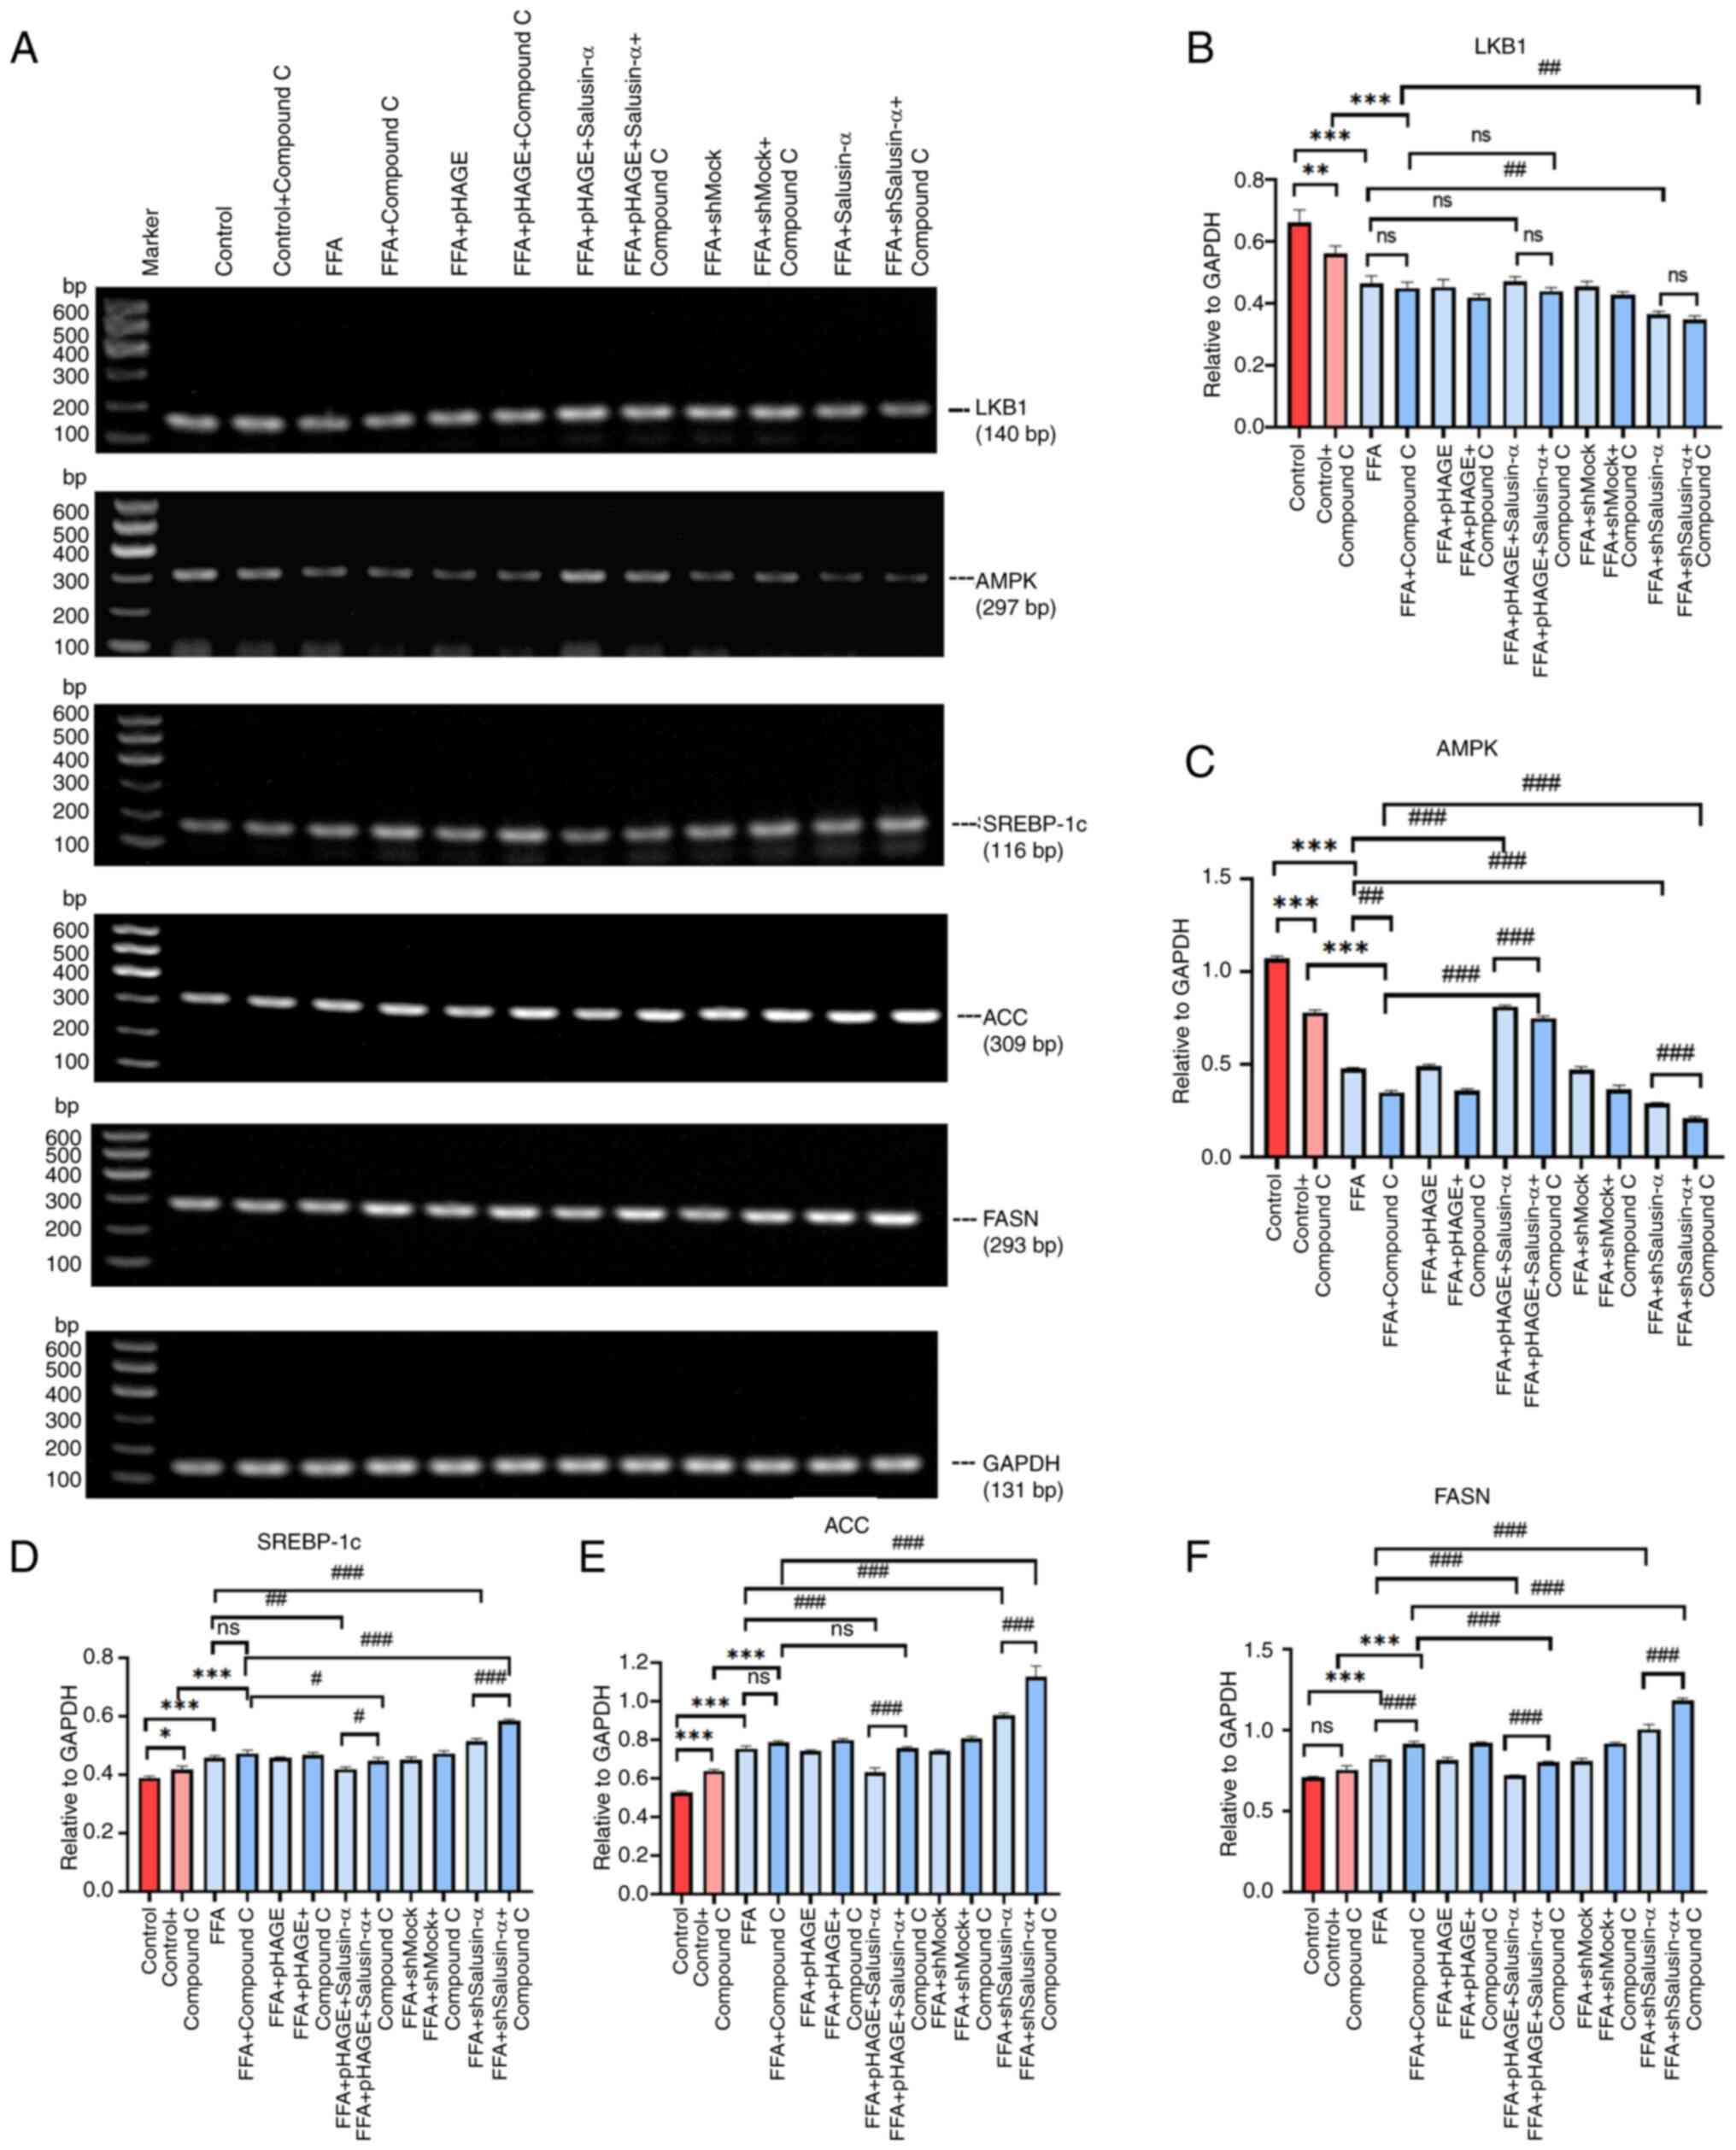 | Figure 7PCR was used to confirm the molecular
changes following treatment with the inhibitors. (A) Images of
agarose gels following PCR amplification of LKB1, AMPK, SREBP-1c,
ACC, FASN and GAPDH in each group. (B-F) Relative expression of (B)
LKB1, (C) AMPK, (D) SREBP-1c, (E) ACC and (F) FASN. Data are
presented as the mean ± SD. *P<0.05,
**P<0.01 and ***P<0.001 vs. control;
#P<0.05, ##P<0.01 and
###P<0.001 vs. FFA group. LKB1, liver kinase B1;
AMPK, adenosine 5′-monophosphate (AMP)-activated protein kinase;
SREBP-1c, sterol regulatory element binding protein-1c; ACC,
acetyl-CoA carboxylase; FASN, fatty acid synthase; FFA, free fatty
acid; sh, short hairpin; ns, not significant. |
The protein expression levels of p-AMPK in the FFA +
Compound C group were lower than those of the FFA group, and the
expression levels of FFA + pHAG E-Salusin-α + Compound C group were
slightly lower than those of the FFA + pHAGE-Salusin-α group, which
reduced the phosphorylation level of AMPK. By contrast, the levels
of p-LKB1 did not exhibit notable changes in the different groups.
The levels of SREBP1 and FASN were higher in the FFA + shSalusin-α
+ Compound C group than in the FFA + shSalusin-α group, and the
expression levels in the FFA + Compound C group were significantly
higher than that in the FFA group (Fig. 8A). Compound C treatment further
reduced the p-AMPK/AMPK ratio in the Salusin-α overexpressing
cells, while it had little effect on the p-LKB1/LKB1 ratio.
Additionally, the SREBP1 and FASN protein expression levels in both
the Salusin-α overexpression and knockdown groups were increased
after the addition of the inhibitor compared with the same
treatment without the inhibitor (Fig. 8B-E), thus demonstrating that the
inhibitory effect of Salusin-α on lipid droplets in FFA-treated
HepG2 cells was partially attenuated when treated with an AMPK
inhibitor.
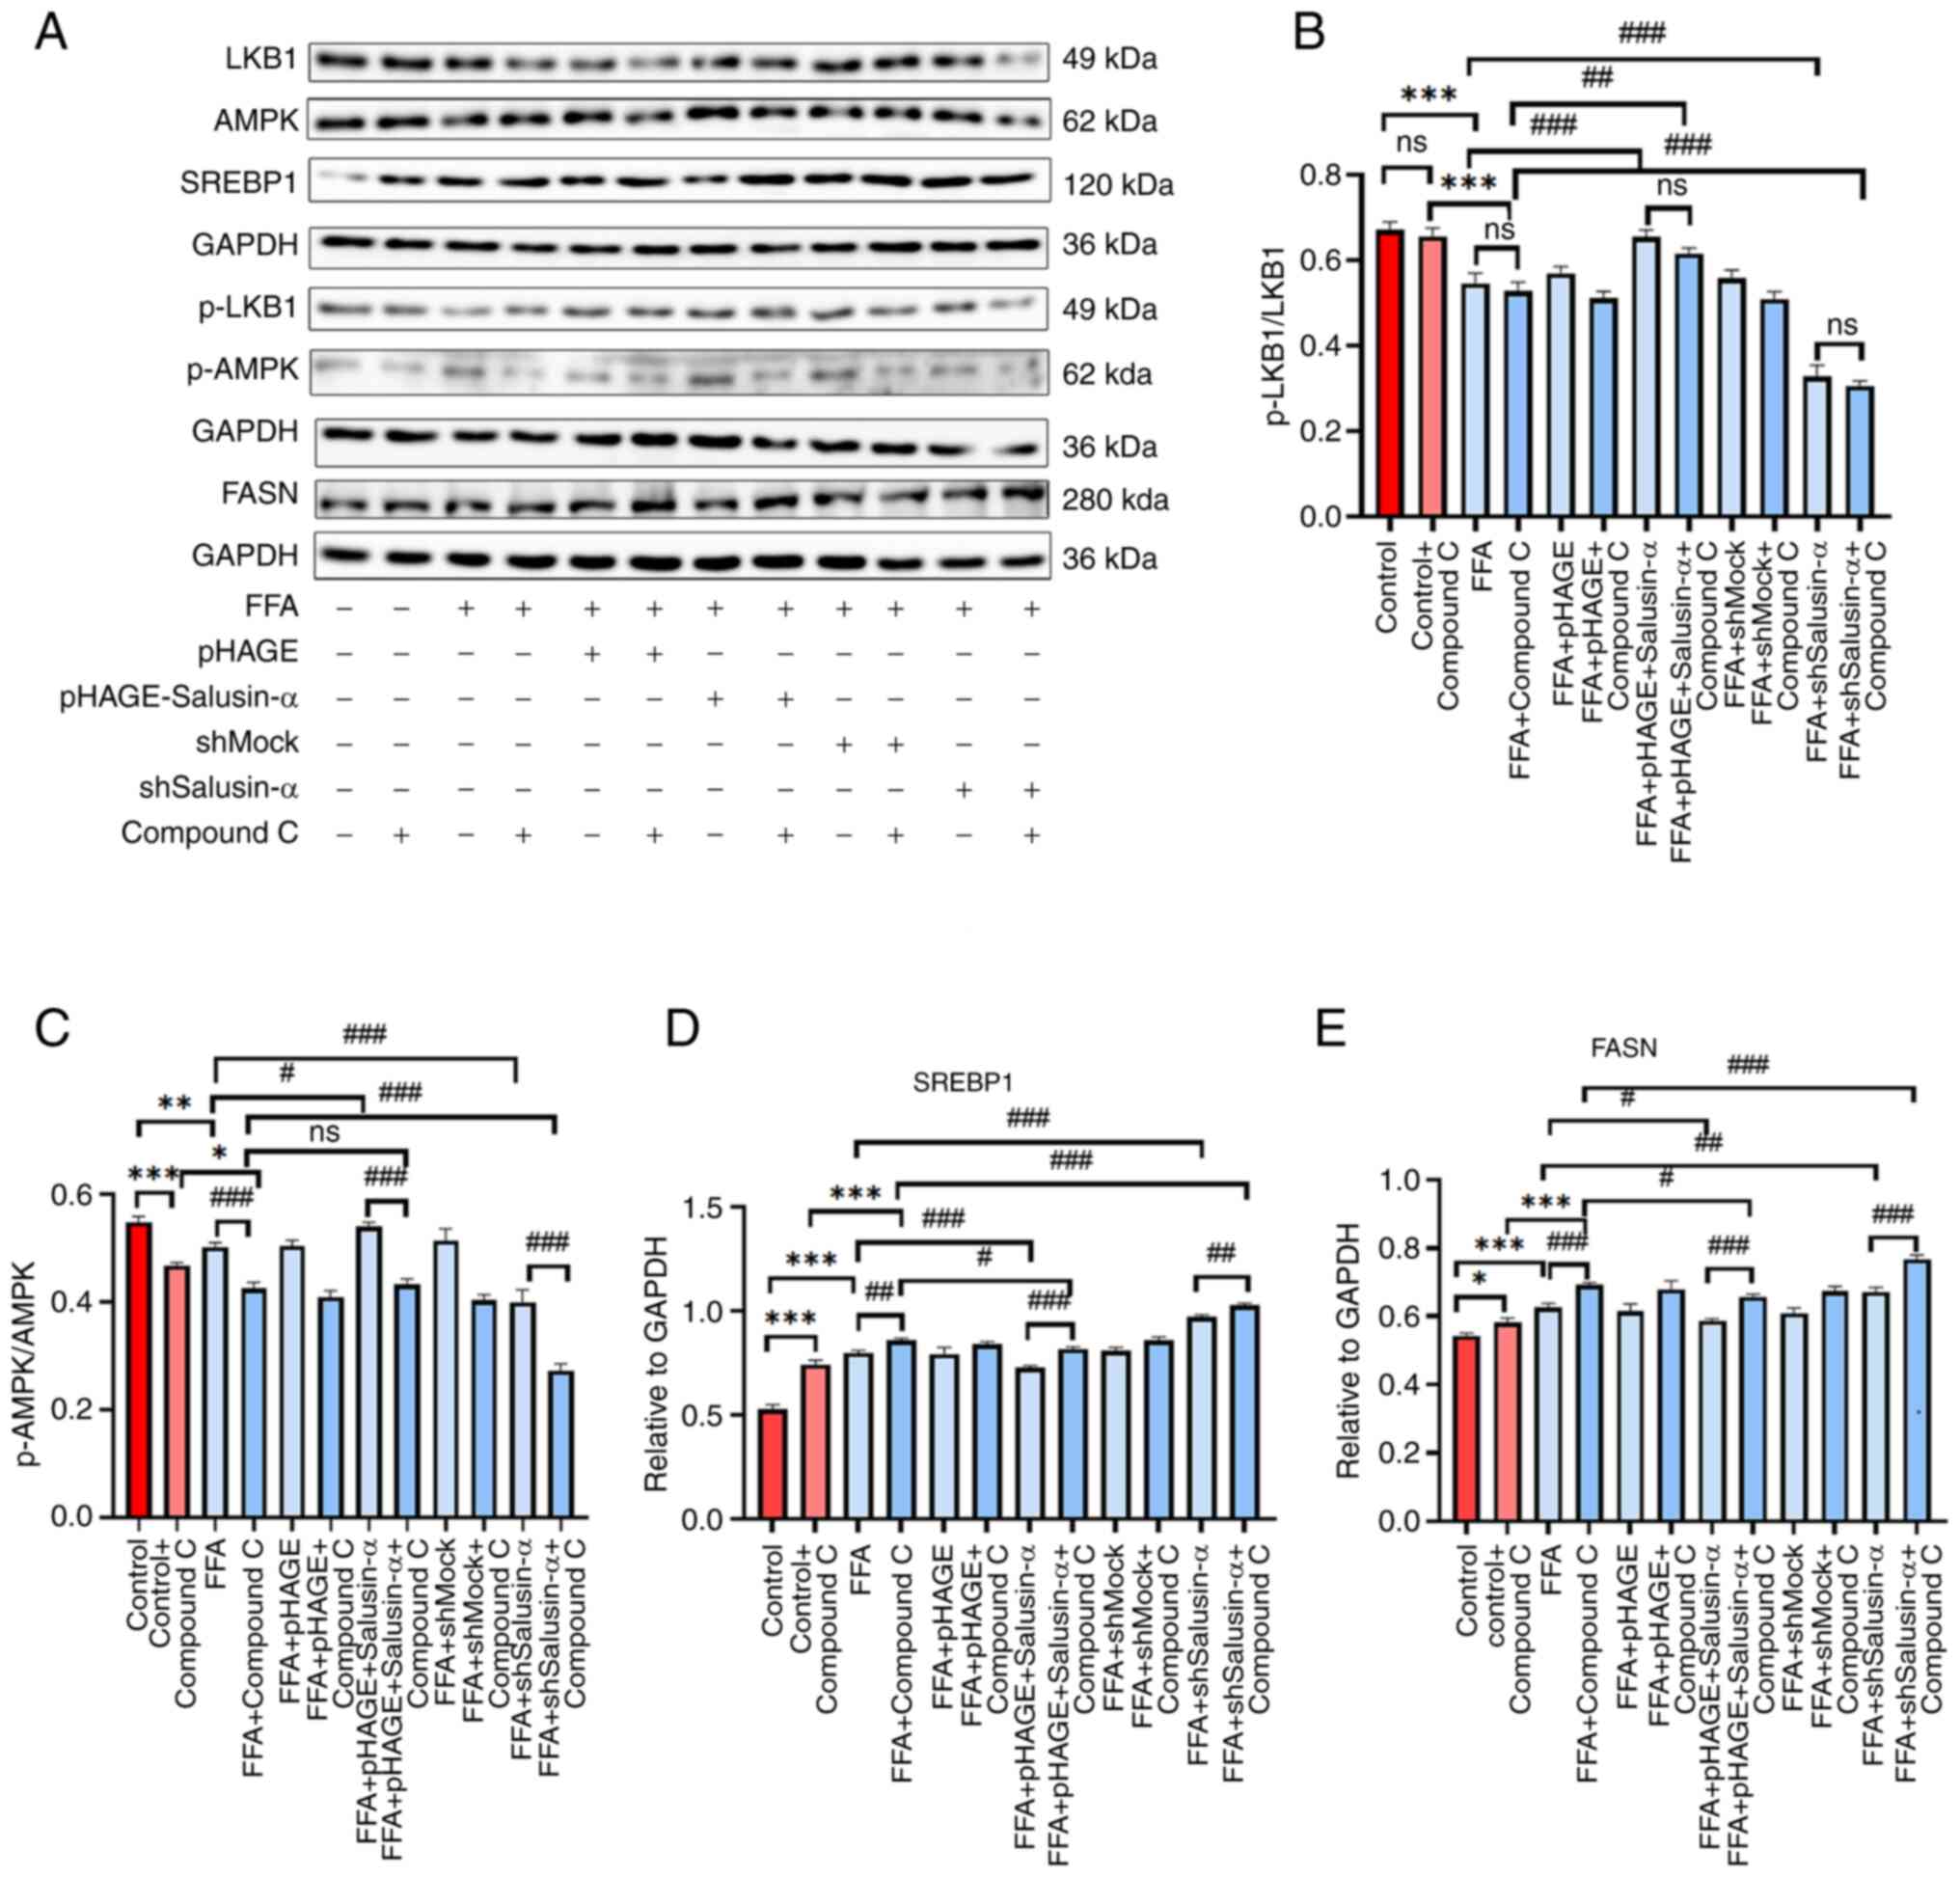 | Figure 8Western blotting was used to confirm
the changes in the expression of downstream molecules following
addition of inhibitors. (A) The induction of FFA in HepG2 cells
after 24 h transfection with the lentivirus and Compound C was
compared with that after transfection with the virus alone, and
western blotting was used to detect the expression of each protein
downstream in the LKB1/AMPK pathway. (B-E) Protein expression
levels of (B) p-LKB1/LKB1, (C) p-AMPK/AMPK, (D) SREBP-1c and (E)
FASN in each group. Data are presented as the mean ± SD.
*P<0.05, **P<0.01 and
***P<0.001 vs. control; #P<0.05,
##P<0.01 and ###P<0.001 vs. FFA group.
FFA, free fatty acid; LKB1, liver kinase B1; AMPK, adenosine
5′-monophosphate (AMP)-activated protein kinase; p-,
phosphorylated; SREBP-1c, sterol regulatory element binding
protein-1c; FASN, fatty acid synthase; sh, short hairpin; ns, not
significant. |
Discussion
Previous studies have shown that both Salusin-α and
-β are important cardiovascular regulatory peptides and may have
opposite effects on lipid metabolism; and there are relatively few
studies on the direction of lipid metabolism of Salusin-β, which
needs further confirmation. The authors' research group previously
found that overexpression of Salusin-β would decrease the
expression of AdipoR1 and thus increase lipid accumulation
(19). Salusin-α may serve as a
therapeutic target for the management of atherosclerosis,
hypertension and other coronary artery diseases by reducing lipid
accumulation, reducing vascular endothelial inflammation, and
reducing foam cell formation (13-15,21). Disorders of lipid metabolism are
the causes of these aforementioned diseases. In the case of
abnormal lipid levels, hyperlipidemia eventually progresses to
chronic vascular diseases such as atherosclerosis, and can also
induce the development and/or progression of a series of metabolic
diseases such as NAFLD (22,23). Since Salusin-α regulates lipid
metabolism, it is possible that it also plays a vital role in
NAFLD. It has been previously shown in animal experiments that
Salusin-α can inhibit liver steatosis in mice and reduce plasma TG
levels (16); however, the exact
mechanism of its influence on lipid metabolism in hepatocytes
remains unclear. The present study demonstrated for the first time,
to the best of our knowledge, the specific mechanism by which
Salusin-α alleviates lipid metabolism disorders in HepG2 cells.
Salusin-α was identified to regulate the LKB1/AMPK pathway, thus
providing a potential target for the prevention of NAFLD. In future
studies, the interference of other diseases shall be also excluded
and a lipid metabolism disorder model will be constructed in
animals to further verify this conclusion.
Unlike previous experiments involving protein
injections into animals, the lentiviral vectors used in the present
study were effectively integrated into the chromosomes of HepG2
cells as previously described (18), holding the advantage of
long-lasting lentiviral infection and stable expression of the
target gene over an extended period of time, that is maintained
throughout cell division and thus subsequent generations (24). In addition, the selection of
cells as experimental objects, compared with the direct animal
experiments, has certain advantages: The cost is lower, the time is
shorter, the verification can be repeated several times, and the
additional damage to the animals due to the immature technology can
be avoided to a certain extent. To induce adipogenesis, FFAs were
used, which are the simplest form of lipids found in adipose tissue
and are essential in energy storage and cell signaling in
vivo (25). The results
showed that FFA, as an inducer, could mimic the in vivo
environment and facilitate the differentiation of hepatocytes into
adipocytes, reflecting the physiological process of cellular
steatosis in an improved way.
Thus, HepG2 cells were transfected with lentiviral
vectors for Salusin-a overexpression or knockdown, and then
different groups of cells were induced by FFA. The changes in the
various lipid metabolism indices before and after transfection and
induction were observed. It was found that the expression of
molecules related to lipid metabolism began to change after viral
injection into cells. In particular, following FFA induction, the
lipid drop area of the overexpression Salusin-α group was smaller
than that of the FFA group, and the levels of TG, ALT and AST were
reduced, while the lipid accumulation in the interference Salusin-α
group was higher than that in the FFA group, suggesting that
Salusin-α inhibited lipid production, promoted lipid oxidation, and
prevented lipid accumulation. Additionally, it was observed that
after FFA-induced cell lipidation, the levels of the inflammatory
factors MCP-1 and TGF-β in cells increased, which again confirmed
that abnormal lipid metabolism could induce inflammation. This is
because imbalances in lipid metabolism produce reactive oxygen
species (ROS) that over-oxidize lipids (26), and excess lipid accumulation not
only leads to dyslipidemia but also endoplasmic reticulum stress
(27), resulting in increased
levels of pro-inflammatory cytokines, thus triggering a series of
reactions associated with liver injury (3,28). The continuous inflammatory
response further causes excessive ROS accumulation and thus
oxidative stress, which leads to degeneration and necrosis of
hepatocytes and ultimately, the production of MDA, a peroxidized
end-product (29,30). In contrast to MDA, SOD is a major
member of the antioxidant system and is used to protect cell
structure and function from oxidative damage. Therefore, assessing
the levels of both can reflect the degree of oxidative stress in
the body and indirectly reflect the degree of liver cell damage and
fibrosis. It was found that following overexpression of Salusin-α,
the levels of markers of oxidative stress (MDA and SOD)
respectively decreased and increased compared with the FFA group,
while interference with Salusin-a demonstrated the opposite
results. These results suggested that Salusin-α can mitigate
inflammation and oxidative stress in hepatocytes by regulating
lipid metabolism. It is hypothesized that Salusin-α may serve as a
biomarker for the early prevention and detection of lipid
metabolism disorders (31).
To further elucidate the underlying mechanism by
which Salusin-α alleviated disordered lipid metabolism in
hepatocytes in the in vitro model of NAFLD, bioinformatics
analysis was performed on the exome of 72 fatty liver disease
samples in a dataset obtained from GEO to identify differentially
expressed genes that were upregulated and downregulated in patients
with NAFLD to determine the signaling pathways related to lipid
metabolism in hepatocytes. The results highlighted two key
signaling pathways; the PI3K-Akt (32) and LKB1-AMPK, closely related to
hepatic lipid metabolism. Pre-experiments on these two pathways
were performed, which indicated that Salusin-α appeared to have a
stronger impact on LKB1 and AMPK compared with PI3K and AKT, as
determined by SQ-PCR. Moreover, previous studies have also
confirmed that the LKB1/AMPK pathway is a key pathway regulating
lipid metabolism and is closely related to energy metabolism, and
may thus serve as a therapeutic target for NAFLD (33,34). There are few studies on the
mechanism of Salusin-α to alleviate lipid metabolism disorder
(16,18). Thus, it is worth investigating
whether the mechanism underlying the improvements in lipid
metabolism exerted by Salusin-α involves the LKB1/AMPK pathway in
hepatocytes.
Given that Salusin-α may exert an inhibitory effect
on lipid accumulation in HepG2 cells through the LKB1/AMPK
signaling pathway, the mRNA expression levels of LKB1, AMPK,
SREBP-1c, ACC and FASN (all members of the pathway), as well as the
protein expression levels of p-LKB1, LKB1, p-AMPK, AMPK, SREBP1 and
FASN were determined. AMPK, a crucial regulator of metabolism and
mitochondrial homeostasis, could be activated through LKB1, which
is a key upstream kinase, whereas SREBPs, of which there are three
isoforms in mammalian cells (SREBP-1a, -1c, and -2), are major
regulators of lipid metabolism that regulate lipid oxidation and
catabolism (35). Additionally,
SREBP-1c, which primarily governs the synthesis of fatty acids, can
be activated by AMPK at the serine (Ser)372 site, leading to the
inhibition of the translocation of SREBP-1c into the nucleus, thus
regulating TG synthesis (36-38). ACC and FASN are downstream
substrates of SREBP-1c and serve as crucial enzymes in regulating
hepatic TG metabolism (39).
Notably, the present study showed that following the overexpression
of Salusin-α in HepG2 cells and stimulation with FFA, the
expression levels of LKB1 and AMPK were increased compared with
that in the FFA group, while the expression of SREBP-1c, ACC and
FASN decreased; the opposite results were observed following
Salusin-α knockdown. Thus, it was preliminarily confirmed that
overexpression of Salusin-α activated AMPK by promoting LKB1
phosphorylation, which in turn downregulated the expression levels
of SREBP-1c, and decreased the expression of its target genes FASN
and ACC, thereby inhibiting the synthesis of TG, cholesterol and
fatty acids, accelerating the oxidative decomposition of fatty
acids, reducing the deposition of lipids in the liver, and
ultimately ameliorating hepatic steatosis (40).
To further confirm that the changes in the levels of
SREBP-1c, FASN and ACC were caused by the changes in the levels of
AMPK following the alterations to Salusin-α expression, compound C,
an inhibitor of AMPK, was also added in subsequent experiments. It
was found that lipid accumulation in the compound C-treated group
was higher than that in the non-compound C-treated group,
indicating that the inhibition of AMPK in cells could not degrade
lipids through this pathway. It is worth noting that although the
levels of cellular adipose in the FFA + pHAGE-Salusin-α + compo und
C group were lower than that in the FFA + compound group, it was
higher than that in the FFA + pHAGE-Salusin-α group. Moreover, the
levels of cellular adipose in the FFA + shSalusin-α + Compound C
group were higher than that in the FFA + compound C group. These
results suggested that Salusin-α content has an important effect on
the severity of lipidation in HepG2 cells, but its inhibitory
effect on lipid accumulation in hepatocytes was limited by AMPK
inhibitors. Correspondingly, following compound C treatment, the
expression of AMPK decreased, and the expression levels of the
downstream molecules SREBP-1c, FASN and ACC increased, resulting in
intracellular lipid accumulation; however, the levels of the LKB1,
an upstream molecule, were not affected by the inhibitor. These
findings revealed that Salusin-α regulated lipid metabolism through
the LKB1/AMPK/SREBP-1c signaling pathway. Salusin-α-mediated
alleviation of lipid metabolism disorders is a complex process, and
whether Salusin-α acts directly or indirectly on key molecules in
the pathway through other molecules is unclear. These questions
remain to be answered in future studies. Therefore, the next key
step is to conduct in vivo studies of the role of Salusin-α
to further validate the experimental conclusions after excluding
other disease factors that interfere with the lipid metabolism
disorder model.
In conclusion, the results of the present study
highlighted the potential of Salusin-α in reducing lipid
accumulation and alleviating NAFLD via regulation of LKB1/AMPK
phosphorylation (Fig. 9).
Administration of FFA following Salusin-α overexpression
accelerated lipolysis as well as fatty acid oxidation, and the
extent of lipid accumulation was reduced, indicating that Salusin-α
may play a role in the early prevention of NAFLD, also suggesting
the importance of lipid metabolism in vivo. These results
provide further insights into the role of Salusin-α in lipid
metabolism and other cardiovascular aspects and provide potential
targets for the prevention and treatment of NAFLD (41).
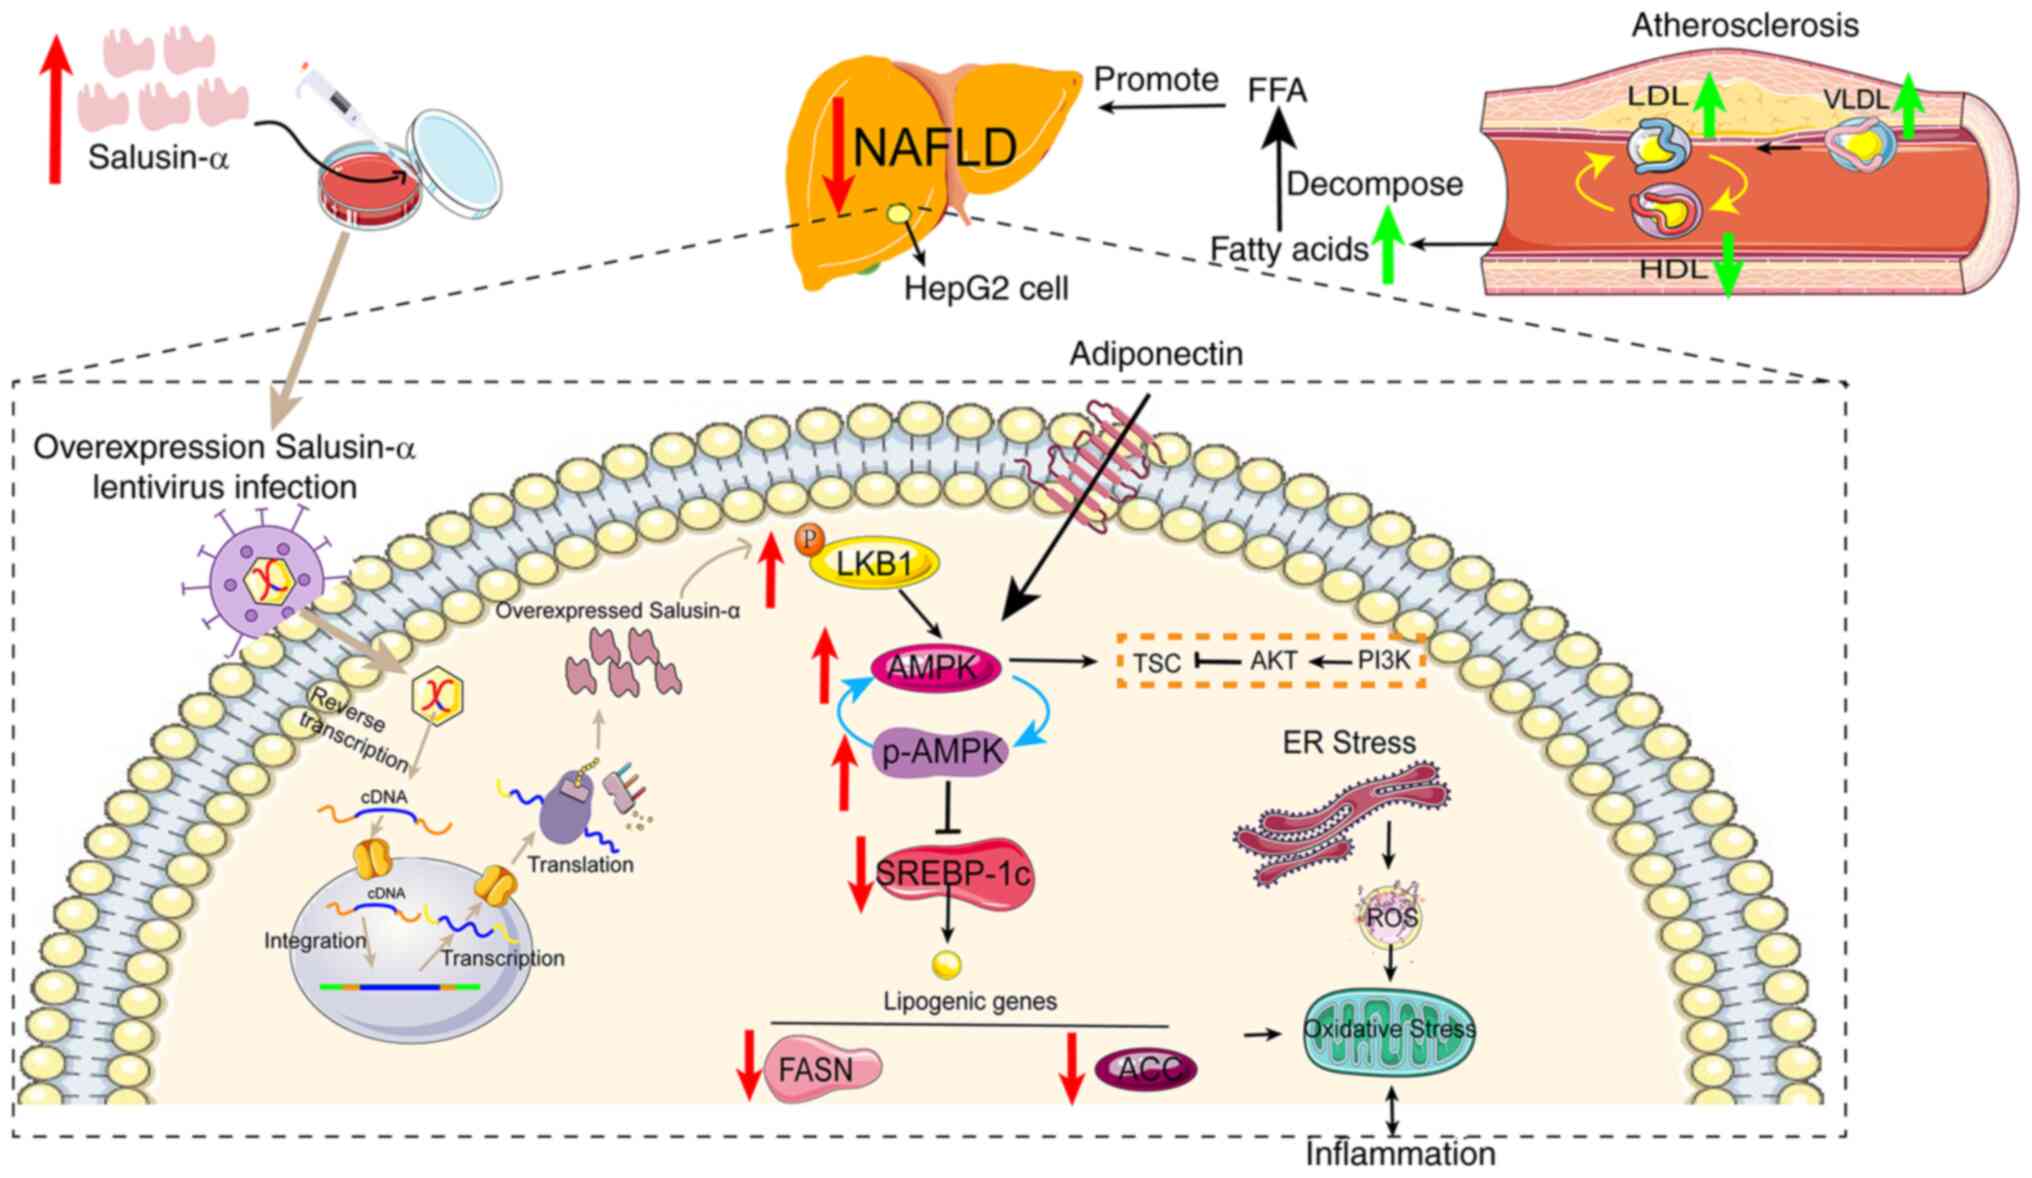 | Figure 9Hypothesized molecular mechanism
depicting how Salusin-α ameliorates lipid metabolism disorders via
regulation of the LKB1/AMPK signaling pathway. Salusinα was
overexpresses or knocked down using lentiviruses. Salusin-α
upregulated LKB1 expression and thus activated AMPK, which resulted
in a decrease in the downstream SREBP-1c/FASN/ACC levels, thus
reducing the severity of NAFLD. AS and NAFLD are causative factors
in the deterioration of the other respective disease, and the
elevated levels of LDLs in blood vessels leads to an increase in
fatty acid content and worsens the degree of NAFLD. Gray arrows
indicate the mechanistic process by which lentiviral vectors
transport and regulate Salusin-α expression. Red arrows indicate
changes in the expression of signaling pathway molecules following
overexpression of Salusin-α in HepG2 cells, and green arrows
indicate the changes in intravascular lipoprotein during the
development of AS. LKB1, liver kinase B1; AMPK, adenosine
5′-monophosphate (AMP)-activated protein kinase; NAFLD,
non-alcoholic fatty liver disease; FASN, fatty acid synthase; ACC,
acetyl-CoA carboxylase; AS, atherosclerosis; LDL, low density
lipoprotein; VLDL, very low-density lipoprotein; HDL, high-density
lipoprotein; ROS, reactive oxygen species; SREBP-1c, sterol
regulatory element binding protein-1c; ER, endoplasmic reticulum;
p-, phosphorylated. |
Supplementary Data
Availability of data and materials
The data generated in the present study may be
requested from the corresponding author.
Authors' contributions
JP and CY planned and performed experiments. JP
wrote the main manuscript text. CY prepared figures. AX and HZ
proposed the concept and design part of the experiment, and
provided important suggestions during the writing of the
manuscript. JP, YF, RZ and LC collected and analyzed the data. XL
and YW analyzed and interpreted the data, contributed reagents or
other essential material and reviewed and revised the content of
the article. All authors read and approved the final manuscript. JP
and CY confirm the authenticity of all the raw data.
Ethics approval and consent to
participate
Not applicable.
Patient consent for publication
Not applicable.
Competing interests
The authors declare that they have no competing
interests.
Abbreviations:
|
FFA
|
free fatty acid
|
|
LKB1
|
liver kinase B1
|
|
AMPK
|
adenosine 5′-monophosphate
(AMP)-activated protein kinase
|
|
SREBP-1c
|
sterol regulatory element binding
protein-1c
|
|
FASN
|
fatty acid synthase
|
|
ACC
|
acetyl-CoA carboxylase
|
|
NAFLD
|
non-alcoholic fatty liver disease
|
|
TG
|
triglycerides
|
|
ALT
|
alanine aminotransferase
|
|
AST
|
aspartate aminotransferase
|
|
MDA
|
malondialdehyde
|
|
SOD
|
superoxide dismutase
|
Acknowledgements
Not applicable.
Funding
The present study was supported by the Department of Higher
Education, Ministry of Education, industry-university cooperative
education project (grant no. 202002323015).
References
|
1
|
Chen M, Zhu J, Luo H, Mu W and Guo L: The
journey towards physiology and pathology: Tracing the path of
neuregulin 4. Genes Dis. 11:687–700. 2023. View Article : Google Scholar : PubMed/NCBI
|
|
2
|
Guo YY, Li BY, Xiao G, Liu Y, Guo L and
Tang QQ: Cdo1 promotes PPARγ-mediated adipose tissue lipolysis in
male mice. Nat Metab. 4:1352–1368. 2022. View Article : Google Scholar : PubMed/NCBI
|
|
3
|
Huang DQ, El-serag HB and Loomba R: Global
epidemiology of NAFLD-related HCC: Trends, predictions, risk
factors and prevention. J Nat Rev Gastroenterol Hepatol.
18:223–238. 2021. View Article : Google Scholar
|
|
4
|
Zhou F, Zhou J, Wang W, Zhang XJ, Ji YX,
Zhang P, She ZG, Zhu L, Cai J and Li H: Unexpected rapid increase
in the burden of NAFLD in China from 2008 to 2018: A systematic
review and meta analysis. Hepatology. 70:1119–1133. 2019.
View Article : Google Scholar : PubMed/NCBI
|
|
5
|
Powell EE, Wong VW and Rinella M:
Non-alcoholic fatty liver disease. J Lancet. 397:2212–2224. 2021.
View Article : Google Scholar
|
|
6
|
Wong VW, Adams LA, de Lédinghen V, Wong GL
and Sookoian S: Noninvasive biomarkers in NAFLD and NASH-current
progress and future promise. Nat Rev Gastroenterol Hepatol.
15:461–478. 2018. View Article : Google Scholar : PubMed/NCBI
|
|
7
|
Jin C, Zhou T, Duan Z, Deng Y, Zhang X,
Xiao C, He J, He G, Zhou Y and Li S: Effect of chin brick tea
[Camellia sinensis (L.) Kuntze] on lipid metabolism and
inflammation by modulating intestinal flora and bile acids in mice
with non-alcoholic fatty liver disease. J Ethnopharmacol.
318:1169502024. View Article : Google Scholar
|
|
8
|
Stefan N, Häring HU and Cusi K:
Non-alcoholic fatty liver disease: Causes, diagnosis,
cardiometabolic consequences, and treatment strategies. Lancet
Diabetes Endocrinol. 7:313–324. 2019. View Article : Google Scholar
|
|
9
|
Shichiri M, Ishimaru S, Ota T, Nishikawa
T, Isogai T and Hirata Y: Salusins: Newly identified bioactive
peptides with hemodynamic and mitogenic activities. Nat Med.
9:1166–1172. 2003. View
Article : Google Scholar : PubMed/NCBI
|
|
10
|
Nakayama C, Shichiri M, Sato K and Hirata
Y: Expression of proSalusin in human neuroblastoma cells. Peptide.
30:1362–1367. 2009. View Article : Google Scholar
|
|
11
|
Nagashima M, Watanabe T, Shiraishi Y,
Morita R, Terasaki M, Arita S, Hongo S, Sato K, Shichiri M,
Miyazaki A and Hirano T: Chronic infusion of Salusin-alpha and
-beta exerts opposite effects on atherosclerotic lesion development
in apolipoprotein E-deficient mice. Atherosclerosis. 212:70–77.
2010. View Article : Google Scholar : PubMed/NCBI
|
|
12
|
Murphy SK, Yang H, Moylan CA, Pang H,
Dellinger A, Abdelmalek MF, Garrett ME, Ashley-Koch A, Suzuki A,
Tillmann HL, et al: Relationship between methylome and
transcriptome in patients with nonalcoholic fatty liver disease.
Gastroenterology. 145:1076–1087. 2013. View Article : Google Scholar : PubMed/NCBI
|
|
13
|
Chen M, Wang Z and Wang S: Research
progress of Salusin-α in atherosclerotic cardiovascular disease.
Chem Life. 42:326–331. 2022.In Chinese.
|
|
14
|
Yang C and Yang J: Research progress on
the role of salusins in the development of atherosclerosis. J Pract
Med. 30:1663–1665. 2014.In Chinese.
|
|
15
|
Niepolski L and Grzegorzewska AE: Salusins
and adropin: New peptides potentially involved in lipid metabolism
and atherosclerosis. Adv Med Sci. 61:282–287. 2016. View Article : Google Scholar : PubMed/NCBI
|
|
16
|
Tang K, Wang F, Zeng Y, Chen X and Xu X:
Salusin-α attenuates hepatic steatosis and atherosclerosis in high
fat diet-fed low density lipoprotein receptor deficient mice. Eur J
Pharmacol. 830:76–86. 2018. View Article : Google Scholar : PubMed/NCBI
|
|
17
|
Wang Y, Luo M, Mao X, Shi X and Liu X:
Targeted delivery of salusin-α into rabbit carotid arterial
endothelium using SonoVue. J Ultrasound Med. 41:365–376. 2022.
View Article : Google Scholar
|
|
18
|
Zhang H, Yan C, Wang S, Xu A, Zhang Q,
Duan X, Gong G and Wang Y: Overexpression of Salusin-α upregulates
AdipoR2 and activates the PPARα/ApoA5/SREBP-1c pathway to inhibit
lipid synthesis in HepG2 cells. Int J Mol Med. 51:412023.
View Article : Google Scholar
|
|
19
|
Xu A, Wang L, Luo M, Zhang H, Ning M, Pan
J, Duan X, Wang Y and Liu X: Overexpression of salusin-β
downregulates adipoR1 expression to prevent fatty acid oxidation in
HepG2 cells. Mol Med Rep. 29:182024. View Article : Google Scholar
|
|
20
|
Kuang X, Lu F and Yi P: Effect of
berberine on LKB1-AMPK-TORC2 signaling network in HepG2 insulin
resistance cell model. Chin J Integr Chin West Med Dig. 23:467–471.
2015.In Chinese.
|
|
21
|
Watanabe T, Nishio K, Kanome T, Matsuyama
TA, Koba S, Sakai T, Sato K, Hongo S, Nose K, Ota H, et al: Impact
of salusin-alpha and -beta on human macrophage foam cell formation
and coronary atherosclerosis. Circulation. 117:638–648. 2008.
View Article : Google Scholar : PubMed/NCBI
|
|
22
|
Zhang Y, Guo Z, Wang J, Yue Y, Yang Y, Wen
Y, Luo Y and Zhang X: Qinlian hongqu decoction ameliorates
hyperlipidemia via the IRE1-α/IKKB-β/NF-κb signaling pathway:
Network pharmacology and experimental validation. J Ethnopharmacol.
318:1168562024. View Article : Google Scholar
|
|
23
|
Poznyak A, Grechko AV, Poggio P,
Myasoedova VA, Alfieri V and Orekhov AN: The diabetes
mellitus-atherosclerosis connection: The role of lipid and glucose
metabolism and chronic inflammation. Int J Mol Sci. 21:18352020.
View Article : Google Scholar : PubMed/NCBI
|
|
24
|
Sweeney NP and Vink CA: The impact of
lentiviral vector genome size and producer cell genomic to gag-pol
mRNA ratios on packaging efficiency and titre. Mol Ther Methods
Clin Dev. 21:574–584. 2021. View Article : Google Scholar : PubMed/NCBI
|
|
25
|
Yi J, Zhou Q, Huang J, Niu S, Ji G and
Zheng T: Lipid metabolism disorder promotes the development of
intervertebral disc degenerate. Biomed Pharmacother.
166:1154012023. View Article : Google Scholar
|
|
26
|
Zechner R, Zimmermann R, Eichmann TO,
Kohlwein SD, Haemmerle G, Lass A and Madeo F: FAT SIGNALS-lipases
and lipolysis in lipid metabolism and signaling. Cell Metab.
15:279–291. 2012. View Article : Google Scholar : PubMed/NCBI
|
|
27
|
Koh IU, Lim JH, Joe MK, Kim WH, Jung MH,
Yoon JB and Song J: AdipoR2 is transcriptionally regulated by ER
stress inducible ATF3 in HepG2 human hepatocyte cells. FEBS J.
277:2304–2317. 2010. View Article : Google Scholar : PubMed/NCBI
|
|
28
|
Li J, Wang S, Yao L, Ma P, Chen Z, Han TL,
Yuan C, Zhang J, Jiang L, Liu L, et al: 6-gingerol ameliorates
age-related hepatic steatosis: Association with regulating
lipogenesis, fatty acid oxidation, oxidative stress and
mitochondrial dysfunction. Toxicol Appl Pharmacol. 362:125–135.
2019. View Article : Google Scholar
|
|
29
|
Xu N, Luo H, Li M, Wu J, Wu X, Chen L, Gan
Y, Guan F, Li M, Su Z, et al: β-patchoulene improves lipid
metabolism to alleviate non-alcoholic fatty liver disease via
activating AMPK signaling pathway. Biomed Pharmacother.
134:1111042021. View Article : Google Scholar
|
|
30
|
Gong P, Long H, Guo Y, Wang Z, Yao W, Wang
J, Yang W, Li N, Xie J and Chen F: Chinese herbal medicines: The
modulator of nonalcoholic fatty liver disease targeting oxidative
stress. J Ethnopharmacol. 318:1169272024. View Article : Google Scholar
|
|
31
|
Zhang J, Ma X and Fan D: Ginsenoside CK
ameliorates hepatic lipid accumulation via activating the LKB1/AMPK
pathway in vitro and in vivo. Food Funct. 13:1153–1167. 2022.
View Article : Google Scholar : PubMed/NCBI
|
|
32
|
Li BY, Guo YY, Xiao G, Guo and Tang QQ:
SERPINA3C ameliorates adipose tissue inflammation through the
cathepsin G/Integrin/AKT pathway. Mol Metabol. 61:1015002022.
View Article : Google Scholar
|
|
33
|
Saravia J, Raynor JL, Chapman NM, Lim SA
and Chi H: Signaling networks in immunometabolism. Cell Res.
30:328–334. 2020. View Article : Google Scholar : PubMed/NCBI
|
|
34
|
Li Q, Tan JX, He Y, Bai F, Li SW, Hou YW,
Ji LS, Gao YT, Zhang X, Zhou ZH, et al: Atractylenolide III
ameliorates non-alcoholic fatty liver disease by activating hepatic
adiponectin receptor 1-mediated AMPK pathway. Int J Biol Sci.
18:1594–1611. 2022. View Article : Google Scholar : PubMed/NCBI
|
|
35
|
Qiu B, Lawan A, Xirouchaki CE, Yi JS,
Robert M, Zhang L, Brown W, Fernández-Hernando C, Yang X, Tiganis T
and Bennett AM: MKP1 promotes nonalcoholic steatohepatitis by
suppressing AMPK activity through LKB1 nuclear retention. Nat
Commun. 14:54052023. View Article : Google Scholar : PubMed/NCBI
|
|
36
|
Jang HJ, Lee YH, Dao T, Jo Y, Khim KW, Eom
HJ, Lee JE, Song YJ, Choi SS, Park K, et al: Thrap3 promotes
nonalcoholic fatty liver disease by suppressing AMPK-mediated
autophagy. Exp Mol Med. 55:1720–1733. 2023. View Article : Google Scholar : PubMed/NCBI
|
|
37
|
Yin X, Liu Z and Wang J:
Tetrahydropalmatine ameliorates hepatic steatosis in nonalcoholic
fatty liver disease by switching lipid metabolism via
AMPK-SREBP-1c-Sirt1 signaling axis. Phytomedicine. 119:1550052023.
View Article : Google Scholar : PubMed/NCBI
|
|
38
|
Ruolan Z and Bo N: The pathogenesis and
treatment progress of NAFLD targeted by SREBP-1 related path-way. J
Progr Clin Med. 12:4210–4220. 2022.
|
|
39
|
Li C, Zhang L, Qiu Z, Deng W and Wang W:
Key molecules of fatty acid metabolism in gastric cancer.
Biomolecules. 12:7062022. View Article : Google Scholar : PubMed/NCBI
|
|
40
|
Zhang Z, Ye Z and Chen Y: Research
progress on the role of AMPK signaling pathway in the development
of nonalcoholic fatty liver disease. J Nanjing Med Univ (Nat Sci).
39:1252–1256. 2019.In Chinese.
|
|
41
|
Zhou CH, Pan J, Huang H, Zhu Y, Zhang M,
Liu L and Wu Y: Salusin-β, but not salusin-α, promotes human
umbilical vein endothelial cell inflammation via the p38
MAPK/JNK-NF-κB pathway. PLoS One. 9:e1075552014. View Article : Google Scholar
|