Introduction
Glioblastoma multiforme (GBM) is the most
aggressive, highly heterogeneous and therapeutically challenging
tumor of the brain (1,2). Although the possibility of distant
metastasis is extremely rare, GBM is known to cause ventricular
metastasis and cerebrospinal fluid dissemination forming aggressive
secondary lesions resulting in a poor prognosis (3). Verhaak et al (4) proposed four molecular subtypes of GBM
based on the different gene expressions: Proneural (PN), neural,
classical and mesenchymal (MES) subtypes. Recent studies have
suggested that MES is the most aggressive and the worst prognostic
subtype in GBM (5,6). Additionally, the PN subtype of GBM is
often accompanied by the MES subtype during radiation therapy and
chemotherapy, enhancing the invasive capacity of the tumor
(7).
At present, epithelial-to-MES transition (EMT) is
usually described as a key mechanism, which can enable cancer cells
to acquire MES properties and a more motile phenotype by losing
cell polarity and intercellular adhesion, thus promoting the
invasive and metastatic ability of cancer cells (8). As a key regulator of multiple
signaling pathways leading to EMT, Snail is closely associated with
GBM metastasis (9,10). Zhong et al (11) reported that LIM and SH3 protein 1
(LASP1) facilitates the invasion of glioma cells by activating the
PI3K/AKT/Snail signaling pathway. A previous study also confirmed
that microRNA-451 could reduce the EMT process and metastasis of
glioma through inhibition of the PI3K/Akt/Snail signaling pathway
(12). Therefore, it was
hypothesized that blocking the PI3K/Akt/Snail pathway may
significantly inhibit the EMT and metastasis of cancer cells in the
treatment of the MES subtype of GBM.
NAD(P)H: quinone oxidoreductase 1 (NQO1) is located
on chromosome 16q22 and is a widely distributed FAD-dependent
flavoprotein, which was first discovered by Professor Ernster in
1958 (13). A previous study
reported that C609T polymorphism of the NQO1 gene is related to
tumor susceptibility, inhibition of NQO1 detoxification and
cytoprotection (14). Our previous
studies showed that NQO1 is significantly upregulated in various
types of solid cancer compared with in adjacent normal tissues,
such as breast cancer, pancreatic cancer, lung cancer and
hepatocellular carcinoma, and its high expression is closely
related to the poor prognosis of patients with cancer (15-17).
Furthermore, a previous study demonstrated that depleting NQO1
expression can suppress cell proliferation and decrease lung tumor
xenograft growth (18). Yang et
al (19) reported that NQO1
significantly affected the growth and aggressiveness of breast
cancer by modulating pyruvate kinase L/R. Moreover, Thapa et
al (20) showed that NQO1 can
regulate the transforming growth factor-β (TGF-β) signaling pathway
to curb EMT and migration, which are necessary for prostate cancer
progression. Shimokawa et al (21) suggested that modulation of NQO1
activity intercepts anoikis resistance and reduces the metastatic
potential of hepatocellular carcinoma. All of these reports
indicated that NQO1 may serve vital roles in the metastasis of
multiple types of cancer; however, its specific mechanism in the
MES subtype of GBM remains unclear. The present study aimed to
investigate the function of NQO1 in the MES subtype of GBM
progression, to uncover its underlying mechanism, and to provide
insights into the development of more efficient regimens for the
MES subtype of GBM treatment.
Materials and methods
Clinical samples
A glioma tissue microarray was purchased from
Shanghai Outdo Biotech Co., Ltd., including 195 cases of glioma
tissue and 17 cases of normal cancer-adjacent tissue. The use of
the glioma tissue microarray was approved by the Ethics Committee
of Yanbian University Medical College (Yanji, China) (approval no.
YD20230406015). The histological grade of GBM tumors was evaluated,
according to the World Health Organization (WHO) criteria (22).
Cell culture
The U87 human GBM of unknown origin cell line
(HTB-14™) is a cell line with epithelial morphology that was
isolated from the malignant glioma of a male patient who likely had
GBM. U87 cells, the GBM cell lines T98G (CRL-1690) and SHG44, and
the 293T cell line were all purchased from American Type Culture
Collection in 2020. The U251 GBM cell line was purchased from The
National Collection of Authenticated Cell Cultures in 2020. The
normal human astrocytes (NHAs; primary cells; cat. no. CC-2565;
Lonza Group, Ltd.) were purchased in 2020. The SHG66 primary human
malignant glioma cell line (isolated from the brain tissue of a
47-year-old male patient with grade IV glioma from China) was
obtained from the Department of Neurosurgery, Huashan Hospital,
Fudan University (Shanghai, China). All cell lines were
authenticated and characterized by the supplier. The need for
ethics approval for the use of commercial primary cell lines was
waived by the Medical Ethics Committee of Yanbian University
Medical College. Cells were used within 6 months of resuscitation,
were confirmed to be mycoplasma-free and were routinely
authenticated by quality examinations of morphology and growth
profile. All cell lines were cultured in Dulbecco's modified
Eagle's medium containing 10% fetal bovine serum (both from Gibco;
Thermo Fisher Scientific, Inc.) and penicillin-streptomycin (100
U/ml) at 37 °C and 5% CO2.
Antibodies
Antibodies against E-cadherin (cat. no. ab40772) and
Vimentin (cat. no. ab92547) were purchased from Abcam. Antibodies
against Slug (cat. no. #9585), twist-related protein (Twist; cat.
no. #90445), p27 (cat. no. #3686), Cyclin B (cat. no. #4138),
Cyclin D (cat. no. #55506), cyclin-dependent kinase 1 (CDK1; cat.
no. #77055), eIF4E-binding protein (4EBP1; cat. no. #9644),
phosphorylated (p)-4EBP1 (cat. no. #2855), p-ribosomal protein S6
(S6; cat. no. #4858), S6 (cat. no. #2317), p-Akt (cat. no. #4060),
Akt (cat. no. #9272), p-PI3K (cat. no. #17366), PI3K (cat. no.
#4255), p-mammalian target of rapamycin (mTOR; cat. no. #2971),
mTOR (cat. no. #2972) and β-actin (cat. no. #93473) were purchased
from Cell Signaling Technology, Inc. Antibodies against Ki67 (cat.
no. 27309) and Snail (cat. no. 13099) were purchased from
Proteintech Group, Inc. The antibody against NQO1 (cat. no.
sc-32793) was purchased from Santa Cruz Biotechnology, Inc.
Small interfering RNA (siRNA)
transfection
Snail siRNAs [si-control (non-targeting sequence),
siRNA1, siRNA2 and siRNA3] were purchased from Guangzhou RiboBio
Co., Ltd. The siRNA sequences are presented in Table SI. T98G, SHG44, and
NQO1-overexpressing T98G and SHG44 cells (5×10⁵
cells/well) were transfected with si-control (5 nmol; cat. no.
siN0000001-1-5), siRNA1 (5 nmol; cat. no. stB0002558A-1-5), siRNA2
(5 nmol; cat. no. stB0002558B-1-5) and siRNA3 (5 nmol; cat. no.
stB0002558C-1-5) in 6-well plates using Lipofectamine®
3000 (Invitrogen; Thermo Fisher Scientific, Inc.) according to the
manufacturer's protocol at 37°C for 6 h. The time interval between
transfection and subsequent experimentation was 48 h.
Stable cell line generation
U87, SHG66, T98G and SHGs44 cells were counted and
inoculated in 6-well plates (~1×10⁵ cells/well).
Transfection was performed when the cells were in a suitable
condition (the cells were complete, homogeneous, transparent and
with few particles; the culture medium was clear and transparent,
without suspended cells and fragments) and without antibiotics. The
pLV[shRNA]-EGFP/Puro-U6-Scramble-shRNA (sh-Con), pLV[shRNA]-EGFP:
T2A: Puro-U6-{hNQO1[shRNA#1]} (sh-NQO1), empty vector
pLV[Exp]-EGFP: T2A: Puro-Null (vector) and pLV[Exp]-EGFP: T2A:
Puro-hNQO1[NM-000903.2] (NQO1) lentiviral plasmids were purchased
from Cyagen Biosciences, Inc. Briefly, 4 μg Human
Lenti-shNQO1-green fluorescent protein (GFP; sh-NQO1),
Lenti-NQO1-GFP (NQO1) and their controls (empty vector and sh-Con)
were packaged (10 μg overexpression plasmid or 0.1-0.2
μg shRNA plasmid, 6.5 μg packaging plasmids and 3.5
μg envelope plasmids) in 293T cells for 48 h in a 37°C
incubator. The U87, SHG66, T98G and SHG44 cells were cultured at
1×10⁵ cells/well into 6-well tissue culture plates at
37°C overnight. The lentiviral supernatant was added into cells and
the multiplicity of infection was 10 at 37°C for 48 h. After
transduction, cells were selected with 2 μg/ml puromycin
(MilliporeSigma) to generate stable cell lines at 37°C for 2 weeks.
Subsequently, the cells were maintained in complete medium with
puromycin at a concentration of 0.5 μg/ml and collected for
western blotting, MTT assays, EdU assays and colony formation
assays 48 h post-transduction.
Wound healing assay
The U87, SHG66, T98G and SHG44 cells were routinely
digested and placed in a 6-well plate, and cell wounds were created
by scratching cells using a micropipette tip when cell confluence
reached 90-100% after cell adhesion. The medium was discarded and
the cells were washed with 1X PBS three times to remove floating
cells, followed by the addition of serum-free medium. Spontaneous
cell migration was monitored using a Nikon inverted light
microscope (Nikon Corporation) at 0, 24 and 48 h. The occupancy of
wound area (%) was calculated by measuring the width of the wound
as follows: Occupancy of wound area (%)=(24/48 h occupancy of wound
area)/0 h occupancy of wound area ×100. Wound closure distance was
measured for three independent wounds in each group using ImageJ
(v1.53e) software (National Institutes of Health).
Immunofluorescence (IF)
The U87, SHG66, T98G and SHG44 cells were grown in
glass-covered six-well plates until they reached 90% confluence.
The cells were washed with PBS at room temperature for 15 min, and
fixed with 4% paraformaldehyde at room temperature for 15 min,
permeabilized with 0.5% Triton X-100 (CWBio) and blocked with 3%
BSA (CAS:9048-46-8; Beijing Solarbio Science & Technology Co.,
Ltd.) at room temperature for 2 h. The cells were incubated with
primary antibodies against E-cadherin (1:400), Vimentin (1:400),
Snail (1:200) and NQO1 (1:400) at 4°C overnight, washed with PBS
three times, and then incubated for 2 h with Alexa
Fluor® 488-conjugated secondary antibody (cat. no.
A31627; 1:400; Invitrogen; Thermo Fisher Scientific, Inc.).
Finally, the cells were analyzed under a Leica SP5II confocal
microscope (Leica Microsystems, Inc.).
Cell invasion and migration assays
Cell invasion and migration assays were performed in
24-well, two-chamber plates with high-throughput screening
multiwell inserts (Becton, Dickinson and Company), which contain
polycarbonate filters (pore size, 8 μm). For cell invasion,
5×10⁴ cells were added to the upper chamber, which was
coated in Matrigel at room temperature for 12 h, medium with
fibronectin (20 μg/ml; MFCD00131062; Sigma-Aldrich; Merck
KgaA) was added to the lower chamber, and the cells were incubated
at 37°C for 30 h. For cell migration, 3×10⁴ cells were
added to the upper chamber, medium without fibronectin was added to
the lower chamber, and the cells were incubated at 37°C for 24 h.
Invaded or migrated cells (on the lower side of the membranes or in
the lower well) were then fixed in 100% methanol for 30 min and
stained with gentian violet solution at room temperature for 10
min. Cells were counted under a light microscope (BX53; Olympus
Corporation) at ×200 magnification. Each assay was performed in
duplicate and repeated three times.
MTT
The U87, SHG66, T98G and SHG44 cellswere seeded at a
concentration of 1×10⁴ cells/well in 96-well plates.
After cell adherence, MTT solution (1 mg/ml; 100 μl/well)
was added and the cells were cultured for 4 h. MTT solution was
removed and 100 μl dimethyl sulfoxide was then added to each
well and agitated for 10 min at room temperature, away from the
light. Subsequently, the optical density was measured at 550 nm
using an ELISA plate reader.
Colony formation assay
The U87, SHG66, T98G and SHG44 cells were seeded in
12-well plates at a density of 1×10³ cells/well in human
methylcellulose complete medium (R&D Systems Europe, Ltd.)
according to the manufacturer's instructions. Culture medium was
replaced every 3 days. After 14 days of incubation at 37°C and 5%
CO2, PBS was used to wash the cells before fixing them
with pre-cooled (1:1) methanol/acetone at −20°C for 15 min. After
staining with 1% crystal violet for 15 min at room temperature,
colonies containing ≥50 cells were counted using an inverted light
microscope (magnification, ×200; CKX41; Olympus Corporation).
EdU assay
EdU is a thymine nucleoside analogue. EdU, instead
of thymidine, can be inserted into the replicating DNA molecules
during cell proliferation, marking the newly synthesized DNA with
Apollo fluorescent dye-containing EdU. The Cell-Light™ EdU
Apollo®488 In Vitro Imaging Kit (Guangzhou
RiboBio Co., Ltd.) was performed according to the manufacturer's
instructions. Cells (5×10³/well) were seeded and grown
in 96-well plates overnight, 50 μM EdU medium (1:1,000) was
added to each well and cells were cultured at 37°C for 2 h.
Subsequently, the cells were fixed with methanol for 30 min and
washed twice with PBS for 5 min at room temperature. After
permeabilizing with 0.5% Triton X-100 for 10 min twice and washing
with PBS at room temperature for 5 min, 1X Apollo dye was used to
stain the cells at room temperature for 30 min, and the cells were
washed again. Finally, the signal was visualized and recorded using
a Leica SP5II confocal microscope after Hoechst 33342
counterstaining for 10 min in the dark.
Western blotting
Western blot analysis was performed according to
standard methods. Briefly, cell lysis and protein extraction were
performed using RIPA buffer (cat. no. CW2333S; CWBIO). The protein
concentration was measured using a BCA Protein Assay Kit (Beijing
Solarbio Science & Technology Co., Ltd.). Subsequently, the
proteins (30 μg/lane) were separated by SDS-PAGE
electrophoresis on 8-12% polyacrylamide gels and were transferred
to PVDF membranes (MilliporeSigma). After blocking with 5% non-fat
milk at room temperature for 2 h, the membrane was incubated
overnight at 4°C with primary antibodies against E-cadherin
(1:1,000), Vimentin (1:1,000), Slug (1:1,000), Twist (1:1,000), p27
(1:1,000), CDK1 (1:1,000), Cyclin B (1:1,000), Cyclin D (1:1,000),
CDK1 (1:1,000), 4EBP1 (1:1,000), p-4EBP1 (1:1,000), p-S6 (1:1,000),
S6 (1:1,000), p-Akt (1:1,000), Akt (1:1,000), p-PI3K (1:1,000),
PI3K (1:1,000), p-mTOR (1:1,000), mTOR (1:1,000), β-actin
(1:3,000), Snail (1:1,000) and NQO1 (1:1,000). Membranes were then
washed with TBS-0.1% Tween, and incubated with goat anti-rabbit IgG
(H&L) secondary antibodies (1:10,000; cat. no. bs13278;
Bioworld Technology, Inc.) or goat anti-mouse IgG (H&L)
secondary antibodies (1:10,000; cat. no. bs12478; Bioworld
Technology, Inc.) at 25°C for 1 h. The protein bands were
visualized using an Amersham Imager 680 (Cytiva) with enhanced
chemiluminesence (cat. no. WBKLS0500; MilliporeSigma). The relative
expression of each protein was calculated using ImageJ (version
1.8.0.345) with β-actin as an internal reference.
In vivo tumorigenesis and metastasis
assays
A total of 32 BALB/c nude mice (male; age, 4-5
weeks; weight, 18-20 g) were purchased from the Beijing Vital River
Laboratory Animal Technology Co., Ltd. BALB/c nude mice (four per
cage) were housed under specific pathogen-free conditions
(temperature, 21±8°C; humidity, 40-60%; 12-h light/dark cycle; free
access to standard sterile food and water) and were ear-notched for
identification. To assess the effect of NQO1 on tumorigenicity
in vivo (n=16 mice), U87 cells (3×10⁶ cells
transduced with sh-Con or shNQO1) and SHG44 cells (3×10⁶
cells transduced with Vector or NQO1) were injected subcutaneously
into the left dorsal of nude mice to construct a subcutaneous
tumor-forming model of nude mice.
To establish the lung metastasis model in another 16
BALB/c nude mice (male; age, 4-5 weeks; weight, 18-20 g), U87 cells
transduced with sh-Con or shNQO1 (0.1 ml, 1×10⁶
cells/mouse; four mice/group), and SHG44 cells transduced with
Vector or NQO1 (0.1 ml, 1×10⁶ cells/mouse; four
mice/group), were intravenously injected into the tail vein of nude
mice using a 28-gauge syringe. The tumor volume (mm3) in
each mouse was measured using a Vernier caliper every 3 days and
was calculated as follows: Tumor volume=0.5 × length ×
width2. Mice were euthanized after 21 days for the
xenograft study and after 8 weeks for the lung metastasis
experiment.
To assess the effect of NQO1 on tumorigenicity in
vivo (intracranial xenograft model), U87 cells transduced with
sh-con or shNQO1 (2×10⁵ cells) were injected
stereotactically into the right hemicerebrum of 4-6-week-old female
nude mice (n=11; NOD-SCID; Cyagen Biosciences, Inc.). These mice
were housed under the same conditions as the BALB/c nude mice.
Tumor growth was monitored using an in vivo imaging system
(IVIS Lumina II; PerkinElmer, Inc.). The tumors were excised on day
15 after the injection. The following humane endpoints were
established: Tumor diameter, >2.0 cm; weight loss >20%; poor
overall condition (22). None of
the mice reached the humane endpoints in the present study. To
reduce suffering, mice were anesthetized with 2% isoflurane. All
mice were then rapidly euthanized by cervical dislocation.
Verification of death included cardiac and respiratory arrest, lack
of reflexes and changes in mucosal color. After subcutaneous tumors
were dissected, they were weighed using a digital balance (Mettler
Toledo), fixed with 4% formalin (Biosharp Life Sciences) at room
temperature for 24 h and embedded with paraffin to prepare
sections. Further immunohistochemical staining was performed to
detect the expression levels of Vimentin, E-cadherin and Ki67 in
xenograft tissue sections. No metastatic nodules were found in the
abdominal and thoracic organs of the subcutaneous xenograft mice.
After verification of death, lungs were completely dissected from
the lung metastasis model mice. The lungs were fixed with 4%
formalin at room temperature for 24 h, embedded in paraffin, cut
into sections (5 μm) and stained with hematoxylin-eosin
(H&E) for histopathological evaluation. The sections were
dewaxed in dimethylbenzene for 5 min, and dehydrated in 100, 95, 85
and 75% alcohol for 5 min, respectively. Subsequently, the sections
were stained with hematoxylin for 5 min and differentiated with 1%
hydrochloric acid alcohol for 5 sec. Sections were then stained
with eosin for 15 sec and dehydrated in 95 and 100% alcohol for 1
min each, before clearing with dimethylbenzene for 5 min.
Subsequently, the sections were fixed using neutral balsam. All
stages of H&E staining were performed at room temperature.
Metastatic lung nodules were counted using a light microscope
(IX51; Olympus Corporation). All experiments were performed in
accordance with the procedures and protocols of the Animal Ethics
Committee of Yanbian University.
Immunohistochemistry (IHC)
Tissue sections (glioma tissue microarray and
xenograft tissues collected from animal models) were washed with
normal saline and immediately fixed in 4% paraformaldehyde at room
temperature for 24 h. Paraffin-embedded tissues were then cut into
5-μm sections, were dewaxed at 58°C, then incubated in
dimethylbenzene for 10 min, 100% alcohol for 5 min, 95% alcohol for
5 min and 75% alcohol for 5 min at room temperature for
rehydration. The sections were then washed with water and antigen
retrieval was performed using boiling EDTA for 15 min. The tissue
sections were soaked in 3% H2O2 at room
temperature for 30 min. Subsequently, the sections were washed
another three times with PBS and were incubated at 37°C overnight
with the following primary antibodies: E-cadherin (1:200) and
Vimentin (1:200), Ki67 (1:200) and NQO1 (1:200). Sections were then
rinsed with PBS, rinsed three times with water, and soaked and
rinsed in PBS-10% Tween three times, before being incubated with
goat anti-rabbit IgG (H&L) secondary antibodies (1:2,000; cat.
no. ab205718; Abcam) for 45 min at 37°C. Subsequently, DAB was
added to allow the assessment of color development under a
microscope. After color development, the reaction was terminated
with water and the sections were soaked. Hematoxylin dye solution
was then added at room temperature for 2 min, the sections were
rinsed with distilled water and color separation solution (cat. no.
BSBA-4027; OriGene Technologies, Inc.) was added, after which the
sections were rinsed with water a further three times. The slides
were sequentially dehydrated in 100% absolute ethanol at 25°C for
10 sec and a charge-coupled device light microscope was used for
the assessment and imaging of sections.
All tissue specimens were examined and scored by two
pathologists using a double-blind control method.
Immunohistochemical analysis was performed using a
semi-quantitative scoring system, which combined positive area
percentage and staining intensity. NQO1-, Vimentin- and
E-cadherin-positive staining intensity scores were as follows:
negative, 0; weak, 1; medium, 2; strong, 3. The percentage of
stained cells was scored as follows: ≤25%, 1; 26-50%, 2; 51-75%, 3;
>75%, 4. The staining index was calculated by multiplying the
staining intensity score with the percentage of positive staining
score (value 0-12). NQO1, Vimentin and E-cadherin immunostaining
values 0-3 were defined as low expression, whereas ≥4 was defined
as high expression.
Bioinformatics analysis
Tumor Immune Estimation Resource (TIMER) (https://cistrome.shinyapps.io/timer/),
University of California Santa Cruz (UCSC) (https://xenabrowser.net/), University of ALabama at
Birmingham Cancer (UALCAN) (http://ualcan.path.uab.edu), Gene Set Co-Expression
Analysis (GSCA) (http://bioinfo.life.hust.edu.cn/GSCA/#/), TISIDB (an
integrated repository portal for tumor-immune system interactions)
(http://cis.hku.hk/TISIDB/), The Cancer
Genome Atlas (TCGA) (https://www.cancer.gov/ccg/research/genome-sequencing/tcga)
and Gene Expression Profiling Interactive Analysis (GEPIA)
(gepia.cancer-pku.cn) were used to explore NQO1 expression in
pan-cancer. ENCORI (http://starbase.sysu.edu.cn/index.php), Gene
Expression Omnibus (https://www.ncbi.nlm.nih.gov/geoprofiles/) and
Oncomine (https://www.oncomine.org/resource/main.html) were used
to analyze the differential expression of NQO1 in GBM tissues and
adjacent normal tissues. The relationship between NQO1 expression
and patient survival was searched in Kaplan-Meier Plotter
(http://kmplot.com/anaLysis/index.php?p=service) and
UALCAN. LinkedOmics (http://www.linkedomics.org/login.php), cBioPortal
(http://www.cbioportal.org), ChIPBase
v3.0 (https://rnasysu.com/chipbase3/index.php) and TIMER
databases were used to explore genetic Pearson correlation
analysis.
Co-immunoprecipitation (Co-IP) and
detection of ubiquitylation
Co-IP was performed with IgG (1:1,000; cat. no.
sc-2025; Santa Cruz Biotechnology, Inc.) anti-NQO1 (1:1,000; cat.
no. sc-32793; Santa Cruz Biotechnology, Inc.) and anti-Snail
(1:1,000; cat. no. 13099-1-AP; Proteintech Group, Inc.) antibodies
using the Protein A/G PLUS-Agarose (cat. no. sc-2003; Santa Cruz
Biotechnology, Inc.) and IP/Co-IP kit (cat. no. ab206996; Abcam)
according to the manufacturer's protocol. The kit contained Protein
A/G magnetic beads, lysis/wash buffer, SDS-PAGE protein loading
buffer (5X), elution buffer and neutralization buffer. Briefly,
lysis/wash buffer and PMSF (1:100, cat. no. P0100; Beijing Solarbio
Science & Technology Co., Ltd.) were added at a ratio of 30
μl per 1.0×10⁵ cells, mixed well and incubated on
ice for 30 min (mixing several times during this period).
Subsequently, this mixture underwent centrifugation (4°C; 12,000 x
g; 10 min) with the supernatant placed on ice for later use. The
prepared sample (500 μl) was added to a 1.5 ml Eppendorf
(EP) tube, followed by 4 μg antibody and incubated on a flip
mixer (4°C overnight) to form antigen-antibody complexes. The
magnetic bead suspension (25 μl) was placed into a 1.5 ml EP
tube and 500 μl lysis/wash buffer was added; the magnetic
beads were resuspended by gently pipetting and then left to stand
on a magnetic stand for 1 min. When the magnetic beads were
adsorbed to the sides of the EP tube, the supernatant was aspirated
and this step was repeated twice. The antigen-antibody complex was
added to the pretreated magnetic beads and incubated on an
inversion mixer at 4°C overnight before being left to stand on the
magnetic stand for 1 min, until the magnetic beads were adsorbed to
the sides of the EP tube. The supernatant was then aspirated and
discarded; what remained in the tube was the
antigen-antibody-magnetic bead complex. Lysis/rinse buffer (500
μl) was added to the antigen-antibody-magnetic bead complex,
the magnetic beads were resuspended by gently pipetting and
agitating, and was then allowed to stand on a magnetic stand for 1
min until the magnetic beads were adsorbed to the sides of the
tube. The supernatant was aspirated and discarded and this step was
repeated twice. An appropriate amount of 5X SDS-PAGE loading buffer
was added to the antigen-antibody-magnetic bead complex, mixed well
and heated at 100°C for 10 min. After cooling, the EP tube was
placed on a magnetic stand for 1 min. After the magnetic beads were
adsorbed to the sides of the EP tube, the supernatant was collected
and detected by western blotting as aforementioned. For
ubiquitylation, cells were treated with or without MG132 (10
μM; S2619; Selleck Chemicals) at 4°C for 6 h before being
harvested in IP lysis buffer, followed by the aforementioned co-IP
and western blotting protocols. In addition, ubiquitin (1:1,000;
cat. no. sc-8017; Santa Cruz Biotechnology, Inc.) was detected by
western blotting.
Rescue experiments
Rescue experiments were used to clarify whether NQO1
could induce the malignant evolution of GBM by activating the
PI3K/Akt/mTOR signaling pathway. For rescue experiments, the cells
were divided into the following four groups: Vector, NQO1, NQO1 +
LY294002 (50 μM; cat. no. S1105; Selleck Chemicals; treated
at 37°C for 48 h,) and NQO1 + Rapamycin (50 nM; cat. no. S1039;
Selleck Chemicals; treated at 37°C for 48 h). The NQO1 group acted
as the control. Subsequent experiments included MTT, EdU, colony
formation, wound healing and cell migration assays, IF and western
blotting.
Statistical analysis
Data were collected from three independent
experiments. Statistical analysis was performed using SPSS 20.0
software (IBM Corp.), GraphPad Prism 8.0 software (Dotmatics),
ImageJ software (v1.53e) and R software (version 3.5.2; portable
version, https://www.r-project.org/).
Statistical differences between two groups were determined using an
unpaired t-test, whereas those between multiple groups were
determined using a one-way ANOVA followed by Bonferroni test post
hoc test. Semi-quantification of the cell number, colony number,
wound gap closure and western blotting band integrated density were
performed using ImageJ software. The χ2 test was used to
determine the relationship between NQO1 protein expression and
clinicopathological parameters. Kaplan-Meier method was used to
generate survival curves and log-rank test was used to determine
P-values; the Renyi test was performed to determine the P-values
when survival curves crossed over. Cox proportional hazards models
were applied to evaluate the hazard ratios (HR) in univariate and
multivariate logistic regression analyses. Receiver operating
characteristic (ROC) curve analysis was applied to evaluate the
diagnostic value of NQO1 in GBM. P<0.05 was considered to
indicate a statistically significant difference.
Results
NQO1 is generally highly expressed in
cancer and predicts a poor prognosis
All four databases (TIMER1, UCSC, GEPIA and TCGA)
showed that NQO1 mRNA expression was significantly increased in the
tumor tissues of digestive, respiratory and female reproductive
system cancer compared with that in unpaired normal tissues
(Fig. 1A-D). Based on the UALCAN
portal, it was revealed that NQO1 protein expression was increased
in various cancer types, including colon cancer, liver
hepatocellular carcinoma (LIHC), lung adenocarcinoma, pancreatic
adenocarcinoma and uterine corpus endometrial carcinoma, but its
expression was decreased in breast cancer (BC), and head and neck
squamous cell carcinoma (HNSCC) (Fig.
1E). Subsequently, the GSCA database revealed that the
expression levels of NQO1 were significantly related with the
stages of certain cancer types, such as lung adenocarcinoma and
breast cancer (Fig. 1F). Since the
GSCA does not currently include some cancer types, the relationship
between NQO1 mRNA expression and cancer stage was analyzed in the
UCSC database instead. The results showed that the mRNA expression
of NQO1 was relevant to the stage of GBM, thymoma, and
pheochromocytoma and paraganglioma (Fig. 1G). Moreover, the overall survival
of patients with high NQO1 expression was much lower than that of
patients with low NQO1 expression in adrenocortical carcinoma
(ACC), LIHC and uveal melanoma (UVM) (Fig. 1H). Similarly, the disease-free
survival of patients with high NQO1 expression was significantly
shorter than that of patients with low NQO1 expression in ACC,
bladder urothelial carcinoma, GBM, kidney renal clear cell
carcinoma, rectum adenocarcinoma, skin cutaneous melanoma and UVM
(Fig. 1H). Conversely, the
survival of patients with prostate adenocarcinoma and high NQO1
expression was significantly longer than that of patients with low
NQO1 expression. These results indicated that the high expression
of NQO1 predicted the poor prognosis of patients with cancer and
may be used as an important biomarker of cancer.
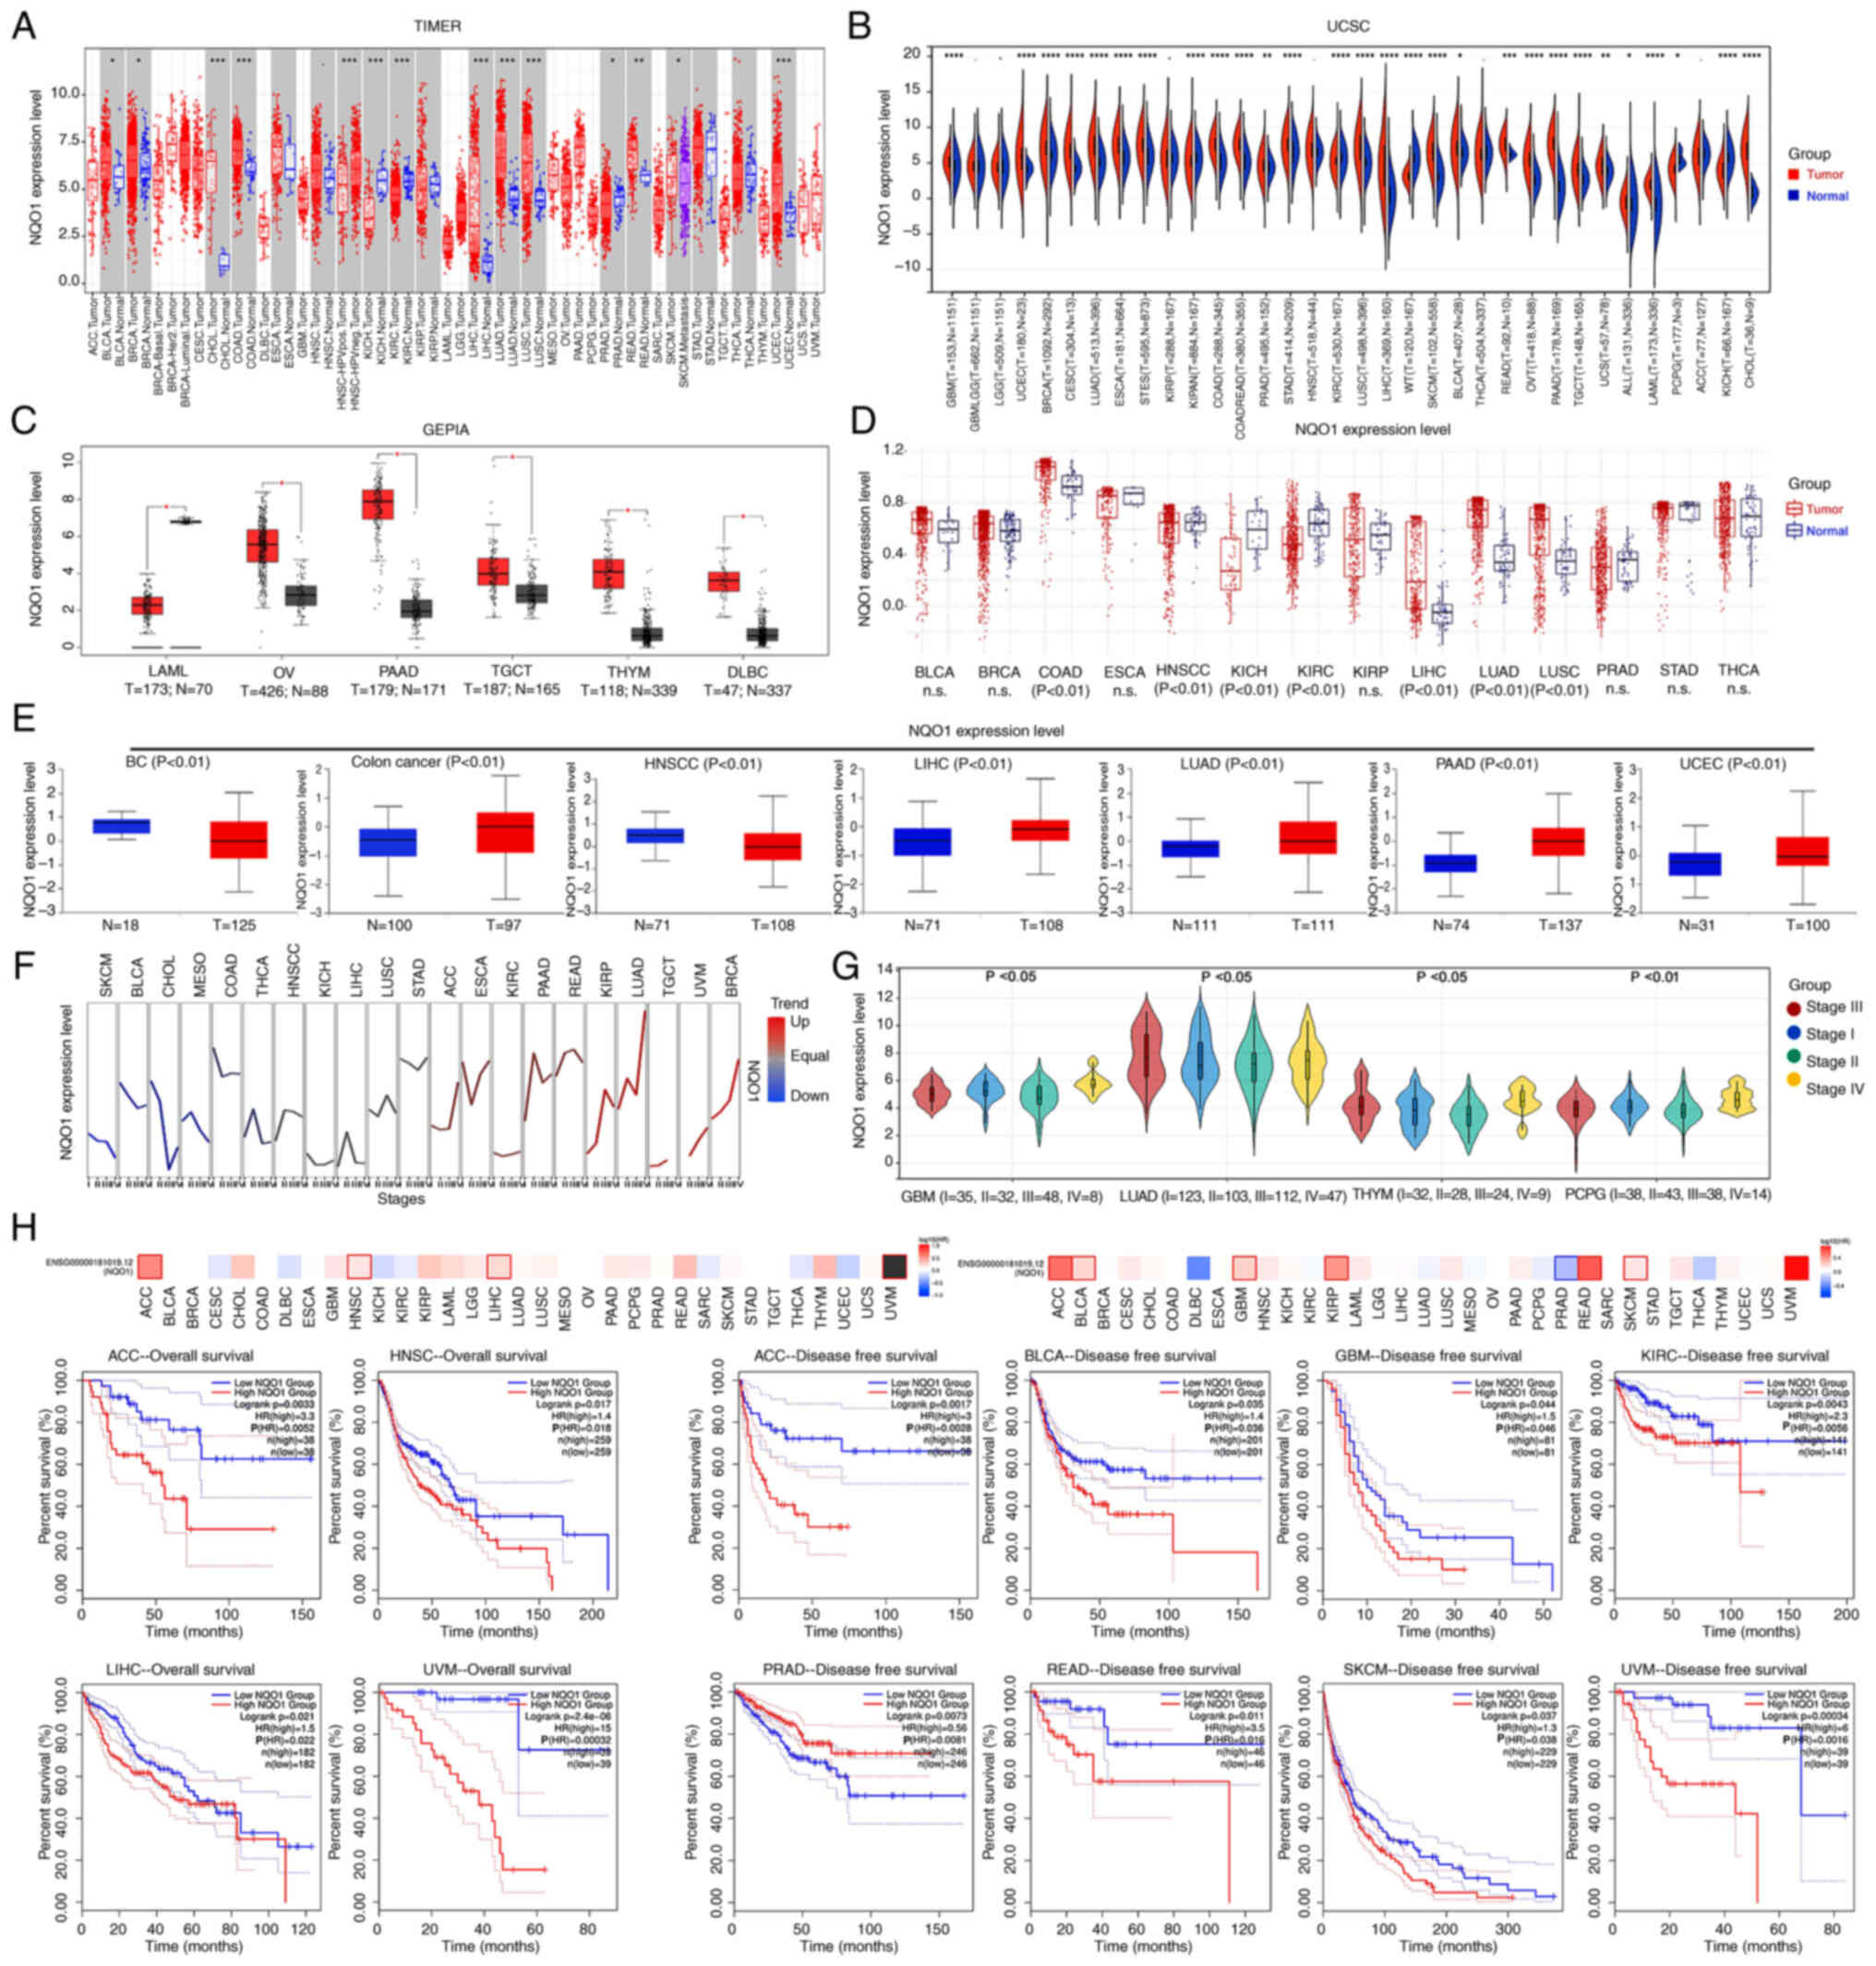 | Figure 1Expression of NQO1 in pan-cancer.
mRNA expression levels of NQO1 in normal and tumor tissues were
analyzed using (A) TIMER, (B) UCSC, (C) GEPIA and (D) TCGA
databases. (E) Protein expression levels of NQO1 in normal and
tumor tissues were analyzed using CTPAC database. The expression of
NQO1 in different cancer stages was analyzed using (F) GSCA and (G)
UCSC databases. (H) Overall survival and disease-free survival of
patients with cancer split according to NQO1 expression were
detected using the GEPIA database. n.s., P>0.05,
*P<0.05, **P<0.01,
***P<0.001, ****P<0.0001. NQO1,
NAD(P)H:quinone acceptor oxidoreductase 1; TIMER, Tumor Immune
Estimation Resource; UCSC, University of California Santa Cruz;
GSCA, Gene Set Co-Expression Analysis; UALCAN, University of
ALabama at Birmingham Cancer; TCGA, The Cancer Genome Atlas; GEPIA,
Gene Expression Profiling Interactive Analysis. |
NQO1 expression is closely associated
with MES subtype and adverse outcomes of GBM
It is well known that homologous recombination
deficiency (HRD) and tumor mutational burden (TMB) are closely
related to the choice of clinical treatment of cancer (23). Further studies showed that the
expression of NQO1 was significantly correlated with ploidy,
mutant-allele tumor heterogeneity (MATH), purity, HRD and TMB in
most tumors (Fig. 2A). Through the
intersection analysis of the aforementioned groups, the two
negatively correlated members were obtained by Venn diagram: GBM
and acute myeloid leukemia (AML) (Fig.
2B). These results indicated that NQO1 was closely related to
the choice of clinical treatment of various types of cancer, but
was not related to GBM and LAML. Subsequently, the present study
further analyzed the relationship between NQO1 and the molecular
subtype of cancer, and revealed that NQO1 mRNA expression had a
significantly positive correlation with the subtype of GBM, but was
not related to LAML (Fig. 2C).
Therefore, the present study focused on the molecular mechanism of
NQO1 in GBM. The GSCA database showed that the mRNA expression of
NQO1 was lower in the classical subtype of GBM than in the neural
subtype (P<0.001). In particular, the mRNA expression of NQO1
was higher in the MES subtype than in the classical subtype of GBM,
but no statistical significance was detected in the MES subtype
compared with the neural and PN subtypes (Fig. 2D). These results suggested that
NQO1 may be closely related to the malignant degree of GBM and
could be a new target for identifying molecular subtypes of
GBM.
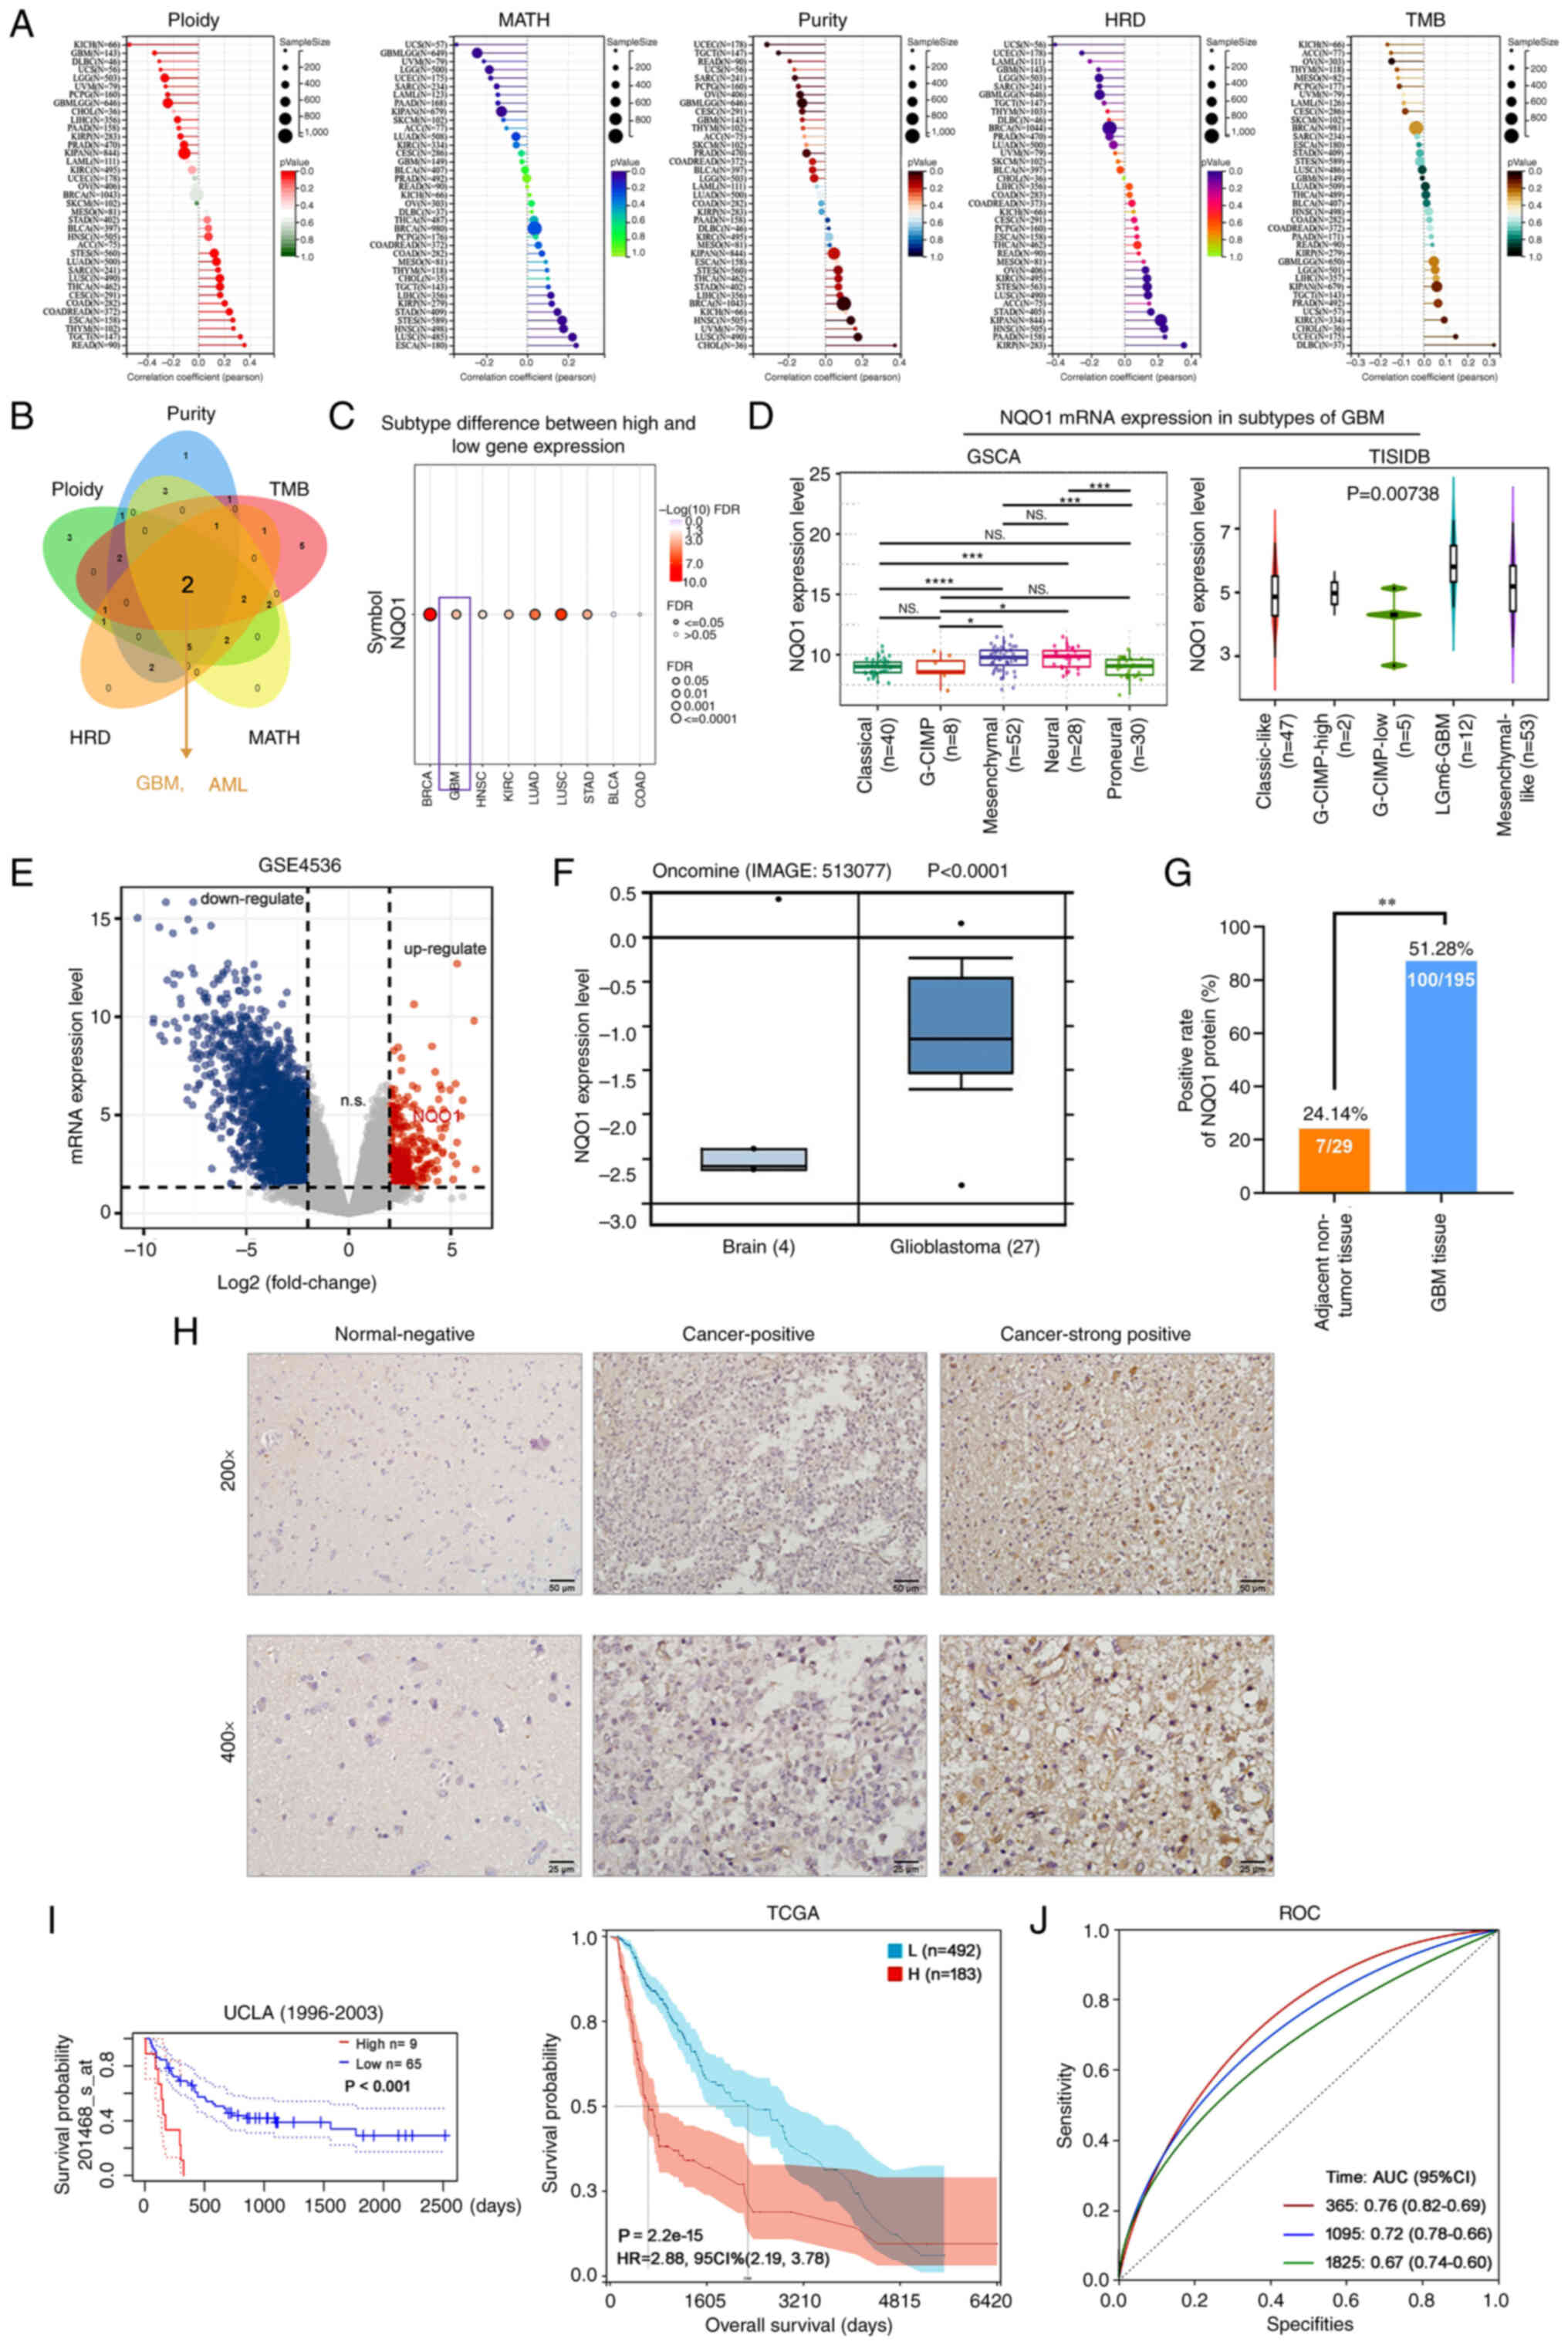 | Figure 2NQO1 expression is upregulated and
associated with poor outcome in patients with GBM. (A) Correlation
between NQO1 expression level and ploidy, MATH, purity, HRD and TMB
were analyzed using TCGA database. (B) Intersection analysis of
NQO1 and ploidy, MATH, purity, HRD and TMB was determined using a
Venn diagram. (C) Correlation between NQO1 and cancer subtype was
assessed using the GSCA database. (D) mRNA expression levels of
NQO1 in GBM subtypes were assessed using GSCA and TISIDB databases.
(E) The mRNA expressions of differentially expressed genes in GBM
were analysed by using GEO database. (F) mRNA expression levels of
NQO1 were assessed using the Oncomine database in brain and GBM
tissues. (G) Positive rate of NQO1 protein expression in adjacent
non-tumor (n=29) and GBM (n=195) tissues. (H) Representative images
of immunohistochemistry staining of the tissue microarray from
patients with GBM. Scale bars, upper: 50 μm; lower: 25
μm. (I) Kaplan-Meier survival analysis of patients with GBM
and low or high NQO1 expression in UALCAN and TCGA databases. (J)
Diagnostic value of NQO1 in patients with GBM was determined using
ROC curve analysis. *P<0.05, **P<0.01,
***P<0.001, ****P<0.0001. NQO1,
NAD(P)H:quinone acceptor oxidoreductase 1; MATH, mutant-allele
tumor heterogeneity; HRD, homologous recombination deficiency; TMB,
tumor mutational burden; GBM, glioblastoma multiforme; ROC,
receiver operating characteristic; UALCAN, University of ALabama at
Birmingham Cancer; TCGA, The Cancer Genome Atlas; TISIDB, an
integrated repository portal for tumor-immune system interactions;
GSCA, Gene Set Co-Expression Analysis. |
Additionally, GES4536 and the Oncomine portal showed
that NQO1 mRNA was upregulated in GBM tissues compared with that in
normal brain tissues (Fig. 2E and
F). To detect the expression level of NQO1 in GBM, IHC staining
for NQO1 was conducted using a GBM tissue array containing 195
cases of GBM specimens and 24 cases of adjacent non-tumor
specimens. High NQO1 expression was found in 100 of 195 (51.28% of
cases with a score ≥4) GBM specimens compared with only 7 of 29
(24.14%) adjacent non-tumor specimens (Fig. 2G). IHC staining of NQO1 in
representative GBM and adjacent non-tumor specimens is shown in
Fig. 2H; the positive staining of
NQO1 was observed mainly in the cytoplasm of cancer cells. As
summarized in Table I, high NQO1
expression was significantly associated with high tumor grade (III
+ IV; P= 0.001) and invasion (P=0.031), but was not significantly
associated with age, sex, tumor size or tumor location (P>0.05).
Further prognostic analysis indicated that high expression of NQO1
(high n=9) was associated with a shorter survival compared with low
expression of NQO1 (low n=65) in GBM based on database 201467_s_at
(Fig. 2I). The diagnostic value
was assessed using the ROC curve analysis in GBM, and the area
under curve was 0.76 at 1 year, 0.72 at 3 years and 0.67 at 5
years, respectively (Fig. 2J).
These findings suggested that NQO1 could be a prognostic marker for
the MES subtype of GBM.
 | Table IAssociation of NQO1 expression with
clinicopathological characteristics in GBM. |
Table I
Association of NQO1 expression with
clinicopathological characteristics in GBM.
| Feature | N | NQO1 expression
| χ2 | P-value |
|---|
| High (%) | Low (%) |
|---|
| Sex | | | | | |
| Male | 132 | 66 (50.0) | 66 (50.0) | 0.269 | 0.604 |
| Female | 63 | 34 (54.0) | 29 (46.0) | | |
| Age, years | | | | | |
| <50 | 100 | 49 (49.0) | 51 (51.0) | 0.428 | 0.513 |
| ≥50 | 95 | 51 (53.7) | 44 (46.3) | | |
| Tumor size, cm | | | | | |
| <4 | 70 | 35 (50.0) | 35 (50.0) | 0.072 | 0.789 |
| ≥4 | 125 | 65 (52.0) | 60 (48.0) | | |
| Tumor location | | | | | |
| Left | 82 | 45 (54.9) | 37 (45.1) | 1.331 | 0.514 |
| Right | 89 | 45 (50.6) | 44 (49.4) | | |
| Other | 24 | 10 (41.7) | 14 (58.3) | | |
| WHO grade | | | | | |
| Low-grade (I +
II) | 79 | 29 (36.7) | 50 (63.3) | 11.289 | 0.001b |
| High-grade (III +
IV) | 116 | 71 (61.2) | 45 (38.8) | | |
| Invasion into
surrounding tissue | | | | | |
| Yes | 55 | 35 (63.6) | 20 (36.4) | 4.68 | 0.031a |
| No | 140 | 65 (46.4) | 75 (53.6) | | |
NQO1 participates in GBM cell
proliferation in vivo and in vitro
To determine the biological function of NQO1 in GBM
progression, the expression levels of NQO1 were detected in NHA and
GBM cell lines. As shown in Fig.
3A, NQO1 was highly expressed in U87 (MES subtype), SHG66 (MES
subtype), NHA and U251 cells, meanwhile it was lowly expressed in
T98G (PN subtype) and SHG44 (PN subtype) cells. Therefore, U87 and
SHG66 cells were chosen for NQO1 knockdown, and T98G and SHG44
cells were chosen for NQO1 overexpression. The transfection
efficacy was verified using western blotting (Fig. 3B). Subsequently, MTT and EdU assays
revealed that NQO1 knockdown markedly inhibited cell proliferation
and the percentage of EdU-positive cells, whereas NQO1
overexpression cells had the opposite effects (Fig. 3C and D). As expected, silencing
NQO1 resulted in the formation of fewer and smaller colonies,
whereas NQO1 overexpression enhanced clonogenicity (Fig. 3E).
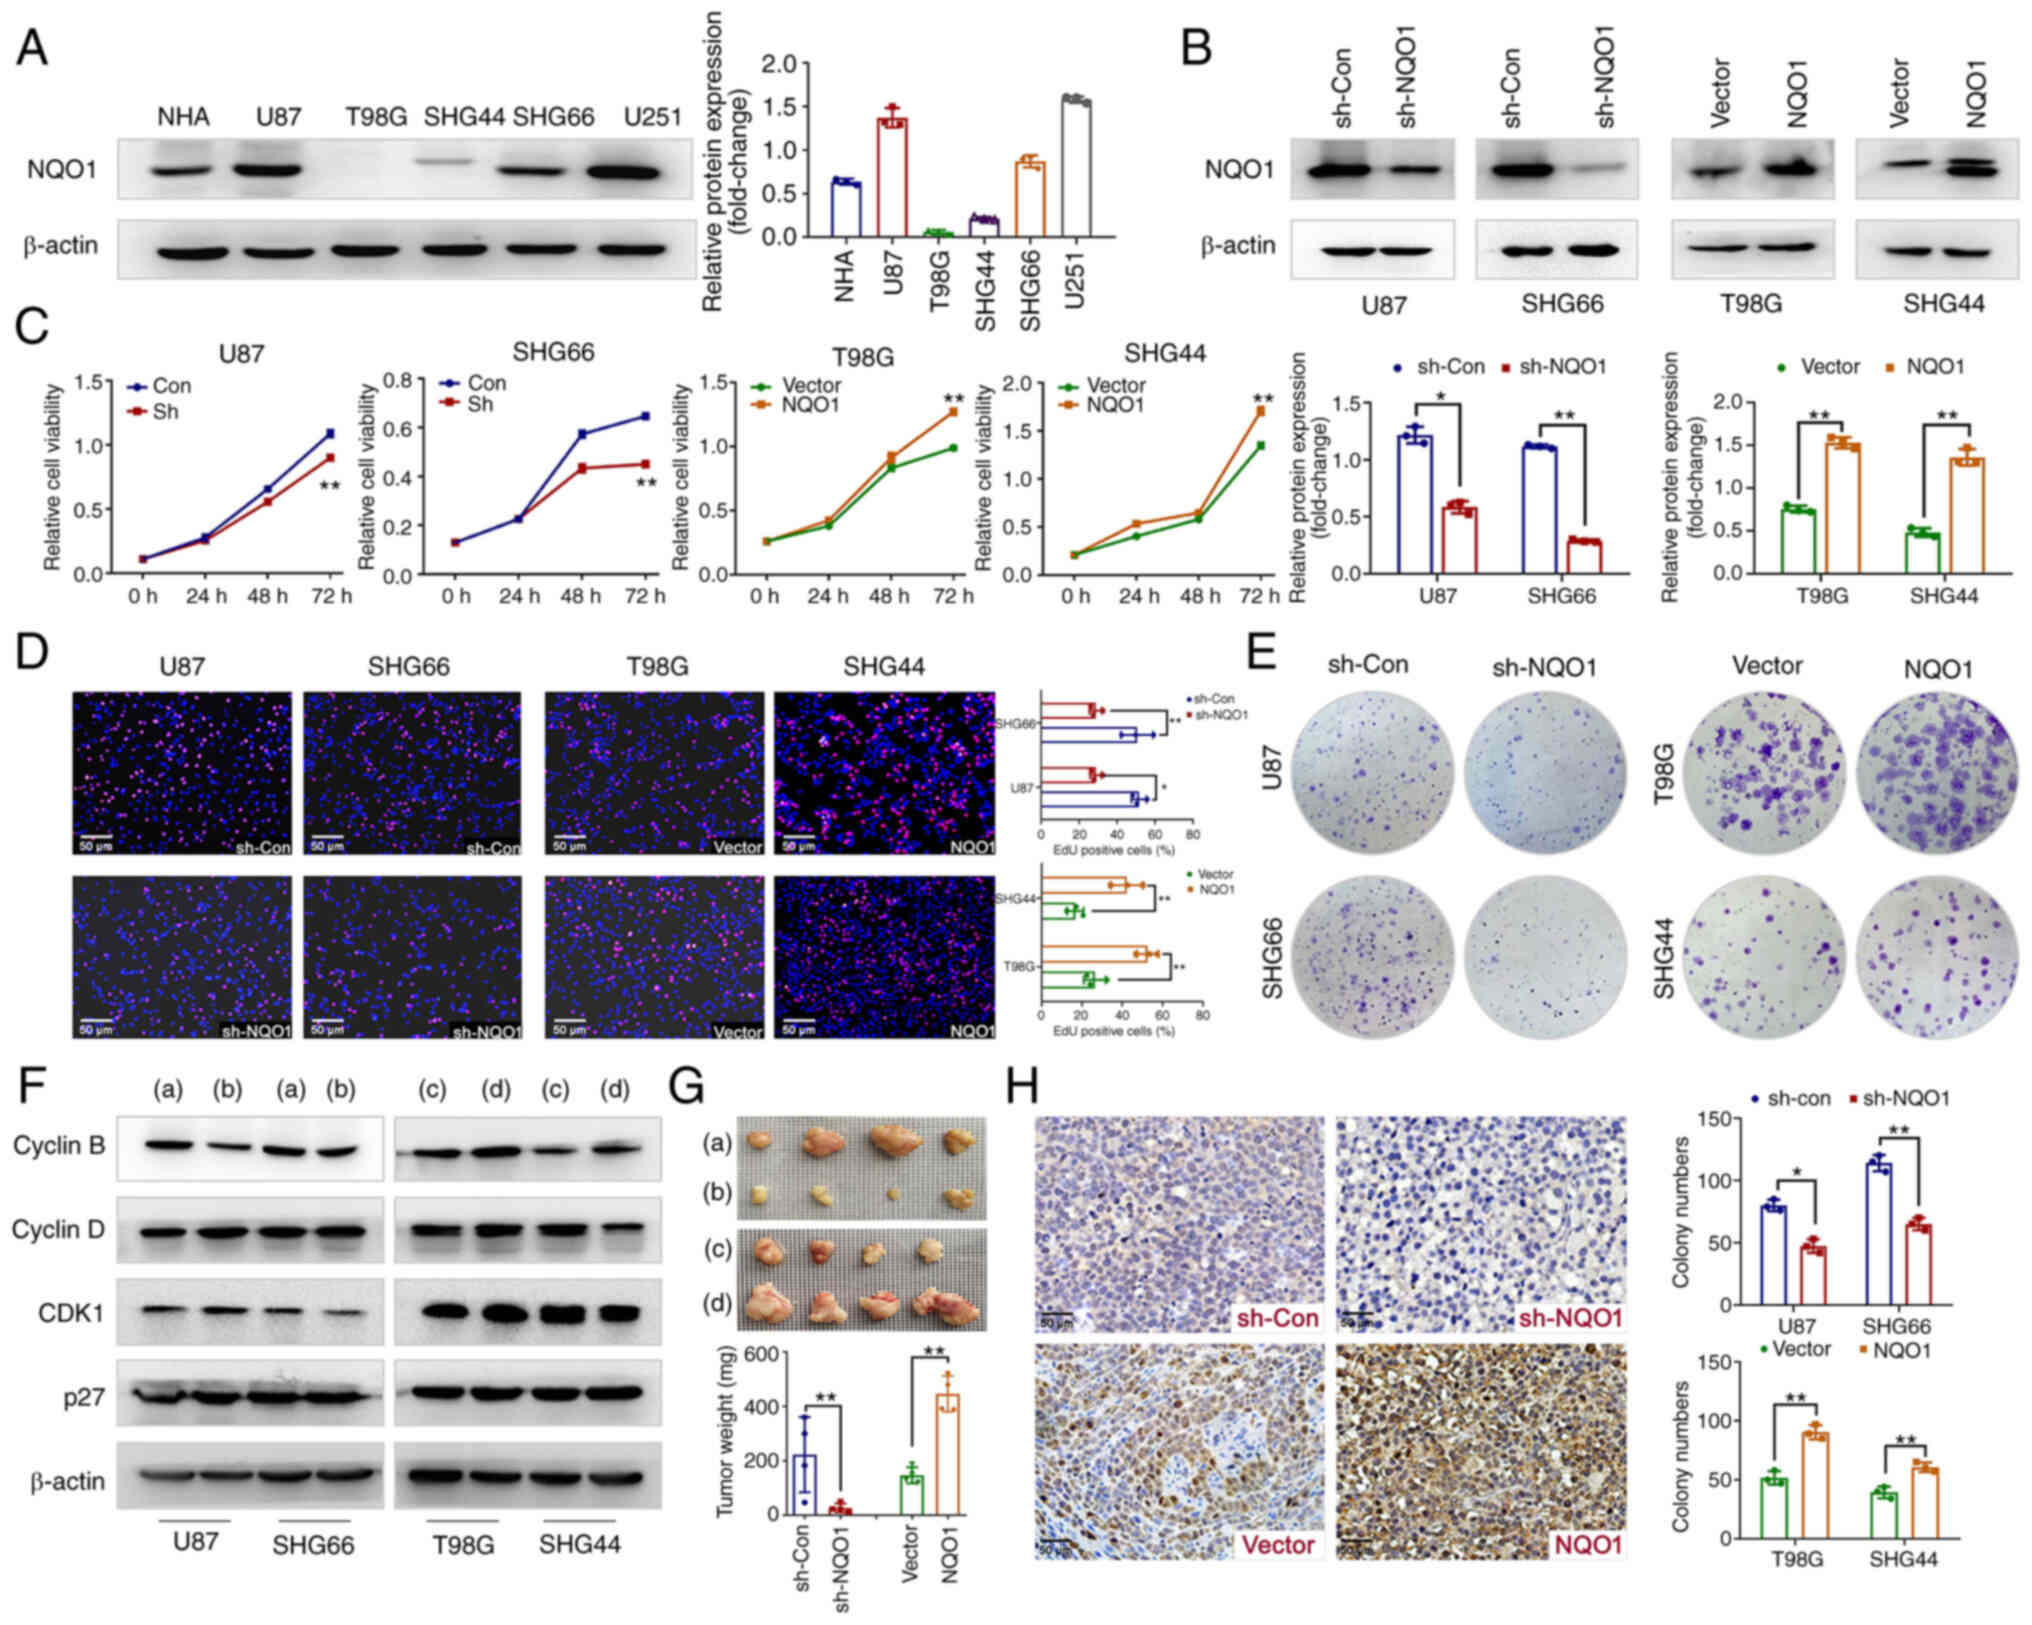 | Figure 3NQO1 regulates GBM cell proliferation
in vitro and in vivo. (A) Expression levels of NQO1
in NHA and GBM cell lines were detected by western blotting. (B)
Confirmation of NQO1 knockdown and overexpression were detected by
western blotting in the sh-Con, sh-NQO1, vector and NQO1
overexpression groups. β-actin was used as a loading control.
Effects of NQO1 on GBM cell proliferation were determined using (C)
MTT, (D) EdU and (E) colony formation assays. Scale bar: 50
μm. (F) Expression levels of cell cyclin-related proteins in
the NQO1 knockdown or overexpression groups were detected by
western blotting. (a) sh-Con group, (b) shNQO1 group, (c) vector
group (d) NQO1 overexpression group. (G) Representative images of
GBM cell xenograft tumors in the four groups of nude mic. . (a)
sh-Con group, (b) shNQO1 group, (c) vector group (d) NQO1
overexpression group. Xenograft tumor weights are shown
(n=4/group). In the images, each grid represents 1×1 mm. (H) Ki67
expression in tumor sections were determined by immunohistochemical
analysis. Scale bar: 50 μm. In all panels, t-tests for
independent means were used for two group comparisons.
*P<0.05, **P<0.01. NQO1,
NAD(P)H:quinone acceptor oxidoreductase 1; NHA, normal human
astrocytes; GBM, glioblastoma multiforme; sh, short hairpin; Con,
control; CDK1, cyclin-dependent kinase 1. |
Consistent with these observations, knockdown of
NQO1 significantly reduced the expression levels of the
G2 phase marker Cyclin B; the opposite effects were
obtained in cells overexpressing NQO1 (Figs. 3F and S1). Notably, there was no marked
alterations in the protein expression levels of Cyclin D, CDK1 and
p27 (Figs. 3F and S1). Subsequently, the in vivo
experiment further confirmed the effect of NQO1 on tumorigenesis.
The results revealed that NQO1 knockdown decreased tumor size and
weight, whereas NQO1 overexpression had the opposite effects in a
nude mouse model of subcutaneous tumors (Fig. 3G). In addition, NQO1 knockdown
decreased the tumor size of intracranial tumors (Fig. S2). IHC staining of tumor tissue
sections showed that Ki67 proliferation indexes were decreased in
the NQO1 knockdown group and increased in the NQO1 overexpression
group (Fig. 3H). These results
indicated that NQO1 participated in GBM cell proliferation in
vivo and in vitro.
NQO1 promotes cell migration and
invasion, and induces the EMT
Subsequently, the present study focused on the
functionalities of NQO1 in the metastatic potential of GBM cells.
As expected, NQO1 significantly regulated the lateral and
longitudinal migration, and invasion of GBM cells, as determined by
wound healing and Transwell assays (Fig. 4A and B). Publicly available data
(GEPIA, LinkOmics, CHIPbase and cBioportal database) predicted that
the mRNA expression of NQO1 was positively correlated with collagen
type I α1, fibronectin, Snail and Twist 2 (Fig. 4C). Consistent with this prediction,
the results of western blotting showed that the epithelial marker
E-cadherin was upregulated in NQO1 knockdown cells, whereas MES
markers (Twist, Snail, Slug and Vimentin) were downregulated,
whereas NQO1 overexpression had the opposite effects (Fig. 4D). Additionally, the present
findings were further verified using IF staining (Fig. 4E). Similarly, in vivo
metastasis analysis confirmed that knockdown of NQO1 significantly
inhibited lung metastasis (Figs.
4F and S3), alongside a
notable reduction in Vimentin and a promotion in E-cadherin in
xenograft tissue sections (Fig.
4G). Taken together, these data indicated that NQO1 regulated
EMT progression and metastasis in GBM.
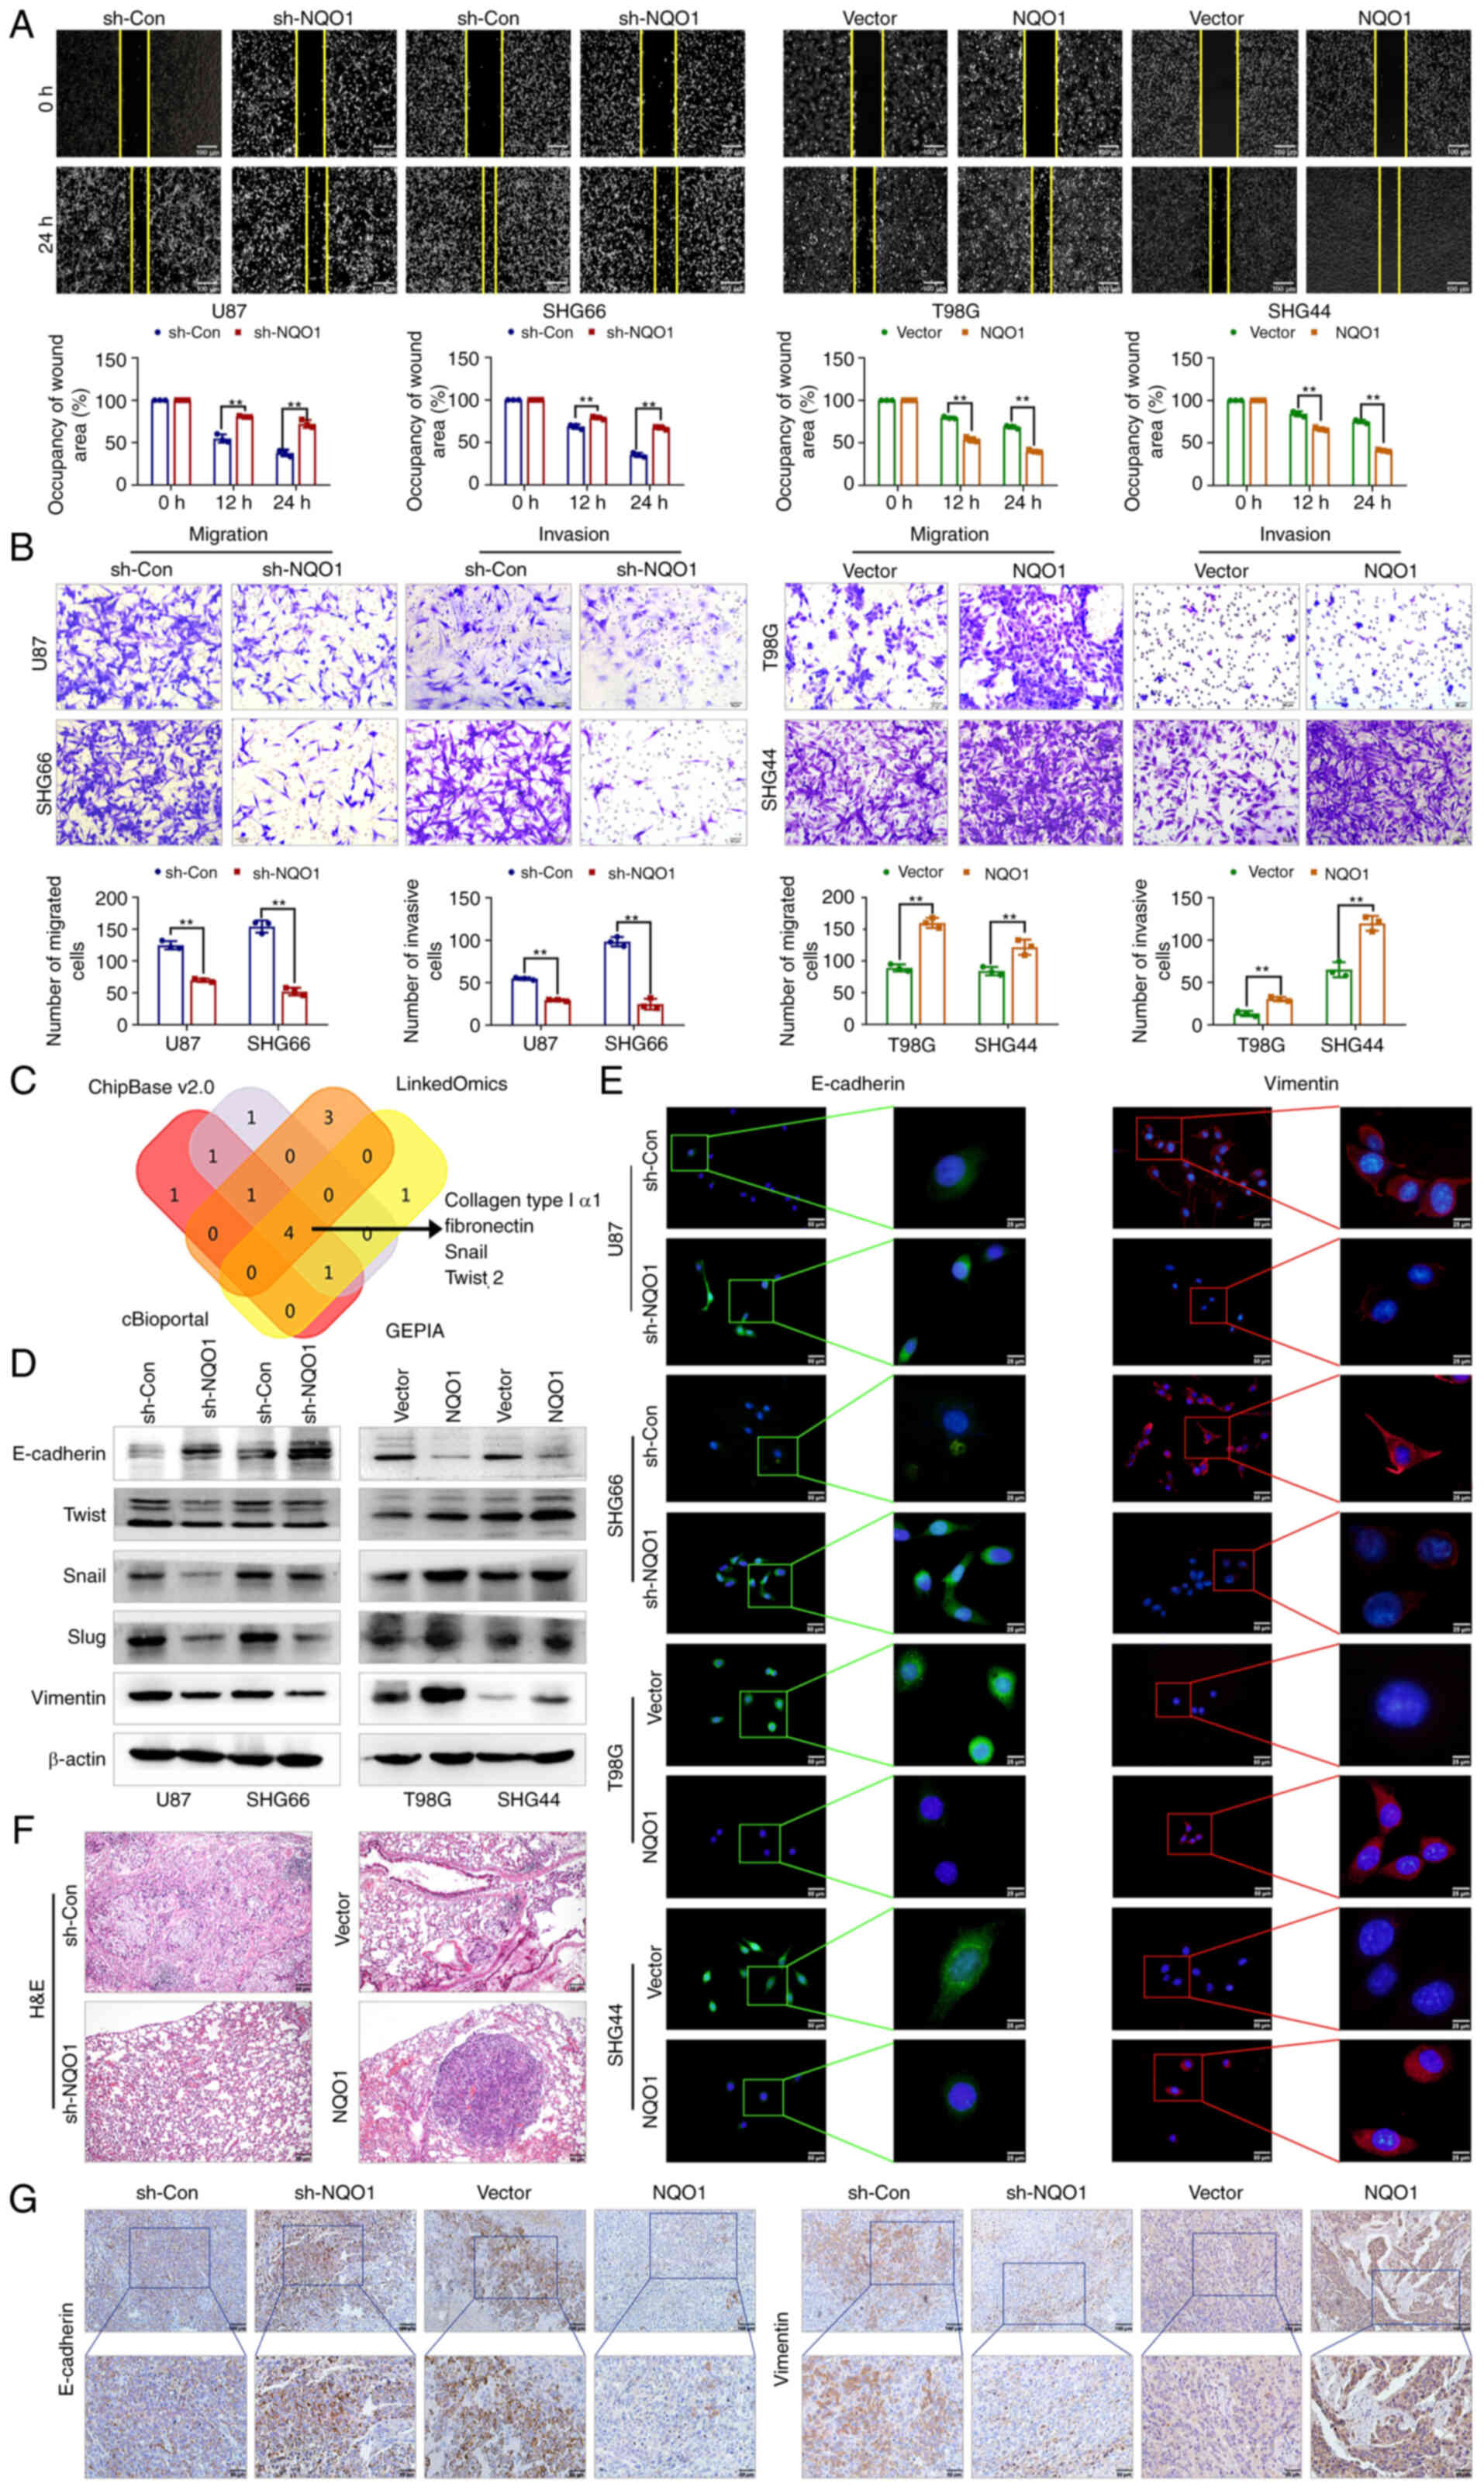 | Figure 4NQO1 accelerates GBM cell metastasis
via the EMT process in vitro and in vivo. (A)
Representative images of wound healing at 0 and 24 h after wound
scratch in the sh-Con, sh-NQO1, vector and NQO1 overexpression
groups. Wound healing percentage was quantified as width at 24
h/width at 0 h using ImageJ. Scale bar: 50 μm. (B)
Representative images and quantification of the Transwell
(migration and invasion) assays in the four groups of GBM cells.
Scale bar: 50 μm. (C) Association between NQO1 expression
and EMT markers in GBM were presented by using Venn diagram. The
data were obtained from GEPIA, LinkOmics, CHIPbase and cBioportal
database. (D) Expression levels of EMT markers were detected using
western blotting in the four groups of GBM cells. β-actin was used
as a loading control. Expression levels of EMT markers (E-cadherin
and Vimentin) in the four groups of GBM cells were detected using
immunofluorescence staining. Scale bar: 50 μm (right), 25
μm (left). Red staining indicates Vimentin, green staining
indicates E-cadherin, blue staining indicates DAPI. (F)
Representative images of H&E staining of the lung tissues.
Scale bar: 100 μm. (G) Expression levels of E-cadherin and
Vimentin in the four groups of xenograft tumor tissues were
detected using immunohistochemical staining. Scale bars, upper: 100
μm; lower: 50 μm. **P<0.01. NQO1,
NAD(P)H:quinone acceptor oxidoreductase 1; EMT,
epithelial-mesenchymal transition; GBM, glioblastoma multiforme;
sh, short hairpin; Con, control; HE, hematoxylin and eosin; Twist,
twist-related protein; GEPIA, Gene Expression Profiling Interactive
Analysis. |
Inhibitors of the PI3K/Akt/mTOR signaling
pathway reverse the effects of NQO1 on GBM cell malignant
phenotype
MES subtype-specific prognostic genes of GBM are
mainly related to MES cell movement and the PI3K/Akt pathway
(24). To assess whether NQO1
serves a role in GBM via the PI3K/Akt pathways, the expression of
pathway markers in GBM cells was first detected by western
blotting. The results revealed that silencing NQO1 could
downregulate the protein expression levels of p-Akt/AKT,
p-4EBP1/4EBP1 and p-S6/S6, and the opposite results were revealed
in cells with NQO1 overexpression (Fig. 5A). Treatment with LY294002 (PI3K
inhibitor) and Rapamycin (mTOR inhibitor) was used to further
clarify the regulatory mechanism of the PI3K/Akt/mTOR signaling
pathway in GBM. A series of rescue experiments showed that LY294002
and Rapamycin reversed the effects of NQO1 on the proliferation,
colony formation and migration of GBM cells (Fig. 5B-F). Meanwhile, the fluorescence
intensity of E-cadherin was increased, and that of Vimentin was
decreased in the presence of both inhibitors (Fig. 5G). Western blotting results
confirmed that LY294002 and Rapamycin weakened the effects of NQO1
on the EMT of GBM cells (Fig. 5H).
These results suggested that NQO1 could induce malignant evolution
of GBM by activating the PI3K/Akt/mTOR signaling pathway.
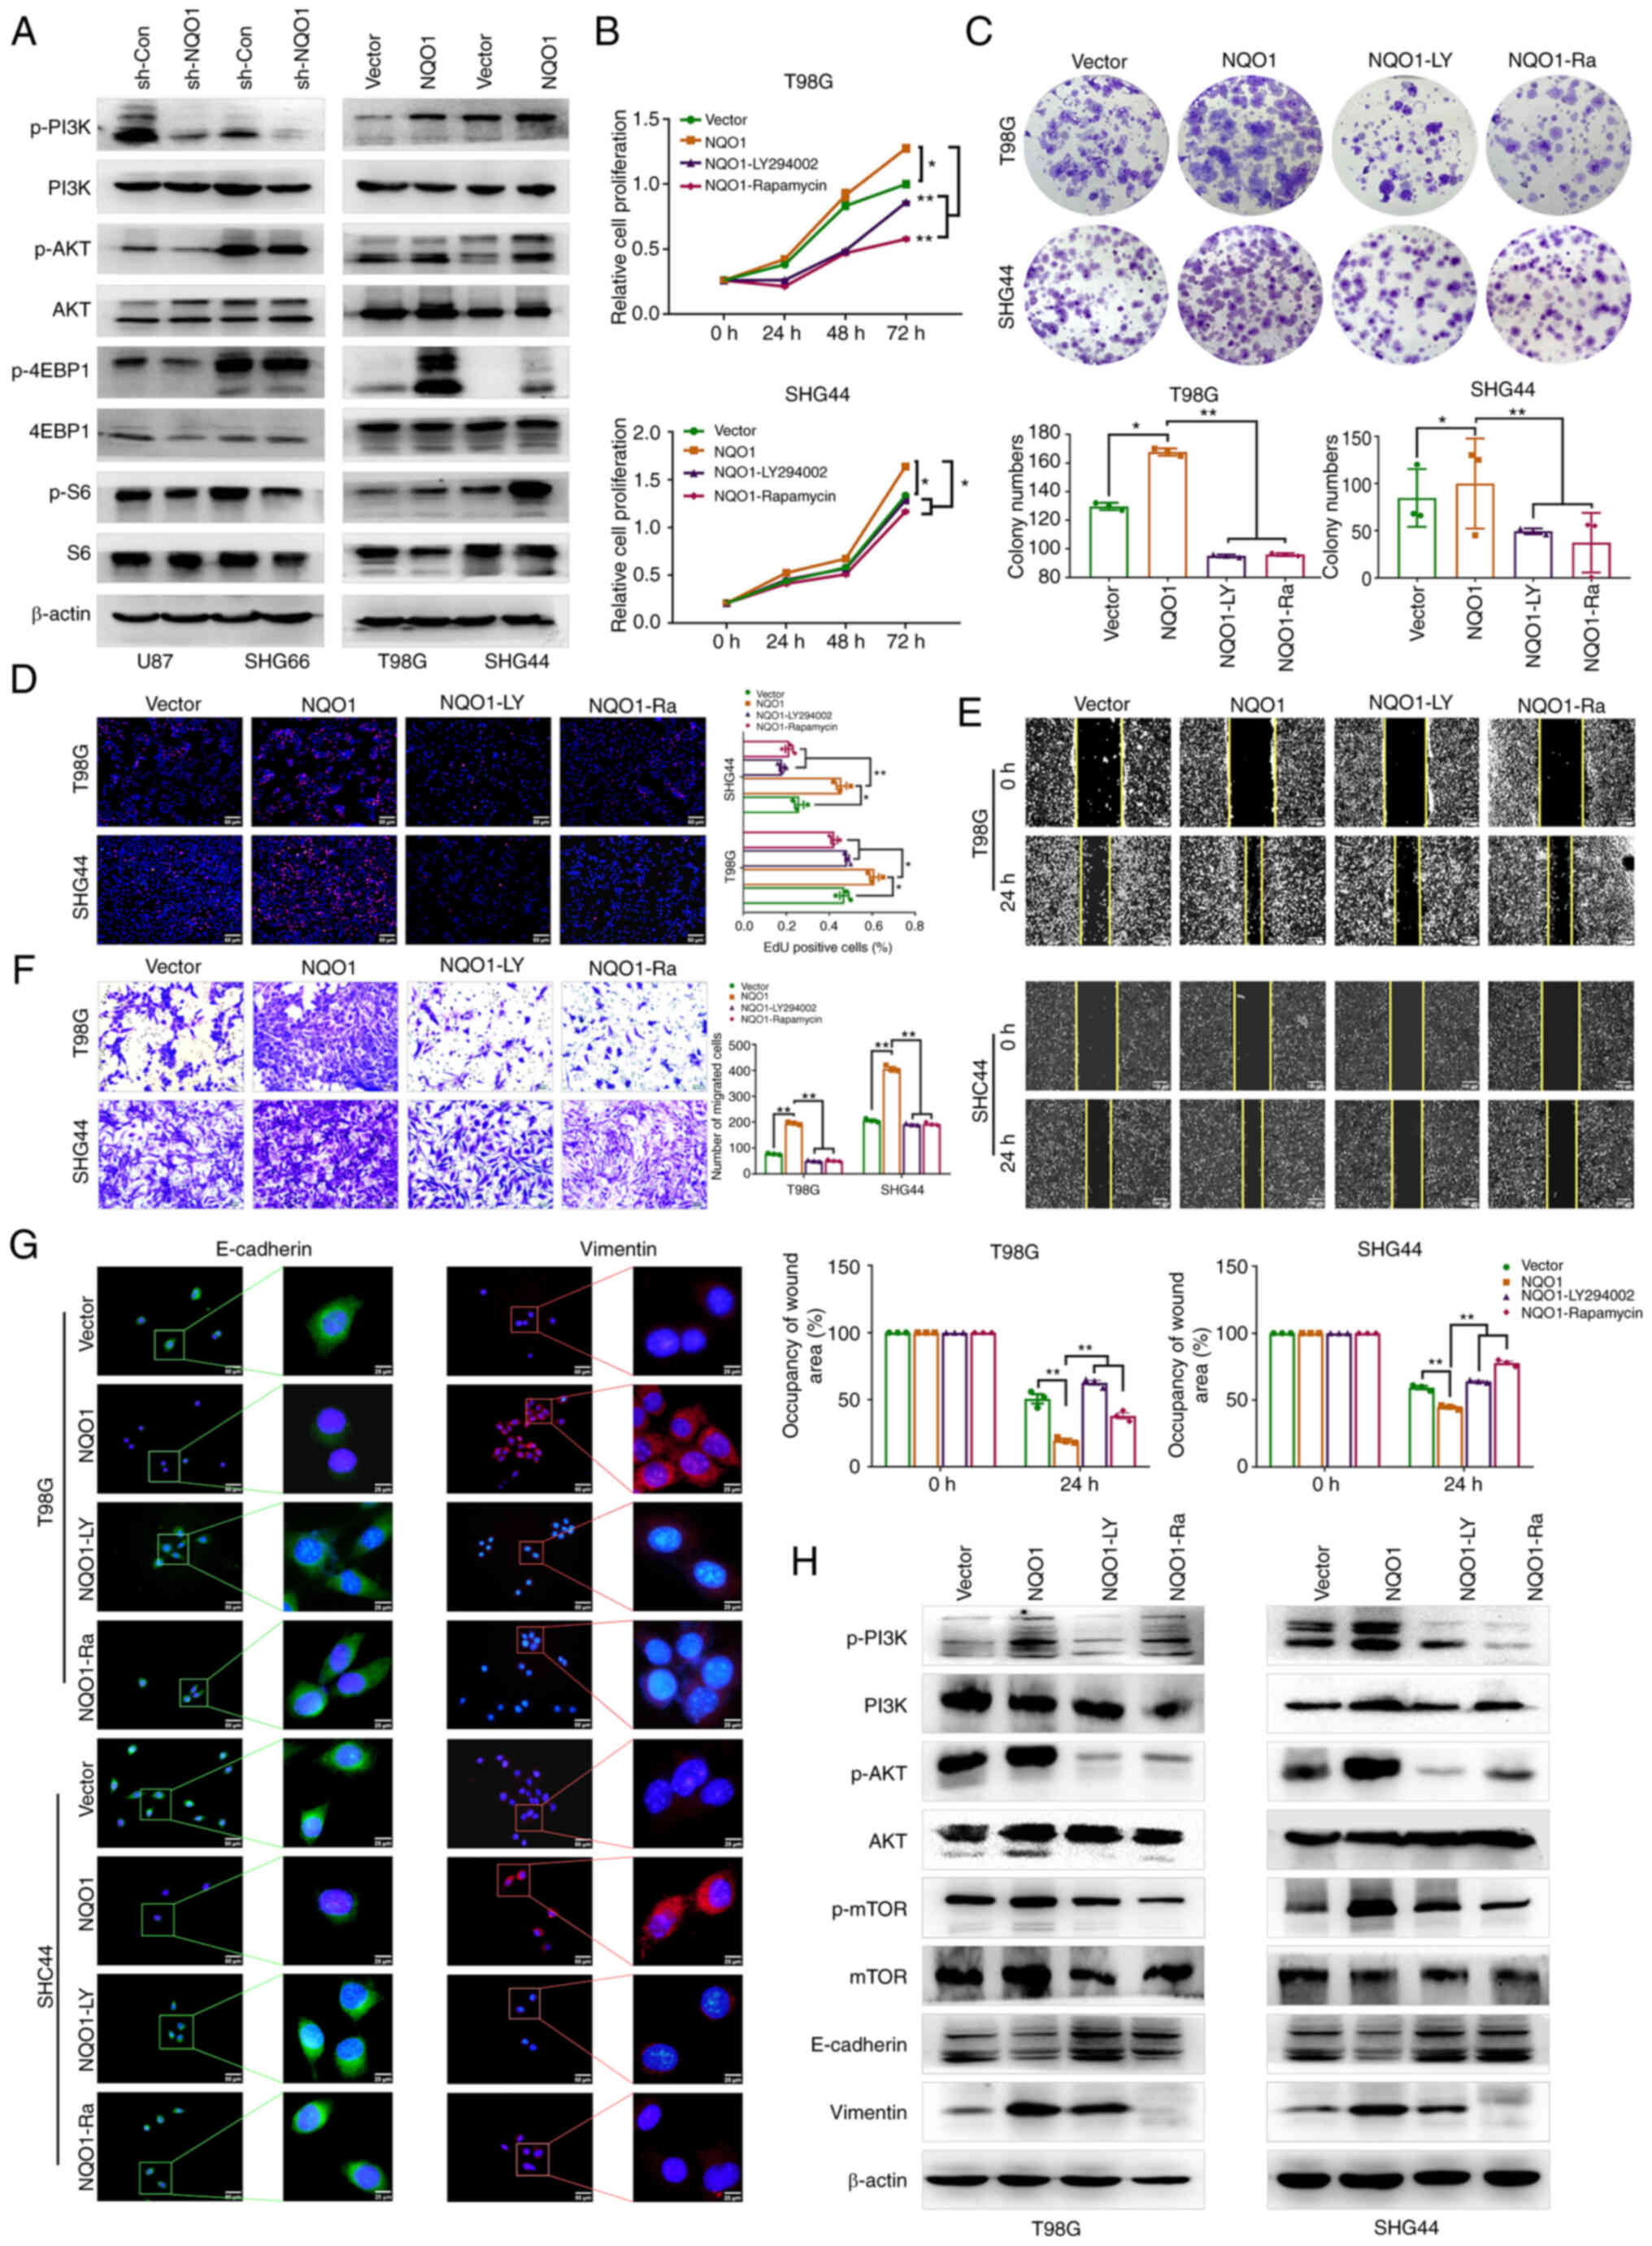 | Figure 5NQO1 activates the PI3K/Akt/mTOR
pathway to regulate cell proliferation, movement and the EMT
process. (A) Expression of PI3K/Akt/mTOR pathway markers was
detected by western blotting in the four groups of GBM cells.
β-actin was used as the loading control. Effects of LY294002 and
Rapamycin on the proliferation of NQO1-overexpressing cells were
detected using (B) MTT, (C) colony formation and (D) EdU assays.
Effects of LY294002 and Rapamycin on the mobilty of
NQO1-overexpressing cells were determined using (E) wound healing
(scale bar: 50 μm) and (F) Transwell assays (scale bar: 25
μm). (G) Expression levels of EMT markers (E-cadherin and
Vimentin) in the four groups of GBM cells were detected using
immunofluorescence staining. Scale bar: 50 μm (right), 25
μm (left). Red staining indicates Vimentin, green staining
indicates E-cadherin, blue staining indicates DAPI. (H) Expression
levels of EMT markers and PAM pathway markers were detected using
western blotting in the four groups of GBM cells. β-actin was used
as a loading control. *P<0.05,
**P<0.01. NQO1, NAD(P)H:quinone acceptor
oxidoreductase 1; EMT, epithelial-mesenchymal transition; GBM,
glioblastoma multiforme; sh, short hairpin; Con, control; p-,
phosphorylated; 4EBP1, eIF4E-binding protein; S6, ribosomal protein
S6; mTOR, mammalian target of rapamycin. |
NQO1 promotes the malignant progression
of GBM cells via Snail-dependent activation of the PI3K/Akt/mTOR
pathway
Wang et al (25) reported that NQO1 promoted EMT,
mainly by regulating Snail in hepatocellular carcinoma. Therefore,
we hypothesized that NQO1 may accelerate EMT through Snail in GBM
cells. To access this hypothesis, the correlation between NQO1 and
Snail was predicted using a CHIPBase v3.0 database. Spearman
correlation analysis revealed that the mRNA expression levels of
NQO1 were most associated with Snail (Fig. 6A). Subsequently, the potential
binding interaction between NQO1 and Snail was identified using
co-IP and colocalization IF assays (Fig. 6B and C). The ubiquitylation assay
revealed that the ubiquitylation of Snail was markedly decreased in
cells overexpressing NQO1, compared with the vector group cells,
indicating that NQO1 could inhibit Snail degradation by regulating
its ubiquitylation (Fig. 6D).
Therefore, the present study investigated whether NQO1
overexpression promoted the process of GBM via Snail. To verify the
hypothesis, NQO1-overexpressing cells were cocultured with three
Snail siRNA sequences (si-Snail#1, si-Snail#2 and si-Snail#3)
(Fig. S4). According to the
knockdown effects of the siRNAS, si-Snail#2 and si-Snail#3 were
used in subsequent experiments (Fig.
6E). As expected, colony formation assays indicated that Snail
knockdown could reduce the proliferation of GBM cells induced by
NQO1 overexpression (Fig. 6F).
Similarly, wound healing and Transwell assays revealed that Snail
knockdown decreased the migration of GBM cells compared with that
in cells overexpressing NQO1 (Fig. 6G
and H). Furthermore, the expression levels of PI3K/Akt/mTOR
pathway markers and EMT-related markers were markedly decreased in
si-Snail cells, as determined by western blotting (Fig. 6I). Taken together, Snail may be a
potential effector of NQO1 in the regulation of GBM cell
proliferation, migration, EMT and PI3K/Akt/mTOR signaling.
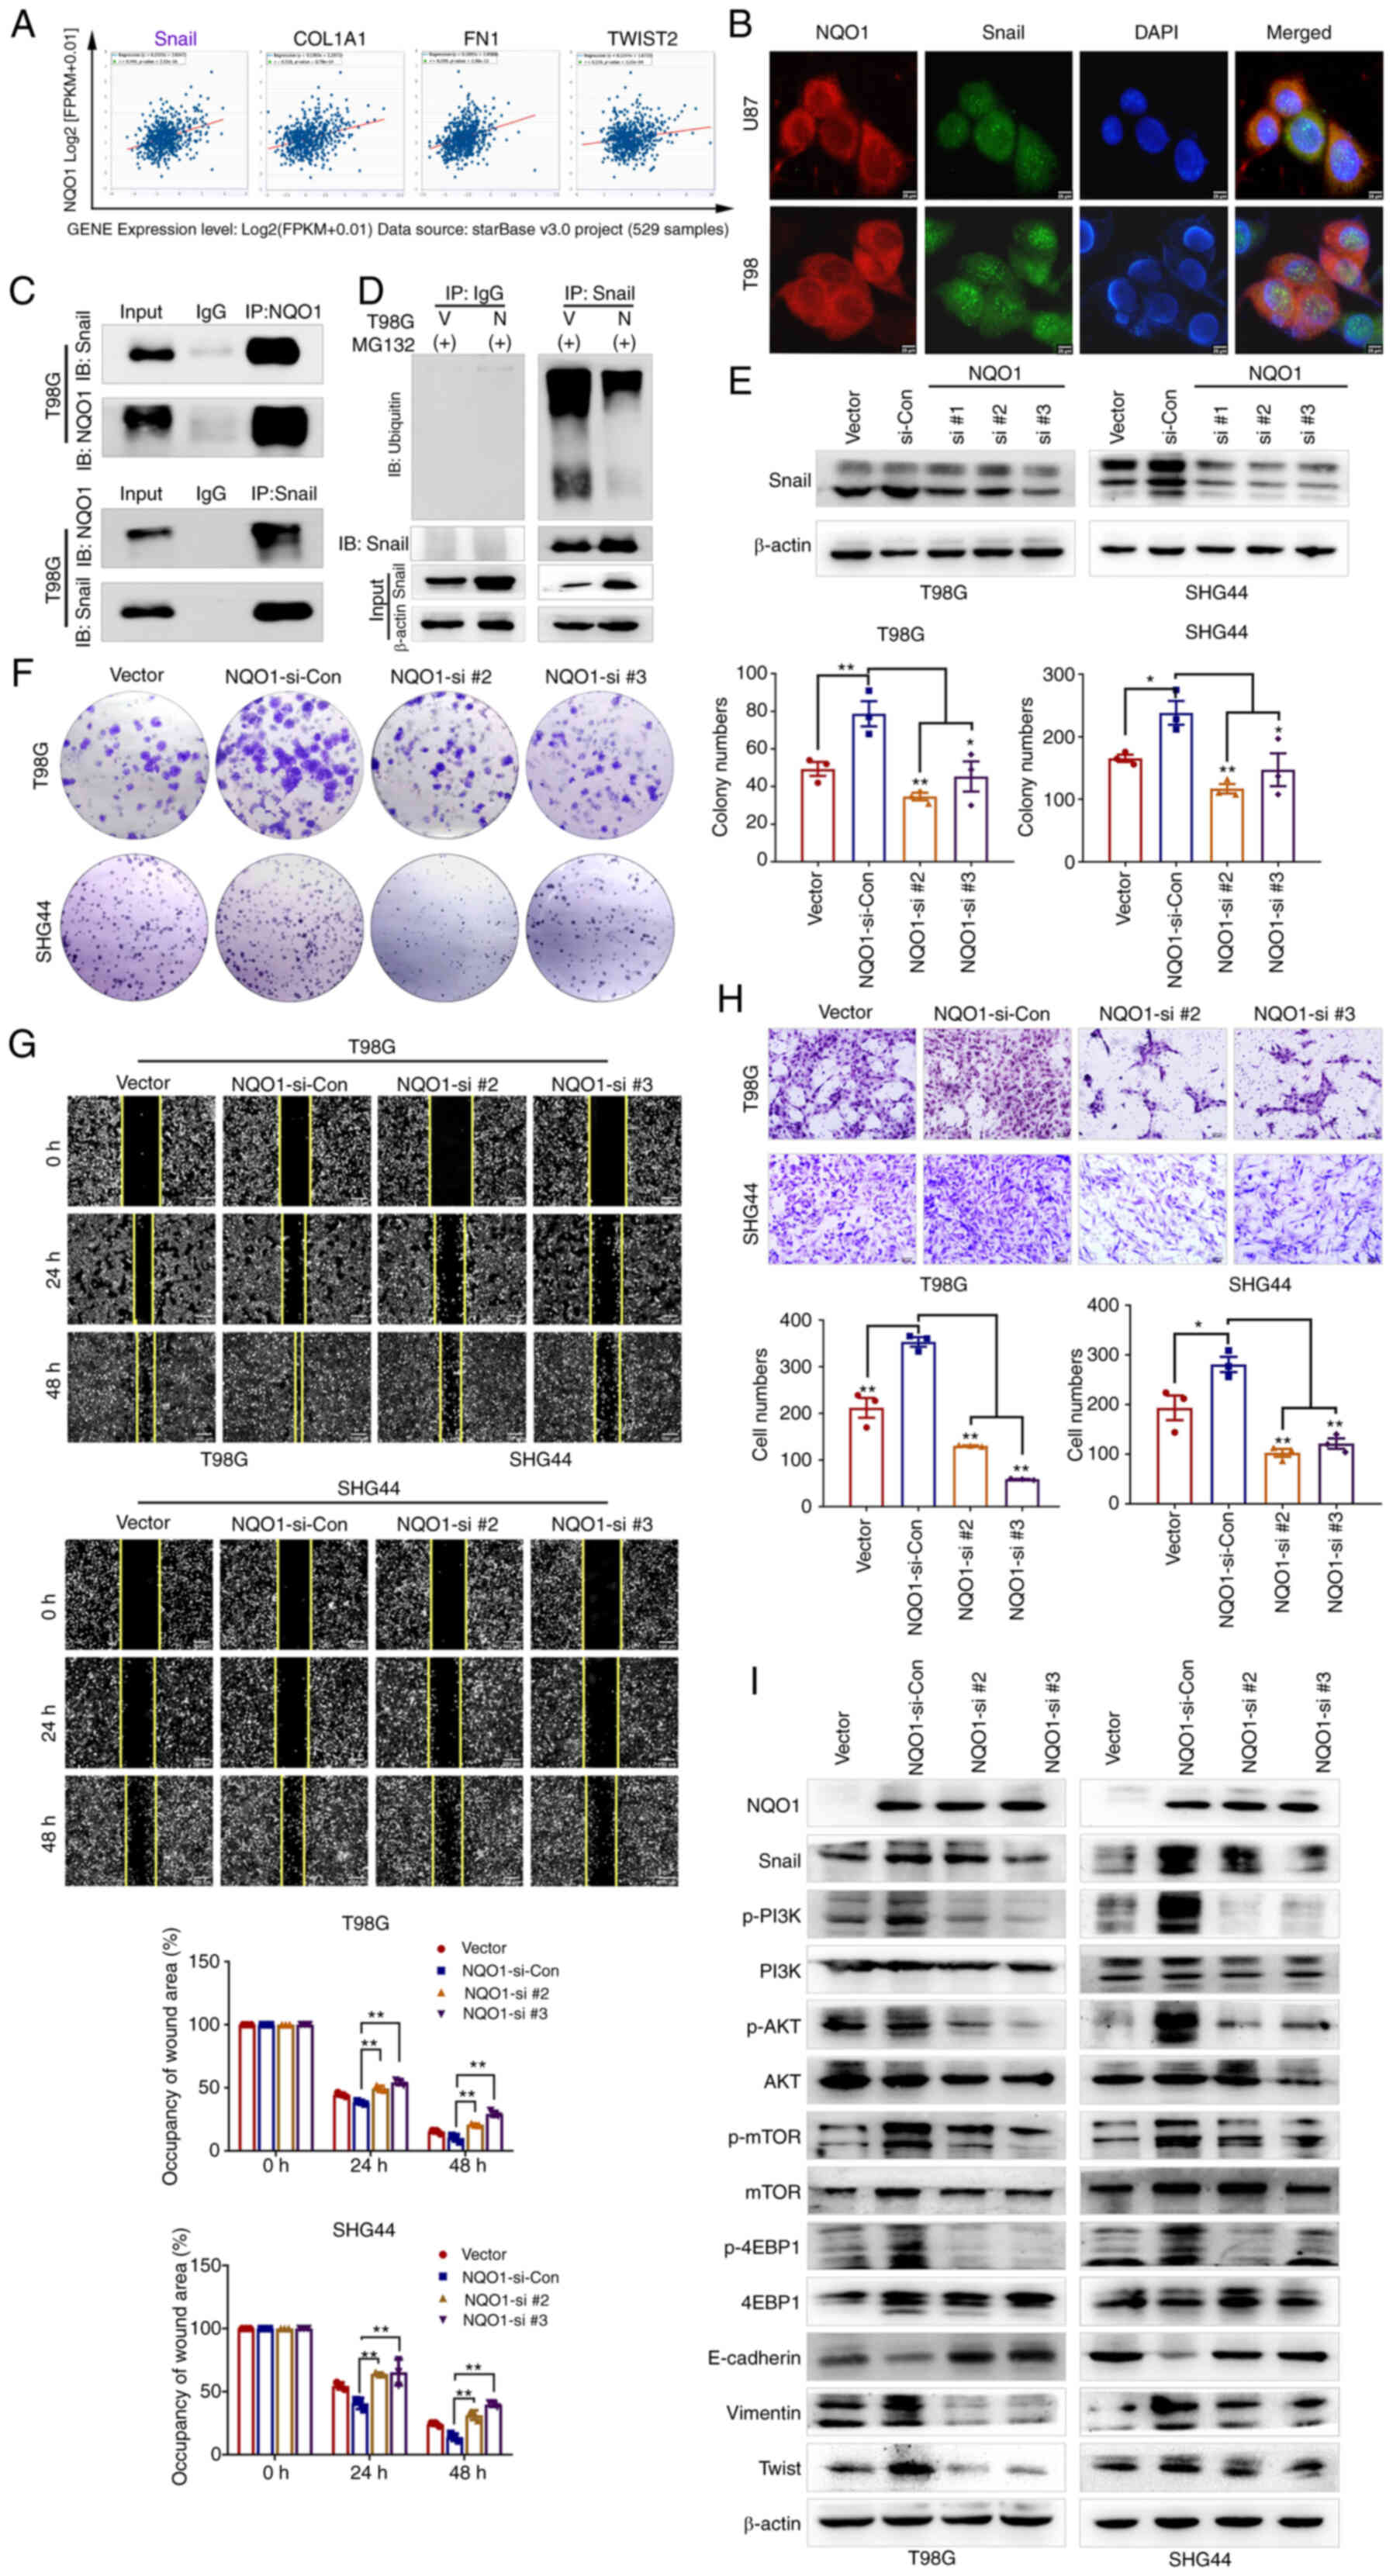 | Figure 6NQO1/Snail regulates GBM progression
by activating the PI3K/Akt/mTOR signaling pathway. (A) Correlations
between NQO1 expression, and Snail, COL1A1, FN1 and TWIST2 were
analyzed using the ENCORI database. (B) Colocalization phenomena of
NQO1 and Snail in GBM cells was confirmed using immunofluorescence
analysis. Scale bar: 25 μm. (C) Interaction of NQO1 and
Snail protein in GBM cells was analyzed using co-IP. (D) T98G cells
of the vector and NQO1 overexpression groups were treated with 10
μM MG132 for 6 h. The ubiquitination of Snail was examined
by western blotting. (E) Snail expression in GBM cells in the
Vector group, and in those co-transfected with NQO1 and si-Con or
siSnail (si #1, si #2 and si #3), as determined using western
blotting. (F) Proliferation of T98G and SHG44 cells were measured
by colony formation assay. Migration of cells was determined using
(G) wound healing (scale bar: 50 μm) and (H) Transwell
assays (scale bar: 25 μm). (I) Expression levels of
epithelial-mesenchymal transition markers and PI3K/Akt/mTOR pathway
markers were detected using western blotting. β-actin was used as
the loading control. *P<0.05, **P<0.01.
NQO1, NAD(P)H:quinone acceptor oxidoreductase 1; GBM, glioblastoma
multiforme; si, small interfering; Con, control; IP,
immunoprecipitation; IB, immunoblot; V, Vector; N, NQO1. |
Discussion
NQO1 is upregulated in various types of cancer and
is closely related to the poor prognosis of patients. The present
study revealed that NQO1 was upregulated in GBM tissues and cells,
especially in the MES subtype. Therefore, the present study
proposed that NQO1 has an effect on the aggressiveness and
development of GBM. However, the specific nature of the
relationship between NQO1 expression and GBM classification
warrants further study. By analyzing the relationship between NQO1
and clinical characteristics, significant differences in
histological grade and tissue infiltration were revealed, which is
consistent with the findings of a previous study (15,26).
Furthermore, survival curve and ROC curve analyses showed a
significant difference in the prognosis between patients with GBM
who exhibited high NQO1 expression and those who exhibited low NQO1
expression. Therefore, NQO1 was indicated as a potential biomarker
for assessing patients with GBM at higher risk of tumor invasion
and/or metastasis.
Previous studies confirmed that NQO1 is a key
molecular switch, and is associated with poor differentiation and
metastasis of cancer cells (19,27).
It was thus a logical hypothesis that NQO1 was involved in GBM
invasion and development. To authenticate this hypothesis, a series
of biological experiments was employed to investigate the role of
NQO1 in regulating the invasion and proliferation of GBM cells. The
results demonstrated that NQO1 knockdown inhibited cell
proliferation, invasion and EMT in GBM cells, whereas NQO1
overexpression had the opposite effect. Furthermore, NQO1
overexpression led to a significant increase in tumor formation and
metastasis, as determined in in vivo experiments. Notably,
our previous study similarly showed that NQO1 overexpression
promoted cell mobility and EMT in BC cells (19). These results support the hypothesis
that NQO1 is an important factor in judging the aggressiveness of
GBM cells.
A previous study suggested that NQO1 influences the
aggressiveness of different human tumor cells through various
signaling pathways (28). Zhou
et al (29) reported that
NQO1 promotes the proliferation of hepatocellular carcinoma cells
via the SIRT6/AKT/XIAP signaling pathway (20). Attenuation of NQO1 has also been
reported to aggravate prostate cancer and tumor cell plasticity
through activating TGF-β signaling (20). It is widely known that the PI3K/Akt
pathway regulates cell proliferation, aggressiveness and metabolism
in multiple types of cancer, especially in GBM (30,31).
Suppression of the PI3K/Akt pathway may be crucial to block
metastasis in GBM (32,33). It has been reported that NQO1
promotes the expression of PI3K and AKT signaling pathways through
TNF (34). Therefore, the present
study investigated whether NQO1 was involved in the PI3K/Akt
pathway in GBM cells. The results revealed that NQO1 may be an
important activator of the PI3K/Akt/mTOR pathway, and PI3K/Akt/mTOR
inhibitors (LY294002 and Rapamycin) reduced the proliferation,
invasion and EMT in NQO1-overexpressing cells in vitro.
Taken together, these results indicated that NQO1 may induce EMT
via the PI3K/Akt/mTOR pathway in GBM cells.
The PI3K/Akt/mTOR signaling pathway, one of the most
critical intracellular signaling pathways, can regulate metastasis
via EMT markers, such as Vimentin and Snail (35,36).
AKT-induced long noncoding RNA VAL has been shown to promote
EMT-independent metastasis through Vimentin degradation (37). Inhibition of the
LASP1/PI3K/AKT/Snail signaling pathway may reduce tumor progression
in GBM cells (38). Moreover, it
has been reported that NQO1 plays a crucial role in mediating EMT
by activating Snail in postmitotic corneal cells, thus conducing to
Fuchs endothelial corneal dystrophy (39). Our previous study confirmed that
NQO1 could promote hepatocellular carcinoma progression and
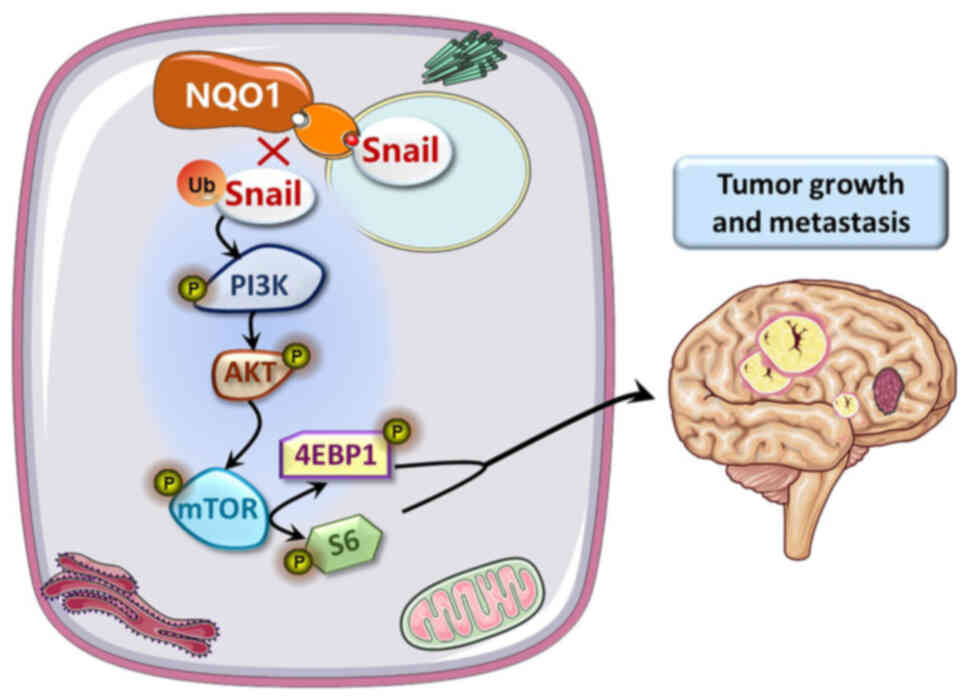
metastasis by regulating Snail stability (25). The present study revealed that NQO1
promoted EMT by blocking proteasome degradation of Snail. We also
indicated that the NQO1-activated PI3K/Akt/mTOR pathway drives
EMT-dependent metastasis in GBM cells through Snail degradation.
These results suggested that NQO1 could influence Snail stability
via ubiquitylation, and NQO1 could regulate the proliferation and
EMT of GBM cells via the PI3K/Akt/mTOR/Snail signaling pathway
(Fig. 7).
In conclusion, the present study identified that
upregulation of NQO1 may be critical for the acquired GBM
aggressive phenotype, and demonstrated that it was associated with
the poor prognosis of patients with GBM. Additionally, NQO1 may
drive GBM cell proliferation and invasion through EMT via the
PI3K/Akt/mTOR/Snail pathway. This study indicated that NQO1 could
be used as a diagnostic biomarker or therapeutic target of GBM,
especially the MES subtype.
Supplementary Data
Availability of data and materials
The datasets used and/or analyzed during the current
study are available from the corresponding author on reasonable
request.
Authors' contributions
LZ, SPY and CHQ confirmed the authenticity of all
the raw data, conceived this study and take responsibility for the
quality of the data. YY participated in analysis and interpretation
of data, and prepared all figures. RX and JSQ participated in the
tissue sample selection and experiments. CHQ and ZHL acquired data
and played an important role in interpreting the results. LZ, SPY
and CHQ performed the data analysis and wrote the manuscript. All
authors read and approved the final manuscript.
Ethics approval and consent to
participate
The use of the glioma tissue microarray in this
research was approved by the Ethics Committee of Yanbian University
Medical College (approval no. YD20230406015) and was conducted in
compliance with the tenets of The Declaration of Helsinki. The
requirement for ethics approval for the use of primary cell lines
was waived. All animal experiments were performed in accordance
with the procedures and protocols of the Laboratory Animal Center
of Yanbian University.
Patient consent for publication
Not applicable.
Competing interests
The authors declare that they have no competing
interests.
Acknowledgments
The authors would like to thank Professor Chunji Han
[Key Laboratory of Pathobiology (Yanbian University), State Ethnic
Affairs Commission] for providing the support on statistics.
Funding
This study was supported by grants from the National Natural
Science Foundation of China (grant no. 82160552) and the Project of
Science and Technology Department of Jilin Province (grant no.
210101207).
References
|
1
|
Siegel RL, Miller KD, Fuchs HE and Jemal
A: Cancer statistics, 2022. CA Cancer J Clin. 72:7–33. 2022.
View Article : Google Scholar : PubMed/NCBI
|
|
2
|
Fang R, Chen X, Zhang S, Shi H, Ye Y, Shi
H, Zou Z, Li P, Guo Q, Ma L, et al: EGFR/SRC/ERK-stabilized YTHDF2
promotes cholesterol dysregulation and invasive growth of
glioblastoma. Nat Commun. 12:1772021. View Article : Google Scholar :
|
|
3
|
Chan DT, Hsieh SY, Kam MK, Cheung TCY, Ng
SCP and Poon WS: Pattern of recurrence and factors associated with
cerebrospinal fluid dissemination of glioblastoma in Chinese
patients. Surg Neurol Int. 7:922016. View Article : Google Scholar : PubMed/NCBI
|
|
4
|
Verhaak RG, Hoadley KA, Purdom E, Wang V,
Qi Y, Wilkerson MD, Miller CR, Ding L, Golub T, Mesirov JP, et al:
Integrated genomic analysis identifies clinically relevant subtypes
of glioblastoma characterized by abnormalities in PDGFRA, IDH1,
EGFR, and NF1. Cancer Cell. 17:98–110. 2010. View Article : Google Scholar : PubMed/NCBI
|
|
5
|
Wang Z, Shi Y, Ying C, Jiang Y and Hu J:
Hypoxia-induced PLOD1 overexpression contributes to the malignant
phenotype of glioblastoma via NF-κB signaling. Oncogene.
40:1458–1475. 2021. View Article : Google Scholar : PubMed/NCBI
|
|
6
|
Li Y, Wang X, Qi S, Gao L, Huang G, Ren Z,
Li K, Peng Y, Yi G, Guo J, et al: Spliceosome-regulated
RSRP1-dependent NF-κB activation promotes the glioblastoma
mesenchymal phenotype. Neuro Oncol. 23:1693–1708. 2021. View Article : Google Scholar : PubMed/NCBI
|
|
7
|
Tang G, Luo L, Zhang J, Zhai D, Huang D,
Yin J, Zhou Q, Zhang Q and Zheng G: lncRNA LINC01057 promotes
mesenchymal differentiation by activating NF-κB signaling in
glioblastoma. Cancer Lett. 498:152–164. 2021. View Article : Google Scholar
|
|
8
|
Amicone L, Marchetti A and Cicchini C:
Exosome-associated circRNAs as key regulators of EMT in cancer.
Cells. 11:17162022. View Article : Google Scholar : PubMed/NCBI
|
|
9
|
Liu Y, Guo G, Lu Y, Chen X, Zhu L, Zhao L,
Li C, Zhang Z, Jin X, Dong J, et al: Silencing IKBKE inhibits the
migration and invasion of glioblastoma by promoting Snail1
degradation. Clin Transl Oncol. 24:816–828. 2022. View Article : Google Scholar
|
|
10
|
Yun EJ, Kim D, Hsieh JT and Baek ST:
Stanniocalcin 2 drives malignant transformation of human
glioblastoma cells by targeting SNAI2 and matrix
Metalloproteinases. Cell Death Discov. 8:3082022. View Article : Google Scholar : PubMed/NCBI
|
|
11
|
Zhong C, Li X, Tao B, Peng L, Peng T, Yang
X, Xia X and Chen L: LIM and SH3 protein 1 induces glioma growth
and invasion through PI3K/AKT signaling and epithelial-mesenchymal
transition. Biomed Pharmacother. 116:1090132019. View Article : Google Scholar
|
|
12
|
Nan Y, Guo L, Lu Y, Guo G, Hong R, Zhao L,
Wang L, Ren B, Yu K, Zhong Y and Huang Q: miR-451 suppresses EMT
and metastasis in glioma cells. Cell Cycle. 20:1270–1278. 2021.
View Article : Google Scholar : PubMed/NCBI
|
|
13
|
Ernster L and Lindberg O: Animal
mitochondria. Annu Rev Physiol. 20:13–42. 1958. View Article : Google Scholar
|
|
14
|
Yadav U, Kumar P and Rai V: NQO1 gene
C609T polymorphism (dbSNP: rs1800566) and digestive tract cancer
risk: A meta-analysis. Nutr Cancer. 70:557–568. 2018. View Article : Google Scholar : PubMed/NCBI
|
|
15
|
Yang Y, Zhang Y, Wu Q, Cui X, Lin Z, Liu S
and Chen L: Clinical implications of high NQO1 expression in breast
cancers. J Exp Clin Cancer Res. 33:142014. View Article : Google Scholar : PubMed/NCBI
|
|
16
|
Li Z, Zhang Y, Jin T, Men J, Lin Z, Qi P,
Piao Y and Yan G: NQO1 protein expression predicts poor prognosis
of non-small cell lung cancers. BMC Cancer. 15:2072015. View Article : Google Scholar : PubMed/NCBI
|
|
17
|
Lin L, Sun J, Tan Y, Li Z, Kong F, Shen Y,
Liu C and Chen L: Prognostic implication of NQO1 overexpression in
hepatocellular carcinoma. Hum Pathol. 69:31–37. 2017. View Article : Google Scholar : PubMed/NCBI
|
|
18
|
Madajewski B, Boatman MA, Chakrabarti G,
Boothman DA and Bey EA: Depleting tumor-NQO1 potentiates anoikis
and inhibits growth of NSCLC. Mol Cancer Res. 14:14–25. 2016.
View Article : Google Scholar :
|
|
19
|
Yang Y, Zhu G, Dong B, Piao J, Chen L and
Lin Z: The NQO1/PKLR axis promotes lymph node metastasis and breast
cancer progression by modulating glycolytic reprogramming. Cancer
Lett. 453:170–183. 2019. View Article : Google Scholar : PubMed/NCBI
|
|
20
|
Thapa D, Huang SB, Muñoz AR, Yang X,
Bedolla RG, Hung CN, Chen CL, Huang THM, Liss MA, Reddick RL, et
al: Attenuation of NAD[P]H:quinone oxidoreductase 1 aggravates
prostate cancer and tumor cell plasticity through enhanced TGFβ
signaling. Commun Biol. 3:122020. View Article : Google Scholar
|
|
21
|
Shimokawa M, Yoshizumi T, Itoh S, Iseda N,
Sakata K, Yugawa K, Toshima T, Harada N, Ikegami T and Mori M:
Modulation of Nqo1 activity intercepts anoikis resistance and
reduces metastatic potential of hepatocellular carcinoma. Cancer
Sci. 111:1228–1240. 2020. View Article : Google Scholar : PubMed/NCBI
|
|
22
|
Wu W, Klockow JL, Zhang M, Lafortune F,
Chang E, Jin L, Wu Y and Daldrup-Link HE: Glioblastoma multiforme
(GBM): An overview of current therapies and mechanisms of
resistance. Pharmacol Res. 171:1057802021. View Article : Google Scholar :
|
|
23
|
Liu YL, Selenica P, Zhou Q, Iasonos A,
Callahan M, Feit NZ, Boland J, Vazquez-Garcia I, Mandelker D, Zehir
A, et al: BRCA Mutations, homologous DNA repair deficiency, tumor
mutational burden, and response to immune checkpoint inhibition in
recurrent ovarian cancer. JCO Precis Oncol.
4:PO.20.000692020.PubMed/NCBI
|
|
24
|
Shahcheraghi SH, Tchokonte-Nana V, Lotfi
M, Lotfi M, Ghorbani A and Sadeghnia HR: Wnt/beta-catenin and
PI3K/Akt/mTOR signaling pathways in glioblastoma: Two main targets
for drug design: A review. Curr Pharm Des. 26:1729–1741. 2020.
View Article : Google Scholar : PubMed/NCBI
|
|
25
|
Wang X, Liu Y, Han A, Tang C, Xu R, Feng
L, Yang Y, Chen L and Lin Z: The NQO1/p53/SREBP1 axis promotes
hepatocellular carcinoma progression and metastasis by regulating
Snail stability. Oncogene. 41:5107–5120. 2022. View Article : Google Scholar : PubMed/NCBI
|
|
26
|
Begleiter A and Fourie J: Induction of
NQO1 in cancer cells. Methods Enzymol. 382:320–351. 2004.
View Article : Google Scholar : PubMed/NCBI
|
|
27
|
Pradubyat N, Sakunrangsit N, Mutirangura A
and Ketchart W: NADPH: Quinone oxidoreductase 1 (NQO1) mediated
anti-cancer effects of plumbagin in endocrine resistant MCF7 breast
cancer cells. Phytomedicine. 66:1531332020. View Article : Google Scholar
|
|
28
|
Yang Y, Zheng J, Wang M, Zhang J, Tian T,
Wang Z, Yuan S, Liu L, Zhu P, Gu F, et al: NQO1 promotes an
aggressive phenotype in hepatocellular carcinoma via amplifying
ERK-NRF2 signaling. Cancer Sci. 112:641–654. 2021. View Article : Google Scholar
|
|
29
|
Zhou HZ, Zeng HQ, Yuan D, Ren JH, Cheng
ST, Yu HB, Ren F, Wang Q, Qin YP, Huang AL and Chen J: NQO1
potentiates apoptosis evasion and upregulates XIAP via inhibiting
proteasome-mediated degradation SIRT6 in hepatocellular carcinoma.
Cell Commun Signal. 17:1682019. View Article : Google Scholar : PubMed/NCBI
|
|
30
|
Precilla SD, Biswas I, Kuduvalli SS and
Anitha TS: Crosstalk between PI3K/AKT/mTOR and WNT/β-Catenin
signaling in GBM-could combination therapy checkmate the collusion?
Cell Signal. 95:1103502022. View Article : Google Scholar
|
|
31
|
Courtney KD, Corcoran RB and Engelman JA:
The PI3K pathway as drug target in human cancer. J Clin Oncol.
28:1075–1083. 2010. View Article : Google Scholar :
|
|
32
|
Wojtas B, Gielniewski B, Wojnicki K,
Maleszewska M, Mondal SS, Nauman P, Grajkowska W, Glass R, Schüller
U, Herold-Mende C and Kaminska B: Gliosarcoma is driven by
alterations in PI3K/Akt, RAS/MAPK pathways and characterized by
collagen gene expression signature. Cancers (Basel). 11:2842019.
View Article : Google Scholar : PubMed/NCBI
|
|
33
|
Burris HA III: Overcoming acquired
resistance to anticancer therapy: Focus on the PI3K/AKT/mTOR
pathway. Cancer Chemother Pharmacol. 71:829–842. 2013. View Article : Google Scholar : PubMed/NCBI
|
|
34
|
Ahn YJ, Lim JW and Kim H: Docosahexaenoic
acid induces expression of NAD(P)H: Quinone oxidoreductase and heme
oxygenase-1 through Activation of Nrf2 in cerulein-stimulated
pancreatic acinar cells. Antioxidants (Basel). 9:10842020.
View Article : Google Scholar : PubMed/NCBI
|
|
35
|
Liang S, Guo H, Ma K, Li X, Wu D, Wang Y,
Wang W, Zhang S, Cui Y, Liu Y, et al: A PLCB1-PI3K-akt signaling
axis activates EMT to promote cholangiocarcinoma progression.
Cancer Res. 81:5889–5903. 2021. View Article : Google Scholar : PubMed/NCBI
|
|
36
|
Lee S, Choi EJ, Cho EJ, Lee YB, Lee JH, Yu
SJ, Yoon JH and Kim YJ: Inhibition of PI3K/Akt signaling suppresses
epithelial-to-mesenchymal transition in hepatocellular carcinoma
through the Snail/GSK-3/beta-catenin pathway. Clin Mol Hepatol.
26:529–539. 2020. View Article : Google Scholar : PubMed/NCBI
|
|
37
|
Tian H, Lian R, Li Y, Liu C, Liang S, Li
W, Tao T, Wu X, Ye Y, Yang X, et al: AKT-induced lncRNA VAL
promotes EMT-independent metastasis through diminishing
Trim16-dependent Vimentin degradation. Nat Commun. 11:51272020.
View Article : Google Scholar :
|
|
38
|
Zhong C, Chen Y, Tao B, Peng L, Peng T,
Yang X, Xia X and Chen L: LIM and SH3 protein 1 regulates cell
growth and chemosensitivity of human glioblastoma via the PI3K/AKT
pathway. BMC Cancer. 18:7222018. View Article : Google Scholar : PubMed/NCBI
|
|
39
|
Katikireddy KR, White TL, Miyajima T,
Vasanth S, Raoof D, Chen Y, Price MO, Price FW and Jurkunas UV:
NQO1 downregulation potentiates menadione-induced
endothelial-mesenchymal transition during rosette formation in
Fuchs endothelial corneal dystrophy. Free Radic Biol Med.
116:19–30. 2018. View Article : Google Scholar : PubMed/NCBI
|