Introduction
The overexpression of the human epidermal growth
factor receptor 2 (HER2) gene is observed in 20–30% of human breast
cancer patients (1). Treatment for
this type of breast cancer has markedly improved since the approval
of the monoclonal antibody trastuzumab (T), and the combination of
lapatinib with capecitabine, also available since June 2009 in
Japan.
However, p95HER2 protein expression, loss of
phosphatase and tensin homolog (PTEN) deleted on chromosome 10 and
PIK3CA gene mutation have demonstrated a resistance to T treatment
(2,3). p95HER2 is the carboxyl terminal
fragment (CTF) of HER2, while p95HER2 lacked the T binding site.
Therefore, p95HER2 expression in HER2-positive breast cancer
appeared to be involved in T resistance. p95HER2 protein was
co-expressed with wild-type HER2 in 14–60% of the HER2-positive
breast cancer cases (4,5). In addition, PTEN is a cancer
suppressor gene, known to undergo mutations in various types of
cancer. It is located on chromosome 10q23.3, coding for the protein
created from the 403 amino acid residue that acts as a phospholipid
phosphatase. PTEN inhibits signal transmission of the phosphatidyl
inositol (PI-3) kinase downstream. Due to mutation of the PTEN
gene, decreased PTEN function activates the P13K downstream signal
transmission system that subsequently affects cell functions, such
as proliferation, apoptosis and cell infiltration. This PTEN
protein loss was observed in 20.5–76.3% of the HER2-positive breast
cancer cases (6–10), demonstrating an existing
correlation between the treatment effect of T and the level of PTEN
protein expression (6,7). PIK3CA mutation is observed in
10.3–37.5% of the HER2-positive breast cancer cases (9–12).
Exons 9 (E542K, E545K) and 20 (H1047R) are the hot spots for
mutation (13,14), demonstrating that the effect of T
treatment was affected by these mutations (10). However, the effect of lapatinib
treatment has been proven not to be correlated with the p95HER2
expression levels or PTEN proteins, or the status of PIK3CA gene
mutation (8,11,12,15).
These biological features are worth examining in terms of their
treatment response to T or lapatinib.
The Kyushu Breast Cancer Study Group (KBC-SG) is
conducting a prospective clinical study to investigate the
correlation between the antitumor effect of lapatinib +
capecitabine concomitant treatment and the following biomarkers:
p95HER2 expression, PTEN loss and PIK3CA mutation in HER2-positive
breast cancer patients pre-treated with T. Prior to conducting a
prospective clinical study, the evaluation methods of these
biomarkers needed to be established by using stored tumor tissue
samples of HER2-positive breast cancer patients. The frequency of
p95HER2 expression, PTEN loss and PIK3CA mutation in relation to T
treatment are also of notable interest. The present study is a
feasibility study aiming to validate the applicability of our
technique in a prospective clinical study.
Despite the original plan, considering the results
of a VeraTag™ assay (16) the use
of immunohistochemistry for the p95HER2 protein test was deemed to
be unnecessary in this preliminary study.
Patients and methods
Patient characteristics
HER2-positive tumor samples were obtained from the
Kumamoto City Hospital (Kumamoto, China), the Hakuaikai Sagara
Hospital (Kagoshima, China) and the Kitakyushu Municipal Medical
Center (Kitakyushu, China). The present study was approved by the
corresponding Institutional Review Boards. The subjects were
patients with HER2-positive breast cancer, with documented
progression on at least one T-containing regimen in the metastatic
setting, meeting the following criteria: i) females diagnosed with
invasive breast cancer by histological examination; ii) patients
with overexpression of HER2, i.e. the staining score detected by
immunohistochemistry (IHC) being 3+, or HER2 gene amplification
being confirmed by fluorescence in situ hybridization
(FISH); iii) patients with a T treatment history and obtainable
detailed clinical data; iv) availability of formalin-fixed and
paraffin-embedded tissues of primary tumors and v) patients willing
to participate in this study.
Methods
To compare the biomarker results with response to T
treatment, PTEN loss and PIK3CA mutation were studied in 3 groups,
on the basis of treatment responses (17,18).
The patients were divided as follows: i) group A, responders to T
treatment [progression-free survival time (PFS) of at least 8
months] ≥10 patients; ii) group B, worsening in the early phase of
T treatment (PFS from 3 to 8 months of T treatment), with the
highest possible number of group B subjects being collected, 0–10
patients; iii) group C, non-responders to T treatment (PFS <3
months of T treatment or relapse during adjuvant T treatment), ≥10
patients.
The following indices were investigated in this
study: i) methods to evaluate PTEN expression, ii) frequency of
PTEN loss and PIK3CA mutation with regard to response to T
treatment.
Evaluation methods of PTEN
The immunohistochemical staining for PTEN protein in
tumor cells was evaluated using anti-human PTEN mouse monoclonal
antibodies (clone 6H2.1, M3627; Dako, Copenhagen, Denmark), while
the EnVision™ FLEX+ kit mouse linker (Dako) was used to detect the
protein, due to the weak PTEN protein expression level in the
standard expression system. Normal breast epithelium or vascular
endothelium known to express normal PTEN was used as the positive
control. The staining conditions, such as the dilution factor, as
well as the pre-treatment conditions were examined according to the
manufacturer’s instructions. The three pathologists evaluated the
PTEN expression independently. The H score was used to evaluate and
score the expression levels (19).
The staining intensity (0–3) was evaluated using the semantic
anchors: negative (0), weak (1+), moderate (2+) and strong (3+). To
obtain percentages the area occupying the positive cells over the
cells was estimated.
Investigation of PIK3CA mutation
DNA was extracted from formalin-fixed and
paraffin-embedded blocks. Analysis of the mutations of the PIK3CA
gene was performed using the direct sequence method. As previously
mentioned, the base sequences in exons 9 and 20, which are the
hot-spots of the PIK3CA gene mutation (13), were decoded and evaluated.
Statistical analysis
Statistical comparisons between groups were
conducted using the Chi-square and Fisher’s exact tests. The
Wilcoxon’s (non-parametric) test was used to compare the mean
values for age, and the signal ratio of HER2-FISH, disease-free
survival (DFI) and PFS. A two-sided P<0.05 was considered to
indicate a statistically significant difference.
Results
Background characteristics of
patients
The number of patients was as follows: group A, 15;
group B, 7 and group C, 11. The background characteristics of these
patients are presented in Table I.
The median age at registration was 60 years for groups A and B, and
47 years for group C, suggesting a significant age difference. No
difference was detected, however, in the 3 groups regarding tumor
diameter, lymph-node metastasis, stage, DFI, type of surgery, HER2
status by IHC, signal count by FISH and the T treatment period.
Significant differences were detected between groups A and C and
groups B and C regarding the PFS of the T treatment. In the ER,
81.8% of the patients in group C were negative, although there was
no significant difference.
 | Table IBackground patient
characteristics. |
Table I
Background patient
characteristics.
| Characteristics | Group A | Group B | Group C | P-value |
|---|
| No. of cases | 15 | 7 | 11 | |
| Age at registration
(years) | | | | |
| Median | 60.5 | 60.0 | 47.0 | 0.03 |
| Mean | 58.3 | 60.1 | 49.7 | |
| Tumor size (primary
tumor) (cm) | | | | |
| ≤5.0 | 11 (73.3) | 7 (100) | 8 (72.7) | 0.31 |
| >5.0 | 2 | 0 | 3 | |
| Unknown | 2 | 0 | 0 | |
| Nodal status (primary
tumor) | | | | |
| N0 | 4 (26.7) | 1 (14.3) | 2 (18.2) | 0.79 |
| N1 | 6 | 5 | 6 | |
| N2,3 | 2 | 1 | 3 | |
| Unknown | 3 | 0 | 0 | |
| Distant metastasis
(at primary surgery) | | | | |
| Without | 11 | 7 | 9 | 0.32 |
| With | 4 | 0 | 2 | |
| No. of involved nodes
(primary surgery) | | | | |
| 0 | 4 (26.7) | 1 (14.3) | 2 (18.2) | 0.35 |
| 1–3 | 5 | 1 | 4 | |
| ≥4 | 3 | 5 | 3 | |
| Unknown | 3 | 0 | 2 | |
| Stage classification
(at primary surgery) | | | | |
| I | 2 | 0 | 0 | 0.52 |
| II | 8 | 6 | 7 | |
| III | 1 | 1 | 2 | |
| IV | 3 | 0 | 2 | |
| Unknown | 1 | 0 | 0 | |
| Histological
type | | | | |
| Invasive ductal
carcinoma | 14 | 7 | 9 | 0.99 |
| Others | 1 | 0 | 2 | |
| Estrogen
receptor | | | | |
| + | 8 (53.3) | 5 (71.4) | 2 (18.2) | 0.06 |
| − | 7 | 2 | 9 | |
| Progesterone
receptor | | | | |
| + | 5 (33.3) | 1 (14.3) | 2 (18.2) | 0.53 |
| − | 10 | 6 | 9 | |
| HER2 | | | | |
| 1+,2+ | 1 | 1 | 2 | 0.66 |
| 3+ | 14 | 6 | 9 | |
| HER2-FISH | | | | |
| Median | 5.2 | 8.6 | 4.6 | 0.34 |
| Mean | 5.6 | 6.7 | 4.8 | |
| Progression-free
survival (days) | | | | |
| Median | 657 | 178 | 60 | <0.0001 |
| Mean | 1151.8 | 174.4 | 103.3 | |
| Disease-free
interval (days) | | | | |
| Median | 409 | 491 | 337 | 0.21 |
| Mean | 580.9 | 757.4 | 327.7 | |
| Operation performed
for primary tumor | | | | |
| Yes | 14 | 7 | 9 | 0.39 |
| No
(advanced) | 1 | 0 | 2 | |
| Dominant site of
recurrence | | | | |
| Lymph node | 4 | 2 | 3 | 0.72 |
| Bone | 4 | 2 | 1 | |
| Lung | 3 | 0 | 2 | |
| Liver | 1 | 1 | 3 | |
| Chest wall | 2 | 2 | 1 | |
| Locally
advanced | 1 | 0 | 2 | |
| Other | 2 | 0 | 2 | |
| Timing of
trastuzumab treatment | | | | |
| Adjuvant
setting | 2 | 1 | 3 | 0.59 |
| 1st or 2nd line
after recurrence | 12 | 6 | 7 | |
| 3rd line or
later | 1 | 1 | 1 | |
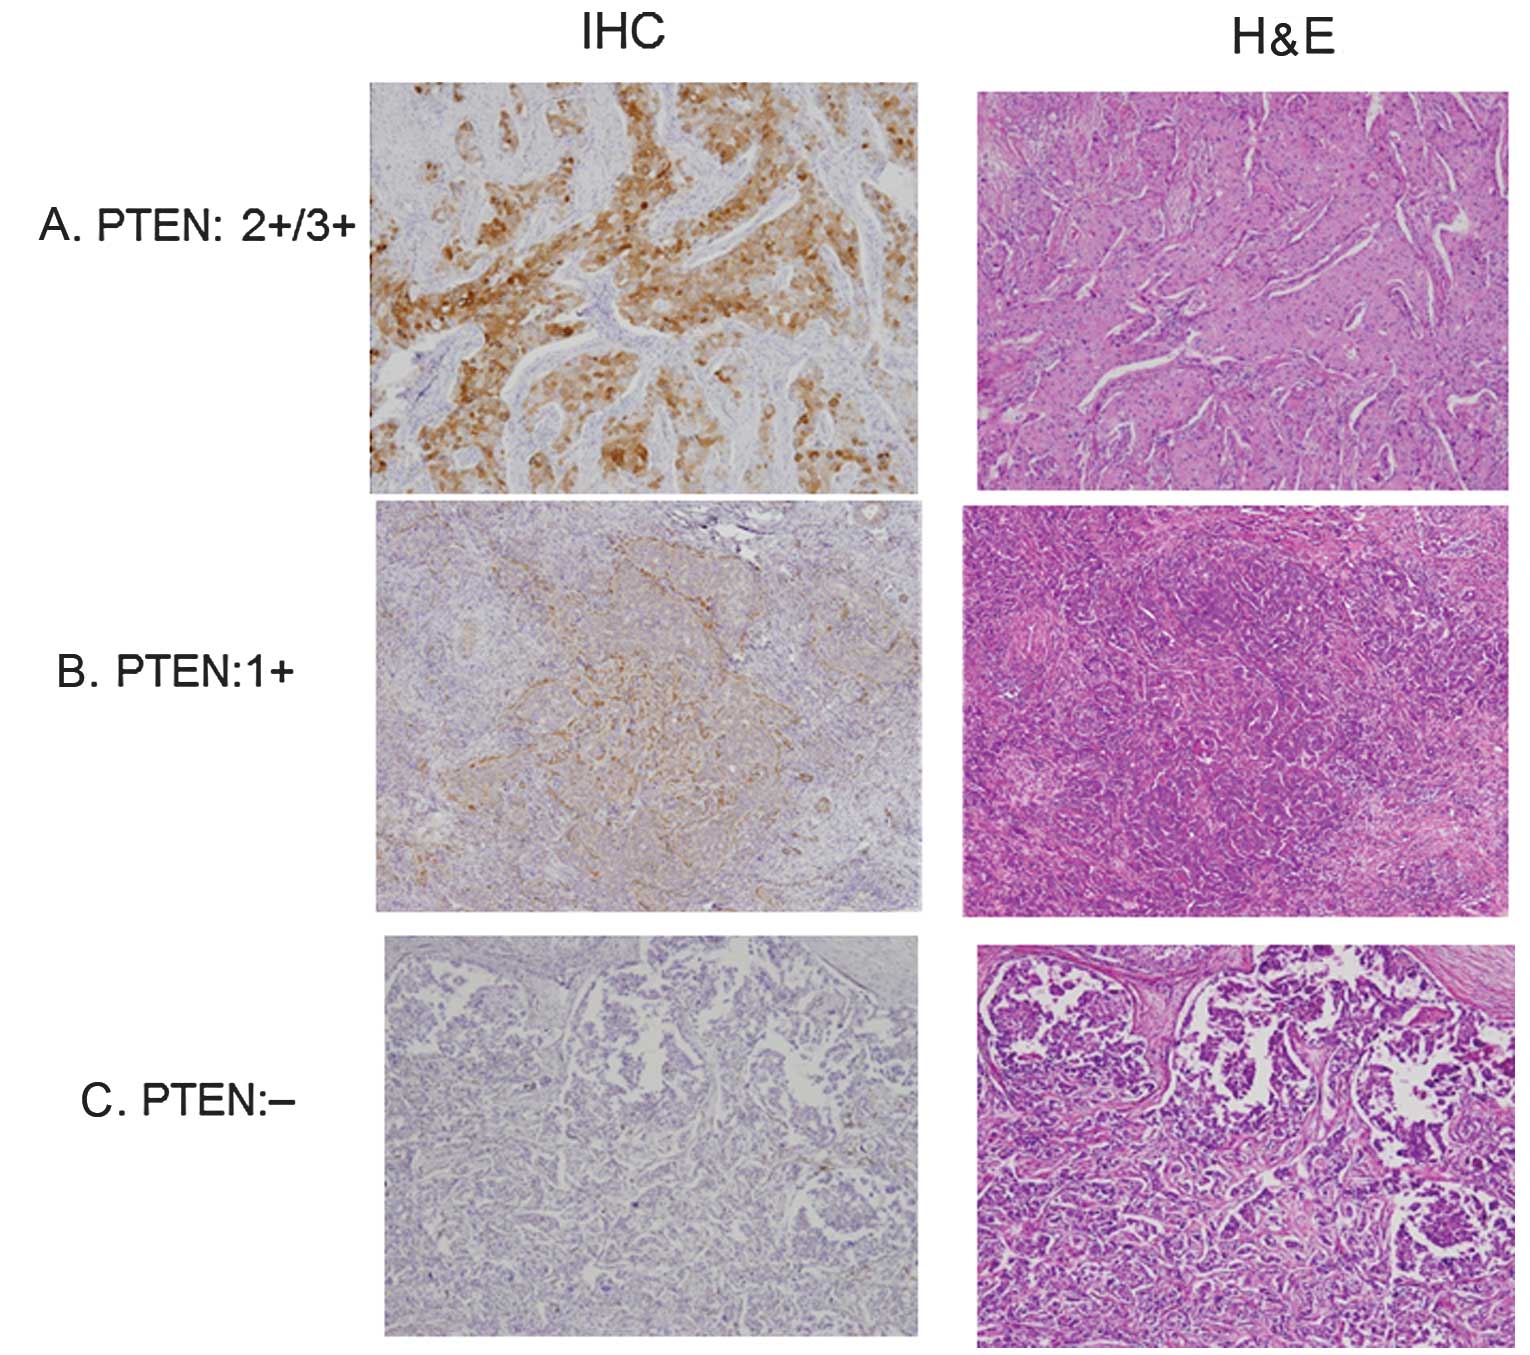
Evaluation of IHC for PTEN
Fig. 1 shows the
immunostaining patterns of PTEN. The cases shown are 3+/2+, 1+ and
negative. As shown in Fig. 2 and
Table II, the immunostaining was
evaluated as SI x PP using the H score. The H score was widely
distributed ranging from 0 to 200. The median values were 110, 90
and 50 in groups A, B and C, respectively. Two patients in group C
had a score of 0. As shown in Table
II, a decreased expression (score, <100) was observed in
17/33 (51.5%) of the cases, when the patients were divided into 2
groups based on a H score of 100. In group A, the percentage of
patients with a score of ≥100 was 66.7%, while in group C it was as
low as 27.3%. Although no statistically significant difference was
detected, the number of patients with a decreased expression was
high in group C. Consequently, PTEN immunostaining was assessed as
described above, and was considered to have the potential to be
used in the prospective study.
| Table IIImmunohistochemistry for PTEN and the
treatment efficacy of trastuzumab. |
Table II
Immunohistochemistry for PTEN and the
treatment efficacy of trastuzumab.
| H score | Group A | Group B | Group C | P-value |
|---|
| ≥100 | 10 (66.7) | 3 (42.9) | 3 (27.3) | 0.13 |
| <100 | 5 | 4 | 8 | |
PIK3CA mutation
Table III shows the
distribution of cases based on PIK3CA mutation. PIK3CA mutations
were observed in 8/33 (24.2%), when mutations at exons 9 and 20
were combined. However, no clear correlation between the patient
groups was observed in the distribution of patients based on the
mutation.
| Table IIIPIK3CA mutation and the treatment
efficacy of trastuzumab. |
Table III
PIK3CA mutation and the treatment
efficacy of trastuzumab.
| PIK3CA
mutation | Group A | Group B | Group C | P-value |
|---|
| Exon 9 | 2 | 0 | 1 | |
| Exon 20 | 3 | 0 | 2 | |
| Total | 5 (33.3%) | 0 | 3 (27.3%) | 0.23 |
Discussion
This retrospective study was conducted in
preparation of a prospective study, aiming to investigate the
correlation between the PFS of concomitant lapatinib/capecitabine
therapy and the p95HER2 and PTEN protein expression levels, as well
as the status of PIK3CA mutation in HER2-positive breast cancer
patients.
To evaluate PTEN immunostaining, the H score was
employed. According to available studies, evaluation of PTEN
immunostaining by immunoreactive score (IRS) is common. Staining
intensity (0–3) is evaluated on a 4-level scale. Percentage of
positive cells (0–4) is evaluated on a 5-level scale of 0 (<1%),
1 (1–10%), 2 (11–50%), 3 (51–80%) and 4 (>80% positive cells),
based on the percentages of the positive cells. The entities use
multiplied values (from 0 to 12 points). However, there are
differences in the cut-off points, ranging from 3 to 8 points. The
incidence of cases with decreased expressions also range from 19.1
to 51.8%, showing a notable gap. In this study, the percentage of
cases with a decreased expression was 51.5%. However, the patients
in this study were recruited according to the extent of response to
T, therefore additional investigation, intended to be carried out
in the prospective study, is required.
With regard to P13KCA mutation, exon 9 or 20
mutation was found in 8/33 (24.2%). Hennessy et al (20) reported the correlation between the
frequency and breast cancer subtypes, while the mutation frequency
was 9/19 (47.4%) in metaplastic breast cancer patients, 232/880
(34.5%; P=0.32) in hormone receptor-positive patients, 17/75
(22.7%; P=0.04) in HER2-positive patients, 20/240 (8.3%;
P<0.0001) in basal-like patients and 0/14 (P=0.004) in
claudin-low patients. According to the literature (9–12,20),
there was a clear correlation between PIK3CA mutation and the
efficacy of T treatment. It was also reported (21) that T resulted in tumor regression
subsequent to apoptosis induction, while not showing a significant
change in cell proliferation, as measured by Ki-67. However, with
lapatinib, both Ki-67 and p-MAPK levels showed a significant
decrease during treatment. Thus, T seems to affect cell survival,
while having a smaller effect on cell cycle kinetics, whereas
lapatinib seems to affect cell cycle kinetics via RAS/MAPK, while
having a smaller effect on cell survival (21). The present study, however, showed
no clear correlation between this mutagenicity and the effects of
T. Additional investigation in a prospective study is required
regarding the correlation between this mutation and the anti-HER2
treatment effect.
With regard to p95HER2, an assay method for HER2 has
been developed (22). This method
uses two types of antibodies that bind to HER2. One of the
antibodies binds by a fluorochrome linker, while the other is
labeled by a chemical substance that generates a peroxidative
enzyme when it is exposed to light and breaks the linker. When the
two types of antibodies bind to HER2 on the cell surface, free
fluorochrome is measured by capillary electrophoresis enabling the
assay of the receptors. This process is termed VeraTag™ assay. This
assay was also applied to p95HER2 (16). This method is now used in our
ongoing prospective study. There were studies on IHC for p95HER2
that were presented at the annual meeting of the American Society
of Clinical Oncology held in 2011. Although p95HER2 was suggested
to be a marker of resistance to T, in the neoadjuvant study by
Loibl et al (23), there
was a significantly higher rate of pathological complete response
(pCR) by T treatment in cases that expressed p95HER2. In this
study, the 611CTF monoclonal antibody (bioMérieux, Inc.) was used.
Furthermore, even in the CHER-LOB trial (24), there was no clear correlation with
the T and lapatinib treatments.
Looking at the p95HER2-positive rates in these
studies, the values were 74% in the GeparQuattro study (23), 30.7% in the CHER-LOB study
(24) and 27.5% in the VeraTag™
assay (25). Although a difference
was found between the early breast cancer and recurrent patients
regarding the p95HER2 assessment, there was no constant trend, and
there are a number of questions that remain to be solved. From
these findings, the VeraTag™ method was set to be used to assess
p95HER2 in our prospective study.
The immunostaining and assessment methods for PTEN
expression were validated by the present study, and there was some
correlation with the efficacy of the T treatment. However, for the
PIK3CA mutation, there was no correlation with the T treatment
results. This potential correlation is likely to be confirmed in
the planned large-scale study, while the association of PIK3CA
mutation and p95HER2 expression with poor response to T should also
be examined.
Acknowledgements
The authors would like to thank the
staff at the Department of Pathology in the Kumamoto City Hospital
and the Division of Medical Oncology, Hematology and Infectious
Diseases, of the Department of Medicine at the Fukuoka University,
for their technical and secretarial assistance.
References
|
1.
|
Harries M and Smith I: The development and
clinical use of trastuzumab (Herceptin). Endocr Relat Cancer.
9:75–85. 2002.
|
|
2.
|
Sáez R, Molina MA, Ramsey EE, et al:
p95HER2 predicts worse outcome in patients with HER2-positive
breast cancer. Clin Cancer Res. 12:424–431. 2006.
|
|
3.
|
Molina MA, Sáez R, Ramsey EE, et al:
NH2-terminal truncated HER2 protein but not full-length receptor is
associated with nodal metastasis in human breast cancer. Clin
Cancer Res. 8:347–353. 2002.
|
|
4.
|
Christianson TA, Doherty JK, Lin YJ, et
al: NH2-terminally truncatedHER2/neu protein: relationship with
shedding of the extracellular domain and with prognostic factors in
breast cancer. Cancer Res. 58:5123–5129. 1998.
|
|
5.
|
Nahta R and Esteva FJ: HER2 therapy:
molecular mechanisms of trastuzumab resistance. Breast Cancer Res.
8:215–222. 2006.
|
|
6.
|
Fujita T, Doihara H, Kawasaki K, et al:
PTEN activity could be a predictive marker of trastuzumab efficacy
in the treatment of ErbB2-overexpressing breast cancer open. Br J
Cancer. 94:247–252. 2006.
|
|
7.
|
Nagata Y, Lan KH, Zhou X, et al: PTEN
activation contributes to tumor inhibition by trastuzumab, and loss
of PTEN predicts trastuzumab resistance in patients. Cancer Cell.
6:117–127. 2004.
|
|
8.
|
Xia W, Husain I, Liu L, et al: Lapatinib
antitumor activity is not dependent upon phosphatase and tensin
homologue deleted on chromosome 10 in ErbB2-overexpressing breast
cancers. Cancer Res. 67:1170–1175. 2007.
|
|
9.
|
Pérez-Tenorio G, Alkhori L, Olsson B, et
al: PIK3CA mutations and PTEN loss correlate with similar
prognostic factors and are not mutually exclusive in breast cancer.
Clin Cancer Res. 13:3577–3584. 2007.
|
|
10.
|
Berns K, Horlings HM, Hennessy BT, et al:
A functional genetic approach identifies the PI3K pathway as a
major determinant of trastuzumab resistance in breast cancer.
Cancer Cell. 12:395–402. 2007.
|
|
11.
|
Toi M, Iwata H, Fujiwara Y, et al:
Lapatinib monotherapy in patients with relapsed, advanced, or
metastatic breast cancer: efficacy, safety, and biomarker results
from Japanese patients phase II studies. Br J Cancer.
101:1676–1682. 2009.
|
|
12.
|
Xu BH, Jiang ZF, Chua D, et al: Lapatinib
plus capecitabine in treating HER2-positive advanced breast cancer:
efficacy, safety, and biomarker results from Chinese patients. Chin
J Cancer. 30:327–335. 2011.
|
|
13.
|
Maruyama N, Miyoshi Y, Taguchi T, Tamaki
Y, Monden M and Noguchi S: Clinicopathologic analysis of breast
cancers with PIK3CA mutations in Japanese women. Clin Cancer Res.
13:408–414. 2007.
|
|
14.
|
Saal LH, Holm K, Maurer M, et al: PIK3CA
mutations correlate with hormone receptors, node metastasis, and
ERBB2, and are mutually exclusive with PTEN loss in human breast
carcinoma. Cancer Res. 65:2554–2559. 2005.
|
|
15.
|
Scaltriti M, Rojo F, Ocaña A, et al:
Expression of p95HER2, a truncated form of the HER2 receptor, and
response to anti-HER2 therapies in breast cancer. J Natl Cancer
Inst. 99:628–638. 2007.
|
|
16.
|
Sperinde J, Jin X, Banerjee J, et al:
Quantitation of p95HER2 in paraffin sections by using a
p95HER2-specific antibody and correlation with outcome in a cohort
of trastuzumab-treated breast cancer patients. Clin Cancer Res.
16:42262010.
|
|
17.
|
Hayashi M, Okumura Y, Osako T, Toyozumi Y,
Arima N, Iwase H and Nishimura R: Time to first tumor progression
as a predictor of efficacy of continued treatment with trastuzumab
beyond progression in human epidermal growth factor
receptor2-positive metastatic breast cancer. Int J Clin Oncol.
16:694–700. 2011.
|
|
18.
|
Metro G, Giannarelli D, Gemma D, et al:
Time to first tumor progression as outcome predictor of a second
trasuzumab-based therapy beyond progression in HER-2 metastatic
breast cancer. Breast J. 16:66–72. 2010.
|
|
19.
|
Shousha S: Oestrogen receptor status of
breast carcinoma: Allred/H score conversion table. Histopathology.
53:346–347. 2008.
|
|
20.
|
Hennessy BT, Gonzalez-Angulo AM,
Stemke-Hale K, et al: Characterization of a naturally occurring
breast cancer subset enriched in epithelial-to-mesenchymal
transition and stem cell characteristics. Cancer Res. 69:4116–4124.
2009.
|
|
21.
|
Dave B, Migliaccio I, Gutierrez MC, et al:
Loss of phosphatase and tensin homolog or phosphoinositol-3 kinase
activation and response to trastuzumab or lapatinib in human
epidermal growth factor receptor 2-overexpressing locally advanced
breast cancers. J Clin Oncol. 29:166–173. 2010.
|
|
22.
|
Yining S, Weidong H, Yuping T, et al: A
novel proximity assay for the detection of proteins and protein
complexes: quantitation of HER1 and HER2 total protein expression
and homodimerization in formalin-fixed, paraffin-embedded cell
lines and breast cancer tissue. Diagnostic Molecular Pathology.
18:11–21. 2009.
|
|
23.
|
Loibl S, Bruey J, Von Minckwitz G, et al:
Validation of p95HER2 as a predictive marker for trastuzumab-based
therapy in primary HER2-positive breast cancer: a translational
investigation from the neoadjuvant GeparQuattro study. J Clin
Oncol. 29:5302011.
|
|
24.
|
Guarneri V, Frassoldati A, Bottini A, et
al: Final results of a phase II randomized trial of neoadjuvant
anthracycline-taxane chemo-therapy plus lapatinib, trastuzumab, or
both in HER2-positive breast cancer (CHER-LOB trial). J Clin Oncol.
29:5072011.
|
|
25.
|
Biernat W, Duchnowska R, Szostakiewicz B,
et al: Quantitative measurements of p95HER2 (p95HER2) and total
HER2 (H2T) protein expression in patients with trastuzumab-treated,
metastatic breast cancer (MBC): Independent confirmation of
clinical cutoffs. J Clin Oncol. 29:5862011.
|