Identification of immature granulocytes in cancer chemotherapy patients by cell counting vs. microscopic examination of blood smears
- Authors:
- Published online on: January 14, 2014 https://doi.org/10.3892/mco.2014.243
- Pages: 207-211
Metrics: Total
Views: 0 (Spandidos Publications: | PMC Statistics: )
Total PDF Downloads: 0 (Spandidos Publications: | PMC Statistics: )
Abstract
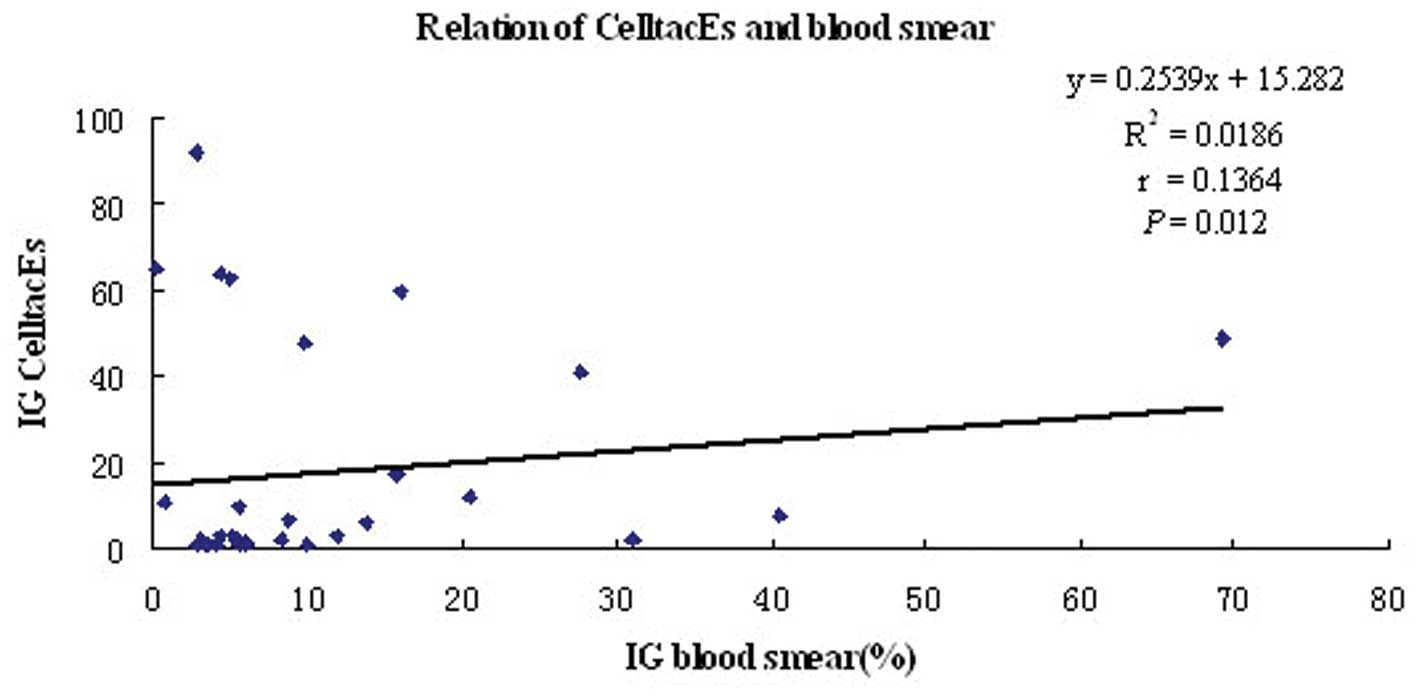
Tumor cell formation occurs through various mechanisms that may result in the growth of tumor blood vessels. Thus, novel methods are required to provide tumor therapy. The aim of the present study was to investigate the reliability of the abnormality‑indicating alarm information provided by the automatic hematology analyzer in the measurement of immature granulocytes (IG) and assess the factors involved. The quality control groups at three concentration levels were repeatedly determined within 20 days to observe the within‑run precision. The quality control groups at two concentration levels were repeatedly determined within 20 days to observe the between‑run precision. The results obtained by the two methods were compared and the reliability of IG measurement using the hematology analyzer was analyzed. Additionally, IG parameters of 120 venous blood specimens collected from cancer patients were measured by cell counting using a hematology analyzer and stained blood smears were observed. The within‑run precision experiment showed that the coefficient of variation (CV) values of the IG percentage in the high, middle and low concentration levels were 3.62, 6.75 and 13.69%, respectively, while the CV values of the IG percentage in the two‑level between‑run precision experiment were 5.6 and 7.1%, respectively. All of the CV values were <15% and within the permitted range. The true‑positive rates obtained using the hematology analyzer in the IG≤1%, 110% groups were 11.5, 65.4 and 95.0%, respectively, and the false‑negative rates were 0. The IG percentages obtained through the hematology analyzer measurement and from the microscopic observation were (6.98±11.18) and (9.36±20.71)%, respectively. Results of the correlation analysis revelaed that there was an excellent correlation between the two methods (r=0.1364). A significant difference between the two methods was observed using the signed‑rank test (P=0.001). Manual microscopic observation is essential for the IG specimen that has been measured using an automatic hematology analyzer and has received an abnormality alarm. For cancer patients who receive chemotherapy, this application helps to provide laboratory data for clinical disease diagnosis and treatment monitoring.