Introduction
Bladder cancer (BLCA) accounts for over 550,000 new
cases annually, ranking as the most common urinary malignancy
(1). The primary treatment for
BLCA involves radical cystectomy, combined with adjuvant
cisplatin-based chemotherapy (2).
Despite aggressive interventions including radiotherapy, surgery
and chemotherapy, a considerable number of individuals experience
recurrence or metastasis, resulting in poor 5-year survival
outcomes (3). Therefore, there is
a critical need for novel predictive biomarkers to improve
prognostic accuracy and guide the management of patients with
BLCA.
Disulfidptosis, a newly identified form of regulated
cell death, was first described by the laboratory of BY Gan in
2023(4). Distinct from apoptosis,
autophagy, ferroptosis and cuproptosis, disulfidptosis occurs in
glucose-starved tumor cells. In this process, overexpression of
SLC7A11 leads to significant depletion of nicotinamide adenine
dinucleotide phosphate (NADPH), which subsequently triggers the
abnormal accumulation of disulfide bonds (4). This accumulation disrupts the normal
interactions between cytoskeletal proteins, causing conformational
changes that ultimately result in rapid tumor cell death (5). Consequently, modulating cancer cell
susceptibility to disulfidptosis may represent a promising
therapeutic strategy.
lncRNAs are RNA transcripts >200 nucleotides that
do not encode proteins (6). These
molecules are involved in a wide range of regulatory functions,
including the modulation of genome activity, protein modification
and post-transcriptional regulation (7). lncRNAs play crucial roles in various
cellular processes, such as gene expression control, chromatin
remodeling, and cellular stress responses (8). In recent years, lncRNA-based
signatures have gained significant attention for their prognostic
potential in various cancers, including colorectal cancer (CRC)
(9), nasopharyngeal carcinoma
(10), and hepatocellular
carcinoma (11). These signatures
have shown promise in predicting disease outcomes and guiding
treatment decisions. However, the development of prognostic
signatures based on DRlncRNAs for BLCA remains limited. Given the
emerging role of disulfidptosis in tumor cell death, exploring the
relationship between DRlncRNAs and BLCA prognosis could offer new
insights into therapeutic strategies.
As a result, a prognostic risk signature was
developed and validated based on DRlncRNAs to forecast survival
outcomes in patients with BLCA and the clinical applicability of
this signature was explored.
Materials and methods
Gathering and processing data
The mRNA and lncRNA sequencing data of 394 BLCA
samples and 19 controls were obtained from The Cancer Genome Atlas
(TCGA) database (https://portal.gdc.cancer.gov/). TCGA database was
queried up to 24 January, 2024, to retrieve transcriptomic and
clinical data (12). The dataset
encompassed 413 patients with BLCA, including 394 tumor samples and
19 normal samples. For diverse data analyses, transcriptomic data
in HTSeq-Counts and HTSeq-TPM formats were specifically chosen.
Samples with incomplete clinical records or overall survival (OS)
of <30 days were excluded.
Identification of DRlncRNAs essential
for signature
Recent literature has identified several
disulfidptosis-related genes (DRGs), including SLC7A11, SLC3A2,
SLC2A1, NCKAP1, WASF2 and RAC1(4).
A protein-protein interaction network for the six DRGs was
constructed using the Search Tool for the Retrieval of Interacting
Genes/Proteins (STRING) database (https://cn.string-db.org/). Utilizing Pearson
correlation analysis of these DRGs, a screening for DRlncRNAs (|R|
>0.3, P<0.001) was conducted. Then ‘DESeq2’ package was
performed for differential analysis (P<0.05, |log2-fold change|
>1) (13).
Using a 7:3 ratio, the 364 BLCA samples were divided
into training and testing cohorts. Initially, DRlncRNAs were
selected through univariate Cox analysis of the training group
(P<0.01). The selection was then refined using the least
absolute shrinkage and selection operator (LASSO) algorithm to
prevent overfitting of this signature. In the end, 8 DRlncRNAs were
selected.
BLCA prognostic risk signature
The predictive risk score for each patient with BLCA
was calculated using the following formula: Predicted risk
score=Σ[(coefficient of lncRNAn) x (expression of lncRNAn)].
Subsequently, patients were stratified into two cohorts based on
the median risk score derived from the prognostic signature:
High-risk and low-risk groups. To investigate OS differences
between these groups in each study cohort, the ‘survival’ and
‘survminer’ software tools were employed to construct Kaplan-Meier
(K-M) curves. The ‘timeROC’ package was employed to calculate the
area under the receiver operating characteristic (ROC) curves (AUC)
to assess predictive accuracy. Additionally, principal component
analysis (PCA) was conducted to assess the separation of risk
groups (14). Variables that
independently impact BLCA survival were identified through
univariate and multivariate regression analyses. Finally, K-M
survival curves were generated for subgroups with distinct clinical
characteristics, providing a comprehensive assessment of the
prognostic signature's clinical applicability.
BLCA prediction nomogram
Utilizing the ‘RMS’ package, a prognostic nomogram
was constructed for predicting the OS of individual patients with
BLCA. This comprehensive model integrates both the risk score and
relevant clinical data (15). To
validate its precision, ROC curves were employed and Decision Curve
Analysis (DCA) was conducted. Furthermore, the nomogram's
performance was visually evaluated by plotting calibration
curves.
Enrichment analysis
Differentially expressed DRGs and their enrichment
in biological signaling pathways were identified through Kyoto
Encyclopedia of Genes and Genomes (KEGG) analysis. Subsequently,
the Gene Set Enrichment Analysis (GSEA) software (version 3.0;
Broad Institute website (https://www.gsea-msigdb.org/)) was leveraged to
scrutinize GOBP, KEGG and WIKIPATHWAYS gene sets (16). GSEA was conducted on
risk-stratified gene expression profiles, utilizing 1,000
resamples, an upper limit of 5,000 genes, and a lower limit of 5.
The significance thresholds were set at q-values <0.25 and
P-values <0.05.
Tumor mutation burden (TMB)
analysis
The ‘TCGAbiolinks’ package was utilized to aggregate
somatic mutation data profiles in the format of mutation
annotation. Subsequently, a comparative analysis of mutation
profiles and TMB scores was conducted between the high- and
low-risk groups, using the ‘maftools’ program (17).
Tumor microenvironment (TME)
analysis
The ‘ESTIMATE’ software was utilized to analyze
microenvironmental differences between the two subgroups.
Additionally, seven algorithms (XCELL, CIBERSORT-ABS, TIMER, EPIC,
QUANTISEQ, MCPCOUNTER and CIBERSORT) were used to investigate the
correlation between risk scores and infiltrating immune cells
(18). To evaluate infiltration
scores in the BLCA microenvironment, the ‘GSVA’ tool was applied
for single-sample GSEA (ssGSEA).
Disulfidptosis-related signature in
immunotherapy and chemotherapy
The tumor immune dysfunction and exclusion (TIDE)
platform was utilized to predict the response to immunotherapy in
BLCA (19). Furthermore, the
‘oncoPredict’ package was harnessed to assess the IC50
of widely used chemotherapeutic agents and compare their
sensitivity across different risk cohorts (20).
Reverse transcription-quantitative PCR
(RT-qPCR) verification of lncRNAs in signature
The BLCA cell lines (T24 and 5637) (IMMOCELL;
(http://www.immocell.com/), where T24 is generally
considered to have a higher malignancy level compared with 5637,
and the SV-HUC-1 cell line, derived from human normal bladder
epithelial cells, were cultivated in a controlled incubator at 37˚C
with 5% CO2, using RPMI-1640 medium (Thermo Fisher
Scientific, Inc.). Total RNA was extracted from each sample using
TRIzol® reagent (Invitrogen; Thermo Fisher Scientific
Inc.). cDNA was reverse-transcribed from the isolated RNA using the
PrimeScript RT Reagent Kit (Takara Bio, Inc.), following the
manufacturer's protocol. And the SYBR Green premixed qPCR kit
(Hunan Accurate Bio-Medical Co., Ltd.) was used in a Roche
LightCycler 480 II [Roche Diagnostics (Shanghai) Co., Ltd.].
Subsequently, RT-qPCR was performed. The thermocycling conditions
were as follows: initial denaturation at 95˚C for 5 min, followed
by 40 amplification cycles consisting of denaturation at 95˚C for
15 sec, annealing at 60˚C for 20 sec, and extension at 72˚C for 30
sec. A final extension step was performed at 72˚C for 5 min. The
forward primer sequence for the reference gene GAPDH is
5'-GGAAGCTTGTCATCAATGGAAATC-3', and the reverse primer sequence is
5'-TGATGACCCTTTTGGCTCCC-3'. The relative expression of lncRNAs was
quantified as a 2-ΔΔCq value after assessing gene
expression levels via RT-qPCR (21). Experiments were conducted in
triplicate, with primer details provided in Table SI. Furthermore, the protein
expression profiles of the identified DRGs were examined and
compared between normal and BLCA tissues using the Human Protein
Atlas (HPA) database (https://www.proteinatlas.org/).
Statistical analysis
Expression levels of DRlncRNAs in cell lines were
detected using RT-qPCR. Statistical significance was determined by
unpaired Student's t-test and one-way analysis of variance (ANOVA)
to compare the expression levels between different cell lines.
Should the ANOVA indicate a significant difference among the
groups, the comparison between two groups was conducted using LSD
method as the post hoc test. Data are presented as the mean ±
standard deviation (SD) from at least three independent
experiments. All statistical analyses were conducted using SPSS
version 26.0 (IBM Corp.) and RStudio version 4.2.1 [PBC (http://www.rstudio.com/)]. P<0.05 was considered to
indicate a statistically significant difference.
Results
Identification of DRlncRNAs in
patients with BLCA
The schematic diagram representing the study is
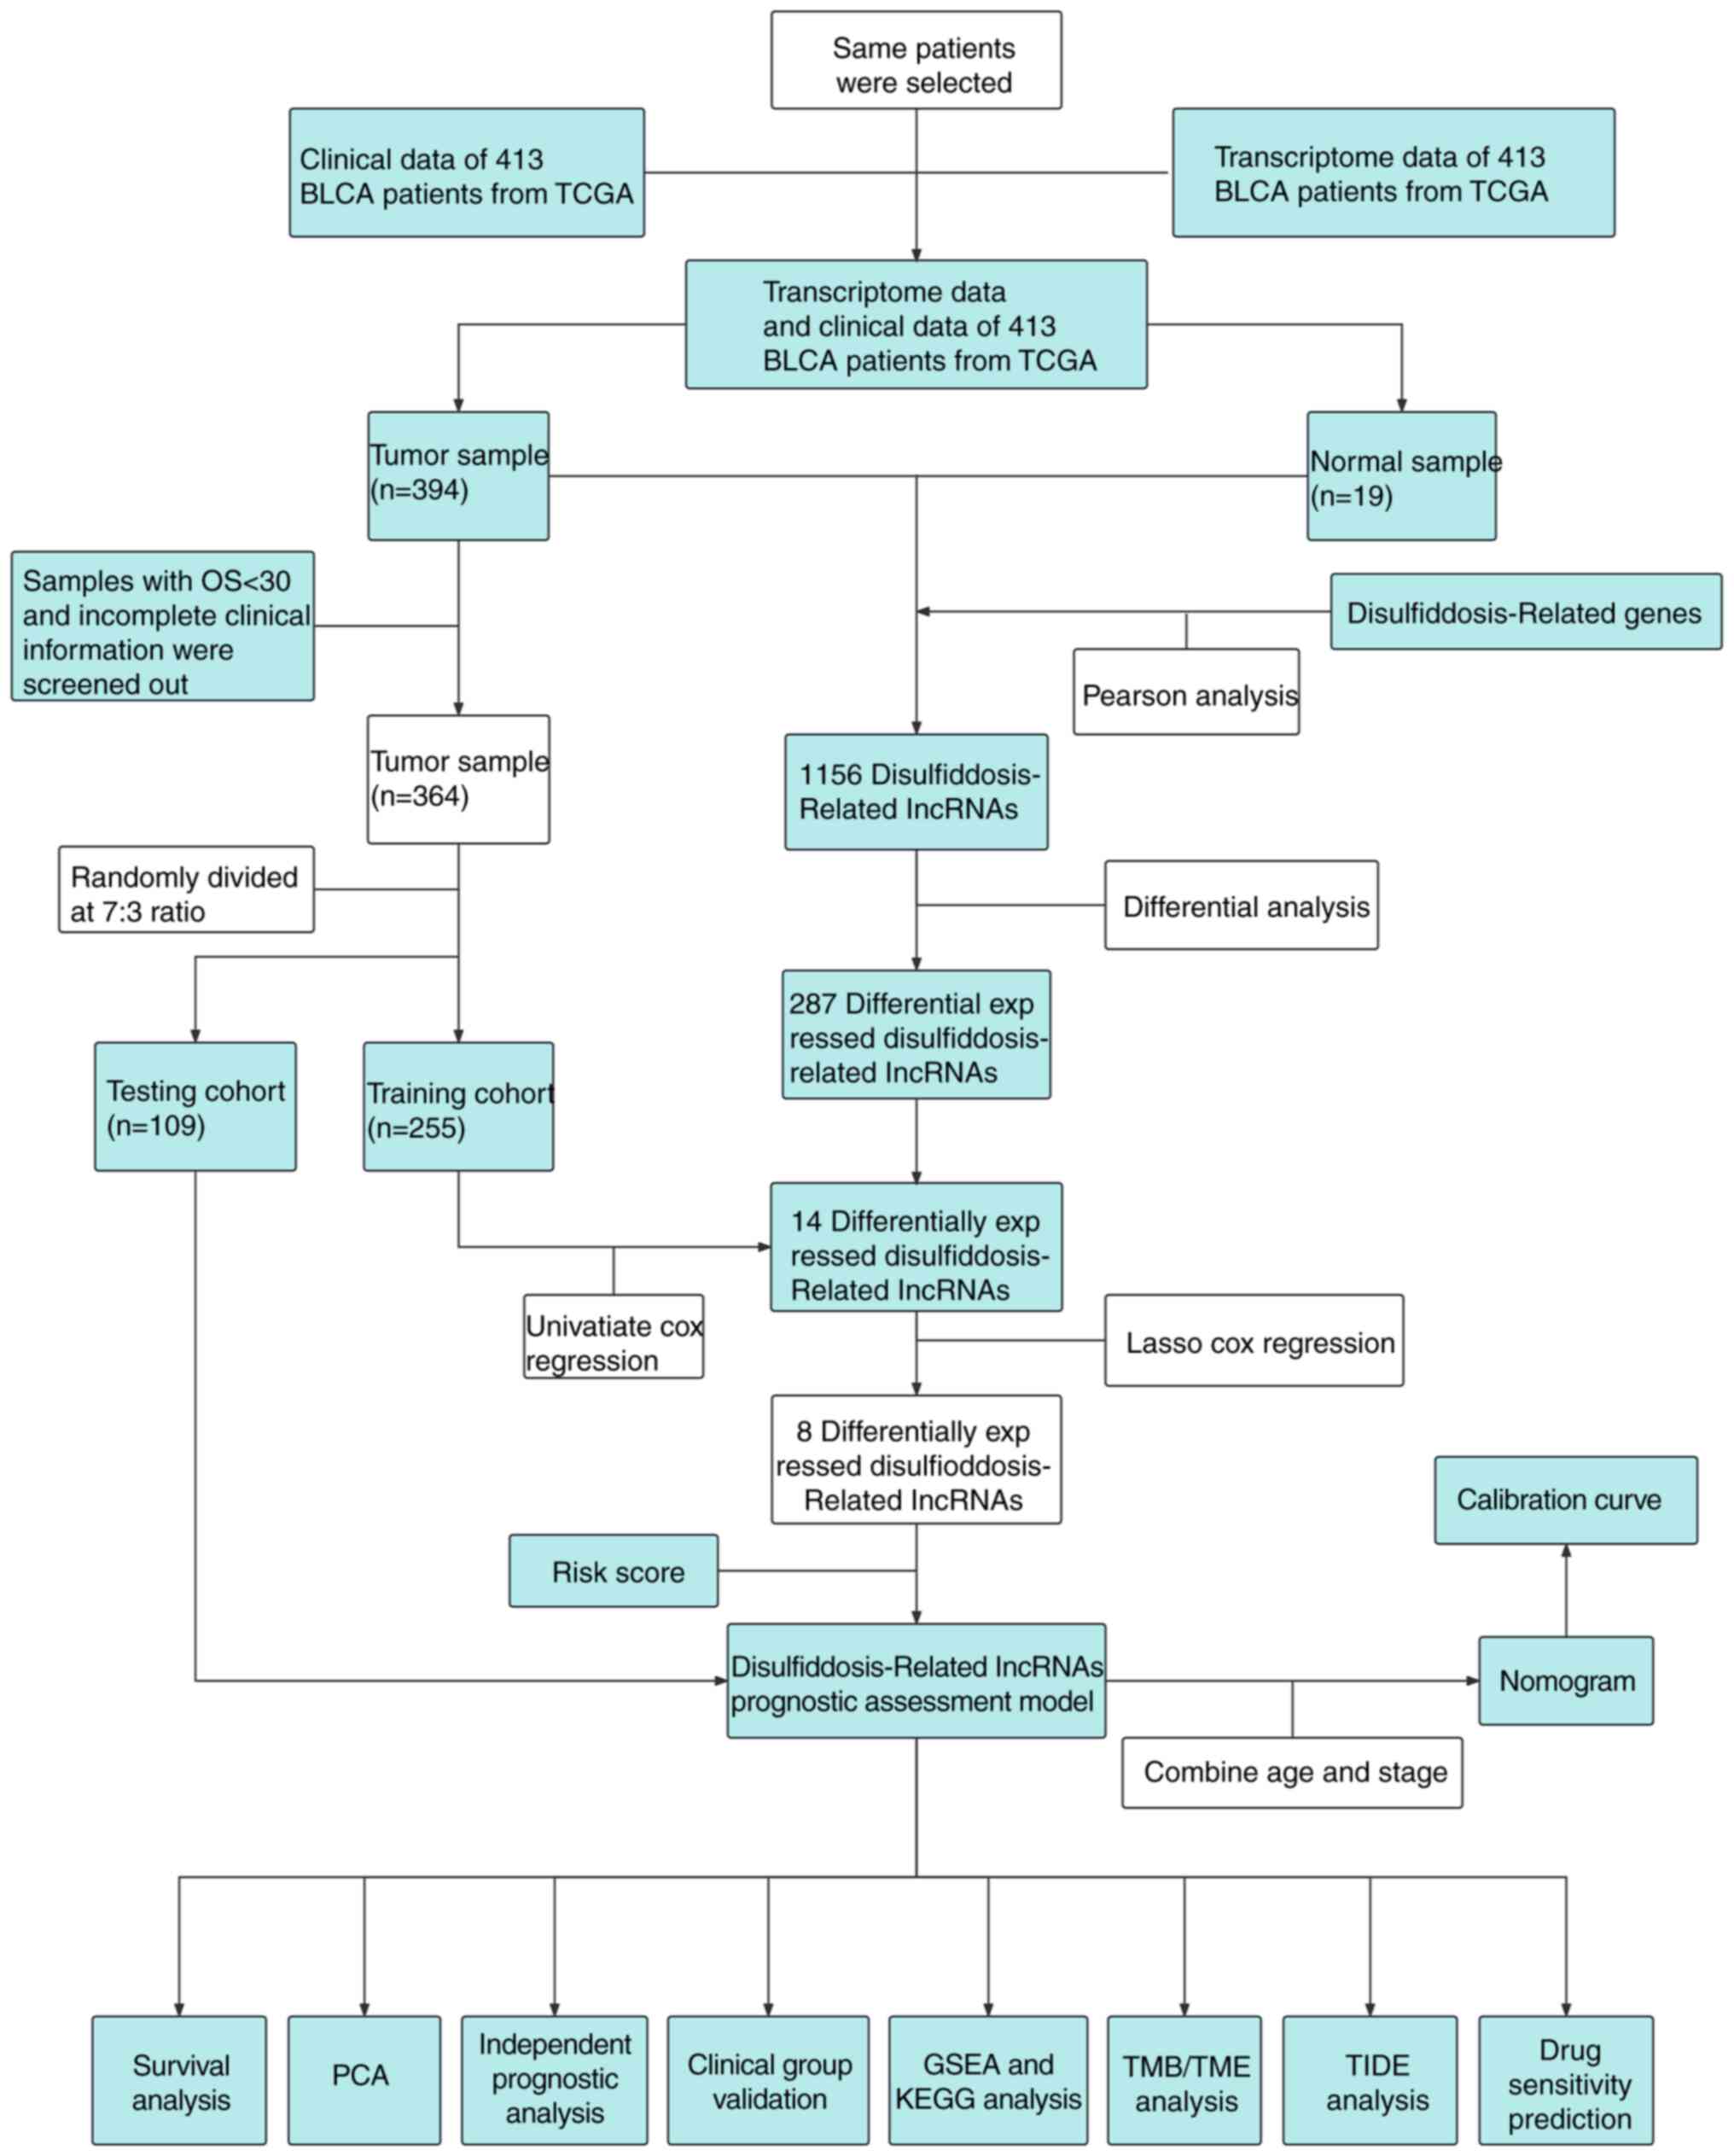
depicted in Fig. 1. In the initial
phase, following the identification of six DRGs, the STRING
database (https://cn.string-db.org/) was
utilized to construct a protein-protein interaction network
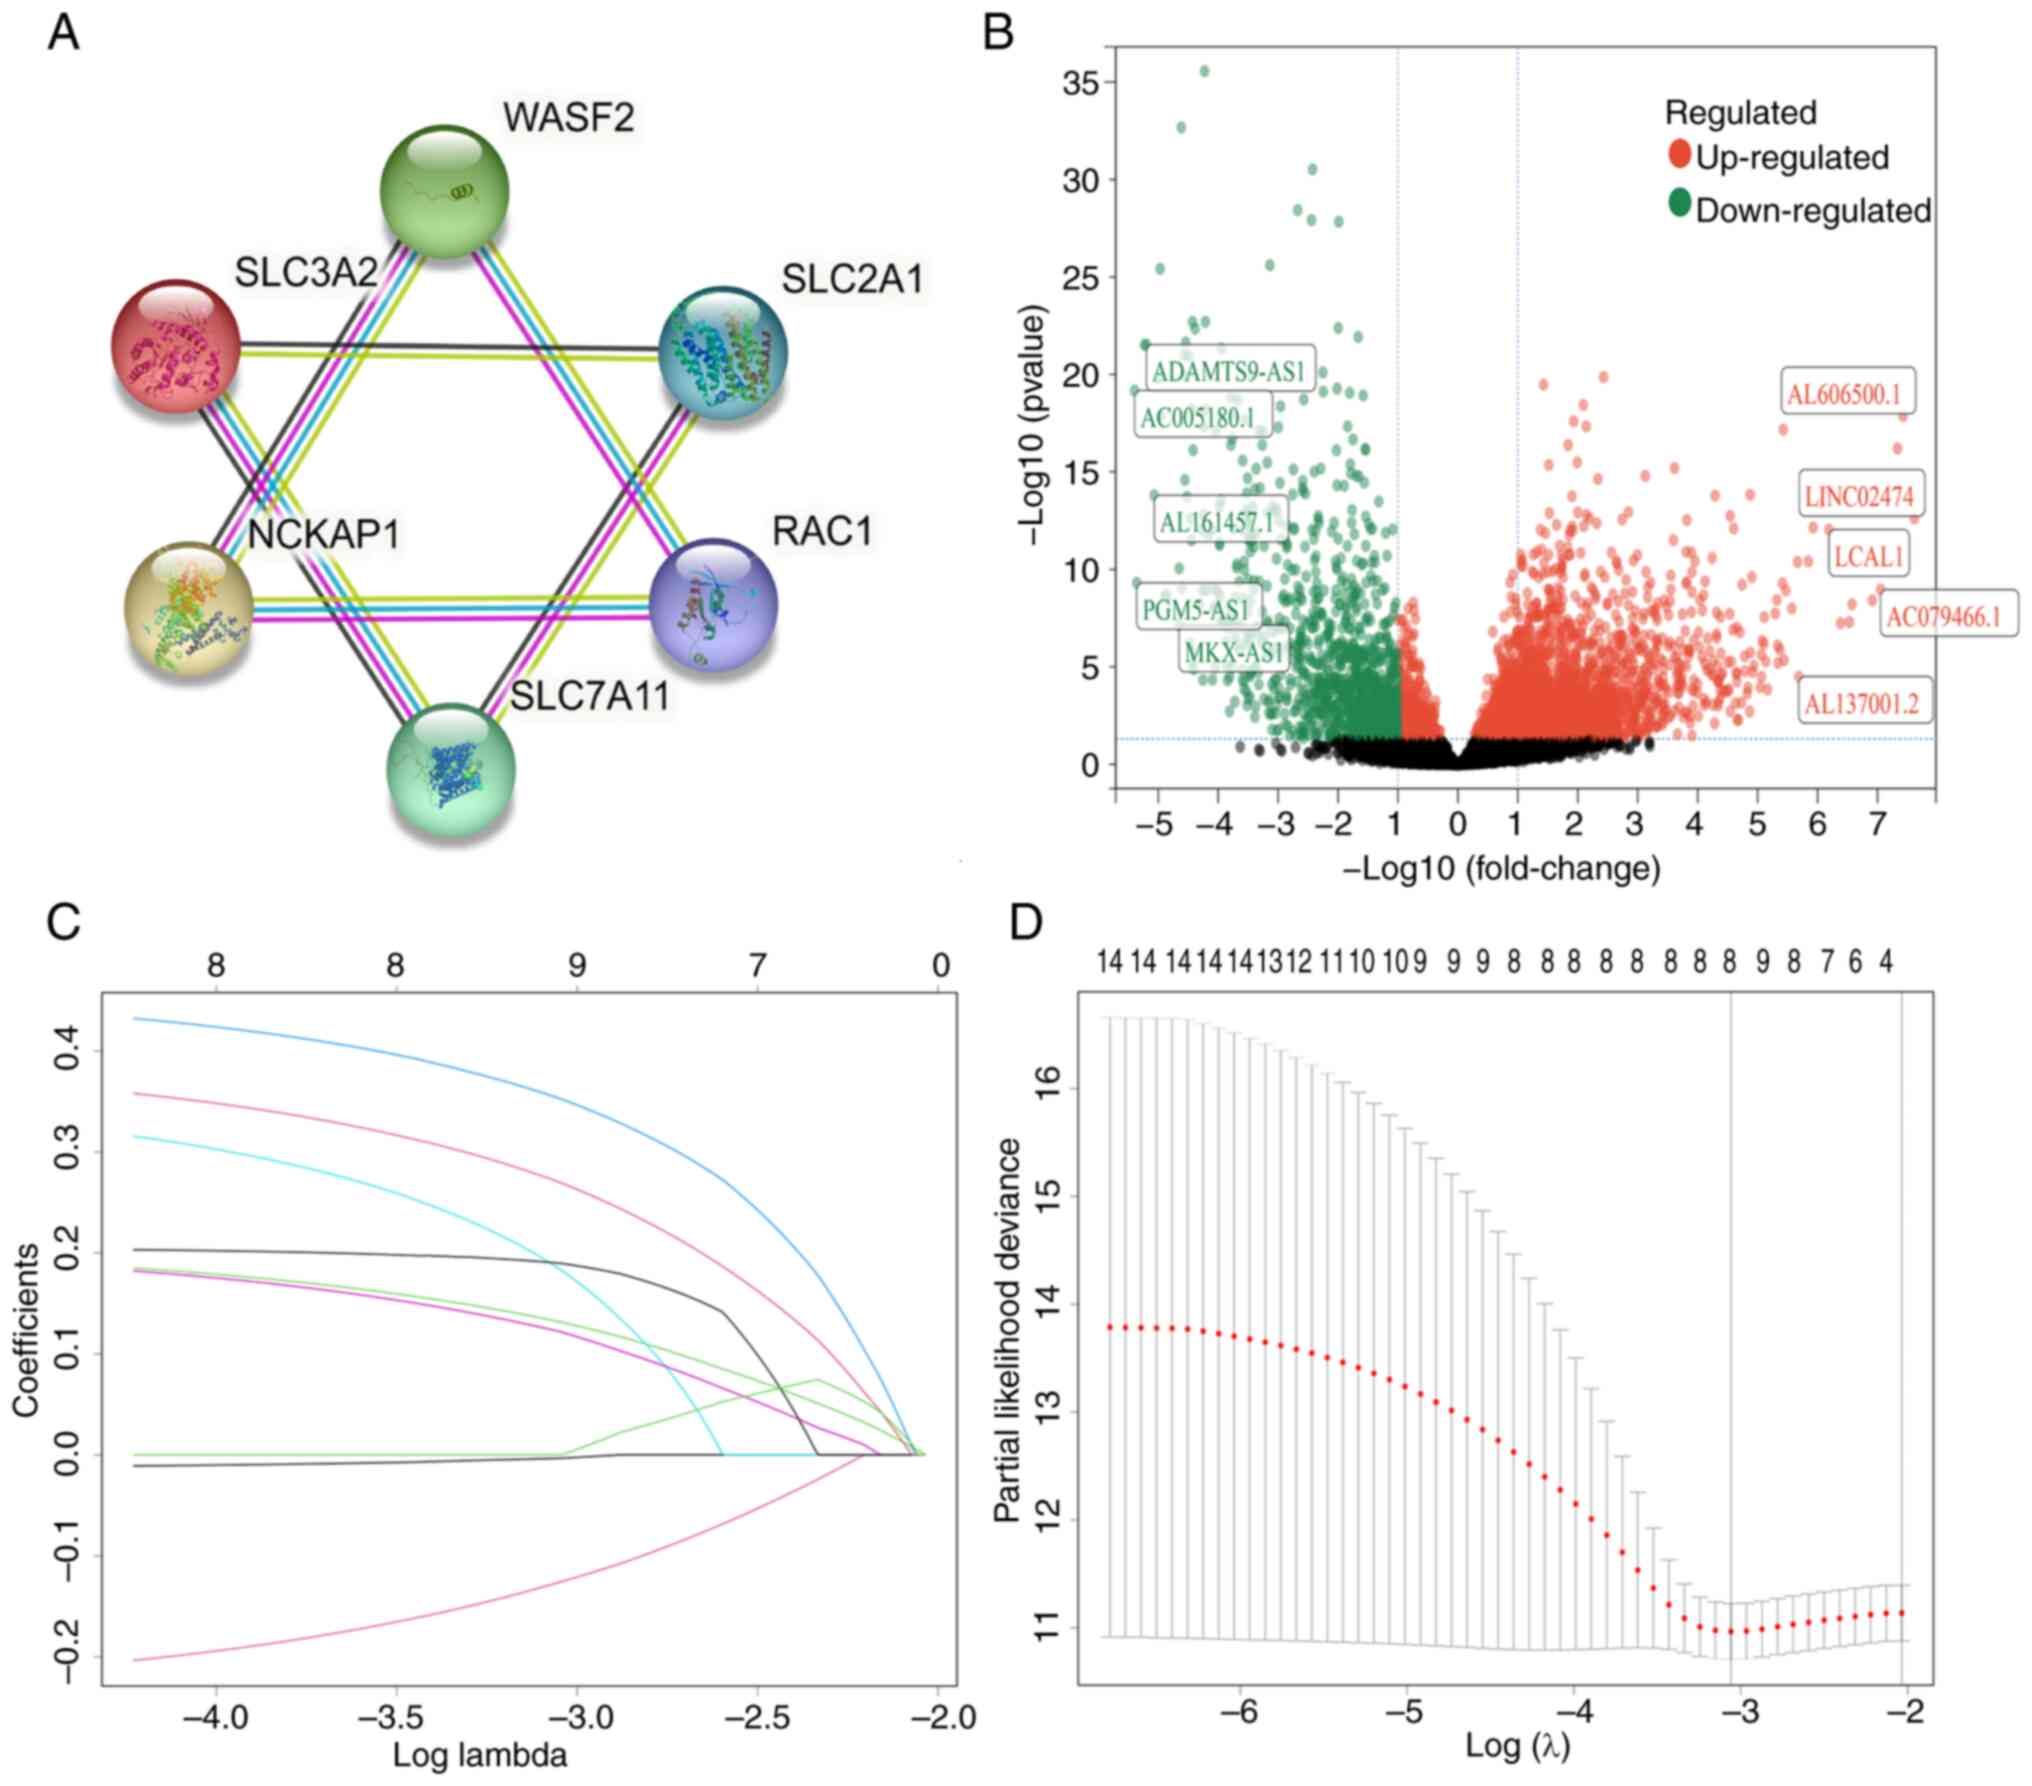
(Fig. 2A). Subsequently, through
Pearson correlation analysis, 1,156 lncRNAs correlated with these
DRGs were identified. Further differential analysis revealed that
287 lncRNAs exhibited differential expression between cancerous and
normal tissues (Fig. 2B).
The 364 patients were divided into two groups: A
training group (n=255) and a test group (n=109). Detailed clinical
information for each group is provided in Table I. Notably, 14 lncRNAs were
identified in the training set through univariate analysis
(Table SII). Subsequently, the
LASSO algorithm refined this selection, resulting in the
identification of 8 DRlncRNAs for the development of the signature
(Fig. 2C and D; details in Table SIII). Additionally, the study
also explored correlations among these final 8 DRlncRNAs (Fig. S1A) and their upregulation and
downregulation patterns (Fig.
S1B). Furthermore, the associations between these 8 lncRNAs and
their associated genes were investigated (Fig. S1C).
 | Table IClinical information of the patients
in the test and training groups. |
Table I
Clinical information of the patients
in the test and training groups.
| | Train cohort
(n=255) | Test cohort
(n=109) | Entire cohort
(n=364) |
|---|
|
Characteristics | n | % | n | % | n | % |
|---|
| Age | | | | | | |
|
<65 | 89 | 34.9 | 42 | 38.5 | 131 | 36.0 |
|
>65 | 166 | 65.1 | 67 | 61.5 | 233 | 64.0 |
| Status | | | | | | |
|
Alive | 142 | 55.7 | 57 | 52.3 | 199 | 54.7 |
|
Dead | 113 | 44.3 | 52 | 47.7 | 165 | 45.3 |
| Sex | | | | | | |
|
Female | 66 | 25.9 | 29 | 26.6 | 95 | 26.1 |
|
Male | 189 | 74.1 | 80 | 73.4 | 269 | 73.9 |
| Stage | | | | | | |
|
Stage I | 4 | 1.6 | 0 | 0 | 4 | 1.1 |
|
Stage
II | 70 | 27.5 | 25 | 22.9 | 95 | 26.1 |
|
Stage
III | 92 | 36.1 | 46 | 42.2 | 138 | 37.9 |
|
Stage
IV | 89 | 34.9 | 38 | 34.9 | 127 | 34.9 |
| T stage | | | | | | |
|
T1 | 5 | 2.0 | 0 | 0 | 5 | 1.4 |
|
T2 | 82 | 32.2 | 28 | 25.7 | 110 | 30.2 |
|
T3 | 129 | 50.6 | 63 | 57.8 | 192 | 52.7 |
|
T4 | 39 | 15.3 | 18 | 16.5 | 57 | 15.7 |
| M stage | | | | | | |
|
M0 | 121 | 47.5 | 57 | 52.3 | 178 | 48.9 |
|
M1 | 6 | 2.4 | 2 | 1.8 | 8 | 2.2 |
|
Unknown | 128 | 50.2 | 50 | 45.9 | 178 | 48.9 |
| N stage | | | | | | |
|
N0 | 148 | 58.0 | 65 | 59.6 | 213 | 58.5 |
|
N1 | 31 | 12.2 | 12 | 11.0 | 43 | 11.8 |
|
N2 | 52 | 20.4 | 23 | 21.1 | 75 | 20.6 |
|
N3 | 3 | 1.2 | 2 | 1.8 | 5 | 1.4 |
|
Unknown | 21 | 8.2 | 7 | 6.4 | 28 | 7.7 |
Developing and validating the risk
score signature
Following the outlined steps, a prognostic signature
was formulated for patients with BLCA, and the risk scores were
established as specified: Predicted risk score = (-0.003727 x
AL390719.2 expression) + (-0.126979 x ASMTL-AS1 expression) +
(0.1324342 x AL031058.1 expression) + (0.3540896 x LINC02438
expression) + (0.1858756 x LINC01788 expression) + (0.1228996 x
AC022613.2 expression) + (0.1901772 x RBMS3-AS3 expression) +
(0.2711116 x AL122035.1 expression). Specific clinical data for
both risk groups are provided in Table II.
 | Table IIClinical information for 364 patients
in different risk categories. |
Table II
Clinical information for 364 patients
in different risk categories.
| | High-risk group
(n=181) | Low-risk group
(n=183) |
|---|
|
Characteristics | n | % | n | % |
|---|
| Age | | | | |
|
<65 | 63 | 34.8 | 68 | 37.2 |
|
>65 | 118 | 65.2 | 115 | 62.8 |
| Status | | | | |
|
Alive | 76 | 42.0 | 123 | 67.2 |
|
Dead | 105 | 58.0 | 60 | 32.8 |
| Sex | | | | |
|
Female | 55 | 30.4 | 40 | 21.9 |
|
Male | 126 | 69.6 | 143 | 78.1 |
| Stage | | | | |
|
Stage I | 1 | 0.6 | 3 | 1.6 |
|
Stage
II | 32 | 17.7 | 63 | 34.4 |
|
Stage
III | 79 | 43.6 | 59 | 32.2 |
|
Stage
IV | 69 | 38.1 | 58 | 31.7 |
| T stage | | | | |
|
T1 | 1 | 0.6 | 4 | 2.2 |
|
T2 | 38 | 21.0 | 72 | 39.3 |
|
T3 | 108 | 59.7 | 84 | 45.9 |
|
T4 | 34 | 18.8 | 23 | 12.6 |
| M stage | | | | |
|
M0 | 81 | 44.8 | 97 | 53.0 |
|
M1 | 4 | 2.2 | 4 | 2.2 |
|
Unknown | 96 | 53.0 | 82 | 44.8 |
| N stage | | | | |
|
N0 | 108 | 59.7 | 105 | 57.4 |
|
N1 | 28 | 15.5 | 15 | 8.2 |
|
N2 | 36 | 19.9 | 39 | 21.3 |
|
N3 | 3 | 1.7 | 2 | 1.1 |
|
Unknown | 6 | 3.3 | 22 | 12.0 |
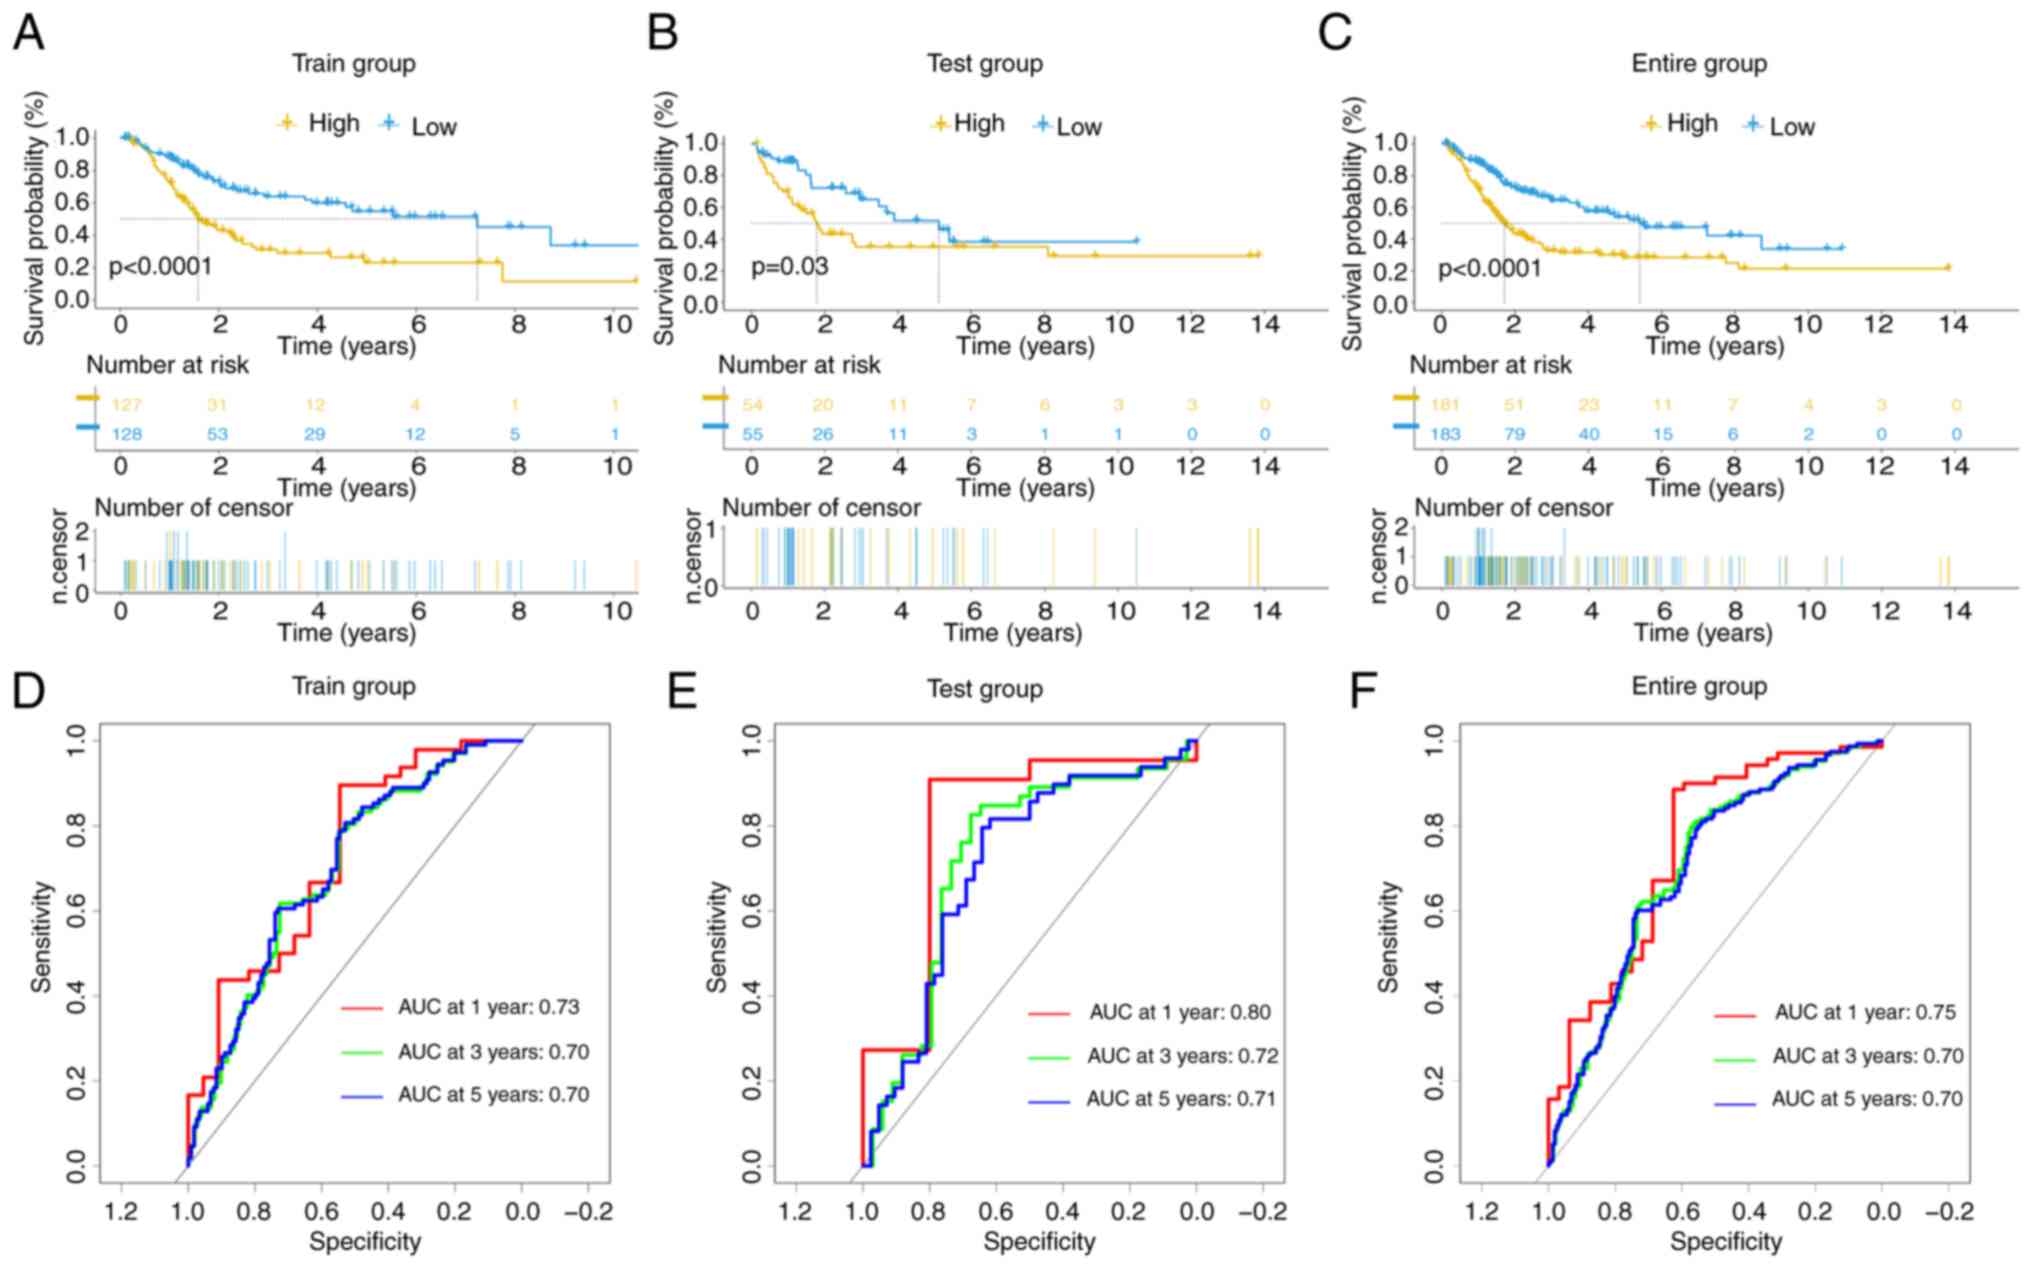
The prognostic outcomes of the high- and low-risk
groups in the training (P<0.0001), test (P=0.03) and entire
(P<0.0001) cohorts exhibited significant disparities, as
evidenced by K-M curves (Fig.
3A-C). ROC curves revealed anticipated AUC values at different
time intervals (1-, 3- and 5-years) of 0.73, 0.70 and 0.70,
respectively, in the training cohort (Fig. 3D); 0.80, 0.72 and 0.71,
respectively, in the test cohort (Fig.
3E); and 0.75, 0.70 and 0.70, respectively, in the entire
cohort (Fig. 3F).
These data affirm the outstanding predictive
performance of the signature for patients with BLCA. Heatmaps
depicting the expression of 8 DRlncRNAs, risk curves, risk survival
status plots (Fig. S2A-C) and
scatter dot plots (Fig. S2D-F) in
each cohort vividly illustrate the unfavorable survival outcomes
among high-risk patients.
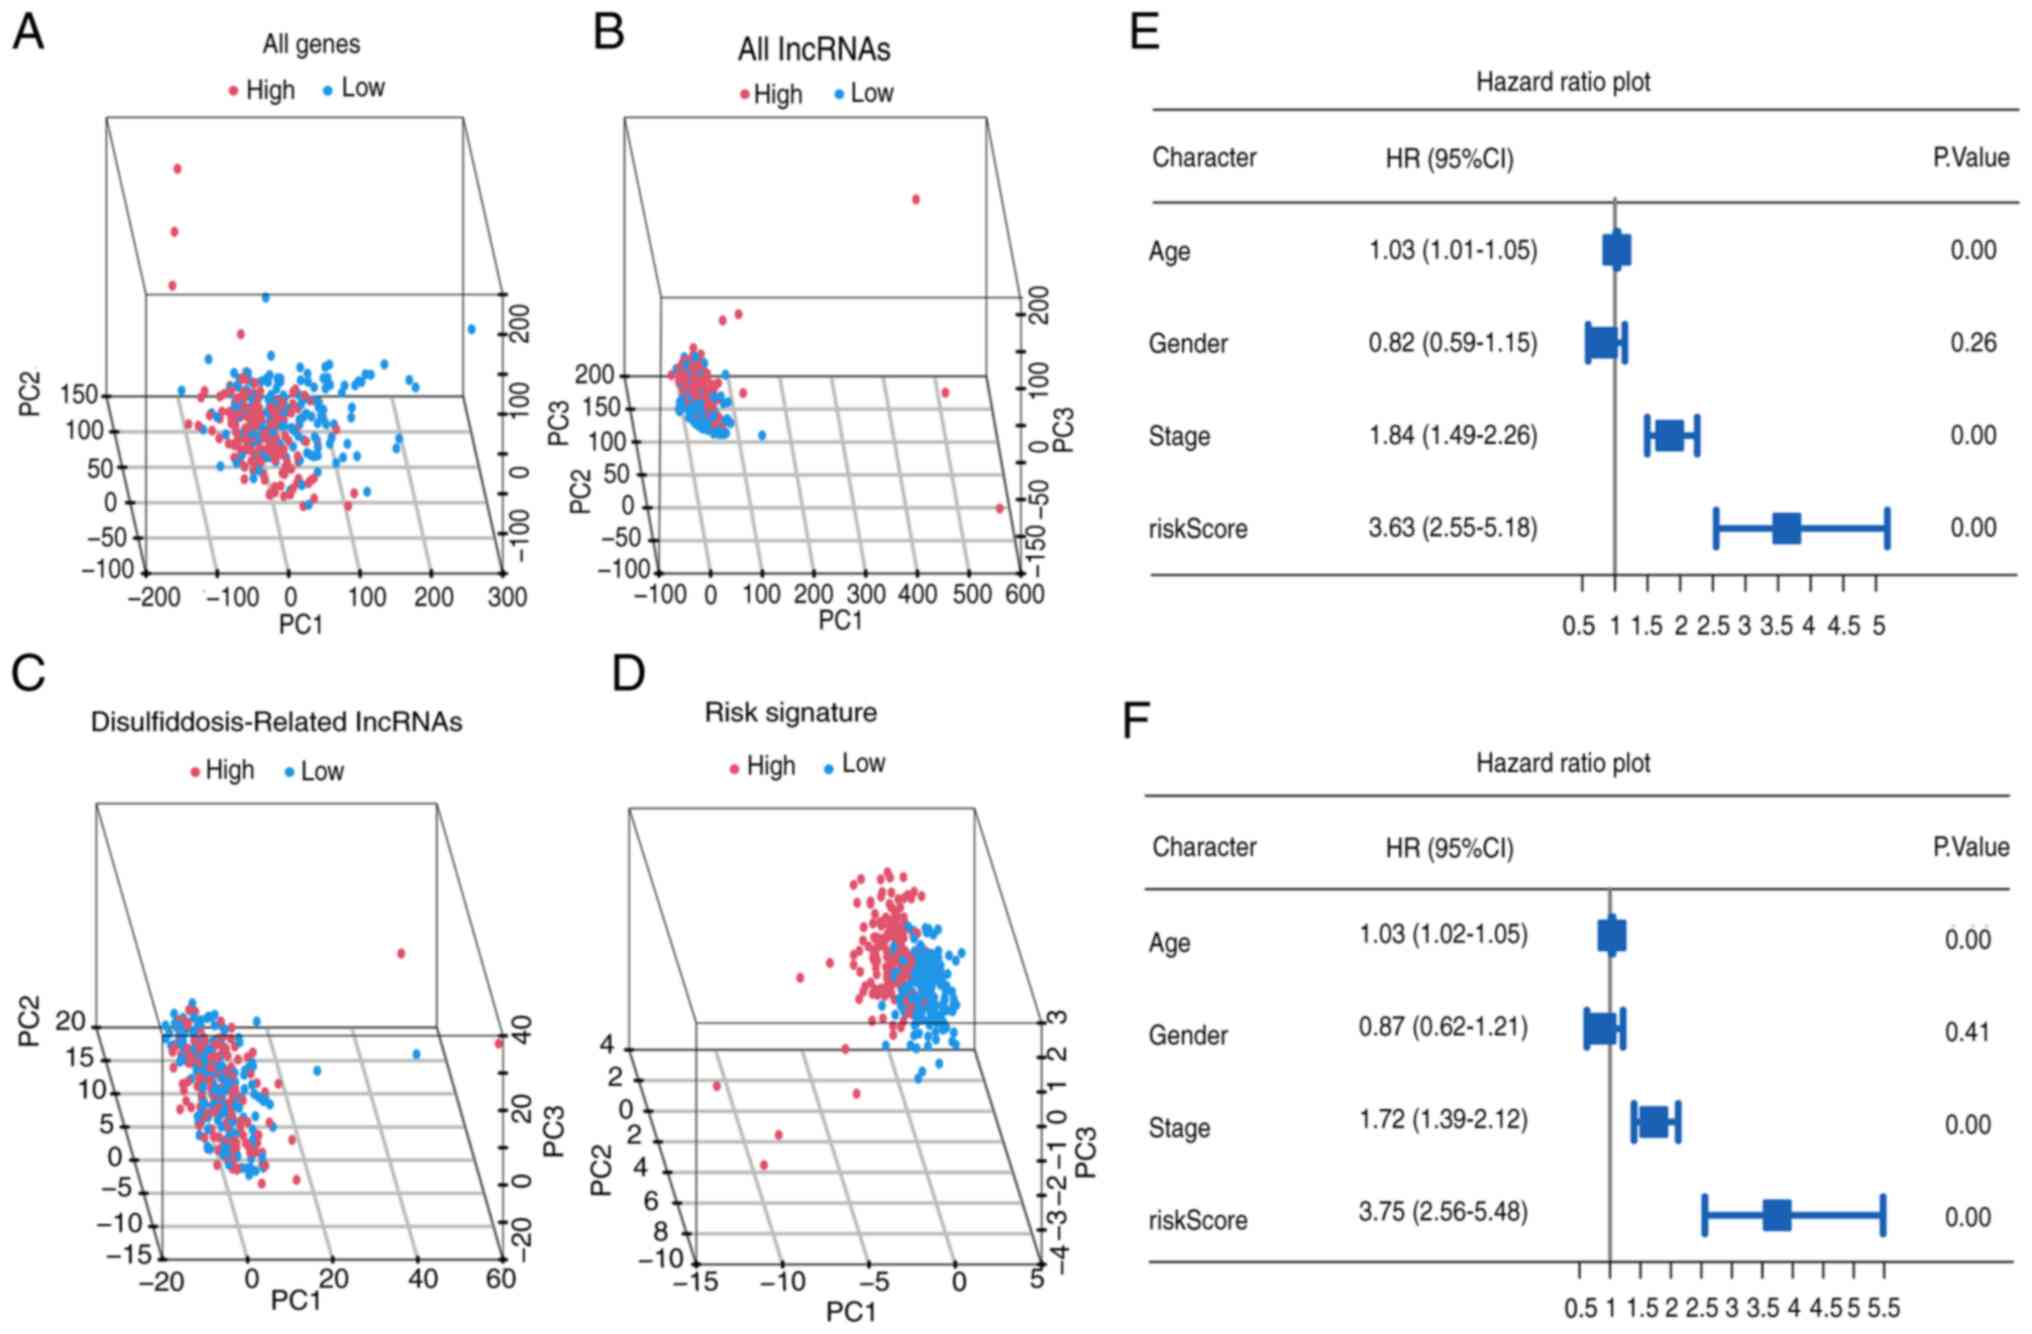
Furthermore, PCA underscores the superior
discriminatory accuracy of the risk signature when distinguishing
between the two groups of patients with BLCA, surpassing the
discriminatory power of individual genes, lncRNAs and DRlncRNAs
(Fig. 4A-D). Notably, univariate
analysis identified age, tumor stage and risk score (all
P<0.001) as significant prognostic factors (Fig. 4E). In the multivariate analysis,
age, tumor stage and risk score (all P<0.001) independently
demonstrated predictive significance (Fig. 4F).
The heatmap visually portrays distinct expression
patterns of the 8 lncRNAs alongside clinical features (tumor stage,
age and sex) in both high- and low-risk patients (Fig. S3A). Scatter plots revealed that
increasing risk scores associated with female sex (P=0.026) and
mortality (P<0.001), while age and tumor stage do not exhibit
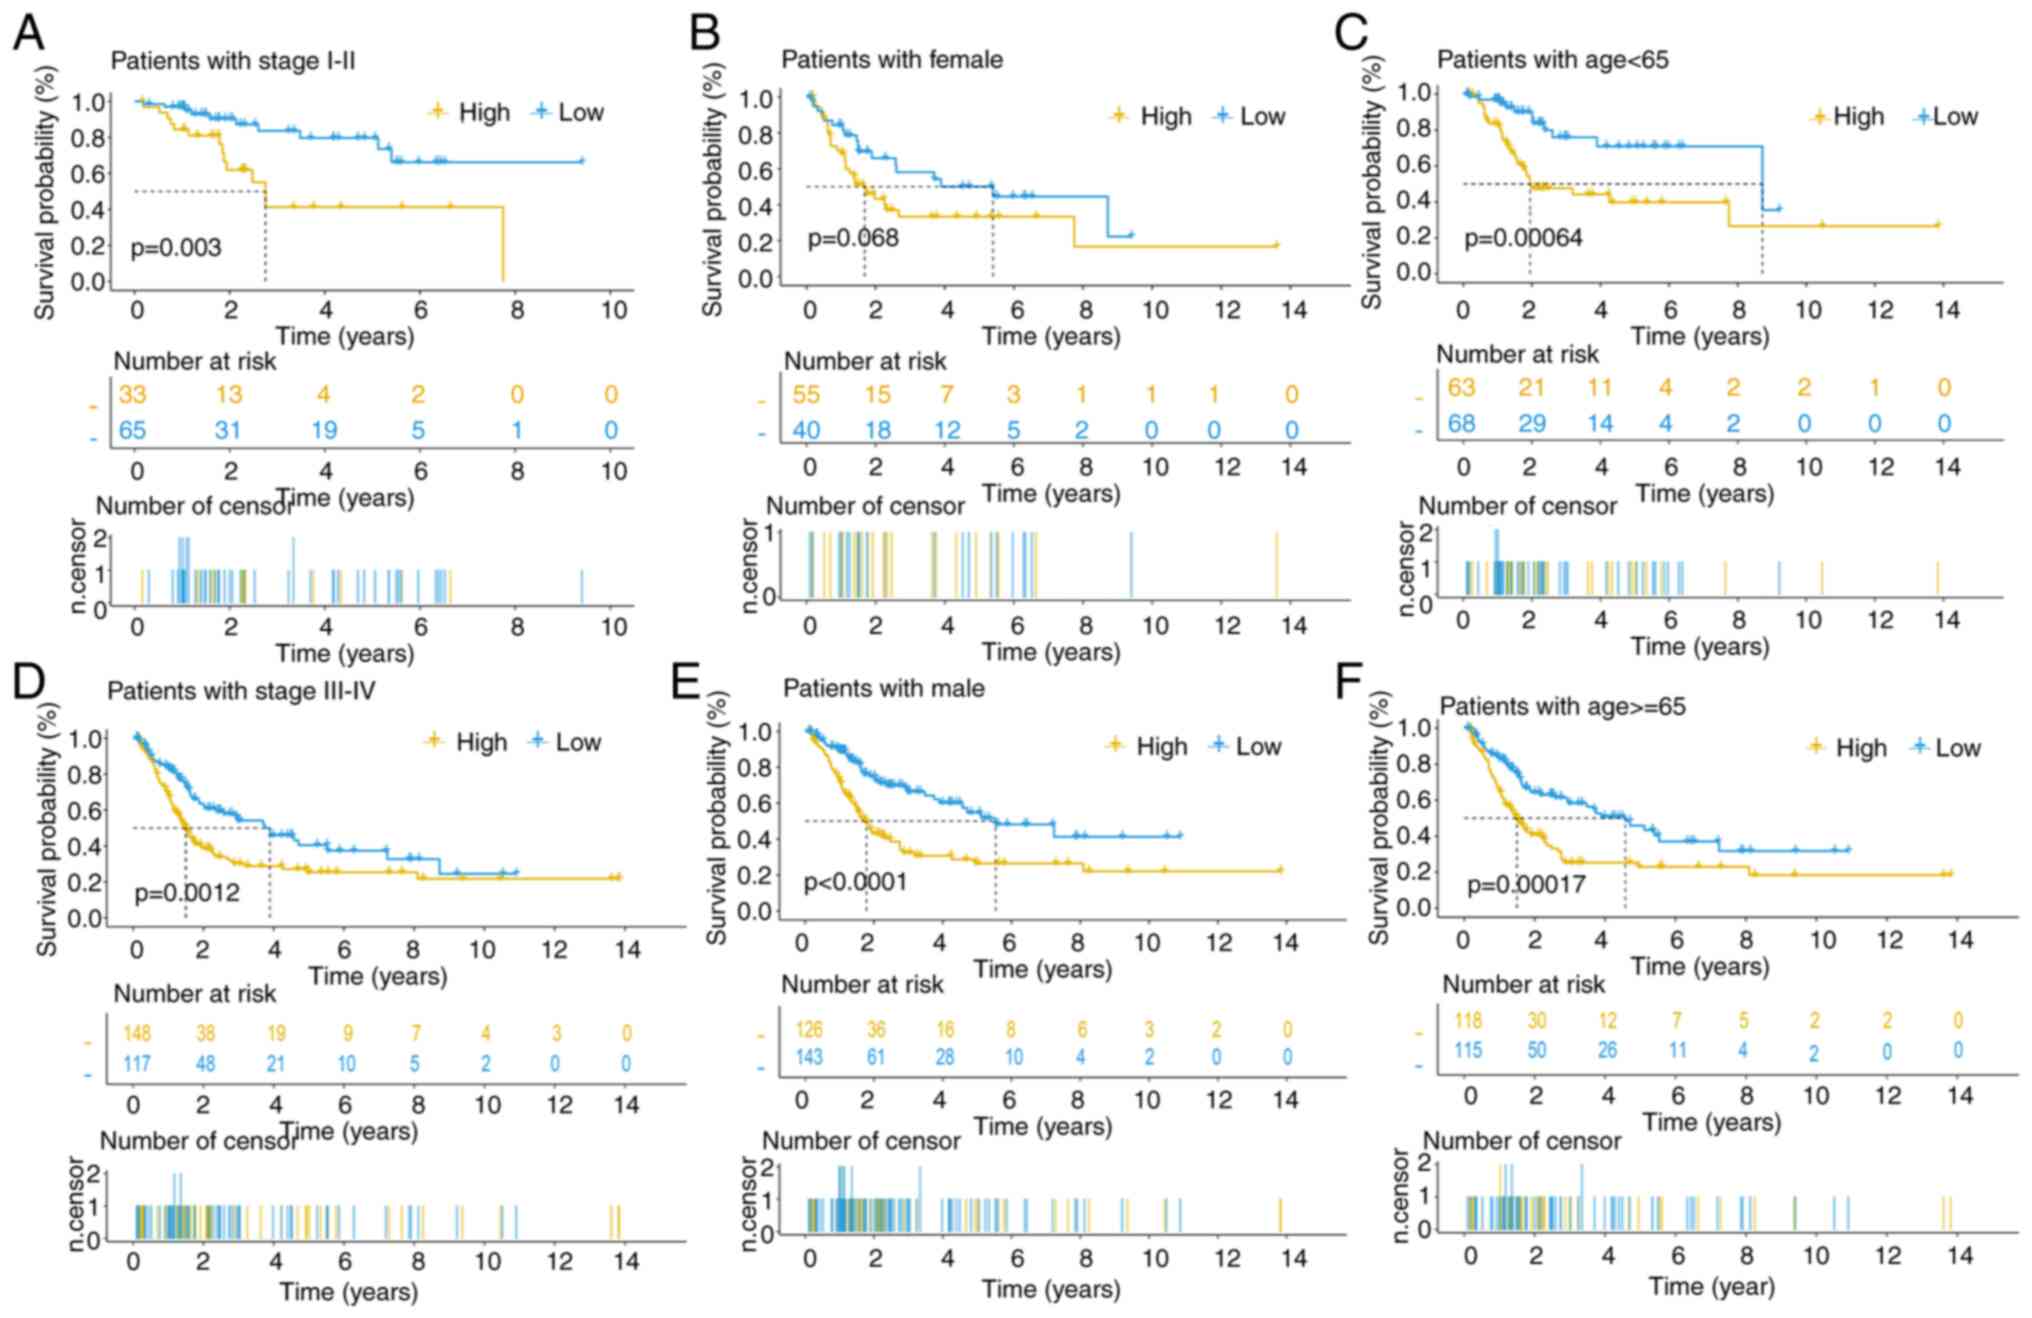
significant associations with the risk score (Fig. S3B-E). Survival curves across
diverse clinical subgroups underscore the robust predictive
capacity of this signature, particularly among male patients across
all tumor stages and age groups (Fig.
5A-F).
Nomogram in patients with BLCA
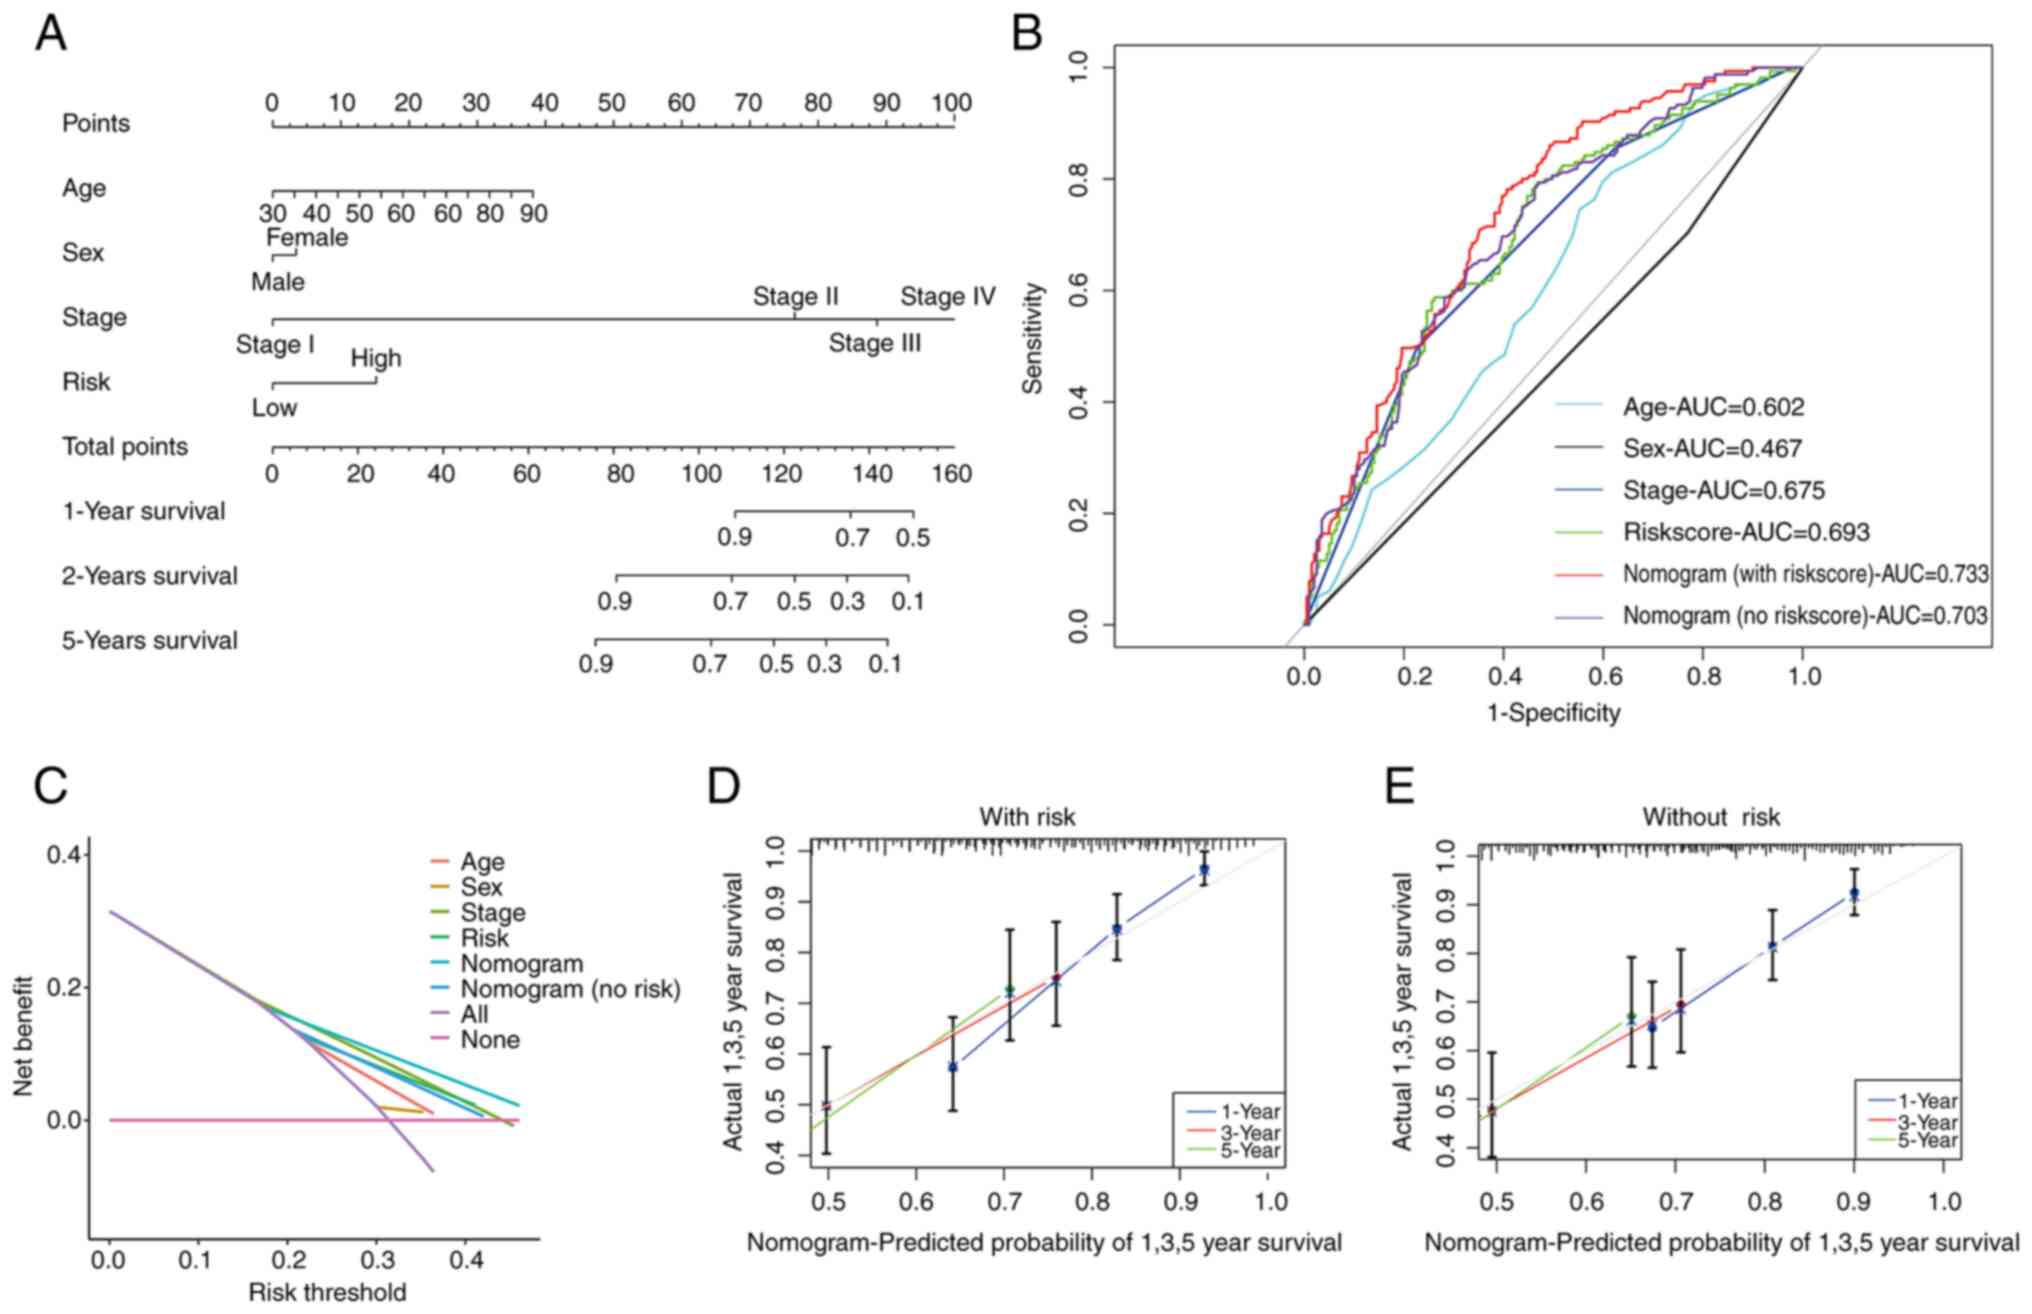
Following the aforementioned analyses, a prognostic
nomogram that seamlessly integrates the risk score alongside other
pertinent clinical features was constructed to predict the OS of
patients with BLCA at 1, 3, and 5 years (Fig. 6A). Subsequent validation using data
of patients with BLCA substantiated the effectiveness of this
predictive tool (Fig. S4).
The AUC further attests to the accuracy of the risk
score-based nomogram, with AUC values as follows: Risk score
(0.693), age (0.602), sex (0.467) and stage (0.675). Notably, the
nomogram incorporating the risk score (0.733) outperformed the
nomogram without the risk score (0.703) and DCA confirmed the
accuracy of the risk score-based nomogram (Fig. 6B and C). Additionally, calibration curves
underscored the superior predictive capacity of the risk
score-based nomogram (Fig. 6D and
E).
Functional enrichment analysis
The salient pathways identified through KEGG pathway
enrichment analysis are illustrated in Fig. S5A and B. This analysis, conducted across three
libraries and examined using GSEA, yielded consistent outcomes.
Remarkably, the pathways enriched in high-risk patients were linked
to the cell cycle, focal adhesion and WNT signaling (Fig. S6A-C), while those in low-risk
patients were predominantly related to substance metabolism
(Fig. S6D). Comprehensive details
of all pathways are available in Table SIV.
Somatic mutation landscape
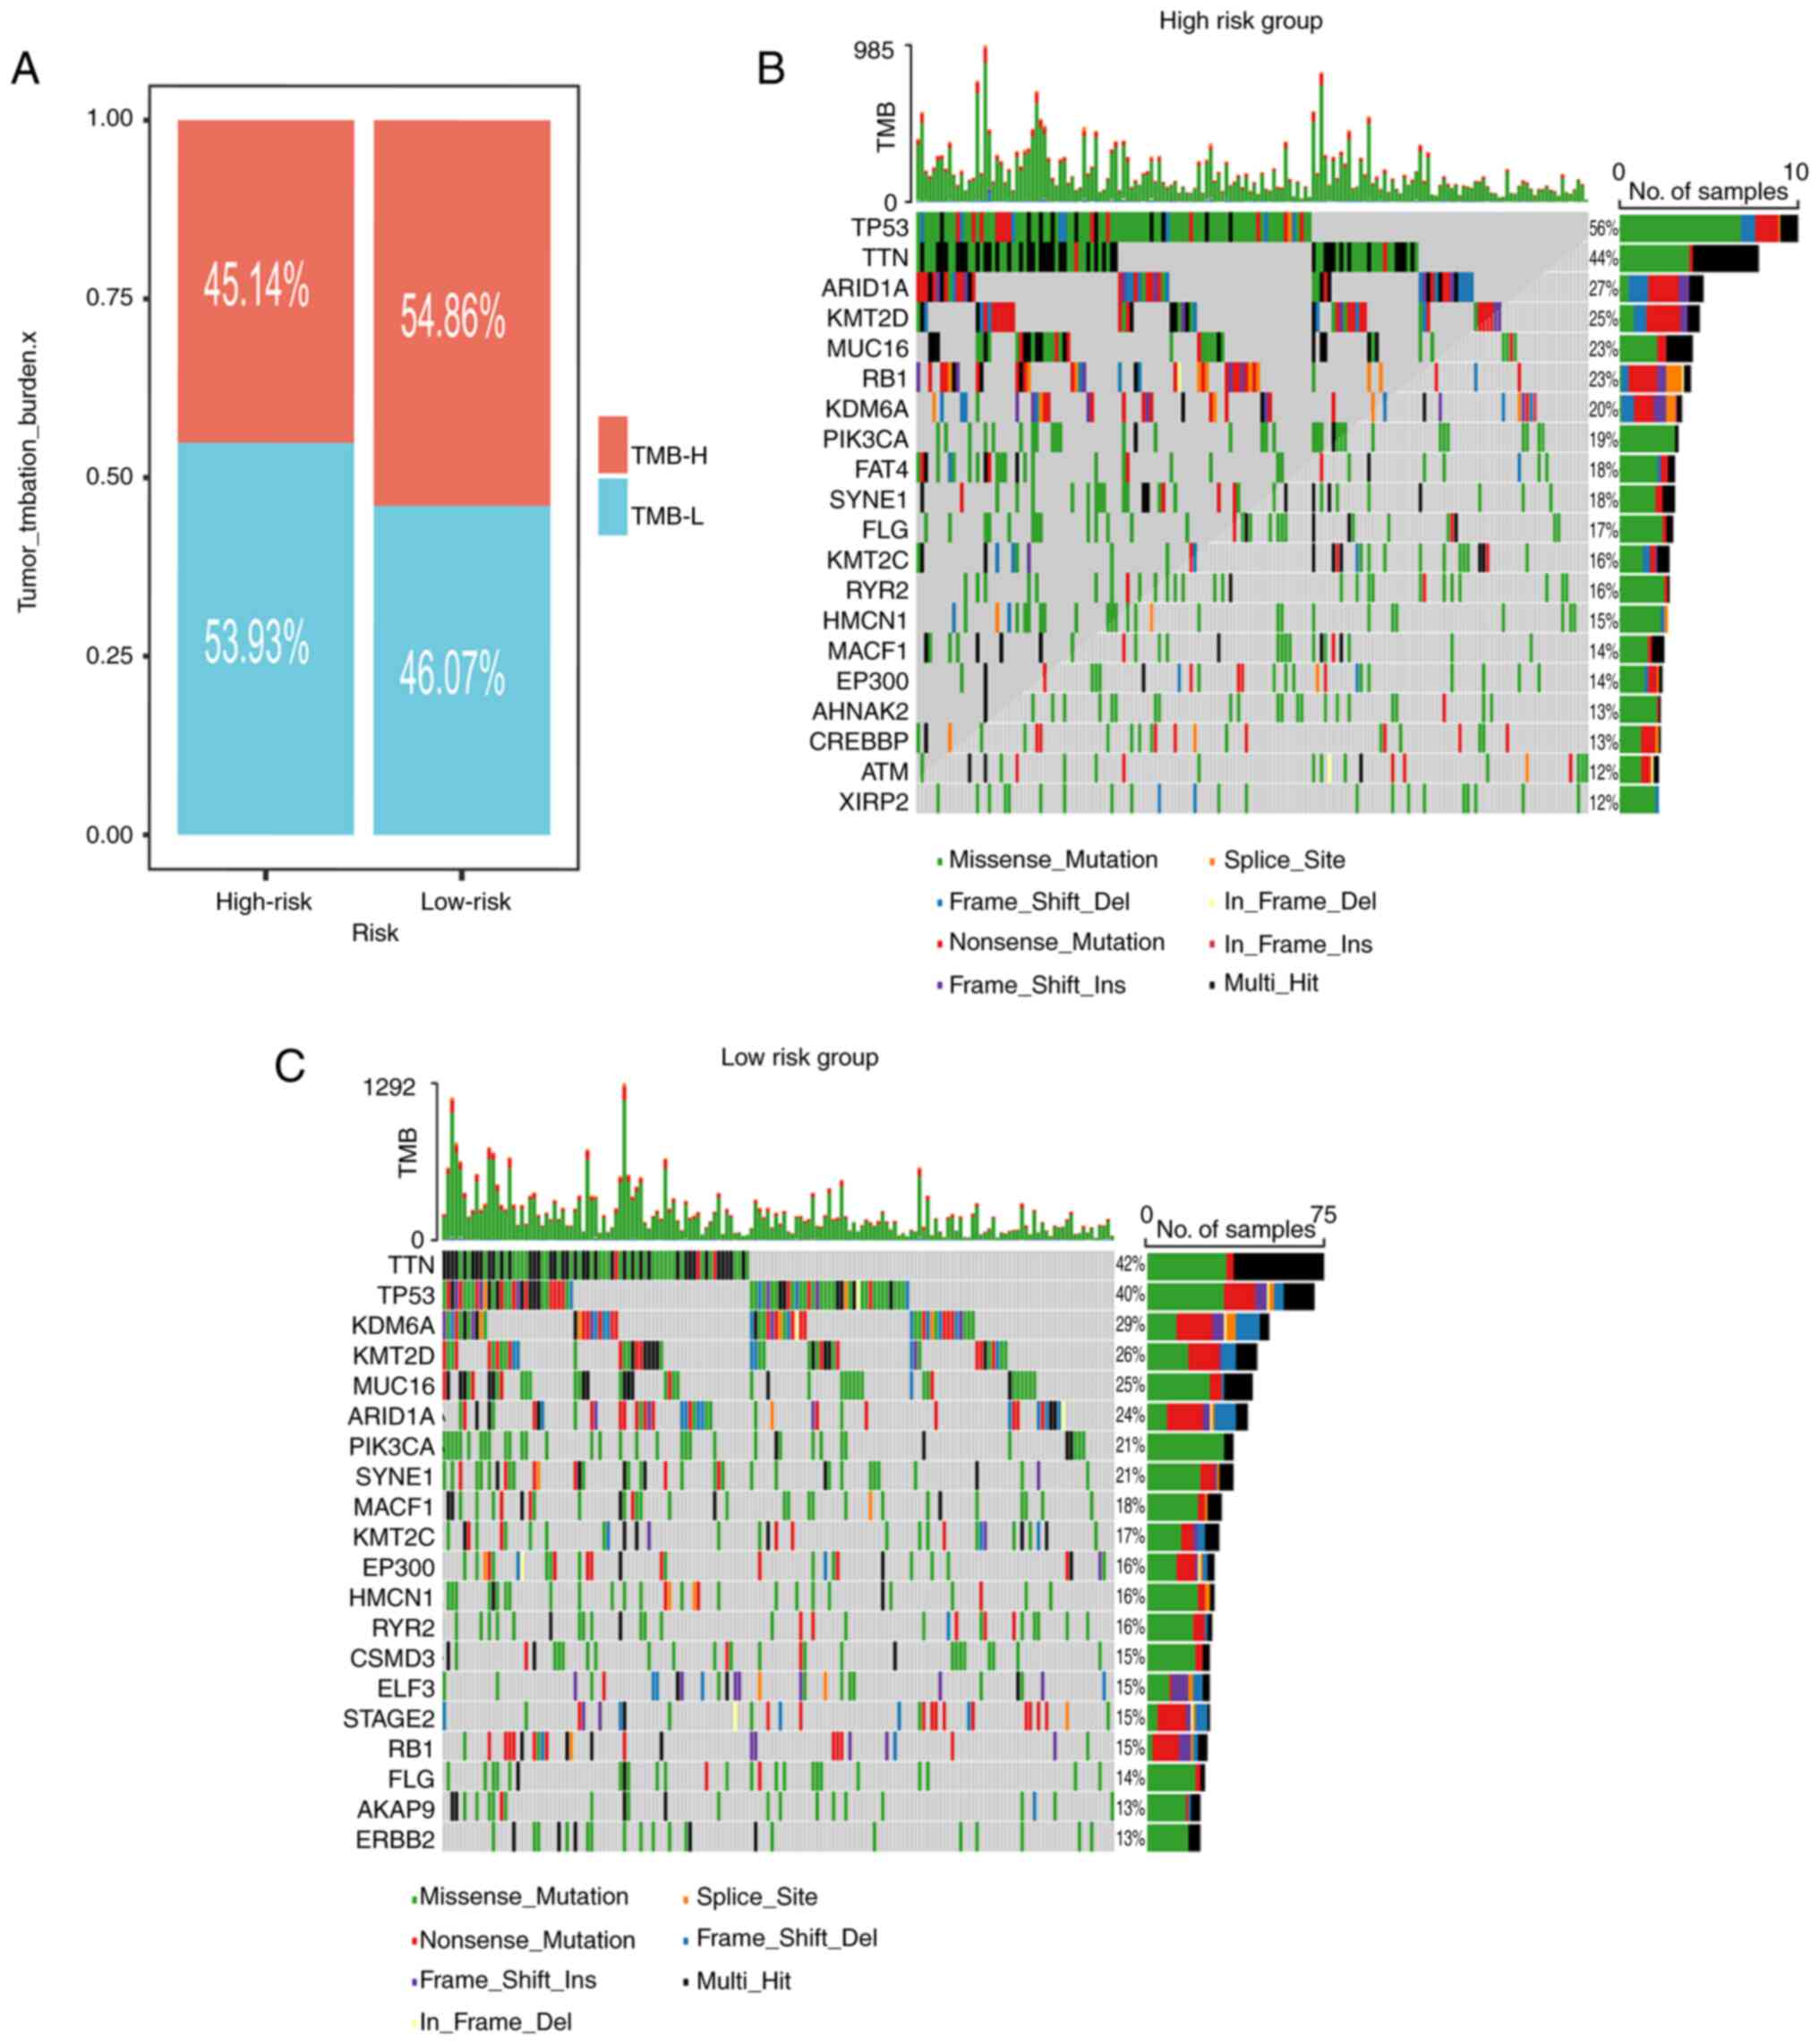
As depicted in Fig.
7A, the low-risk subgroup exhibited an elevated TMB. The
waterfall plots visually represented the 20 most frequently mutated
genes in patients with BLCA (Fig.
7B and C). Notably, the top
four mutated genes among high-risk patients were TP53 (56%), TTN
(44%), ARID1A (27%) and KMT2D (25%). Meanwhile, among low-risk
patients, the prominent mutated genes were TTN (42%), TP53 (40%),
KDM6A (29%) and KMT2D (26%).
Immune infiltration landscape
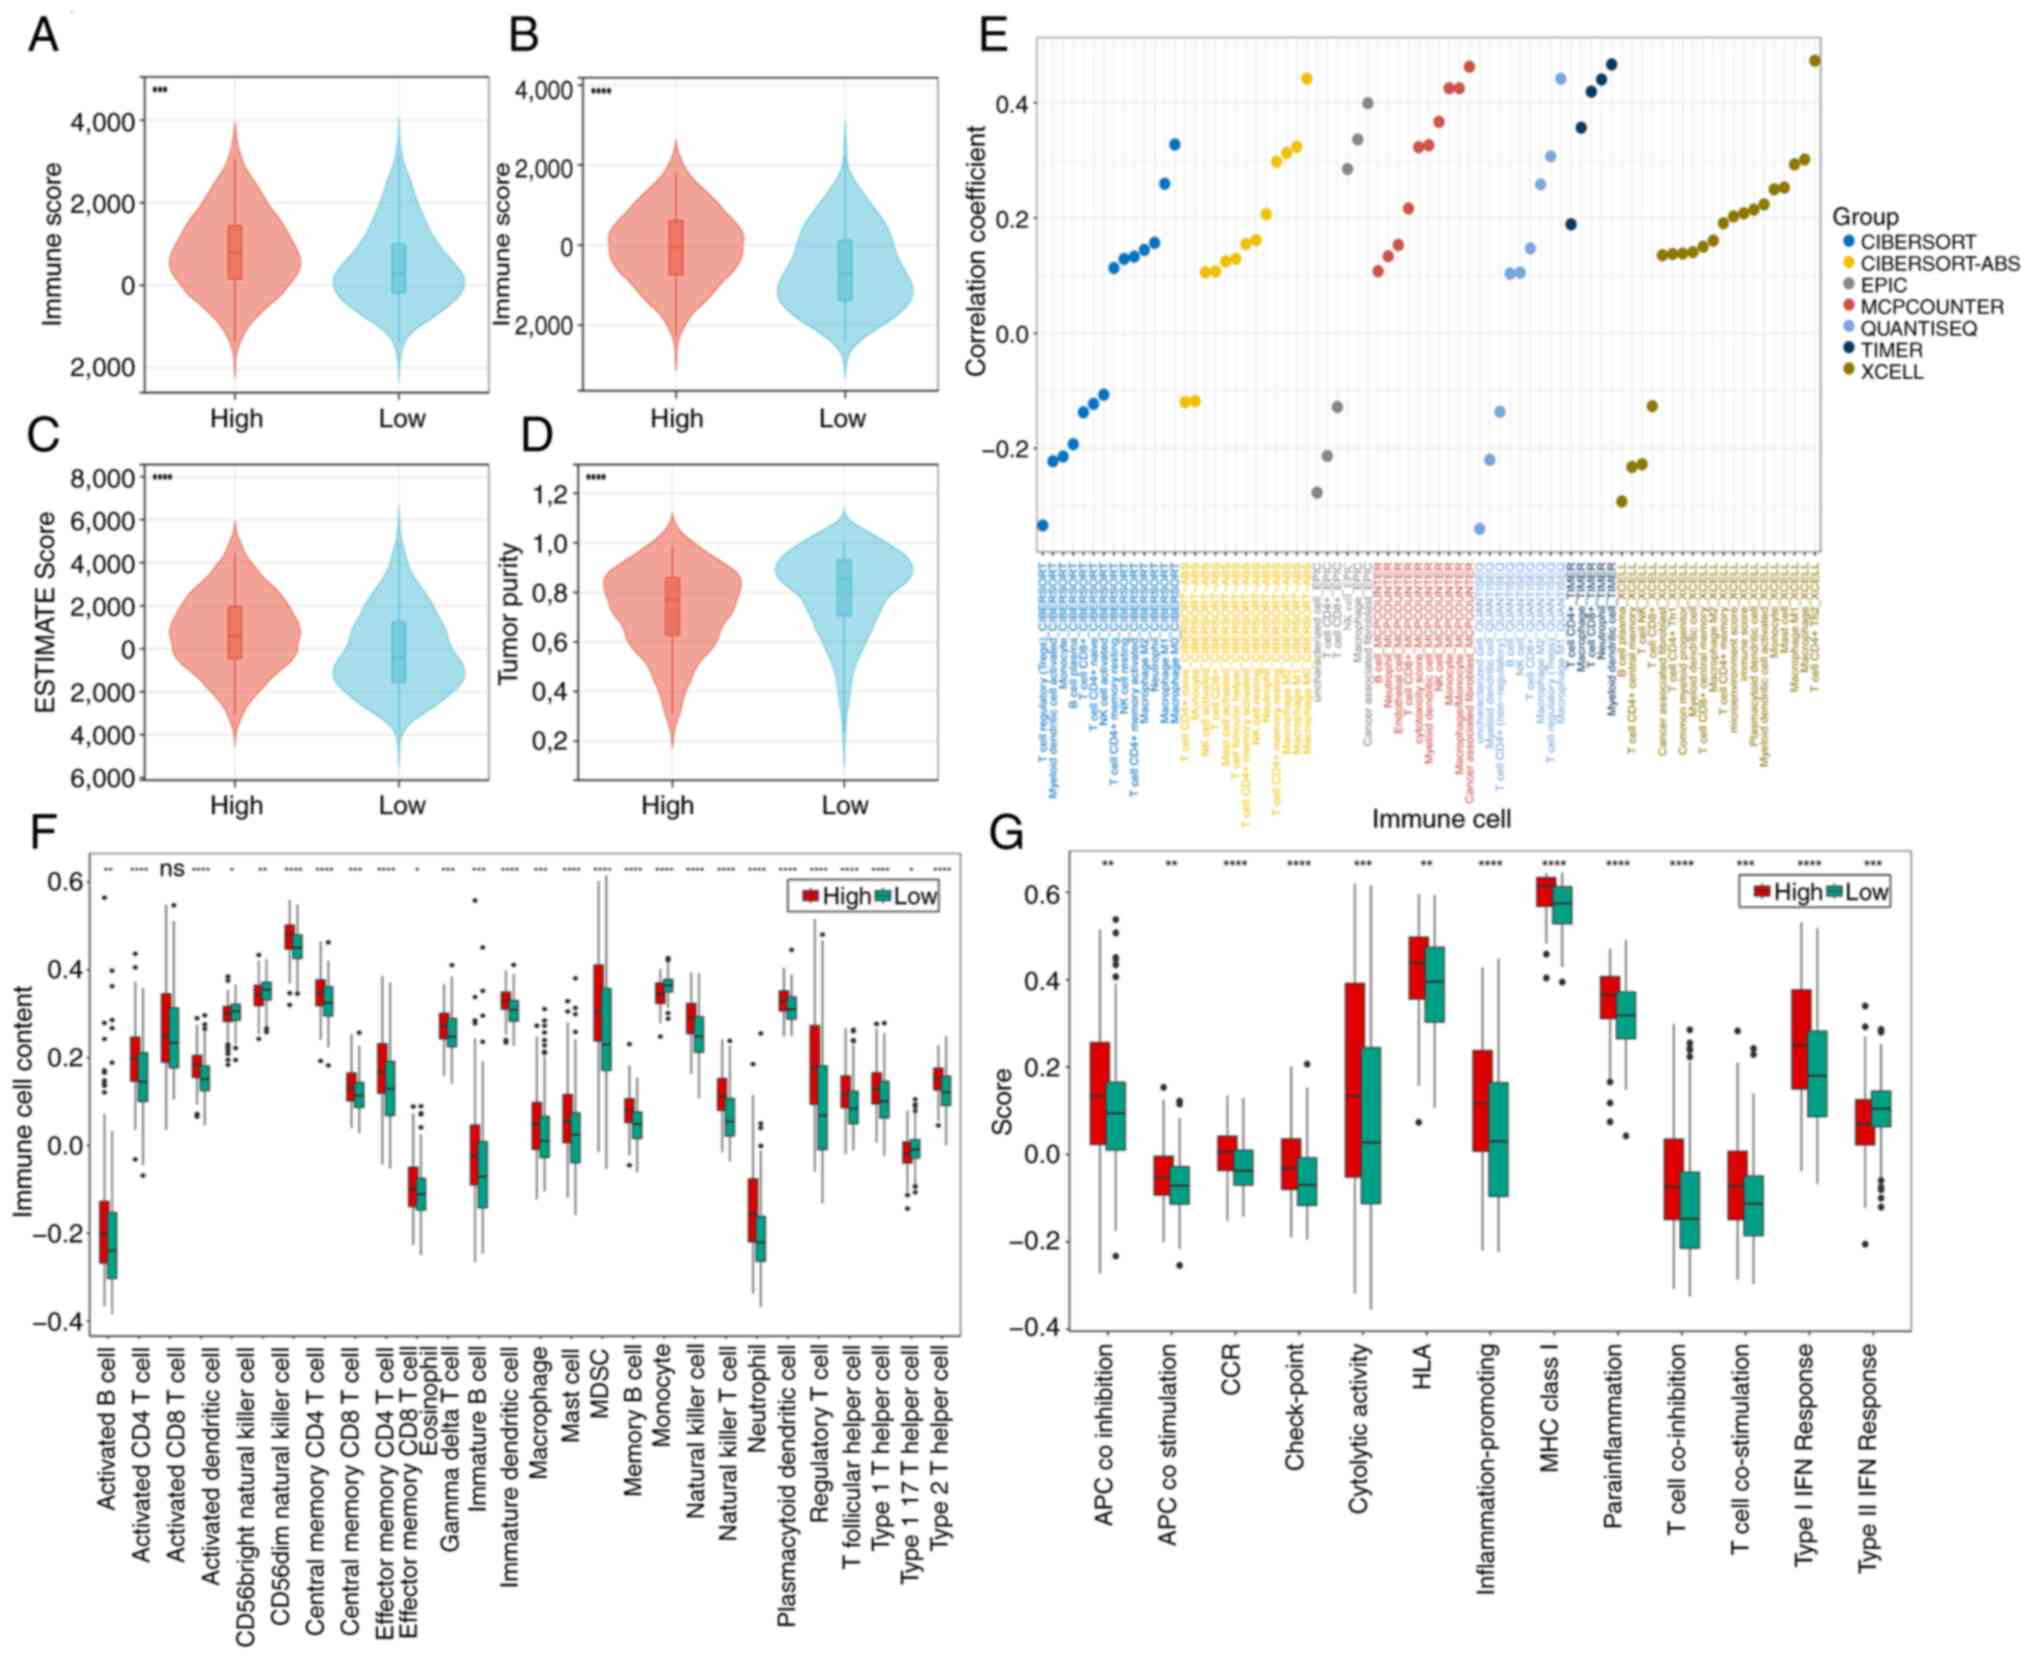
In the cohort of high-risk patients, elevated
stromal, immune and ESTIMATE scores were observed, alongside
diminished tumor purity scores (Fig.
8A-D). These findings suggest a potential link between the
unfavorable prognosis in high-risk patients and an
immunosuppressive microenvironment that facilitates tumor immune
evasion. The accompanying bubble chart delineates the associations
of risk scores with immune cell populations (Fig. 8E).
Increased immune cell infiltration was revealed in
high-risk patients, as discerned through ssGSEA analysis (Fig. 8F). Notably, immunosuppressive cell
subsets [including myeloid-derived suppressor cells (MDSCs), Th2
cells (type 2 T helper cells), and regulatory T cells (Tregs; T
follicular helper cells)] were significantly upregulated in the
high-risk group. CD56dim natural killer cells and monocytes were
more highly infiltrated in the low-risk group. For a comprehensive
understanding of the intricate interplay, the detailed immune cell
associations are presented in Fig.
S7A-D. Overall, the high-risk cohort consistently exhibited
augmented immune activity, as evidenced by the ssGSEA analysis of
immune-related functions (Fig.
8G). Except for Type II IFN response, which was expressed more
strongly in the low-risk group, the other 12 immune-related
functions (APC co inhibition, APC co-stimulation, CCR, check-point,
cytolytic activity, HLA, inflammation-promoting, MHC class I,
para-inflammation, T cell co-inhibition, T cell co-stimulation and
type I IFN response) were expressed more strongly in the high-risk
group.
The exploration of treatment
strategies for BLCA
In the exploration of therapeutic strategies for
BLCA, it has been discerned that low-risk patients exhibit
significantly lower TIDE scores, coupled with elevated
Microsatellite instability scores, while T cell dysfunction scores
remain relatively stable (Fig.
S8A-D). These empirical findings posit that low-risk patients
with BLCA may manifest reduced vulnerability to tumor immune
subversion, thereby potentially augmenting the efficacy of
immunotherapy.
Additionally, pharmaceutical agents to which
high-risk patients evince heightened sensitivity are listed in
Table SV, while drugs that
elicit augmented responsiveness in low-risk patients are presented
in Table SVI. The
pharmacological agents whose sensitivity remains largely unaltered
between the two patient cohorts are meticulously catalogued in
Table SVII. A summary of
antineoplastic drug target pathways is provided in Table SVIII. Noteworthy, compounds
targeting the PI3K/mTOR signaling pathway appear to exert a more
pronounced impact on high-risk populations, whereas those directed
at apoptosis regulation exhibit heightened efficacy against
low-risk populations.
Combined public data and in vitro
validation of the prognostic signature
HPA, the valuable resource for understanding protein
expression patterns, was meticulously explored to discern the
protein expression disparities between BLCA and normal samples
(Fig. S9). Analyzing DRGs protein
expression may reveal their role in BLCA, and abnormal expression
could serve as prognostic biomarkers or therapeutic targets. It was
found that the proteins encoded by NCKAP1, RAC1, SLC2A1 and SLC3A2
have higher expression levels in tumors, while the protein encoded
by WASF2 has higher expression levels in normal tissues. Survival
analysis from the HPA indicated that high expression of proteins
encoded by NCKAP1, RAC1, SLC2A1 and SLC3A2 is associated with a
poor 5-year survival rate in BLCA, whereas WASF2 expression was not
statistically significant. Detailed results are provided in
Table SIX.
The expression levels of DRlncRNAs in the SV-HUC-1
cell line, which represents a normal bladder epithelial cell line,
and the BLCA cell lines (T24 and 5637) were assessed using RT-qPCR
(Fig. S10). The results revealed
that ASMTL-AS1 expression is higher in the 5637 cell line compared
with the T24 cell line, while the expression levels of the other
seven genes do not show any statistically significant differences
(Fig. S10). Additionally, as
demonstrated in Fig. S11,
AL390719.2, ASMTL-AS1, AL031058.1 and LINC02438 were upregulated in
BLCA cell lines (T24 and 5637), whereas AC022613.2, RBMS3-AS3 and
AL122035.1 were downregulated. No significant difference in
expression was observed for LINC01788. In addition, to explore the
potential roles of DRGs in the two cell lines, bar charts of the
expression levels of DRGs in the two cell lines were obtained from
HPA. The results indicated that RAC1, SLC7A11 and WASF2 were
expressed higher in 5637 cells, while SLC2A1, NCKAP1 and SLC3A2
were expressed higher in T24 cells (Fig. S12).
Discussion
BLCA, the tenth most prevalent cancer worldwide, has
presented an escalating incidence across several nations (22). Despite concerted endeavors in BLCA
treatment, the 5-year survival rate remains disconcertingly low,
hovering around a mere 14 months (2). Advances in molecular biology and
deepening understanding of tumorigenesis have paved the way for
personalized medicine in BLCA (23). As a result, the pursuit of novel
biomarkers to improve patient prognosis prediction and advance BLCA
therapy has become critical.
The process of disulfidptosis, characterized by the
accumulation of disulfides and F-actin contraction, precipitates
tumor cell demise (24). In light
of this, DRlncRNAs have emerged as robust prognostic signatures for
BLCA. Further investigations into the underlying molecular
mechanisms and clinical applications are underway. The present data
unequivocally demonstrated that the risk score functions
independently as a potent prognostic indicator in patients with
BLCA, exhibiting commendable predictive efficacy. Notably, higher
risk scores correlate with poorer survival rates. The nomogram,
too, showcases remarkable predictive performance. The nomogram also
exhibits significant predictive performance, with the nomogram
incorporating the risk score (AUC=0.733) showing greater accuracy
compared with the nomogram without the risk score (AUC=0.703).
Enrichment analysis revealed significant activity in the cell
cycle, focal adhesion and the WNT signaling pathway among high-risk
patients, while those enriched in low-risk patients were
predominantly associated with substance metabolism. In addition,
low-risk patients exhibit elevated TMB values and lower TIDE
scores, hinting at improved outcomes with immunotherapy. There is
also a differential sensitivity to immunotherapy and chemotherapy
between the two risk groups.
Disulfidptosis, intricately linked to alterations in
intracellular redox status, profoundly impacts cytoskeletal
conformation, leading to tumor cell death (9). Prognostic signatures predicated upon
disulfidptosis have consistently demonstrated robust predictive
capabilities across diverse malignancies. Qi et al (25) validated the prognostic utility of a
disulfidptosis-based risk signature in lung adenocarcinoma
patients, yielding commendable results. Similarly, Wang et
al (26) devised a
disulfidptosis-related prognostic signature for predicting
hepatocellular carcinoma survival, achieving favorable
outcomes.
In the current investigation, transcriptomic data
from patients with BLCA within the TCGA cohort were meticulously
curated. Employing Pearson correlation tests and differential
analyses, distinctively expressed DRlncRNAs were discerned.
Subsequently, a training cohort was meticulously selected for
subsequent univariate and LASSO analyses, culminating in the
formulation of a robust prognostic signature that incorporates
these DRlncRNAs. The outcome results of the high- and low-risk
groups showed significant differences and vividly illustrate the
poor outcome in high-risk patients. PCA emphasizes that prognostic
signature has superior discriminative accuracy in distinguishing
between two high-risk patient groups. Noteworthy, constituents of
this signature include ASMTL-AS1, which orchestrates the release of
miR-660 and miR-93-3p, thereby augmenting FOXO1 gene expression and
effectively suppressing glycolysis and tumorigenesis (27). In the context of prostate cancer
cells, overexpression of RBMS3-AS3 impedes cell proliferation and
tumorigenesis (28). Furthermore,
heightened expression of AL390719.2 in primary CRC is closely
associated with an unfavorable prognosis, particularly in patients
with CRC harboring KRAS mutations (29). However, the molecular functions of
other lncRNAs in various cancers still need to be elucidated. In
summary, our prognostic signature, comprising eight DRlncRNAs,
emerges as a dependable tool for prognostic prediction in patients
with BLCA. Finally, RT-qPCR experiments confirmed the significant
differential expression of the seven DRlncRNAs in normal vs. cancer
tissues.
In our efforts to elucidate relevant mechanisms,
GSEA and TMB analyses were performed. Notably, the cell cycle,
focal adhesion and WNT signaling pathways demonstrated significant
enrichment in high-risk patients. Dysregulation of cell cycle
checkpoints often leads to uncontrolled proliferation in cancer
cells (30). Focal adhesion, a
pivotal process integrating the extracellular matrix and cellular
components, plays a significant role in tumor metastasis and
invasion (31). For instance,
upregulation of CircNIPBL can activate the WNT/β-catenin pathway,
thereby inducing migration and invasion in BLCA (32). The observed inferior prognosis
among high-risk patients may be attributed to the activation of
these pathways. Those enriched in low-risk patients were
predominantly associated with substance metabolism. Furthermore, an
elevated TMB value was discerned in the low-risk group.
A comprehensive literature search revealed that high
TMB in patients with BLCA who do not undergo immunotherapy
correlates with prolonged OS and a favorable prognosis (33). Moreover, patients with high TMB
BLCA generally exhibit more favorable outcomes when treated with
immunotherapy, specifically anti-programmed cell death protein 1
therapy (34). It was posited that
immunotherapy holds promise for achieving superior outcomes in the
low-risk population. Among the high-risk group, the four most
commonly mutated genes were TP53 (56%), TTN (44%), ARID1A (27%) and
KMT2D (25%). TP53 mutations are common in BLCA, and TP53 function
is impaired in 76% of cases, driving the progress of BLCA,
affecting the prognosis and guiding the treatment (35). TTN is a common mutated gene in BLCA
and can be used as a biomarker for predicting immune responses
(36). ARID1A mutation is a
truncal driven mutation that forms the basis for the development of
a subgroup of urothelial carcinoma. When combined with other
driving mutations, it leads to dysregulation of numerous key
cellular processes (37). KMT2D
mutations can lead to dysregulation of gene expression, thereby
promoting tumor development, and its truncation mutations may serve
as potential biomarkers for stratification of patients with BLCA
(38).
Typically, lncRNAs are detected using RT-qPCR, RNA
sequencing (RNA-seq), and in situ hybridization (ISH)
(39). RT-qPCR is widely used in
clinical settings due to its high sensitivity and specificity,
while RNA-seq provides comprehensive lncRNA profiling and is
increasingly integrated into clinical diagnostics, although its
primary use remains in research. ISH enables the localization of
lncRNAs within tissues, offering spatial context to their
expression. In the present study, RT-qPCR was employed to precisely
detect and quantify DRlncRNAs, with raw expression data normalized
through established bioinformatics pipelines to reduce technical
variability and ensure cross-sample comparability. The lncRNA
signature developed in the present study facilitates effective risk
stratification, classifying patients into high- and low-risk groups
based on calculated risk scores, thereby guiding personalized
therapeutic decisions. Additionally, combining the lncRNA signature
with traditional clinical parameters, such as tumor stage and
grade, significantly enhances the predictive accuracy of the model,
providing a robust framework for prognosticating clinical outcomes
in bladder cancer patients.
The current investigation has extended into the
pivotal role of our distinctive signature in shaping both
immunotherapeutic and chemotherapeutic strategies. Existing
research has emphasized that MDSCs, triggered by transcription
factors (NF-κB, STAT1, STAT3 and STAT6), impede T cell
proliferation and induce an elevation in Tregs (40). Tregs infiltrating the tumor hinder
the cytotoxic effect of CD8+ T cells on tumors by
expressing CTLA-4 and competitively binding IL-2, thus fostering
immune evasion within the TME (41). Additionally, Th2 cells, through the
secretion of cytokines (such as IL-4 and IL-10), attenuate the
immune response and promote tumor growth (42). The increased presence of these
cells in high-risk populations may partially explain the
unfavorable prognosis, providing valuable insights for
immunotherapy strategies. CD56dim natural killer cells and
monocytes were more highly infiltrated in the low-risk group.
Furthermore, a decline in TIDE scores among low-risk patients
indicates heightened immunotherapy efficacy (20). Consequently, it is advocated
considering immunotherapy for patients at low risk. Notably,
analyzing drug sensitivity offers essential guidance for clinical
drug selection in patients with BLCA. By calculating and grouping
risk scores, our risk scoring model can guide personalized drug
therapy for patients with BLCA. High-risk patients exhibit
increased responsiveness to medications targeting the PI3K/mTOR
pathway, which is highly activated in BLCA and contributes to
disease progression (43). For
instance, AZD8186, as a PI3K β/δ inhibitor, which exhibits
significant sensitivity in high-risk group. This heightened
sensitivity in high-risk patients may be elucidated by the observed
association. Moreover, patients with low risk demonstrate increased
responsiveness to medications targeting the apoptosis regulation
pathway. Targeting the apoptotic pathway of tumor cells represents
a potent anticancer strategy, less likely to result in tumor
recurrence. Several drugs directly targeting the intrinsic
apoptotic pathway have received approval (44), reinforcing the inherent capability
of our signature to guide clinical patients with BLCA in
antineoplastic drug selection.
The present study exhibits several notable
strengths. To bolster the scientific credibility of the current
findings, the results were meticulously compared with those of
similar studies. Compared with other similar models in the same
industry, the present study has high accuracy in predicting patient
prognosis. Unlike the DRlncRNA signature proposed by Sun et
al (45), which underwent
validation solely in the test group, our signature underwent
rigorous validation across the entire cohort, rendering the results
more universally applicable. Furthermore, compared with Lu et
al (46), the present
investigation was extended by incorporating TMB analysis to enhance
the scientific robustness of our DRlncRNAs' signature, which
already demonstrated commendable predictive value in patients with
BLCA. Finally, the use of cell lines to validate DRlncRNAs reduced
external interference and demonstrated significant expression
differences. However, it is imperative to acknowledge the
limitations inherent in the present study. Notably, the absence of
further experiments exploring the functional roles of the DRlncRNAs
within our signature constitutes a significant limitation.
Additionally, the data utilized in the present study originates
from the TCGA database rather than proprietary sources, potentially
introducing inherent deviations. Consequently, future
investigations, encompassing further in vitro or in
vivo validated and clinical trials, remain essential to
validate and refine the current findings. Future in vitro
validation studies should include western blotting to quantify the
levels of DRlncRNAs expression and corresponding protein markers in
bladder cancer cell lines, and gene knockout/overexpression by
utilizing RNA interference or CRISPR/Cas9 technology to
downregulate or upregulate the expression of selected DRlncRNAs.
Subsequently, to assess cell behavior, including proliferation,
migration and apoptosis. To confirm in vitro findings, in
vivo verification should be performed using animal models, such
as xenotransplantation model (implanting bladder cancer cell lines
with altered DRlncRNAs expression into immunodeficient mice to
evaluate tumor growth and metastasis).
In conclusion, the present study has successfully
established a prognostic risk scoring signature based on DRlncRNAs.
The nomogram, incorporating risk scores and clinical
characteristics, demonstrates significant predictive capability.
Mechanistic analysis revealed that high-risk populations are
enriched in the cell cycle, focal adhesion and WNT signaling
pathways, while the low-risk subgroup shows elevated TMB levels and
reduced TIDE scores, suggesting a more favorable response to
immunotherapy. Drug sensitivity predictions indicate that targeting
the PI3K/mTOR pathway offers greater efficacy for high-risk
patients. Nevertheless, the limitations of the present study are
acknowledged and the need for further validation through extensive
basic and clinical research is emphasized.
Supplementary Material
(A) The circle plot of correlation
among 8 DRlncRNAs. (B) Deviation plots depicting variations in the
upregulation and downregulation of eight DRlncRNAs. (C) Sankey
diagram of 8 DRlncRNAs with disulfidptosis-related genes.
DRlncRNAs, disulfidptosis-related long non-coding RNAs.
Verification of signature prediction
performance of the training group, test group and the entire group.
(A-C) Curve plot of risk score, scatter plot of survival time, and
heat map of expression values for 8 disulfidptosis-related long
non-coding RNAs. (D-F) Visual representation of patients’ risk
scores across various survival statuses by scatterplot.
Additional validation of signature
impacts. (A) Heat maps of 8 disulfidptosis-related long non-coding
RNAs and clinical information. (B-E) Scatter plot analysis of risk
score for patients with different clinical information.
Nomogram with patient
verification.
(A) Bar and (B) circle diagrams for
KEGG enrichment analysis. KEGG, Kyoto Encyclopedia of Genes and
Genomes.
Gene set enrichment analysis. (A-C)
High and (D) low risk group enrichment pathway in different gene
sets. KEGG, Kyoto Encyclopedia of Genes and Genomes; GOBP, Gene
Ontology Biological Process.
(A-D) Scatter plot of the correlation
between 28 immune cells and risk score.
Efficacy evaluation of immunotherapy
based on our signature. (A-D) Differences in (A) TIDE, (B)
dysfunction, (C) exclusion and (D) microsatellite instability
scores among different risk groups. ***P<0.001 and
****P<0.0001. TIDE, tumor immune dysfunction and
exclusion; ns, not significant (P>0.05).
Immunohistochemical staining images of
portion disulfidptosis-related proteins in BLCA tissues and normal
tissues. BLCA, bladder cancer.
(A-H) Expression levels and
differences of 8 disulfidptosis-related long non-coding RNAs
between different groups. *P<0.05 and
**P<0.01. ns, not significant (P>0.05).
Expression levels and differences of 8
disulfidptosis-related long non-coding RNAs in normal bladder
epithelial cell lines and BLCA cell lines (T24 and 5637 BLCA cell
lines). *P<0.05 and ***P<0.001. BLCA,
bladder cancer; ns, not significant (P>0.05).
Bar charts of the expression levels of
disulfidptosis-related genes in two cell lines from the Human
Protein Atlas database.
Primers for reverse transcription
quantitative experiments with 8 disulfidptosis-related long
non-coding RNAs.
A total of 14 differentially expressed
disulfidptosis-related lncRNAs.
A total of 8 differentially expressed
disulfidptosis-related lncRNAs.
Gene set enrichment analysis pathways
for different risk groups.
Antineoplastic drug sensitivity
information (sensitive group: High-risk).
Antineoplastic drug sensitivity
information (sensitive group: Low-risk).
Antineoplastic drug sensitivity
information (no obviously sensitive group).
Summary of antineoplastic drug target
pathways.
Survival analysis from the Human
Protein Atlas database.
Acknowledgements
The authors would like to thank professor Yiping Wei
(Department of Thoracic Surgery, The Second Affiliated Hospital of
Nanchang University) for his statistical advice.
Funding
Funding: The present study was supported by the National Natural
Science Foundation of China (grant no. 81560345).
Availability of data and materials
The data generated in the present study may be
requested from the corresponding author.
Authors' contributions
WZ had full access to all the data in the manuscript
and takes responsibility for the integrity of the data and the
accuracy of the data analysis. YL, HT, SJ, HW, LG, ZH, FL and WZ
conceived and designed the study, and acquired, analysed, or
interpreted data. YL, HT, SJ and HW performed experiments. YL, HT,
SJ and WZ performed statistical analysis. YL, HT and WZ drafted the
manuscript. YL, HT, WZ and FL supervised the study and critically
revised the manuscript for important intellectual content. All
authors read and approved the final version of the manuscript. YL
and HT confirm the authenticity of all the raw data used in the
present study and guarantee that the data has not been forged or
tampered with. It is ensured that all data are actually obtained in
the experiment and accurately reflect the experimental results.
Ethics approval and consent to
participate
Not applicable.
Patient consent for publication
Not applicable.
Competing interests
The authors declare that they have no competing
interests.
References
|
1
|
Siegel RL, Giaquinto AN and Jemal A:
Cancer statistics, 2024. CA Cancer J Clin. 74:12–49.
2024.PubMed/NCBI View Article : Google Scholar
|
|
2
|
Witjes JA, Bruins HM, Cathomas R, Compérat
EM, Cowan NC, Gakis G, Hernández V, Linares Espinós E, Lorch A,
Neuzillet Y, et al: European association of urology guidelines on
muscle-invasive and metastatic bladder cancer: Summary of the 2020
guidelines. Eur Urol. 79:82–104. 2021.PubMed/NCBI View Article : Google Scholar
|
|
3
|
Tran L, Xiao JF, Agarwal N, Duex JE and
Theodorescu D: Advances in bladder cancer biology and therapy. Nat
Rev Cancer. 21:104–121. 2021.PubMed/NCBI View Article : Google Scholar
|
|
4
|
Liu X, Nie L, Zhang Y, Yan Y, Wang C,
Colic M, Olszewski K, Horbath A, Chen X, Lei G, et al: Actin
cytoskeleton vulnerability to disulfide stress mediates
disulfidptosis. Nat Cell Biol. 25:404–414. 2023.PubMed/NCBI View Article : Google Scholar
|
|
5
|
Meng Y, Chen X and Deng G: Disulfidptosis:
A new form of regulated cell death for cancer treatment. Mol
Biomed. 4(18)2023.PubMed/NCBI View Article : Google Scholar
|
|
6
|
Esteller M: Non-coding RNAs in human
disease. Nat Rev Genet. 12:861–874. 2011.PubMed/NCBI View
Article : Google Scholar
|
|
7
|
Fang Y and Fullwood MJ: Roles, functions,
and mechanisms of long non-coding RNAs in cancer. Genomics
Proteomics Bioinformatics. 14:42–54. 2016.PubMed/NCBI View Article : Google Scholar
|
|
8
|
Tan YT, Lin JF, Li T, Li JJ, Xu RH and Ju
HQ: LncRNA-mediated posttranslational modifications and
reprogramming of energy metabolism in cancer. Cancer Commun (Lond).
41:109–120. 2021.PubMed/NCBI View Article : Google Scholar
|
|
9
|
Liu Z, Liu L, Weng S, Guo C, Dang Q, Xu H,
Wang L, Lu T, Zhang Y, Sun Z and Han X: Machine learning-based
integration develops an immune-derived lncRNA signature for
improving outcomes in colorectal cancer. Nat Commun.
13(816)2022.PubMed/NCBI View Article : Google Scholar
|
|
10
|
Liang YL, Zhang Y, Tan XR, Qiao H, Liu SR,
Tang LL, Mao YP, Chen L, Li WF, Zhou GQ, et al: A lncRNA signature
associated with tumor immune heterogeneity predicts distant
metastasis in locoregionally advanced nasopharyngeal carcinoma. Nat
Commun. 13(2996)2022.PubMed/NCBI View Article : Google Scholar
|
|
11
|
Huang Z, Zhou JK, Peng Y, He W and Huang
C: The role of long noncoding RNAs in hepatocellular carcinoma. Mol
Cancer. 19(77)2020.PubMed/NCBI View Article : Google Scholar
|
|
12
|
Hutter C and Zenklusen JC: The cancer
genome atlas: Creating lasting value beyond its data. Cell.
173:283–285. 2018.PubMed/NCBI View Article : Google Scholar
|
|
13
|
Love MI, Huber W and Anders S: Moderated
estimation of fold change and dispersion for RNA-seq data with
DESeq2. Genome Biol. 15(550)2014.PubMed/NCBI View Article : Google Scholar
|
|
14
|
Duforet-Frebourg N, Luu K, Laval G, Bazin
E and Blum MGB: Detecting genomic signatures of natural selection
with principal component analysis: Application to the 1000 genomes
data. Mol Biol Evol. 33:1082–1093. 2016.PubMed/NCBI View Article : Google Scholar
|
|
15
|
Liu L, Xie J, Wu W, Chen H, Li S, He H, Yu
Y, Hu M, Li J, Zheng R, et al: A simple nomogram for predicting
failure of non-invasive respiratory strategies in adults with
COVID-19: A retrospective multicentre study. Lancet Digit Health.
3:e166–e174. 2021.PubMed/NCBI View Article : Google Scholar
|
|
16
|
Reimand J, Isserlin R, Voisin V, Kucera M,
Tannus-Lopes C, Rostamianfar A, Wadi L, Meyer M, Wong J, Xu C, et
al: Pathway enrichment analysis and visualization of omics data
using g:Profiler, GSEA, Cytoscape and EnrichmentMap. Nat Protoc.
14:482–517. 2019.PubMed/NCBI View Article : Google Scholar
|
|
17
|
Mayakonda A, Lin DC, Assenov Y, Plass C
and Koeffler HP: Maftools: Efficient and comprehensive analysis of
somatic variants in cancer. Genome Res. 28:1747–1756.
2018.PubMed/NCBI View Article : Google Scholar
|
|
18
|
Li T, Fu J, Zeng Z, Cohen D, Li J, Chen Q,
Li B and Liu XS: TIMER2.0 for analysis of tumor-infiltrating immune
cells. Nucleic Acids Res. 48 (W1):W509–W514. 2020.PubMed/NCBI View Article : Google Scholar
|
|
19
|
Jiang P, Gu S, Pan D, Fu J, Sahu A, Hu X,
Li Z, Traugh N, Bu X, Li B, et al: Signatures of T cell dysfunction
and exclusion predict cancer immunotherapy response. Nat Med.
24:1550–1558. 2018.PubMed/NCBI View Article : Google Scholar
|
|
20
|
Maeser D, Gruener RF and Huang RS:
oncoPredict: An R package for predicting in vivo or cancer patient
drug response and biomarkers from cell line screening data. Brief
Bioinform. 22(bbab260)2021.PubMed/NCBI View Article : Google Scholar
|
|
21
|
Livak KJ and Schmittgen TD: Analysis of
relative gene expression data using real-time quantitative PCR and
the 2(-Delta Delta C(T)) method. Methods. 25:402–408.
2001.PubMed/NCBI View Article : Google Scholar
|
|
22
|
Sung H, Ferlay J, Siegel RL, Laversanne M,
Soerjomataram I, Jemal A and Bray F: Global cancer statistics 2020:
GLOBOCAN estimates of incidence and mortality worldwide for 36
cancers in 185 countries. CA Cancer J Clin. 71:209–249.
2021.PubMed/NCBI View Article : Google Scholar
|
|
23
|
Dobruch J and Oszczudłowski M: Bladder
cancer: Current challenges and future directions. Medicina
(Kaunas). 57(749)2021.PubMed/NCBI View Article : Google Scholar
|
|
24
|
Zheng P, Zhou C, Ding Y and Duan S:
Disulfidptosis: A new target for metabolic cancer therapy. J Exp
Clin Cancer Res. 42(103)2023.PubMed/NCBI View Article : Google Scholar
|
|
25
|
Qi C, Ma J, Sun J, Wu X and Ding J: The
role of molecular subtypes and immune infiltration characteristics
based on disulfidptosis-associated genes in lung adenocarcinoma.
Aging (Albany NY). 15:5075–5095. 2023.PubMed/NCBI View Article : Google Scholar
|
|
26
|
Wang T, Guo K, Zhang D, Wang H, Yin J, Cui
H and Wu W: Disulfidptosis classification of hepatocellular
carcinoma reveals correlation with clinical prognosis and immune
profile. Int Immunopharmacol. 120(110368)2023.PubMed/NCBI View Article : Google Scholar
|
|
27
|
Feng Z, Chen R, Huang N and Luo C: Long
non-coding RNA ASMTL-AS1 inhibits tumor growth and glycolysis by
regulating the miR-93-3p/miR-660/FOXO1 axis in papillary thyroid
carcinoma. Life Sci. 244(117298)2020.PubMed/NCBI View Article : Google Scholar
|
|
28
|
Jiang Z, Zhang Y, Chen X, Wu P and Chen D:
Long noncoding RNA RBMS3-AS3 acts as a microRNA-4534 sponge to
inhibit the progression of prostate cancer by upregulating VASH1.
Gene Ther. 27:143–156. 2020.PubMed/NCBI View Article : Google Scholar
|
|
29
|
Xu J, Huang QY and Ge CJ: Identification
of prognostic long intergenic non-coding RNAs as competing
endogenous RNAs with KRAS mutations in colorectal cancer. Oncol
Lett. 22(717)2021.PubMed/NCBI View Article : Google Scholar
|
|
30
|
Kar S: Unraveling cell-cycle dynamics in
cancer. Cell Syst. 2:8–10. 2016.PubMed/NCBI View Article : Google Scholar
|
|
31
|
Lin X, Zhuang S, Chen X, Du J, Zhong L,
Ding J, Wang L, Yi J, Hu G, Tang G, et al: lncRNA ITGB8-AS1
functions as a ceRNA to promote colorectal cancer growth and
migration through integrin-mediated focal adhesion signaling. Mol
Ther. 30:688–702. 2022.PubMed/NCBI View Article : Google Scholar
|
|
32
|
Li Y, Kong Y, An M, Luo Y, Zheng H, Lin Y,
Chen J, Yang J, Liu L, Luo B, et al: ZEB1-mediated biogenesis of
circNIPBL sustains the metastasis of bladder cancer via
Wnt/β-catenin pathway. J Exp Clin Cancer Res.
42(191)2023.PubMed/NCBI View Article : Google Scholar
|
|
33
|
Valero C, Lee M, Hoen D, Wang J, Nadeem Z,
Patel N, Postow MA, Shoushtari AN, Plitas G, Balachandran VP, et
al: The association between tumor mutational burden and prognosis
is dependent on treatment context. Nat Genet. 53:11–15.
2021.PubMed/NCBI View Article : Google Scholar
|
|
34
|
McGrail DJ, Pilié PG, Rashid NU, Voorwerk
L, Slagter M, Kok M, Jonasch E, Khasraw M, Heimberger AB, Lim B, et
al: High tumor mutation burden fails to predict immune checkpoint
blockade response across all cancer types. Ann Oncol. 32:661–672.
2021.PubMed/NCBI View Article : Google Scholar
|
|
35
|
Lyu Q, Lin A, Cao M, Xu A, Luo P and Zhang
J: Alterations in TP53 are a potential biomarker of bladder cancer
patients who benefit from immune checkpoint inhibition. Cancer
Control. 27(1073274820976665)2020.PubMed/NCBI View Article : Google Scholar
|
|
36
|
Zhou Z, Zhou Y, Liu W and Dai J: A novel
cuproptosis-related lncRNAs signature predicts prognostic and
immune of bladder urothelial carcinoma. Front Genet.
14(1148430)2023.PubMed/NCBI View Article : Google Scholar
|
|
37
|
Conde M and Frew IJ: Therapeutic
significance of ARID1A mutation in bladder cancer. Neoplasia.
31(100814)2022.PubMed/NCBI View Article : Google Scholar
|
|
38
|
Zhao Z, Aoi Y, Philips CN, Meghani KA,
Gold SR, Yu Y, John LS, Qian J, Zeidner JM, Meeks JJ and
Shilatifard A: Somatic mutations of MLL4/COMPASS induce cytoplasmic
localization providing molecular insight into cancer prognosis and
treatment. Proc Natl Acad Sci USA. 120(e2310063120)2023.PubMed/NCBI View Article : Google Scholar
|
|
39
|
Ulitsky I and Bartel DP: lincRNAs:
Genomics, evolution, and mechanisms. Cell. 154:26–46.
2013.PubMed/NCBI View Article : Google Scholar
|
|
40
|
Liang T, Tao T, Wu K, Liu L, Xu W, Zhou D,
Fang H, Ding Q, Huang G and Wu S: Cancer-associated
fibroblast-induced remodeling of tumor microenvironment in
recurrent bladder cancer. Adv Sci (Weinh).
10(e2303230)2023.PubMed/NCBI View Article : Google Scholar
|
|
41
|
Noyes D, Bag A, Oseni S, Semidey-Hurtado
J, Cen L, Sarnaik AA, Sondak VK and Adeegbe D: Tumor-associated
Tregs obstruct antitumor immunity by promoting T cell dysfunction
and restricting clonal diversity in tumor-infiltrating CD8+ T
cells. J Immunother Cancer. 10(e004605)2022.PubMed/NCBI View Article : Google Scholar
|
|
42
|
Yang MW, Tao LY, Jiang YS, Yang JY, Huo
YM, Liu DJ, Li J, Fu XL, He R, Lin C, et al: Perineural invasion
reprograms the immune microenvironment through cholinergic
signaling in pancreatic ductal adenocarcinoma. Cancer Res.
80:1991–2003. 2020.PubMed/NCBI View Article : Google Scholar
|
|
43
|
Meeks JJ and Lerner SP: Molecular
landscape of non-muscle invasive bladder cancer. Cancer Cell.
32:550–551. 2017.PubMed/NCBI View Article : Google Scholar
|
|
44
|
Carneiro BA and El-Deiry WS: Targeting
apoptosis in cancer therapy. Nat Rev Clin Oncol. 17:395–417.
2020.PubMed/NCBI View Article : Google Scholar
|
|
45
|
Sun Z, Wang J, Fan Z, Yang Y, Meng X, Ma
Z, Niu J, Guo R, Tran LJ, Zhang J, et al: Investigating the
prognostic role of lncRNAs associated with disulfidptosis-related
genes in clear cell renal cell carcinoma. J Gene Med.
26(e3608)2024.PubMed/NCBI View Article : Google Scholar
|
|
46
|
Lu H, Wu J, Liang L, Wang X and Cai H:
Identifying a novel defined pyroptosis-associated long noncoding
RNA signature contributes to predicting prognosis and tumor
microenvironment of bladder cancer. Front Immunol.
13(803355)2022.PubMed/NCBI View Article : Google Scholar
|


